
Abstract
In-plane fiber waviness is one of the defects that can occur from the stamp-forming process of thermoplastic composite (TPC) parts. The influence of this defect on the mechanical performance of multidirectional composites is not yet fully understood. The main challenge in determining the influence on mechanical properties lies in reproducing the waviness in test coupons that can subsequently be subjected to testing. This paper describes an experimental approach to reproduce representative in-plane waviness defects, specific for TPC, by reverse-forming of V-shape parts of various bend angles and inner radii. Characterization results show that this method enables the manufacturing of localized in-plane waviness in flat 24-ply quasi-isotropic C/PEEK composites with no voids. Furthermore, laminates having varying levels of maximum waviness angle (
Introduction
Thermoplastic composites (TPCs) are increasingly applied by the aerospace industry due to their high stiffness and strength to weight ratio, recyclability, and potential for rapid high-volume manufacturing. One manufacturing technique that is ideally suited for large volume production of TPCs is the stamp forming process. The three main deformation mechanisms occurring in the forming process of composites are the intra-ply shearing, out-of-plane bending and inter-ply slippage. 1 Defects, such as in-plane fiber waviness (see Figure 1), may occur when the necessary deformation mechanism to allow the material to conform to the desired shape is inhibited. Parts with such defects are designed with a high safety factor, or even rejected, due to the uncertainty as the influence of the waviness on the mechanical performance of multidirectional composites is not yet fully understood. Earlier studies on the lamina level (unidirectional) indicate that the presence of fiber waviness can cause a significant reduction in the compressive strength due to early kinking failure.2–6 The compressive strength is often a limiting design factor of composite materials for aircraft structures, as this is typically much lower than the tensile strength. 2 For (multidirectional) laminates, there is no single dominant failure mode that is applicable for all types of laminates. Possible dominant failure modes that have been reported in the literature for thermoset-based laminates are fiber kinking and delamination.7–10 The occurrence of the failure mode seems to be dependent on the severity of waviness 7 and the stacking sequence. 10 The mechanisms leading to failure have not yet been identified particularly for thermoplastic composites laminates. The inherent toughness of thermoplastics may affect the occurrence of the dominant failure mode. Thus, to be able to apply optimum design procedures for TPC parts, a proper understanding of the failure mechanisms and quantitative data of the compressive strength is essential. Both these factors entail an experimental study with waviness that is representative of the typical defects found from the production of TPC parts.
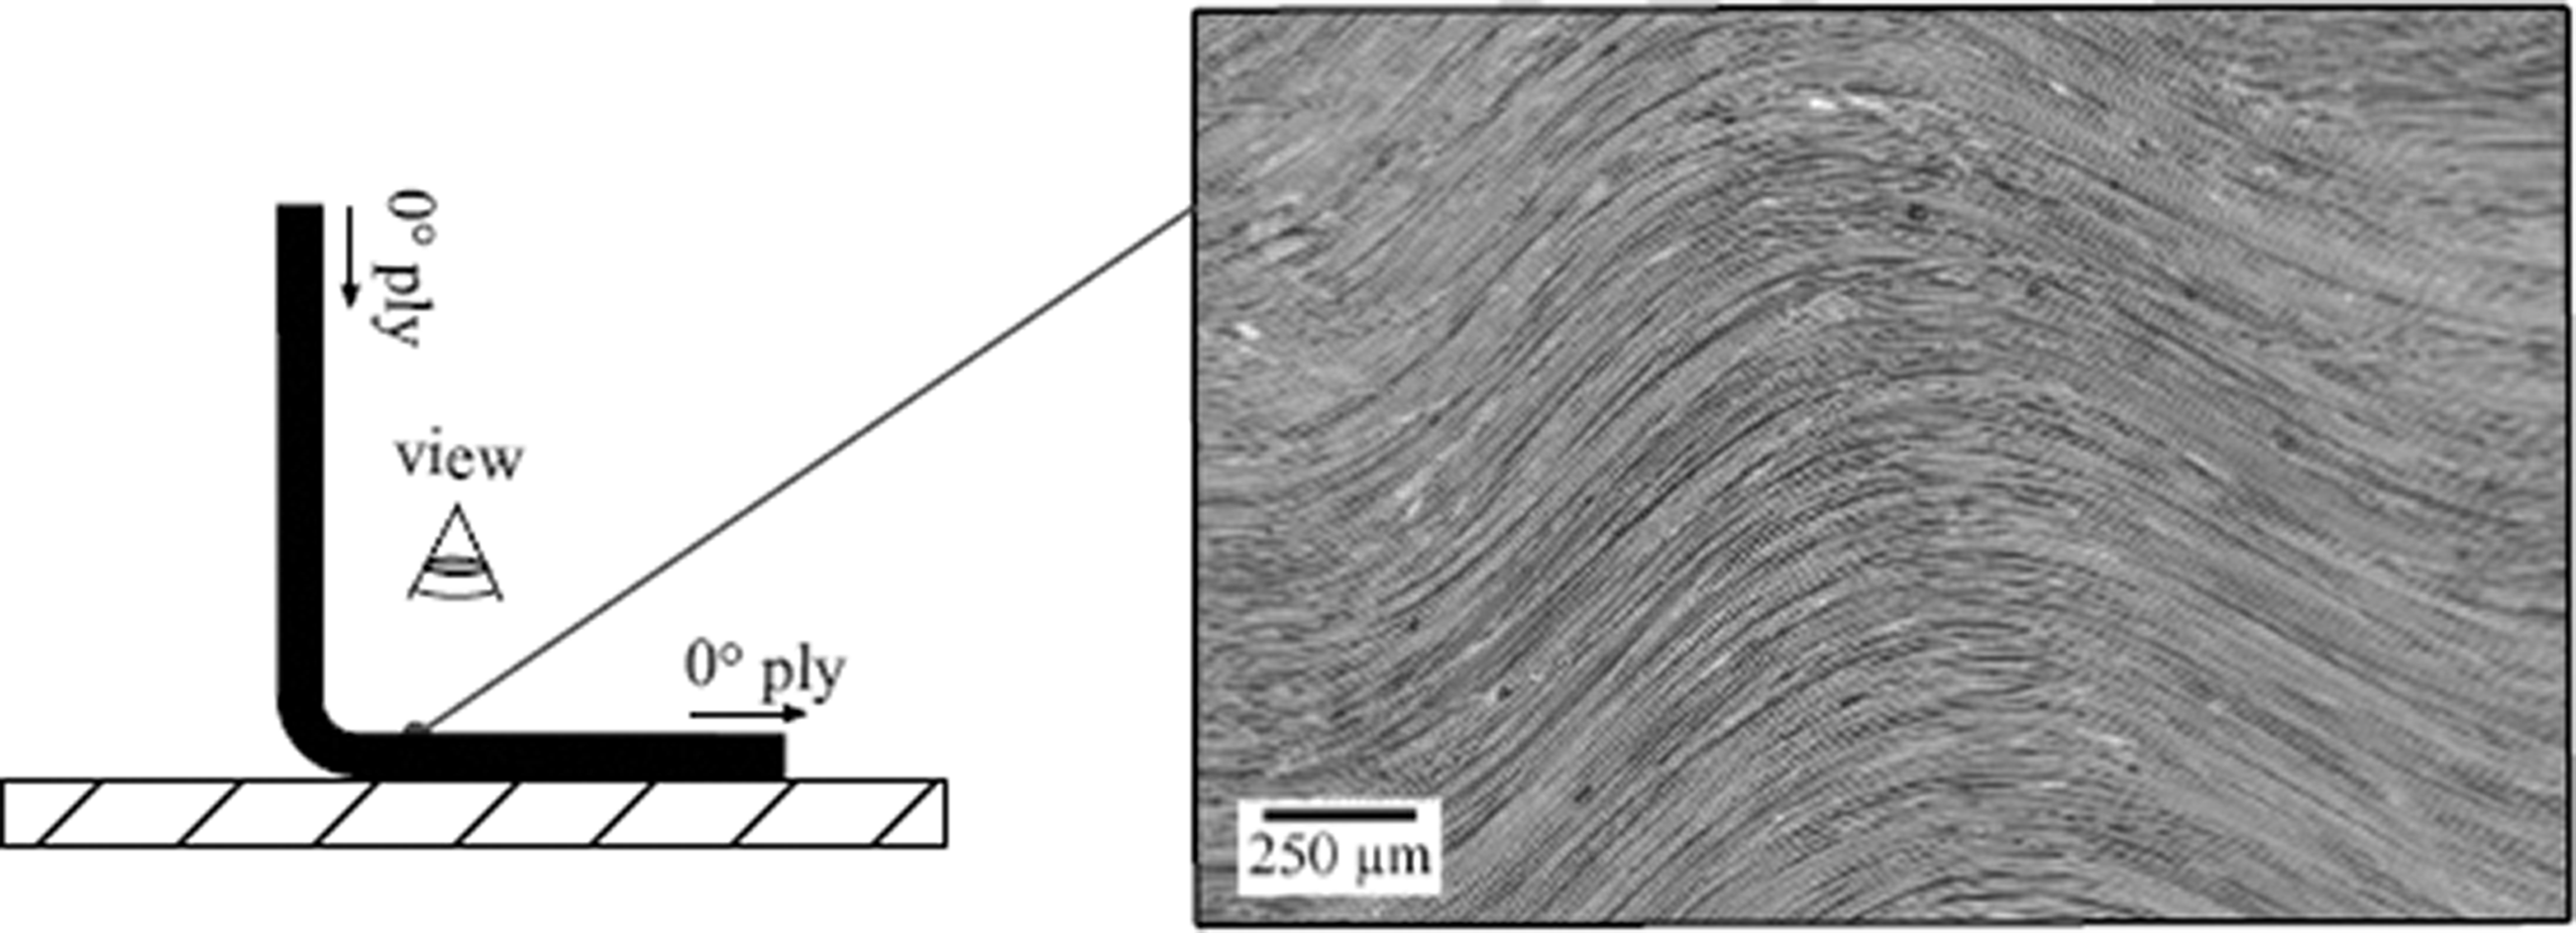
In-plane waviness defects observed in the concave side of a stamp-formed L-shaped part.
The waviness defects in thermoplastic composite parts are typically visible on the laminate surface (see Figure 1). Upon further investigation by the authors of this paper, it was found that the in-plane waviness can extend to several plies underneath the surface plies, depending on the processing technique and parameters, the geometry, and also the layup. Some examples of the stamp forming processing parameters that may affect the extent of waviness are blank tensioning, forming speed, pressure and temperature. Particularly for curved parts manufactured by stamp forming, the waviness defects are typically only found on the concave side of the part, due to the compressive forces caused by the forming of the laminate. 11 Our measurements from several examples of stamp-formed TPC parts have shown that the typical waviness defects found in such parts have a wavelength in the order of magnitude less than 10 mm. An example of the waviness at the corner section of a generic L-shaped profile typically found in a stiffener is presented in Figure 1. Interpreting the mechanical test results from such parts, however, is rather difficult in practice due to the complex stress distribution in the curved section. For this reason, a method to reproduce fiber waviness in generic flat test specimens for standard coupon mechanical testing is necessary.
There are several coupon manufacturing methods reported in the literature considering the technique to reproduce in-plane fiber waviness in unidirectional (UD) prepreg material. An example of the method for thermoset UD prepreg materials is by first forming the individual prepreg on a cylindrical rod while simultaneously heating the region that will be deformed locally with a hot air gun, and then manually shape the material to generate in-plane waviness.12,13 The same method has also been used by other authors for stacks of thermoset UD prepregs by first laying them on a curved geometry, and then subsequently flatten them before the full curing cycle was completed.14–16 Alternatively, a compressive strain can be induced directly in the composite material by clamping thermoset UD prepreg slit tapes between pre-stretched silicone rubber sheets, which will then induce compressive strain along with the disappearance of tensile deformation of the elastomer. 17 The authors, however, have not yet applied this technique for a laminate. If this method was to be applied for thermoplastic composites, it is yet unknown whether the induced small wavy patches will still be present after the subsequent consolidation process of the whole stack of prepregs.
None of the previously mentioned techniques for reproducing in-plane waviness have been applied to multidirectional TPC laminates. Aerospace-grade thermoplastic UD tapes based on polyether-ether-ketone (PEEK) matrix are used in this work. Below the melting temperature, the semicrystalline thermoplastic polymer is in its solid-state, and therefore it is impossible to manipulate the prepreg tape to conform to the shape of a curved tooling without breaking the fibers. Moreover, as observed from our scoping experiments, a manual shearing approach by locally heating up the tape produced waviness with a relatively large wavelength, i.e. in the order of 25 mm. As described previously, the typical waviness induced in TPCs by the stamp forming process is much smaller than this wavelength, in the order of magnitude less than 10 mm. Smaller localized waviness, as in the typical case of TPC parts, may have a less adverse influence on the compressive properties. To confirm whether this is true, further experimental study on the representative waviness is required. This review of the literature highlights that one of the main challenges in determining the mechanical properties of composites having waviness defects lies in obtaining the waviness in standard mechanical test coupons that is representative of the defects found in industrial TPC parts. Therefore, this paper introduces a test coupon manufacturing method, which is suited for TPC materials, to facilitate that investigation. It may ultimately contribute to expanding the database of the effect of waviness and defining the allowance limit. This work aims to experimentally assess the applicability of a reverse forming method to manufacture flat test coupon having in-plane waviness based on the following requirements: Produce flat laminates with good consolidation quality. Produce wavy test coupons with a wide range of maximum waviness angle values, representative of typical defects from industrial practice. Produce wavy test coupons that are suited for a standard compression test, i.e. with the waviness region being localized in a predefined area.
The majority of past studies have characterized waviness severity by using the maximum misalignment angle,3,4,6,9,18–20 which has been suggested to be the most critical measure as it has the most significant influence on the compressive strength.18,19 Most characterization methods to measure this parameter are based on microscopy analysis which is often coupled with image analysis algorithms to automatically detect the fibers and measure the angles.21–24 Considering the second requirement, the maximum angle is chosen as the parameter to represent the severity of the waviness produced. A variation in the maximum waviness angle is necessary to establish the correlation between the severity and the measured compressive properties. Furthermore, considering the third requirement, the wavy regions within the produced test coupon have to fit the unsupported gage length of 20 mm as described in the standard CLC test method mentioned earlier. 25 Finally, quasi-isotropic (QI) laminates are chosen as a case study for multidirectional composites, since such layup is one of the most common for aircraft structures.
This paper first presents a reverse forming method used to obtain in-plane waviness in flat laminates. This method is based on the same principle from one of the techniques mentioned earlier for thermoset composites, i.e. pre-forming into a curved geometry to create excess material in a certain region. The experimental method firstly involves stamp forming of a blank into a V-shape (single-curved) geometry, and then subsequently flattening it back by a second forming step to induce the waviness. Furthermore, the QI stacking sequence was varied to assess the number of inner plies that were affected by the compressive forces caused by the forming of the laminate. For this reason, the position of the plies that are oriented in the bending direction of the laminate was varied by altering the ply grouping within the stack. The formed laminates were characterized using a microscope to evaluate the voids, the number of wavy plies, the maximum waviness angle, and the defective region length in order to assess whether the proposed reverse forming method meets the aforementioned requirements. The maximum waviness angle obtained using the reverse forming method was then compared with the measured parameters from several examples of industrial parts to objectively assess how the produced waviness samples reflect the typical defect characteristics.
Experimental methods
The manufacturing process steps to obtain in-plane waviness in flat laminates are illustrated in Figure 2. The main principle of the proposed manufacturing method lies in a local pre-forming of the blank into a curved geometry with a small radius to create excess material in the corner region. The steps include: i) a press consolidation step to manufacture a quasi-isotropic blank, ii) a stamp forming process to produce a V-shape part, and iii) a flat forming process to induce the waviness. The process parameters are described in more detail in the following sections.
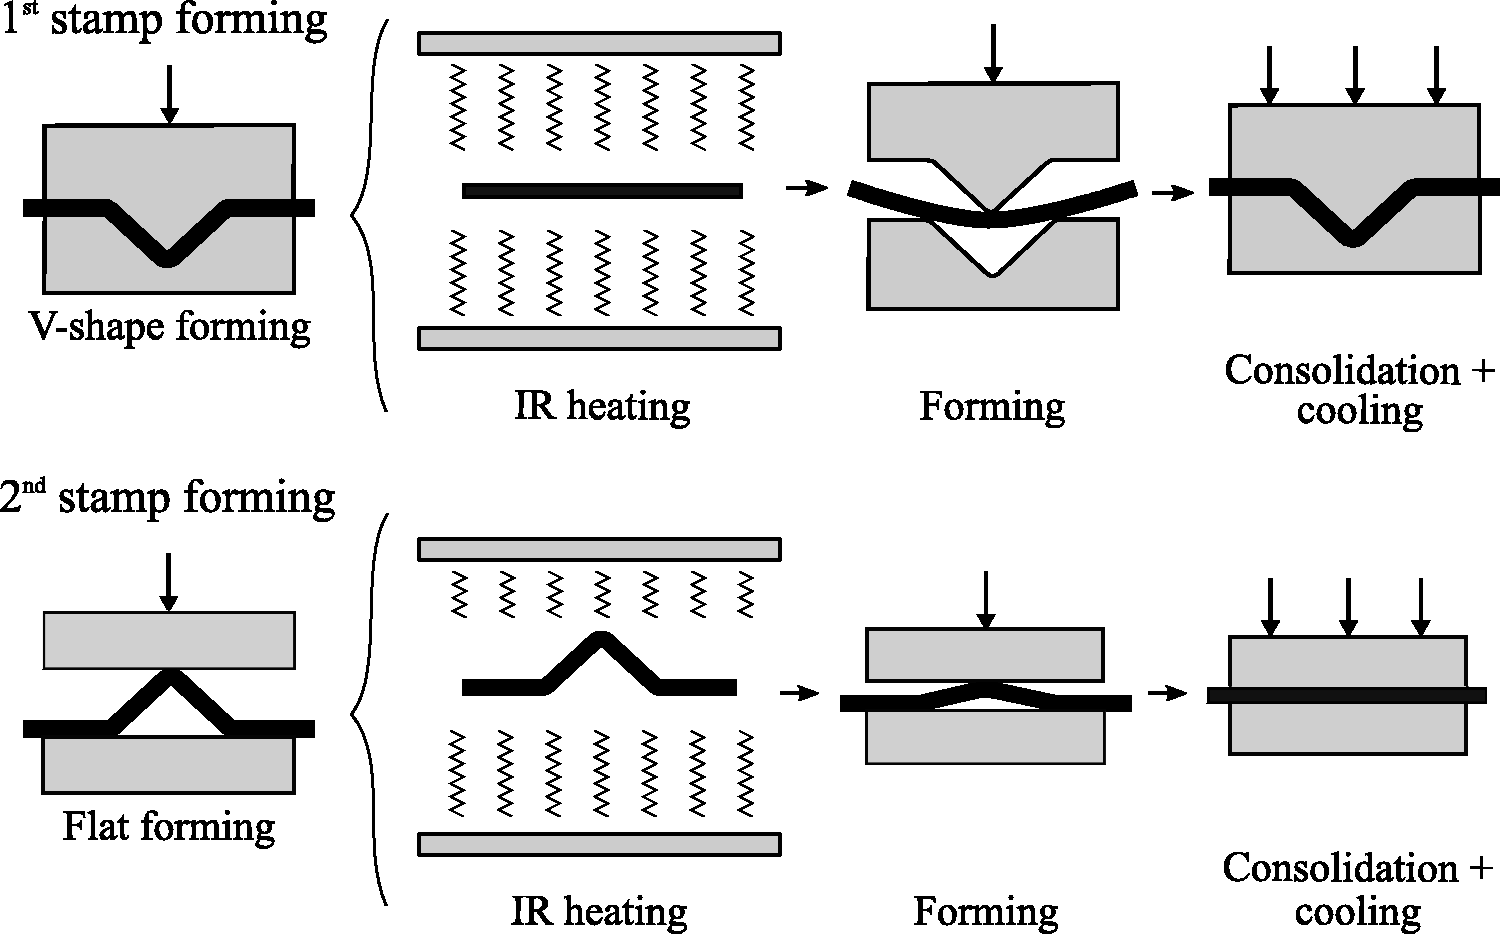
Reverse forming process steps to form in-plane waviness defects in a flat laminate.
Materials
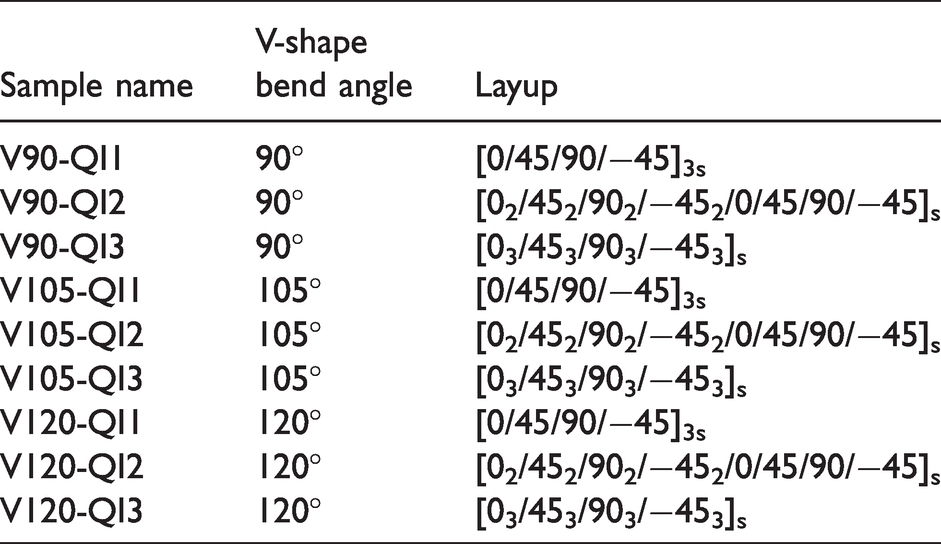
Quasi-isotropic (QI) laminates with various stacking sequences, i.e. [0/45/90/−45]3s, [02/452/902/−452/0/45/90/−45]s, and [03/453/903/−453]s (Table 1), were prepared from unidirectional (UD) carbon/PEEK tapes, known as Cetex® TC1200 from Toray Advanced Composites. The prepreg tape contains AS4 fibers with a fiber volume fraction of 59%. 26 A total of 24 plies were used to produce laminates with a nominal thickness of 3.4 mm. The three different QI layups were chosen such that the laminate thickness and the number of plies in each orientation, hence the axial stiffness, remained the same for all samples.
Sample code and laminate layups.
Press consolidation
Laminates with the size of 300 mm × 300 mm were laid up from 12” wide tapes. The laminates were placed between 1 mm thick stainless steel caul sheets, coated with Marbocote 227CEE release agent, in a picture frame mold. They were consolidated in a Pinette P.E.I. press under 20 bar pressure with 20 minutes dwell time at 385 °C, and a cooling rate of 5 °C/min. After press consolidation, the laminates were cut using a water-cooled diamond-coated saw into two blanks of 300 mm x 150 mm size for the subsequent stamp forming processes. The blanks were manufactured in such a way that a minimum of five standard mechanical test coupons, e.g. a nominal size of 147 mm long and 12 mm wide (according to ASTM D6641 for the standard Combined Load Compression (CLC) test method 25 ) could be obtained from a single plate.
Stamp forming
The V-shape tooling, coated with Marbocote 227CEE release agent, was used for the first stamp forming step. This step produced composites with the geometry as shown in Figure 3. The following three positive toolings, with various combinations of bend angles (shown as θ in Figure 3) and inner radius ( 90°-bend with 6.4 mm inner radius 105°-bend with 8 mm inner radius 120°-bend with 10 mm inner radius
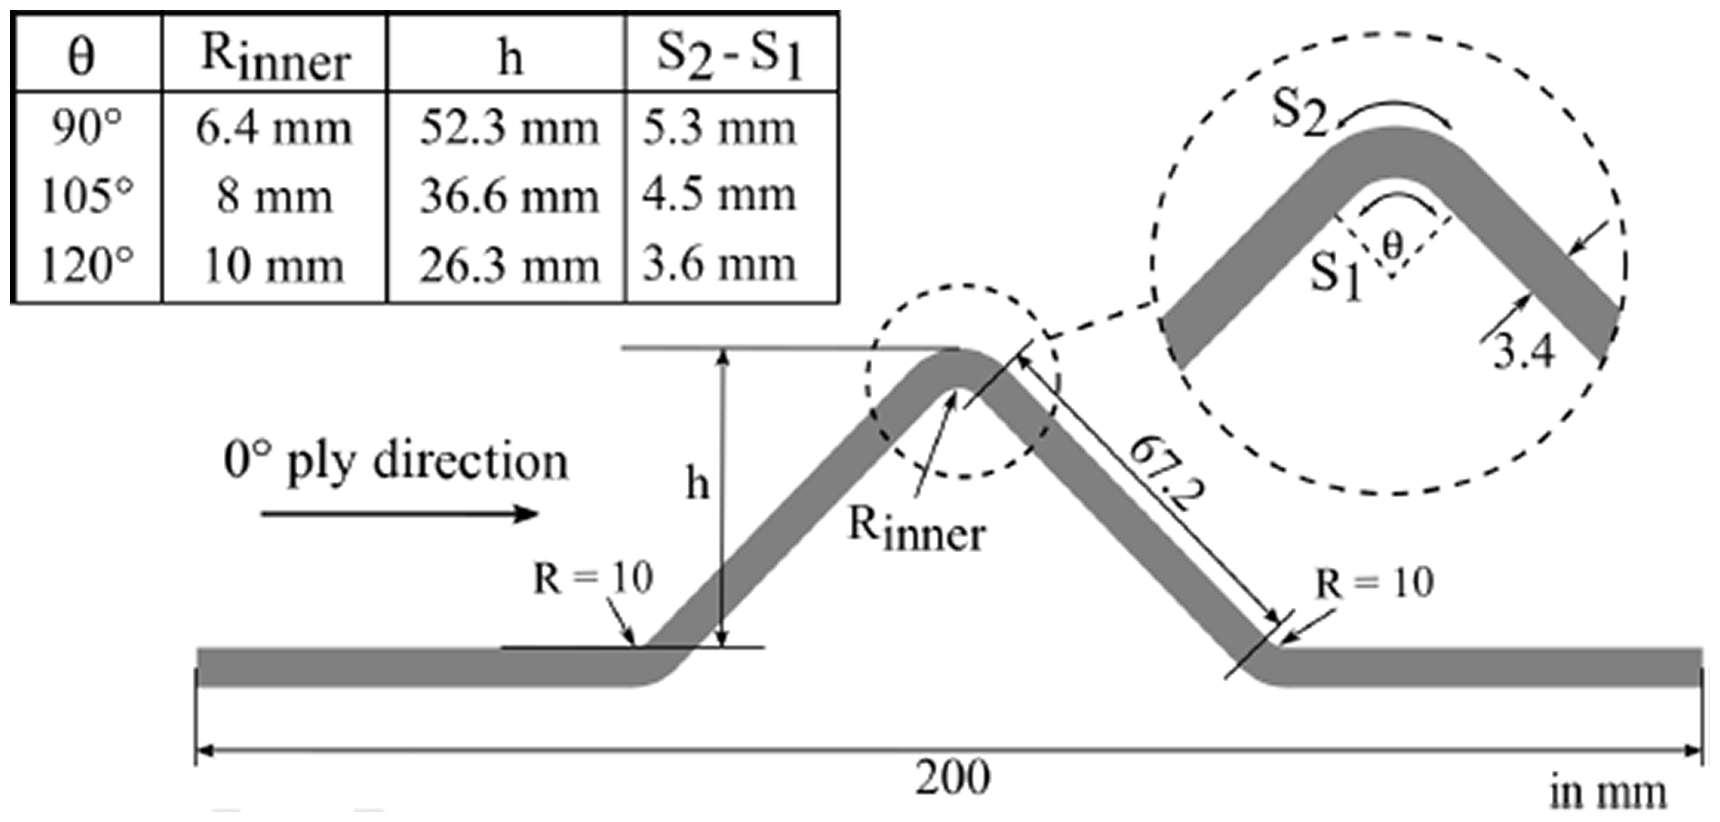
V-shape geometry. The table shows the dimensions of the parts.
The 90°-bend tooling was made of steel, while the 105° and the 120°-bend toolings were made of aluminum. Matched metal negative toolings were produced accordingly to reach a nominal gap thickness of 3.4 mm. These various combinations were chosen in order to vary the arc path lengths of the top and bottom layers at the corner section (S1 and S2 in Figure 3), which was expected to affect the induced in-plane waviness severity. The sample code is defined by the bend angle and the layup used, as V(tool-angle)-(layup sample code), e.g. V90-QI1 for the sample with a single 0° ply in the outermost side which was formed using the 90°-angle V-shape tooling (see Table 1).
The prepared blanks were stamp formed into V-shape parts (see Figure 3) using a Pinette P.E.I. press equipped with an infrared (IR) oven and an automated shuttle transfer frame. Toggle clamps were used as the blank holder in the transport frame for this process. The blanks were heated using IR panels with a temperature of 465 °C for 300 seconds, to reach a midplane temperature of 390 °C. The blanks were then rapidly transported towards the matched metal toolings. The forming was initiated by the downward movement of the male tool. The V-shape forming was completed by applying 40 bar consolidation pressure for 60 seconds while the laminate was cooled down to the tool temperature of 240 °C.
After forming the blank into the V-shape geometry, a second press forming cycle was applied to unfold the V-shape part into a flat laminate. For this forming step, four springs at each corner of the V-shape part (see Figure 4), with a spring rate of 0.43 N/mm, were used to suspend the part in the transport frame. The V-shape part was reheated in the IR oven with the same settings as before. As shown in Figure 4, the corner section of the V-shape part was closer to the top IR panel (at approximately 10 cm distance) than the rest of the part. Therefore, this region melted first and immediately unfolded into a somewhat flat laminate due to the tension from the springs.
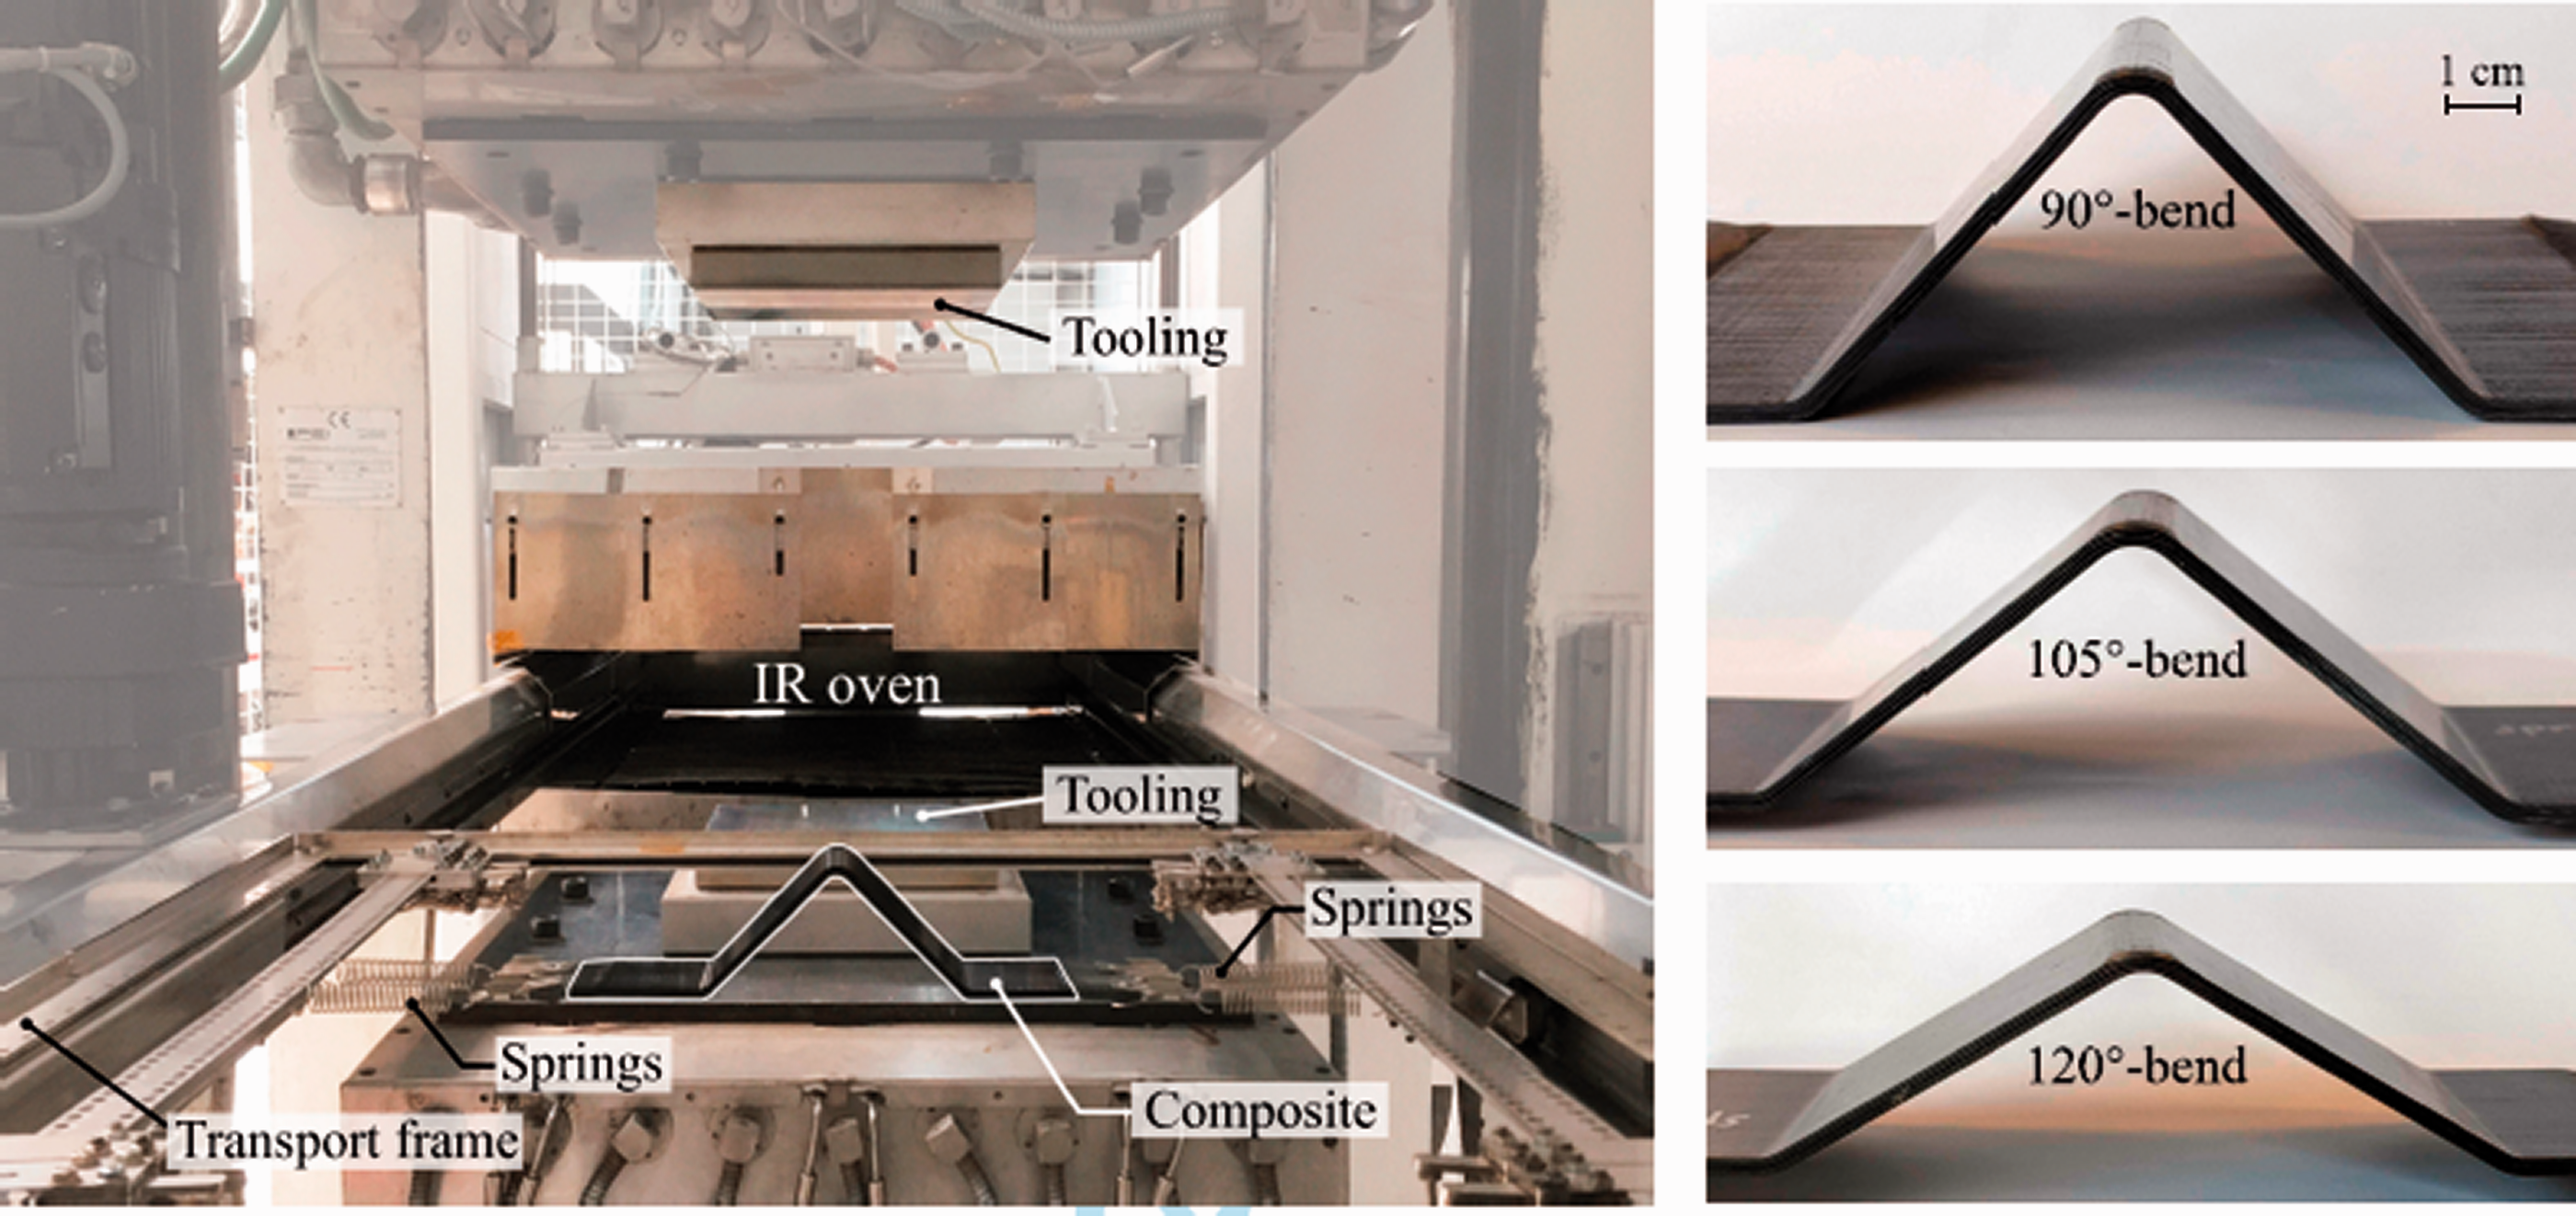
Formed V-shape part loaded into the transport frame prior to the flat forming process (left). Examples of the formed parts with three different geometries (right).
For the second forming step, a flat 250 mm × 250 mm aluminum tooling coated with Marbocote 227CEE release agent was used in the same press as the first forming step. The flat forming was carried out by applying 100 bar consolidation pressure for 60 seconds, with the tooling temperature being kept at 240 °C. The relatively high consolidation pressure was used to ensure void-free laminates. All of the formed laminates were subsequently assessed according to the methodology that is described in the following section.
Assessment methods
Two types of micrography analysis, i.e. on a cross-section (x-z plane view in Figure 5) and on the surface (x-y plane view), were performed in order to investigate the consolidation quality of the formed laminates, the number of wavy plies, and the wave parameters of the induced defects, i.e. maximum waviness angle (
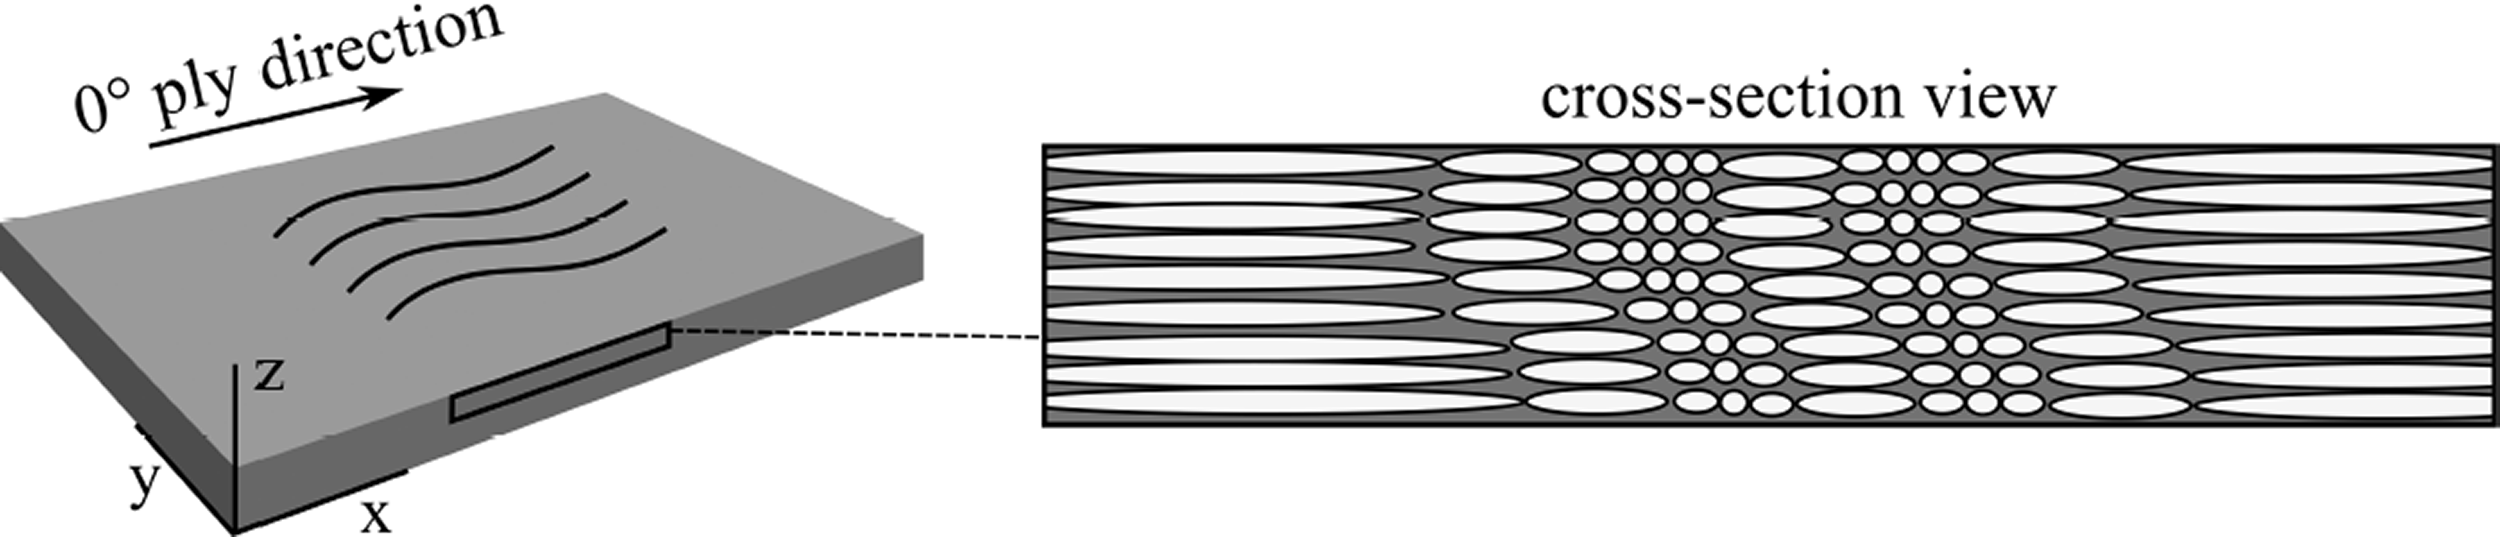
Schematic of the sections characterized for the assessment of the waviness. The right figure shows a portion of the cross-section of the wavy region in the top 0° ply.
Characterization methods
Cross-sectional microscopy
A number of specimens were cut in the region of interest, embedded in epoxy, and then polished. The micrographs presented in Figure 5 were taken with a sectioning plane (x-z) parallel to the main fiber direction in the surface ply by using a Keyence VHX-5000 digital microscope. Three micrographs were taken from each laminate of a particular set of forming experiments to check for the presence of voids and determine the number of wavy plies. The cross-sectional shape of the fiber that is misaligned from the sectioning plane appears as an ellipse that has a small aspect ratio, i.e. major-axis-length over minor-axis-length (see Figure 5). Therefore, the waviness region in the corresponding plies was identified by observing the shape of the fiber’s cross-section.
Surface microscopy
Micrographs of the laminates were taken as-is from the wavy surface. Before the image acquisition, the surface was only prepared by applying a thin layer of sunflower oil on the sample’s surface to enhance the visibility of the fiber patterns. The oil conceals the surface roughness of the laminate. In this way, less light is being scattered by the inherent roughness of the surface and more light is then directed through the objective lens, hence a clearer image can be observed. The effect is demonstrated in Figure 6. The surface micrographs were acquired using a Keyence VHX-5000 digital microscope with an objective lens magnification at 150x. The images were taken at a high resolution, i.e. at 1.5 µm per pixel, in such a way that the individual fibers can be well distinguished.
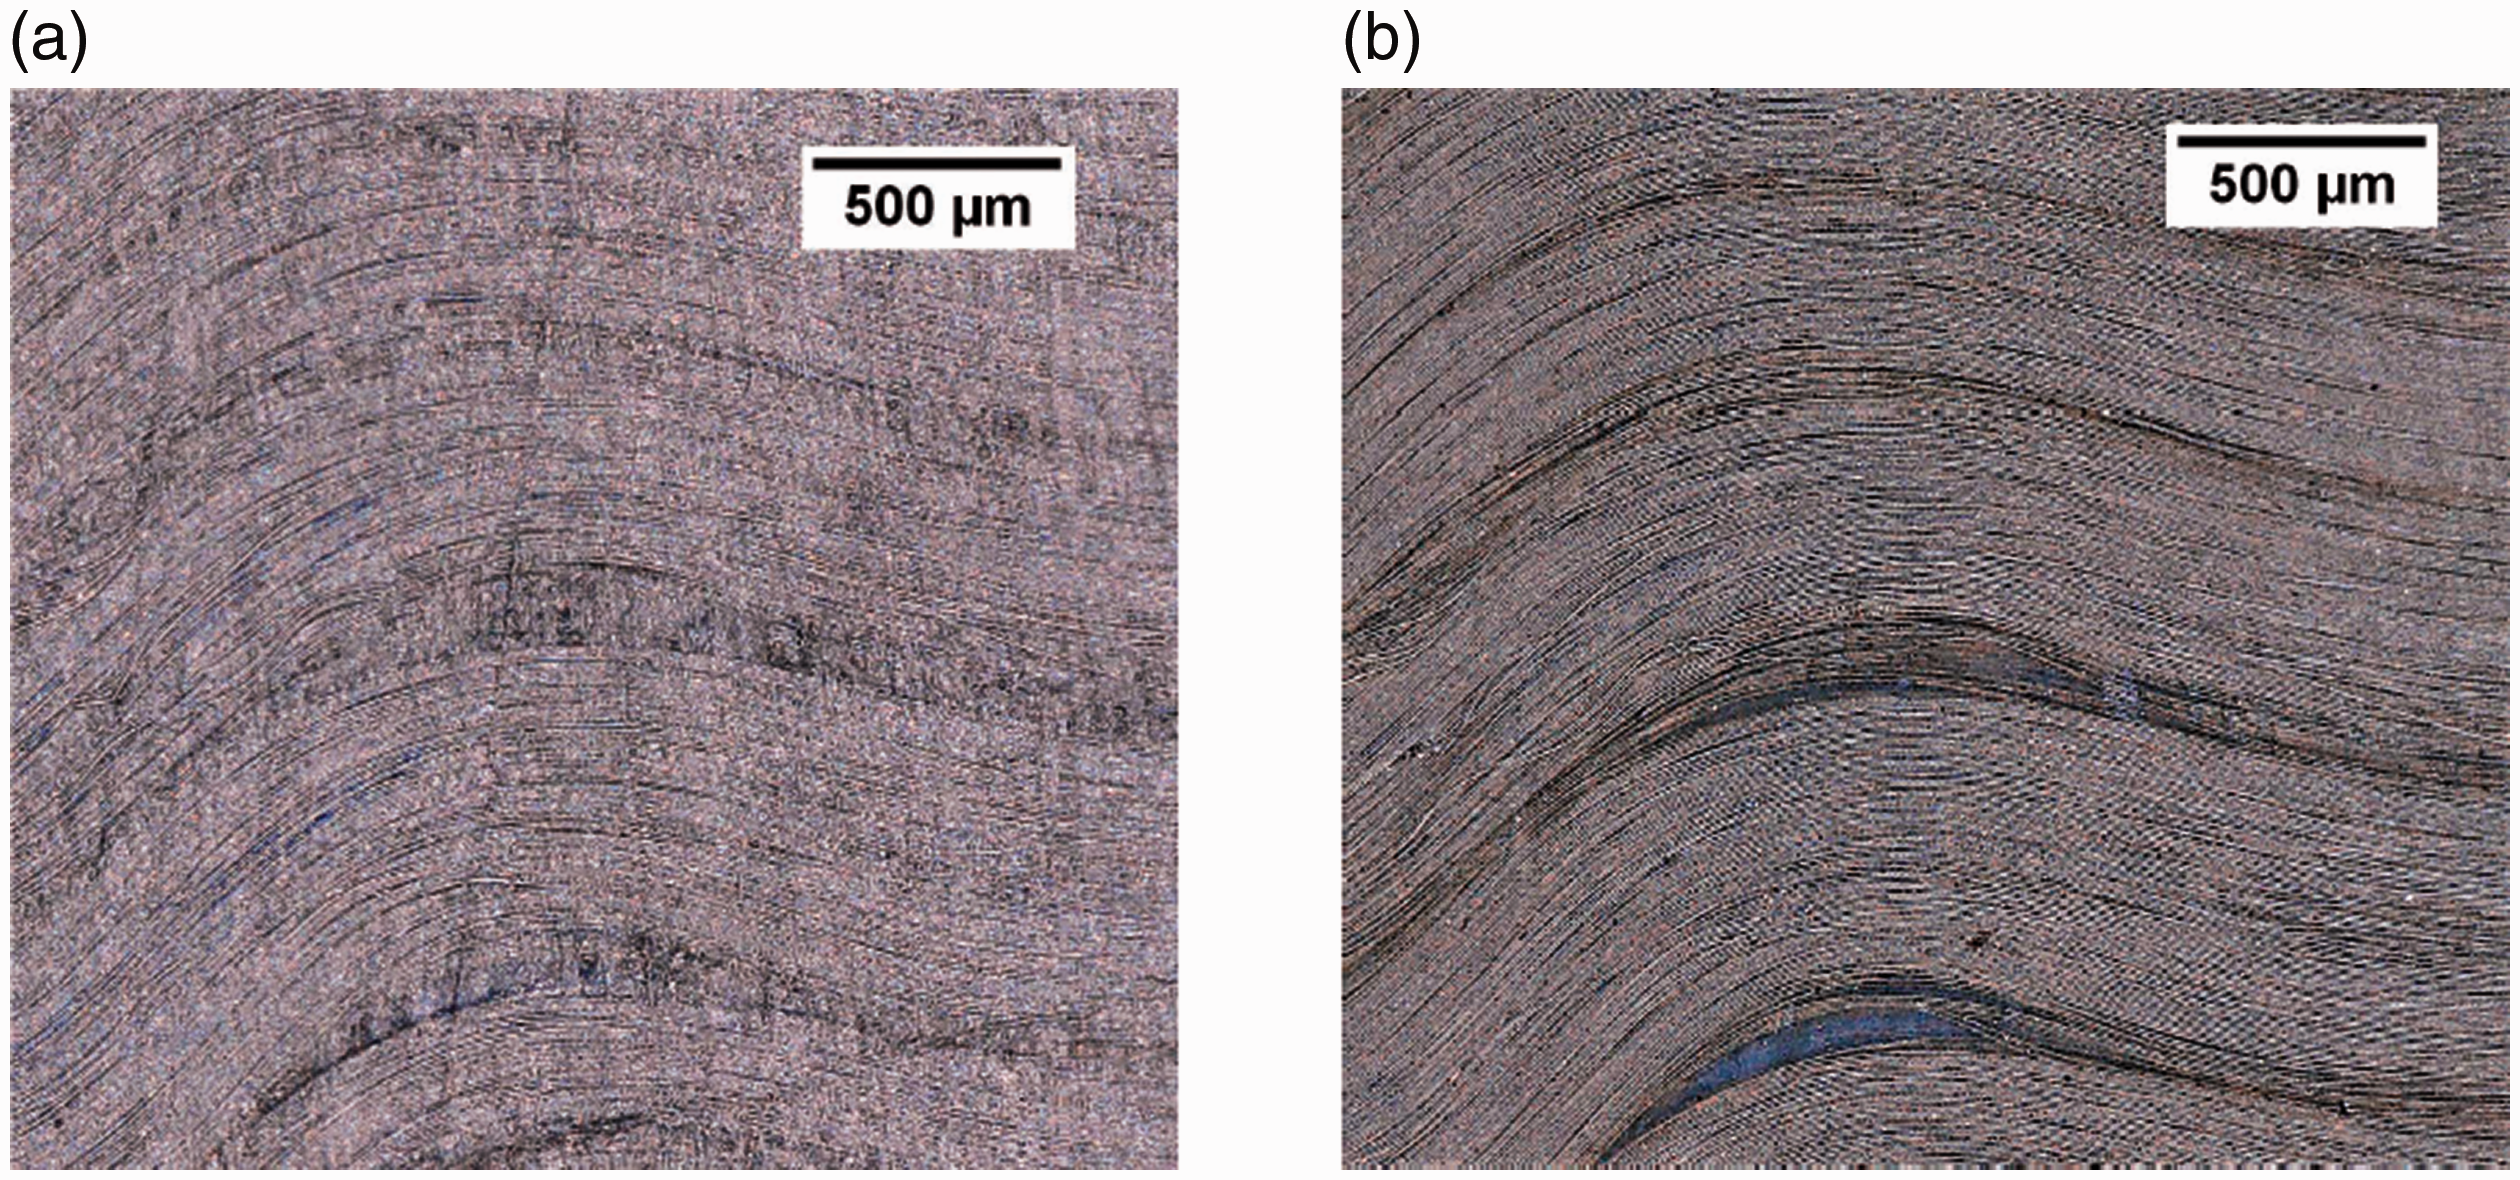
Surface micrographs of a laminate containing in-plane waviness: (a) as-is and (b) after the oil application.
X-ray micro-computed tomography
X-ray tomography scans were performed using a Scanco vivaCT 40 on the specimen to observe the state of the waviness in the inner plies. 2 D X-ray images of each ply were acquired with the resolution of 6 µm pixel size and 23 slices through the thickness to visualize each ply within the laminate.
Waviness parameters measurement from surface micrography
For each formed laminate, five micrographs of 20 mm × 12 mm were taken from the surface that displayed fiber waviness. The micrographs were taken at the center of the laminate, at the locations that were intended to be the unsupported gage section of the CLC test coupons. Furthermore, wavy regions found in industrial stamp-formed parts were evaluated as well to obtain reference values of the waviness severity found in actual parts. These parts were provided by a company that manufactures thermoplastic composite parts for aircraft. The examples were taken from aircraft primary structure ribs and aerodynamic surface stiffeners. The parts were made of quasi-isotropic laminates consisted of polyether-ketone-ketone (PEKK) matrix reinforced with standard modulus carbon fibers. Surface micrographs of 22.5 mm × 22.5 mm were taken from the most severe wavy region of each part. The parts have an areal size of about 50 cm × 15 cm with a nominal thickness of approximately 4 mm. Following the agreement with the company, the detailed description of the parts cannot be disclosed in this paper.
The fiber orientation was automatically measured by implementing the ‘high resolution misalignment analysis’ (HRMA) method developed by Wilhelmsson and Asp 22 to the surface micrographs (see Figure 6), i.e. both from the formed laminates and the industrial stamp-formed parts. The micrograph of the specimen surface was taken with the nominal fiber orientation (0°) aligned to the longitudinal reference which was taken as the horizontal edge of the image. The image alignment procedure was done manually before performing the fiber orientation measurement. The HRMA method is fully automated, and in principle works by tracing the fiber segments individually within a small block from an image and measuring the fiber angles relative to a longitudinal reference. In the literature, there are other image analysis algorithms to automate fiber orientation measurement, i.e. the ‘multiple field image analysis’ method which determines the average fiber orientation by tracking light intensity variations, 23 and the ‘Fourier transform misalignment analysis’ which uses Fourier transformation to compute the average fiber angle. 24 Both of these methods use a similar blockwise approach as the HRMA method, i.e. dividing the image into multiple small domains. However, in contrast to these two earlier methods, the HRMA method does not use a sophisticated algorithm as it only relies on tracing individual fibers from a binary image, hence a small computation time.
The image processing technique works by first dividing the micrograph into several square blocks. The size of each block determines the spatial resolution. A block size of 50 × 50 pixels (75 × 75 µm2) was used in this study. The image from each block is converted to a black and white binary image, with the white pixels representing the fibers, as shown in Figure 7. Fiber segments are traced in such a block based on continuity of the white pixels by moving one pixel step horizontally and then move vertically up or vertically down, depending on the presence of the white pixels in a given direction. The ends of the fiber segments are marked if a black pixel is found, with the end points taken at the center of the fiber segments vertically. For an illustration of the traced fiber segments, red lines that pass the two end points of each fiber segment are shown in Figure 7. Interested readers are referred to the original paper for more detail of the algorithm.22 Typically seven straight fiber segments were successfully measured for each block. Therefore, a total of approximately 3,00,000 measurements were performed on each micrograph. An example of the traced fiber segments in one square block is shown in Figure 7. The fiber angles (θ) are calculated based on the coordinates of each fiber segment’s end points according to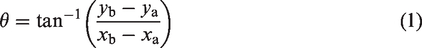
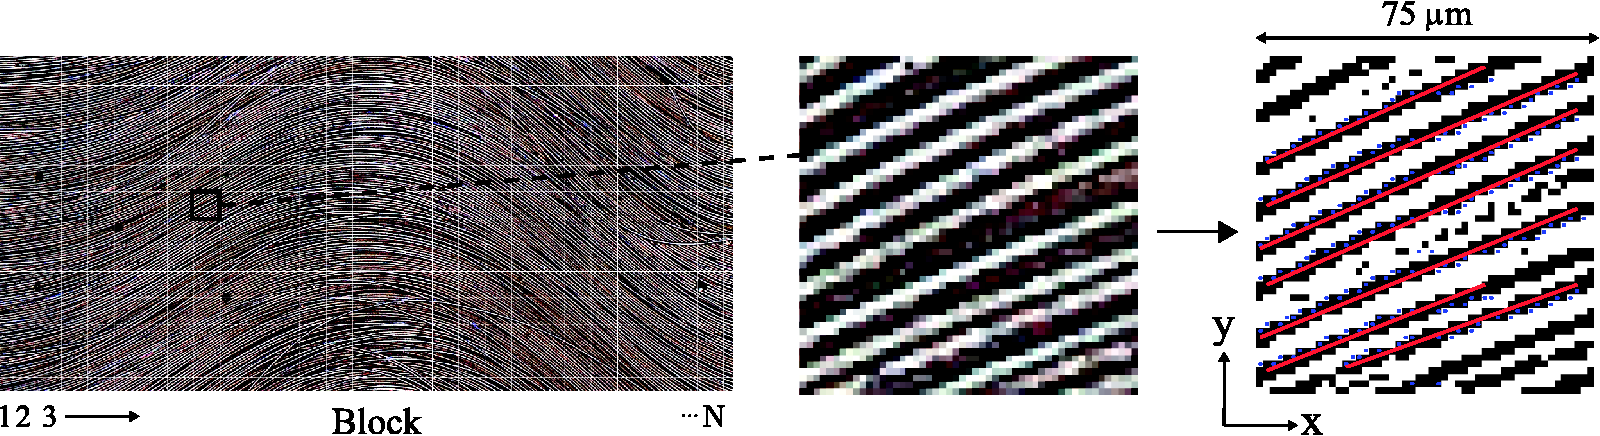
An example of traced fibers shown by the red lines in the black and white square image block (right) which was converted from the original micrograph with grids (left).
The maximum waviness angle is defined in this paper as the absolute maximum value of the measured fiber angle from a given micrograph of a test specimen. The term waviness angle is used as it is considered more appropriate to represent the deviation of fiber angle in the waviness region, instead of the term misalignment which may imply that the fibers are misoriented but may still be straight fibers.
The surface micrographs of the test coupons contain in most cases one or two wavy regions as illustrated in Figure 8. The defective region length, indicated as
An example of two wavy regions in a test coupon.
Results
The first stamp forming step produced V-shape parts with waviness localized on the concave surface of the three corner sections shown earlier in Figure 3. However, after the second stamp forming step, this initial waviness was no longer observed on the same surface. The fibers at these positions appeared to be straightened back during the flattening of the V-shape parts. Instead, all of the laminates, after flat forming, had pronounced waviness visible on the surface that was on the convex side, in the middle V-shape corner section. The other two corner sections showed slight waviness after flattening, which appeared to be similar to the pre-existing random fiber misalignment which is sometimes found on the surface of flat laminates produced by press consolidation.
The representative cross-sectional micrographs in Figure 9 illustrate the result of forming experiments for the QI1 and QI2 laminates. These micrographs were taken from the section parallel to the 0° ply fiber orientation. All laminates from the forming experiments, from all three different V-shape geometries (V90, V105, and V120), have similar cross-sections. They all show that the laminates have good consolidation quality indicated by the absence of voids. The forming experiments of the QI1 and QI2 samples produced laminates with localized in-plane waviness visible on the top side of the micrographs, where the fibers in the wavy region within the 0° plies appeared as ellipses with a small aspect ratio.
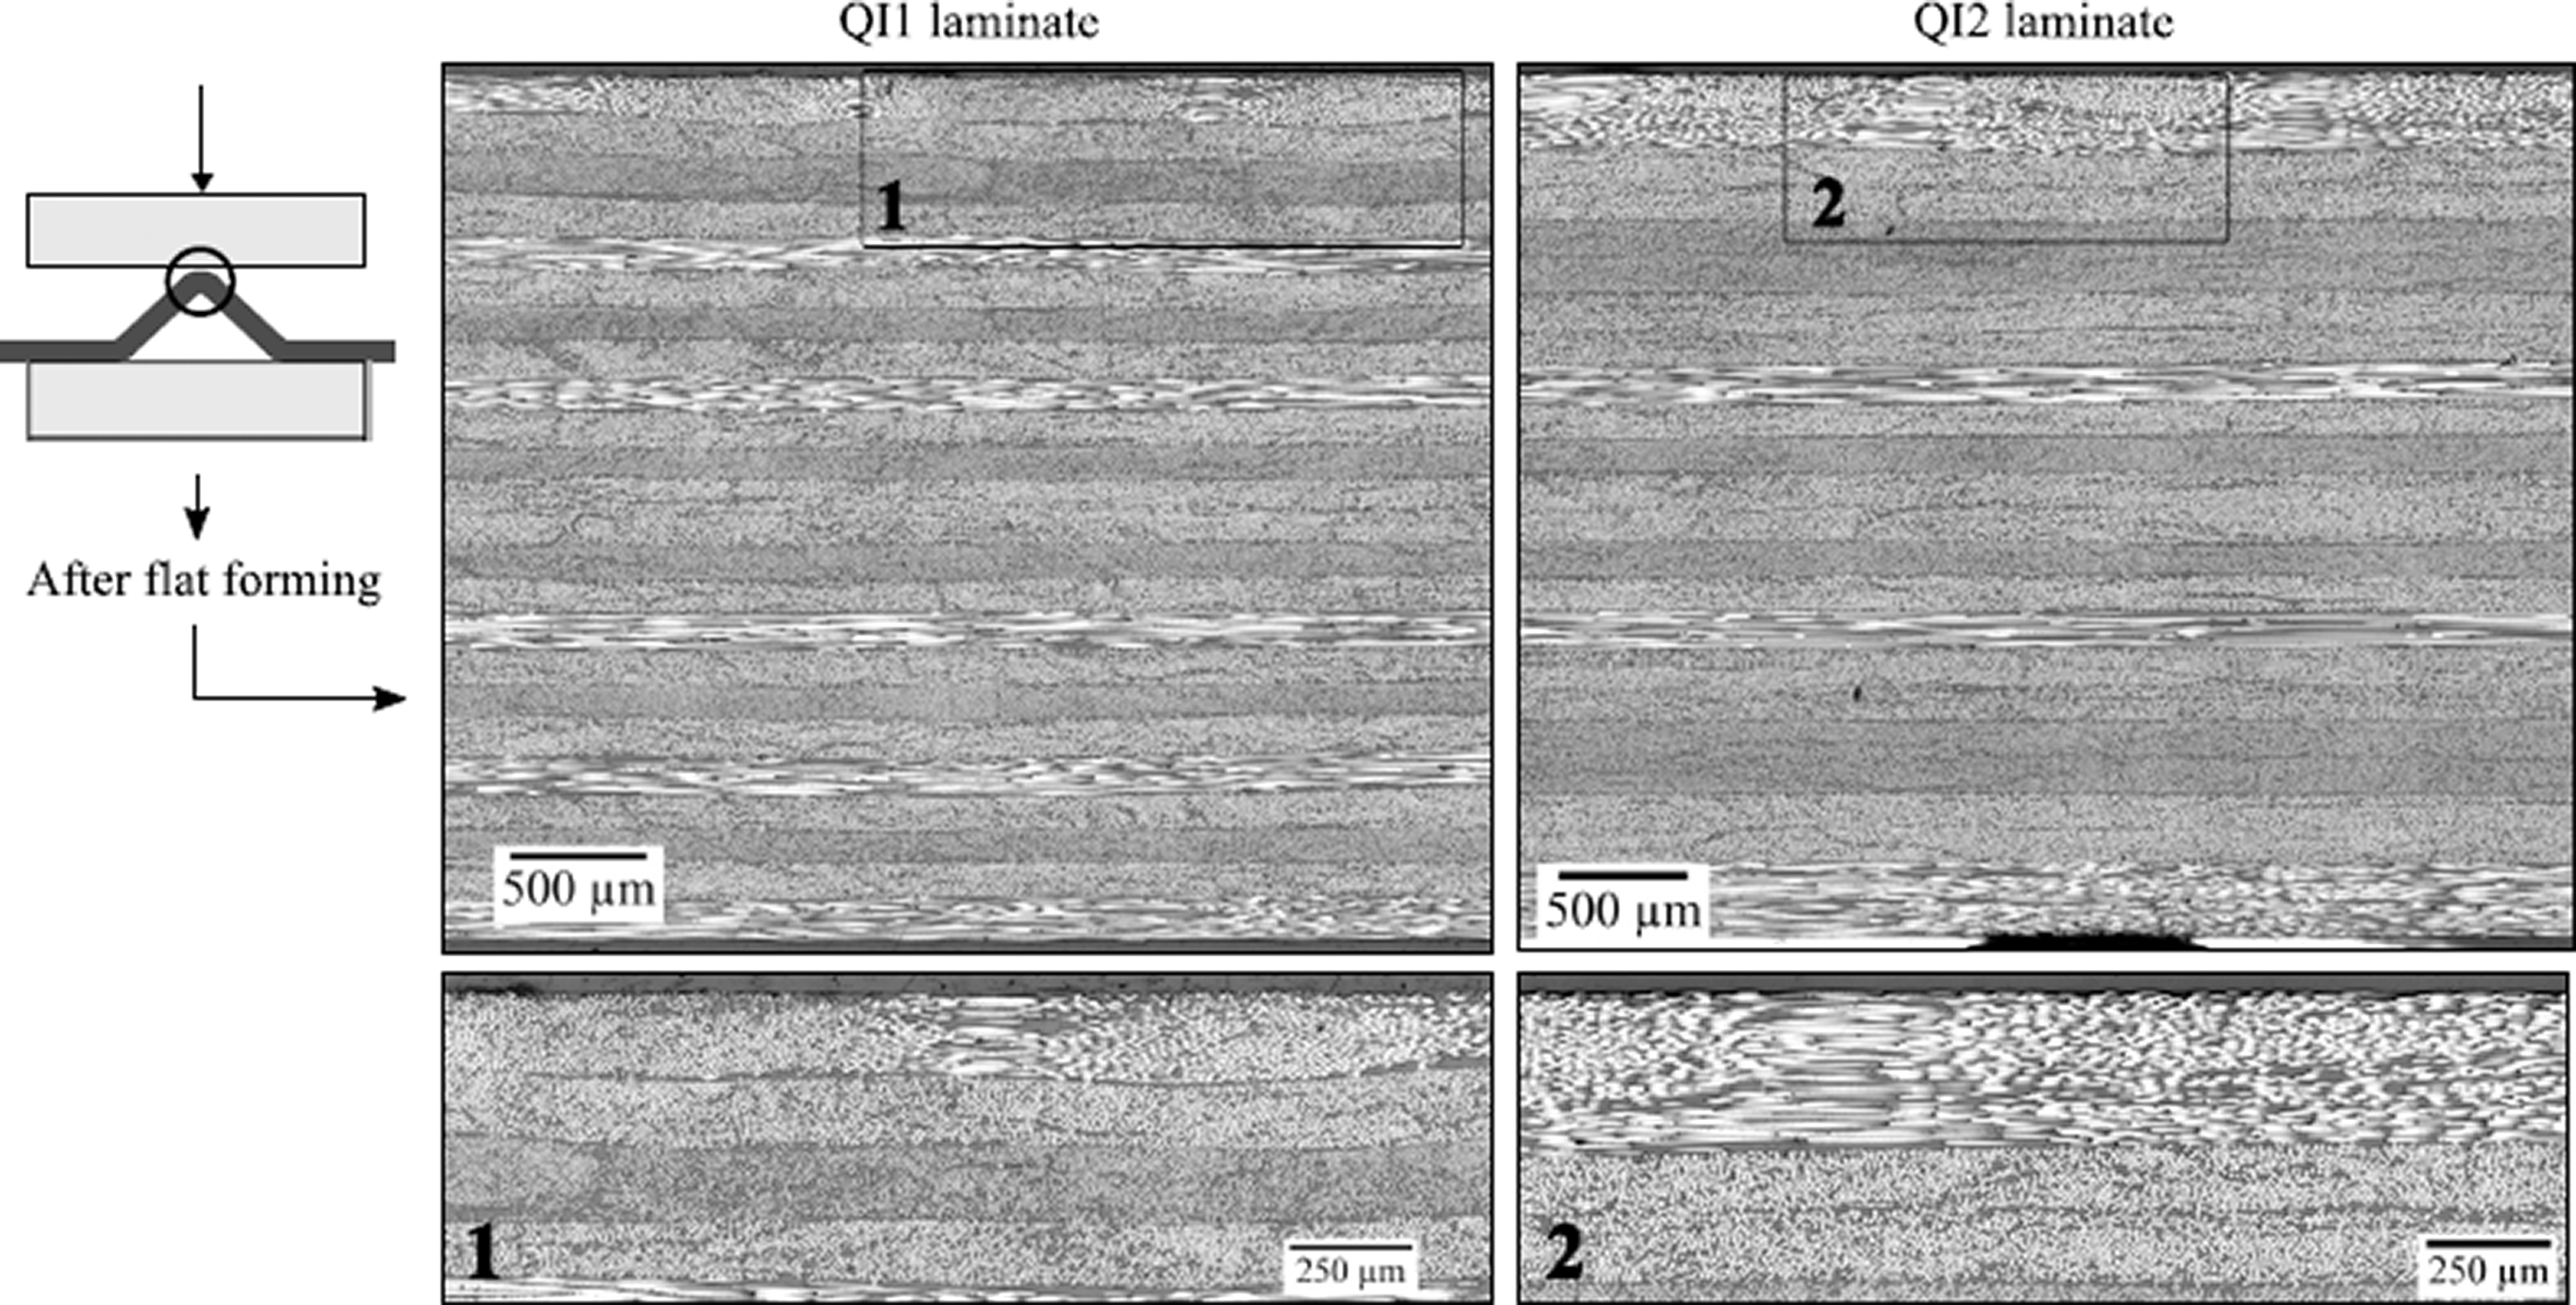
Representative cross-sectional micrographs of the reverse-formed QI1 and QI2 laminates, taken from the location which was initially the middle corner section of the V-shape part.
For the QI1 samples, only a single outermost 0° ply from the convex side of the middle corner section appeared to show waviness, as can be observed from the fiber cross-sectional shapes in the micrograph shown in Figure 9. An X-ray CT scanning of the QI1 laminate was also performed to check for waviness in the inner plies. The result presented in Figure 10 confirms that the in-plane waviness was only formed in the first 0° ply. For the QI2 samples both outermost 0° plies from the convex side, as observed in Figure 9, have in-plane waviness defects. The fiber cross-sectional shapes of the second 0° ply from the top of Figure 9 have a larger aspect ratio than that of the surface. This means that the fibers are becoming more aligned with the nominal fiber orientation of the ply in conjunction with the increase of the depth. For this reason, measurement of the fiber orientation through-the-thickness was not performed, as the most severe waviness induced by the reverse forming was on the surface ply. Furthermore, these results show that the waviness was induced in the outermost ply that is oriented in the bending direction of the laminate during forming.
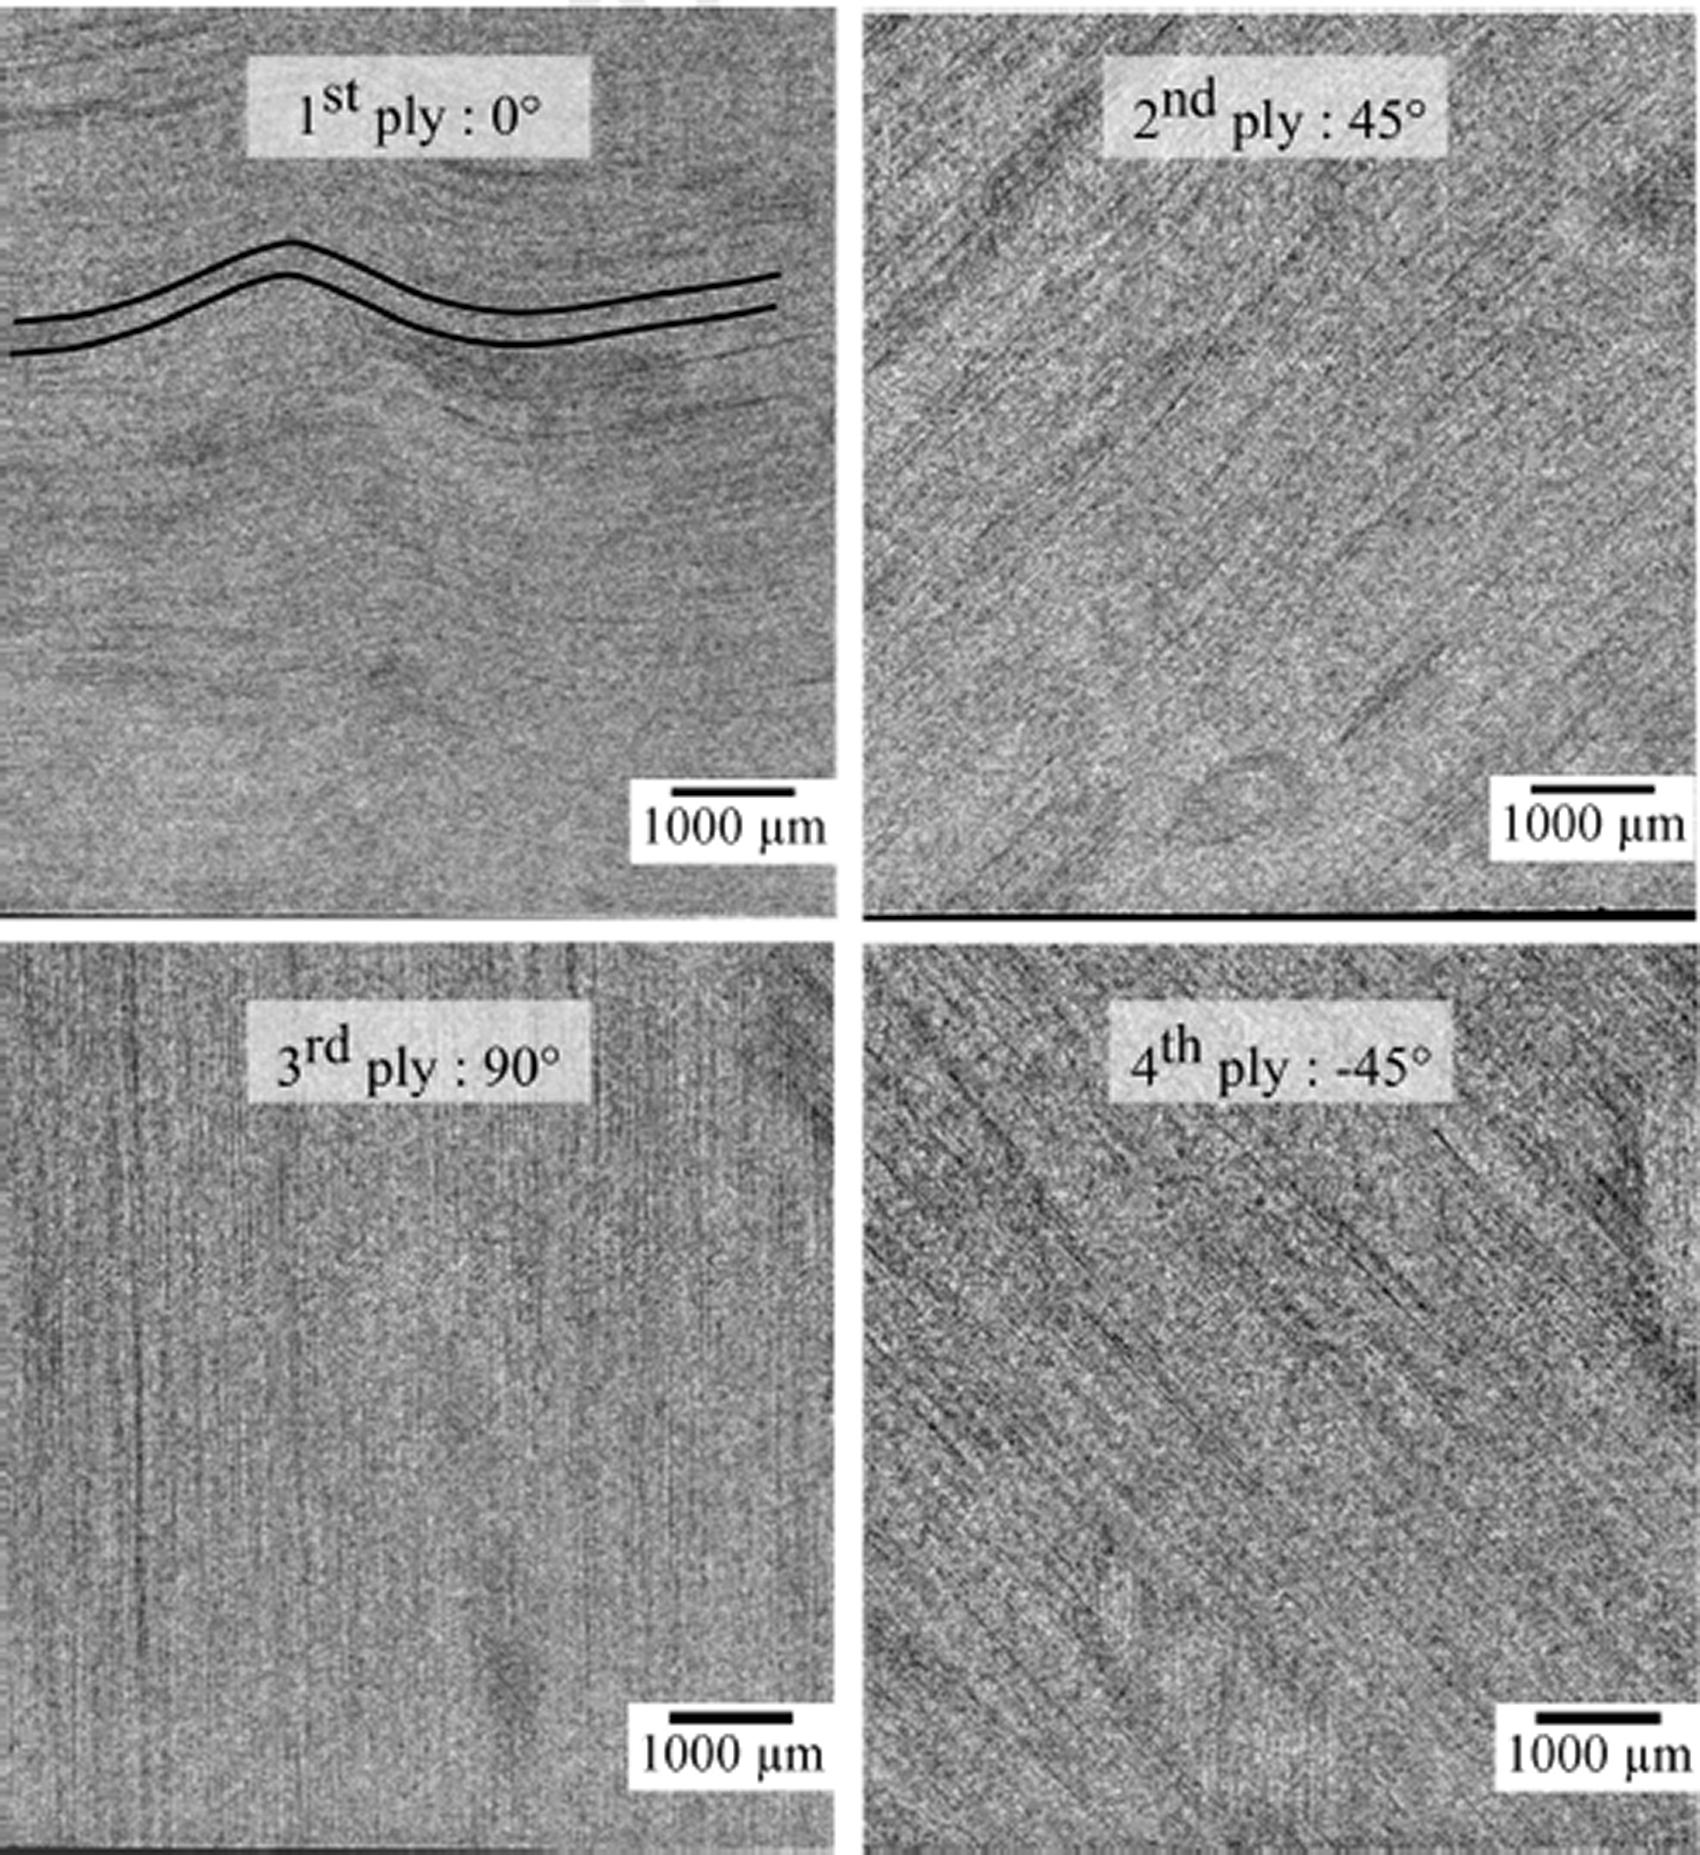
X-ray microCT scan result of the V90-QI1 specimen showing the four topmost plies with in-plane waviness only visible in the first 0° ply. Some wavy fibers in the 0° ply are highlighted for illustration purpose.
The representative cross-sectional micrographs from the QI3 laminates, formed using the three different V-shape toolings (see Table 1), are shown in Figure 11. These micrographs were also taken at the region with waviness in a similar way as the micrograph in Figure 9. Also here, the micrographs indicate that the QI3 laminates have good consolidation quality. Similar to the QI2 laminates, only the outermost 0° plies from the convex side of the middle V-shape corner section showed waviness. However, not all forming experiments produced wavy fibers over the full thickness of the outermost 0° plies. Only the reverse forming experiments with the 90°-bend angle produced laminates having wavy fibers over the full thickness of the entire top three 0° plies, as indicated by the arrow in Figure 11(a). Conversely, Figure 11(b) and (c) indicates that the forming experiments using the V-bend angles of 105° and 120° yielded partial waviness through the thickness of the top 0° plies. There are several fibers, albeit a very small fraction, in the innermost part of the third 0° plies that are not wavy. Moreover, Figure 11 shows that the ply at the wavy region appeared to be thicker than the region adjacent to it, although the overall laminate had a constant thickness.

Representative cross-sectional micrographs of the QI3 laminates taken from the region with waviness: (a) V90-QI3, (b) V105-QI3, and (c) V120-QI3 laminates. These micrographs were extracted from the laminates at the section where the middle corners of the V-shape parts were initially located. The arrows indicate the portions of the 0° plies that show in-plane waviness.
Representative micrographs from both the top and bottom surfaces of the produced QI1 laminate are shown in Figure 12. All laminates (as listed in Table 1) have a similar surface appearance, hence only one example is presented here. No fiber breakage was observed in the wavy region after reverse forming. As can be seen from the contour maps of the fiber angle in Figure 12, the waviness was only observed on the top surface at the location which was initially the middle V-shape corner section. The formed laminates have one to three wavy regions within the region of interest, i.e. the 20 mm gage length. As presented earlier in Figure 8, the majority of the laminates have two wavy regions. The induced waviness appeared as a continuous wavy region extending throughout the entire width of the laminate.
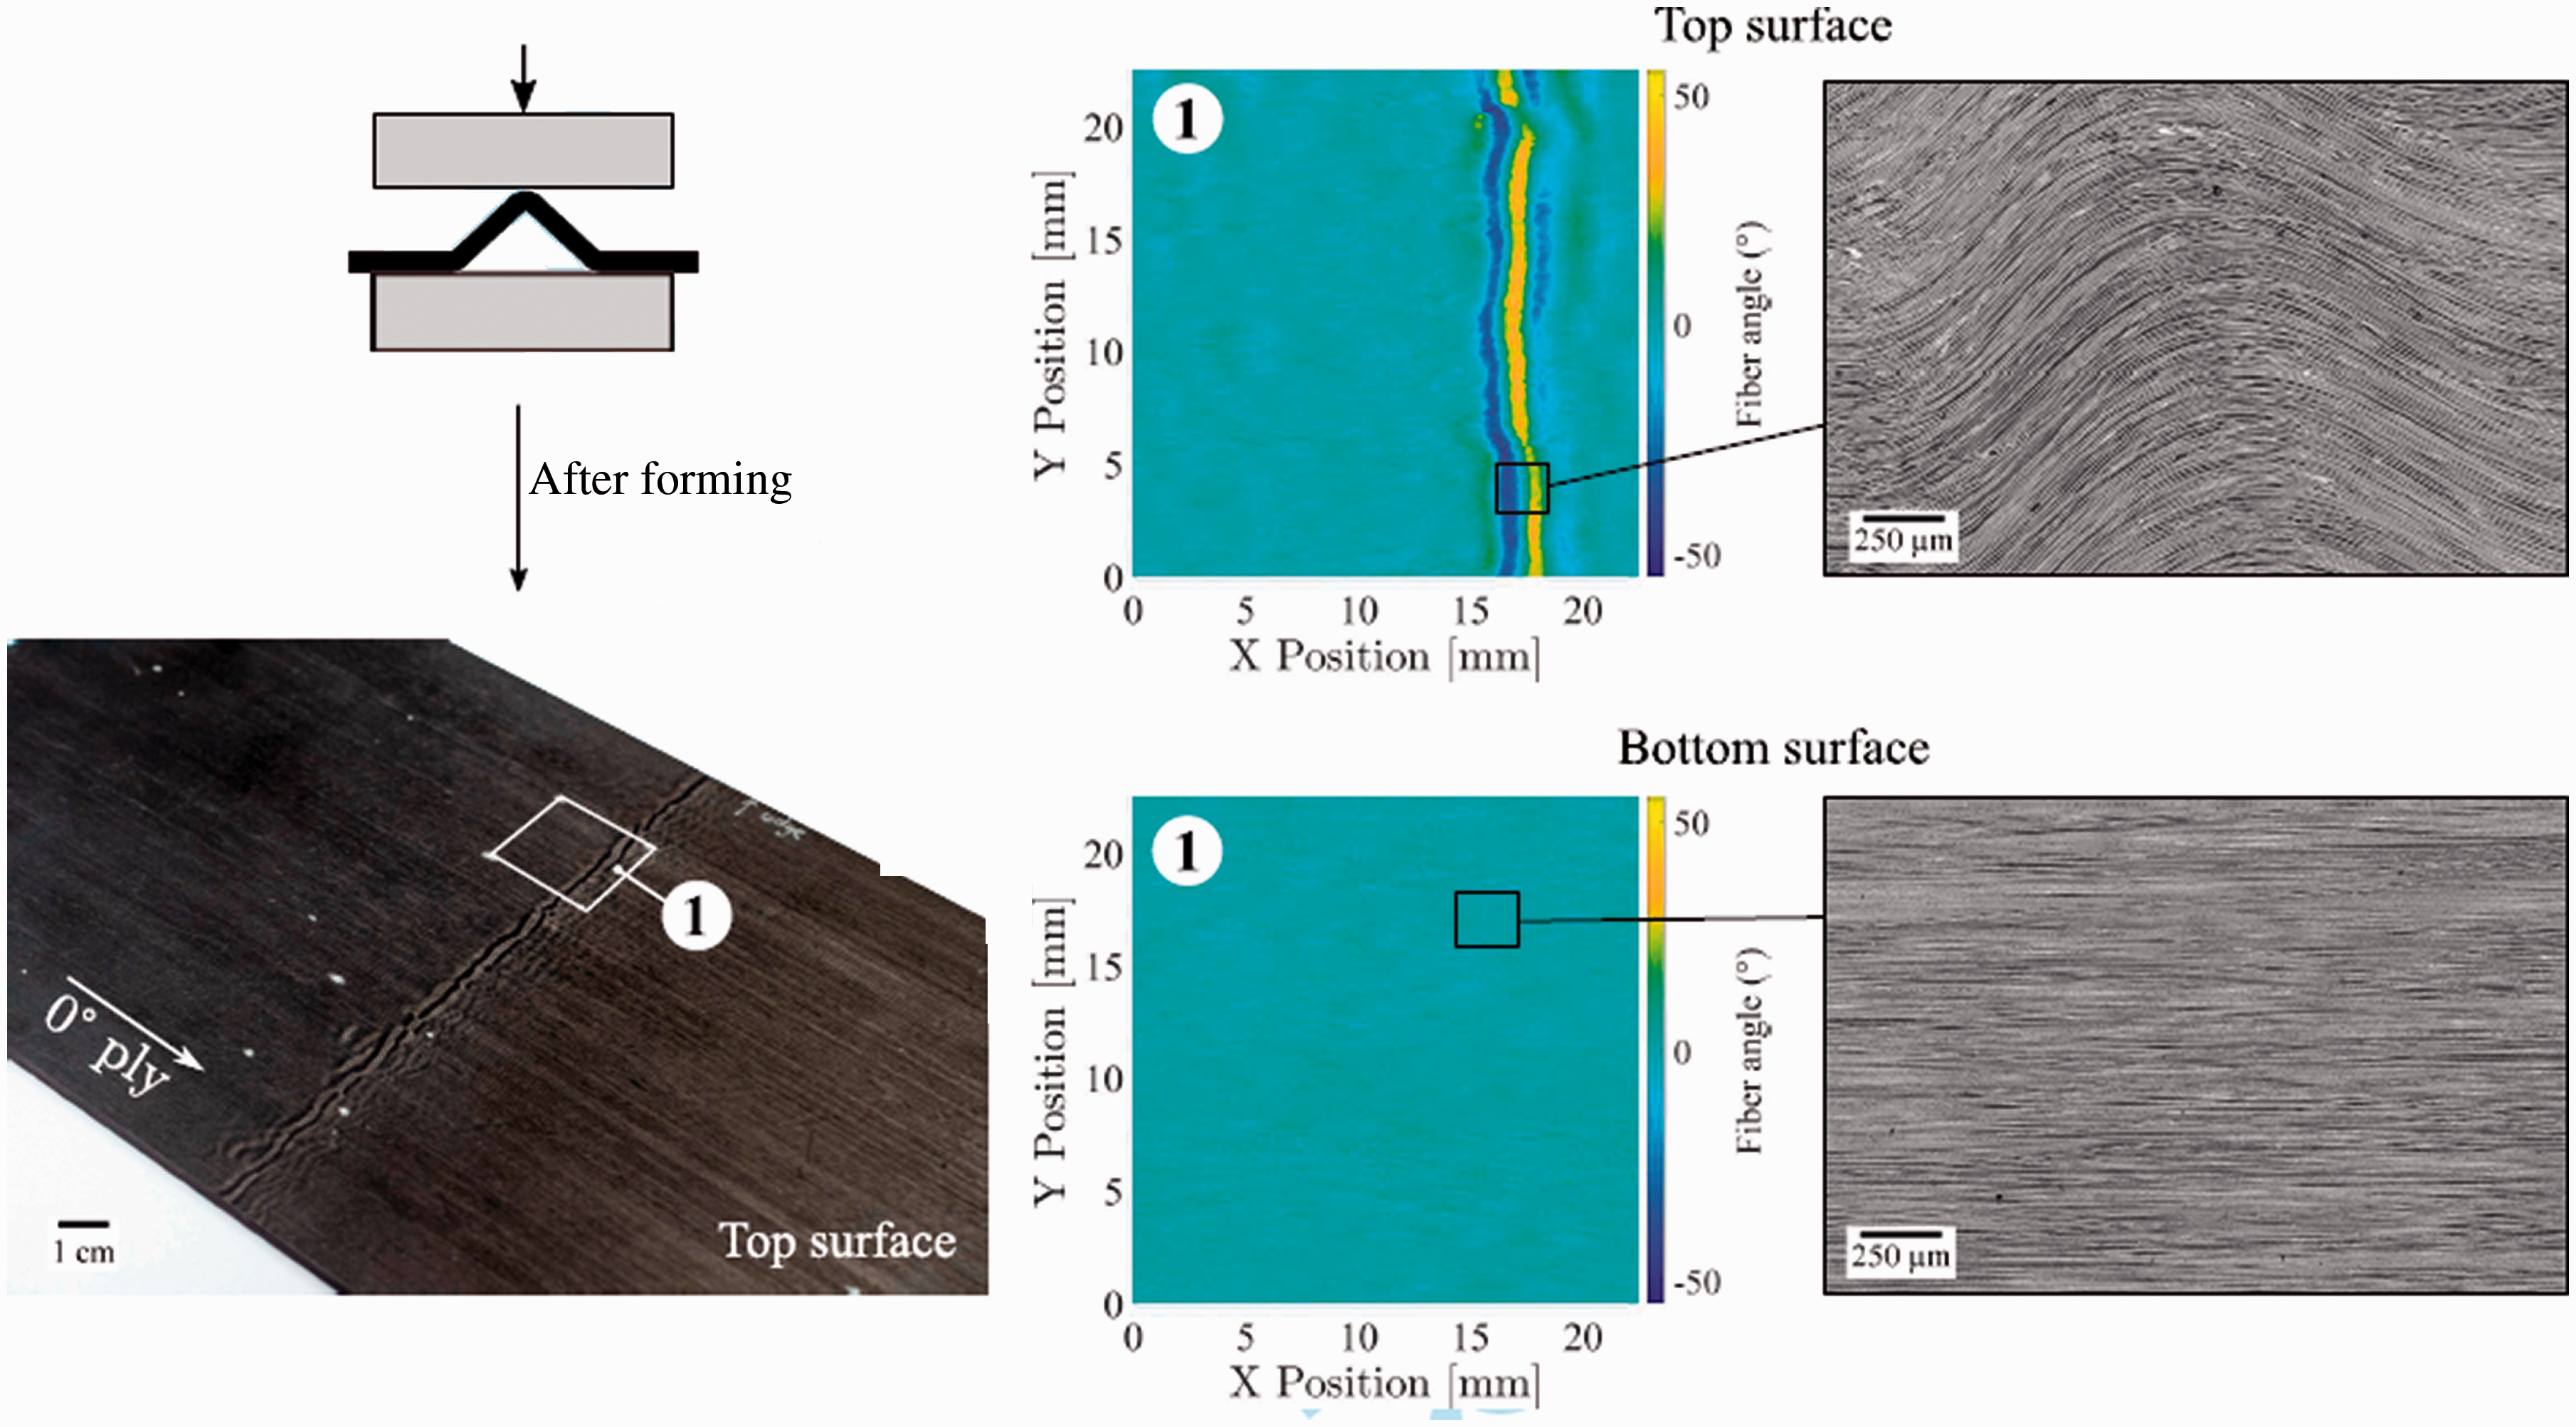
Reverse forming result of the QI1 laminate. In-plane waviness is visible only from the location which was initially the convex side of the middle V-shape corner section. The white square shown on the left picture indicates the fiber angle measurement area. The contour maps visualize the spatial distribution of fiber angles measured from the surface micrographs as taken from both the top and bottom surfaces within the white square.
The characterization results from the surface micrographs, such as the one illustrated in Figure 12, for all reverse forming experiments are shown in Figure 13. The measured maximum waviness angle (
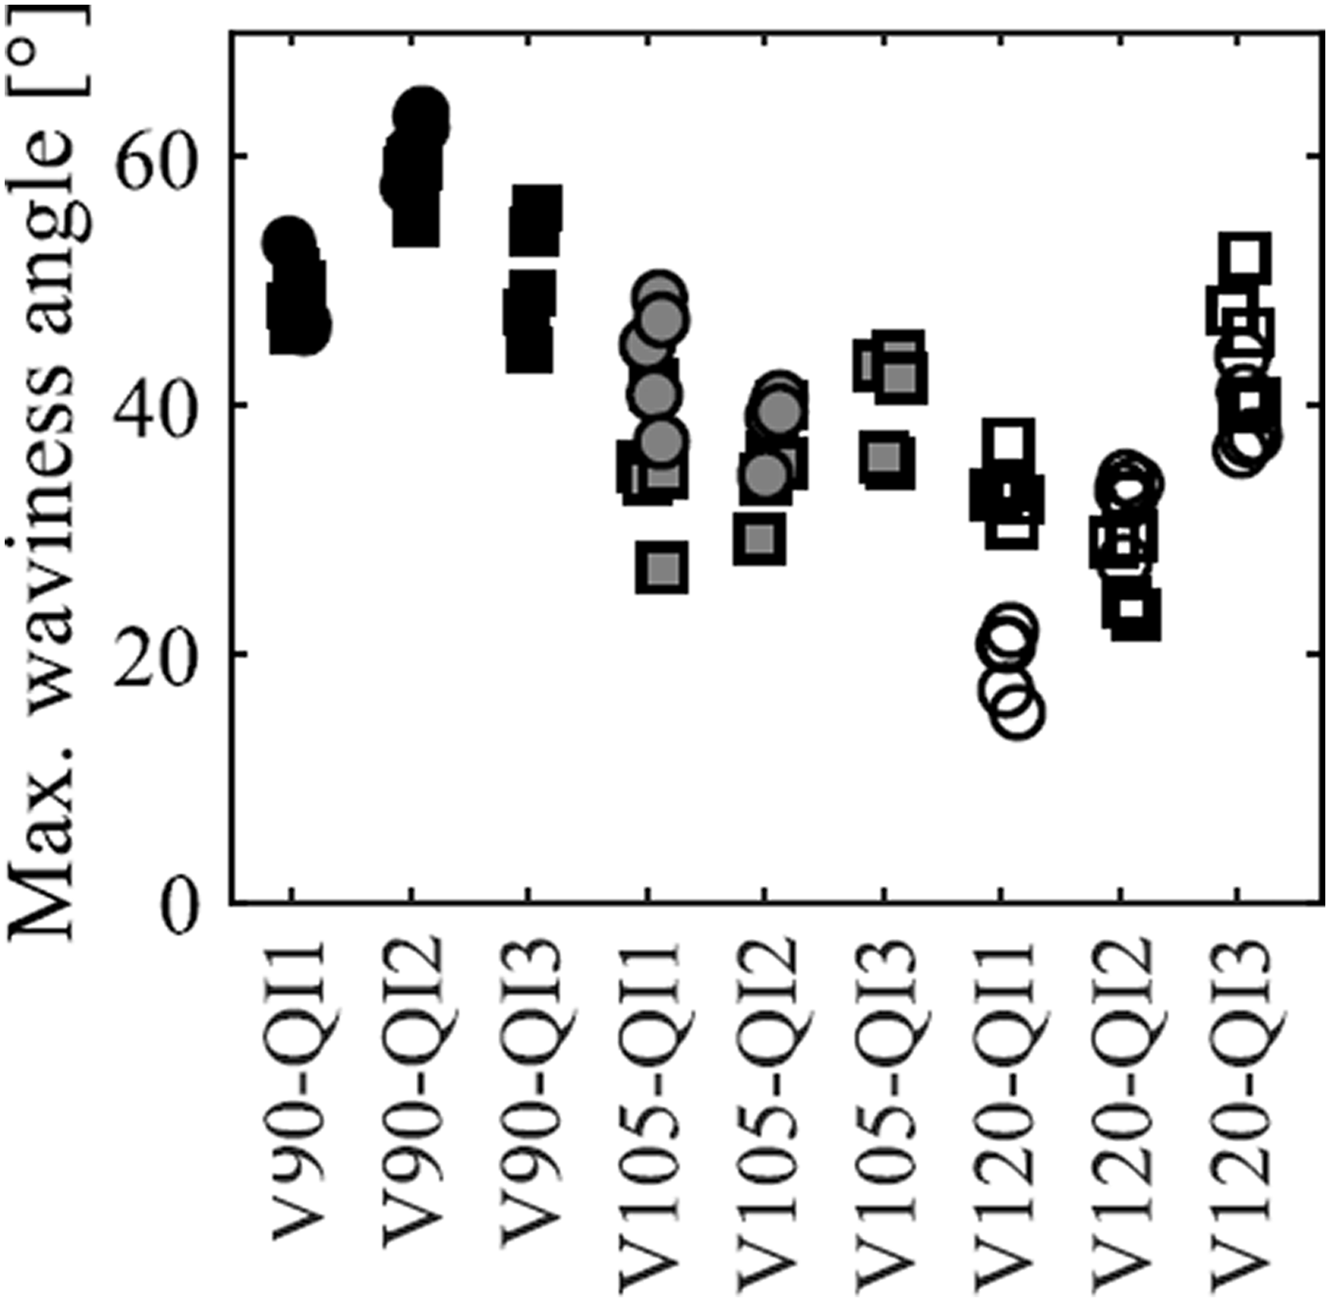
Maximum waviness angle (
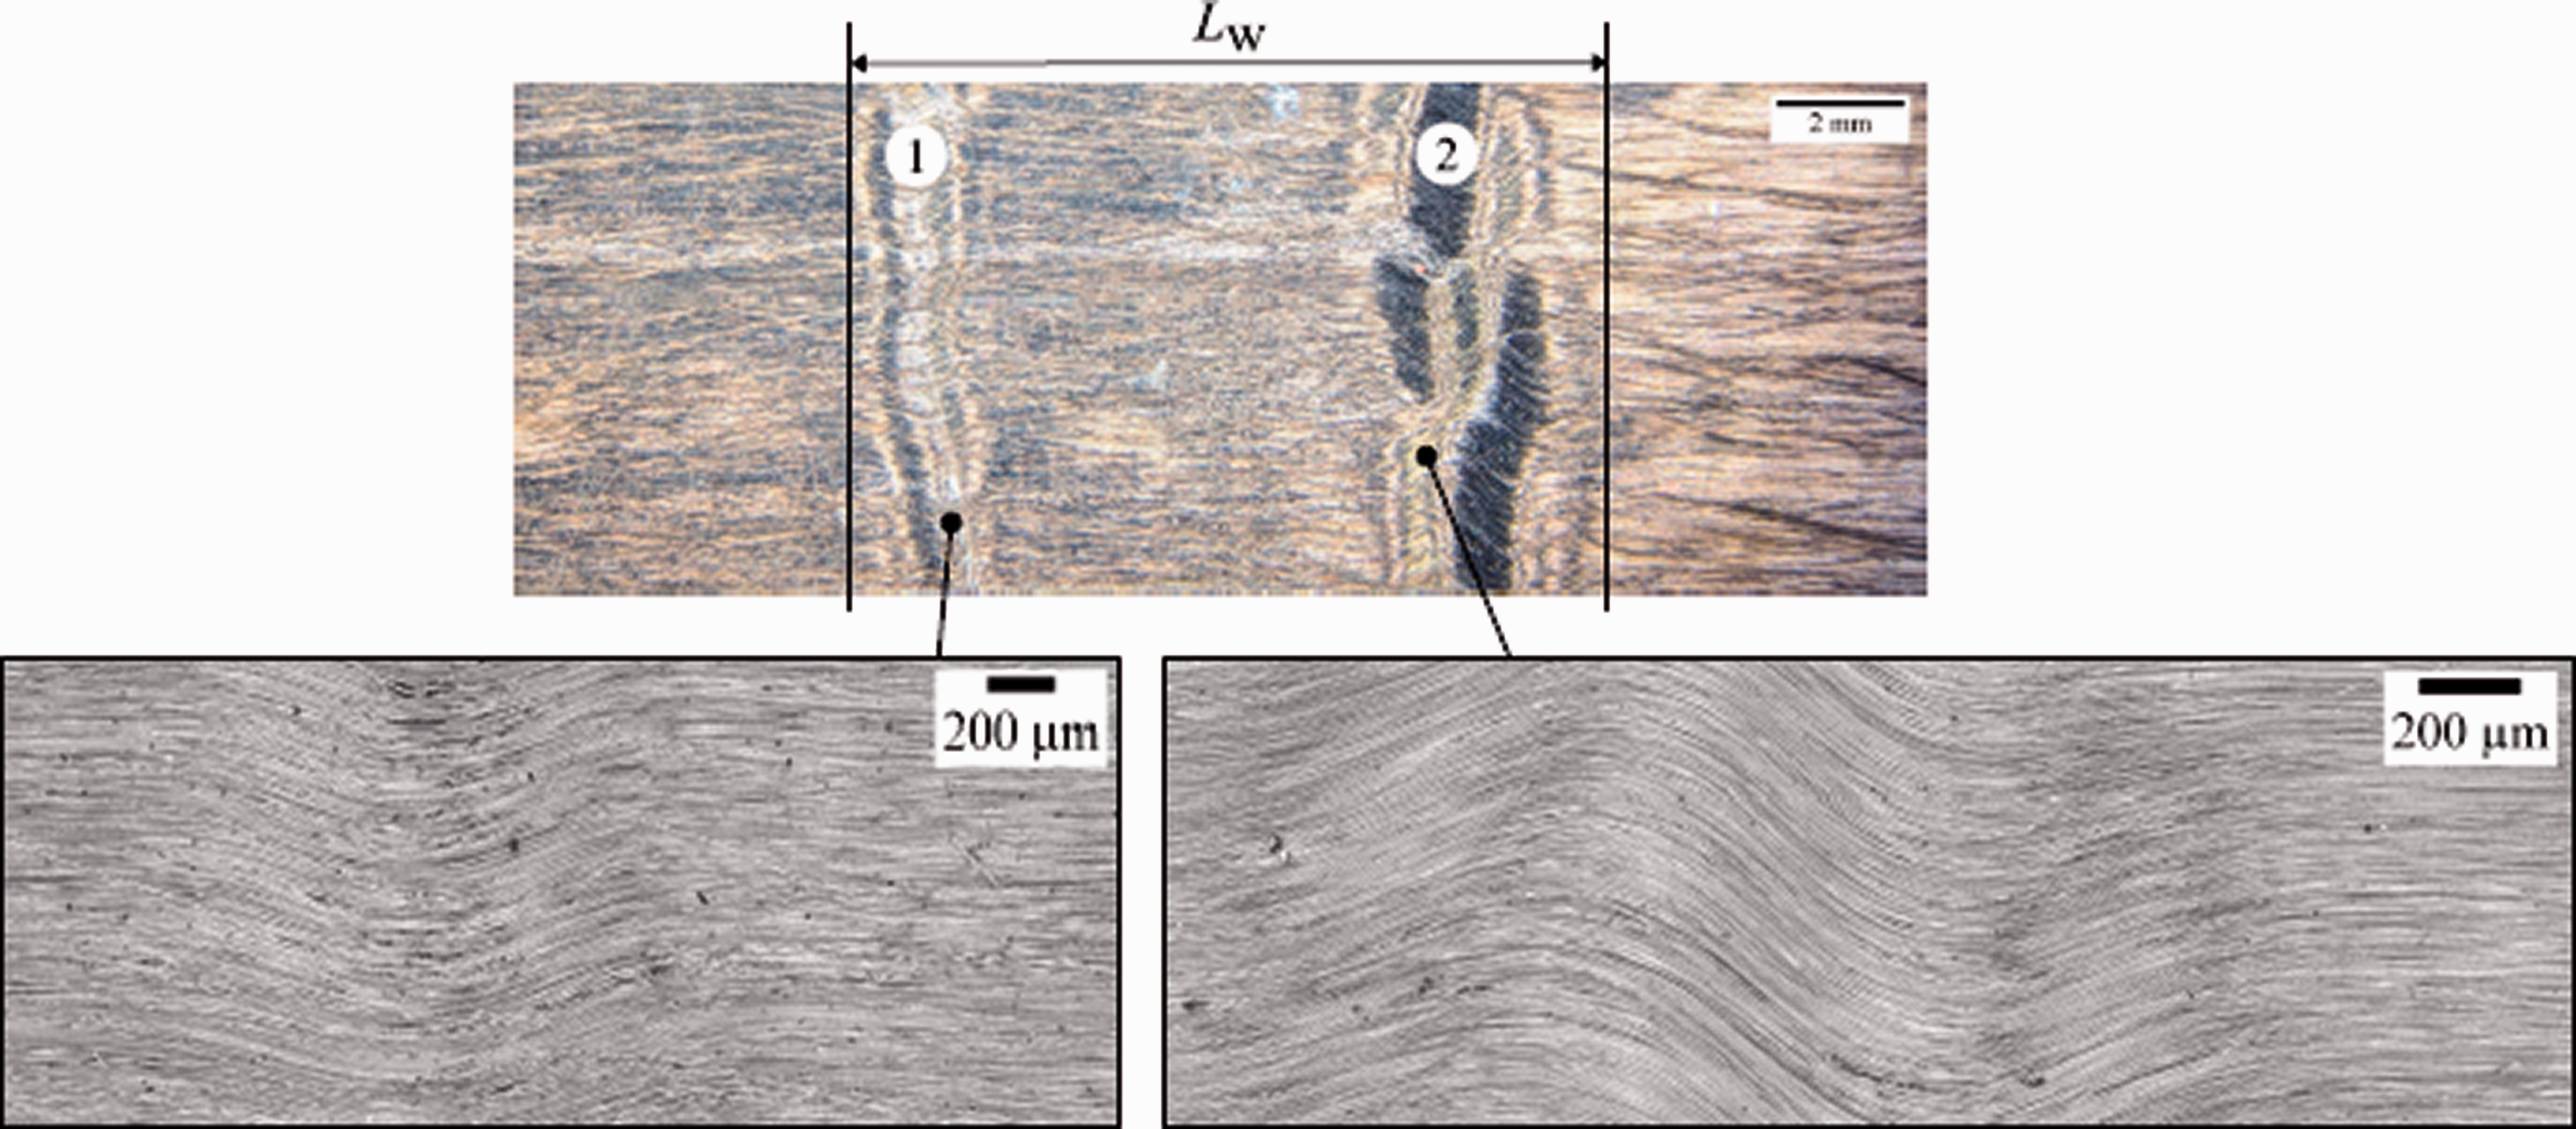
All of the industrial parts evaluated in this work have multiple wavy patches scattered on the concave surface. An example of the fiber waviness found in an industrial stamp-formed part is shown on the right side of Figure 14. The waviness reproduced in this work (see the left figure in Figure 14) clearly mimics the appearance of waviness from the industrial example. The comparison of
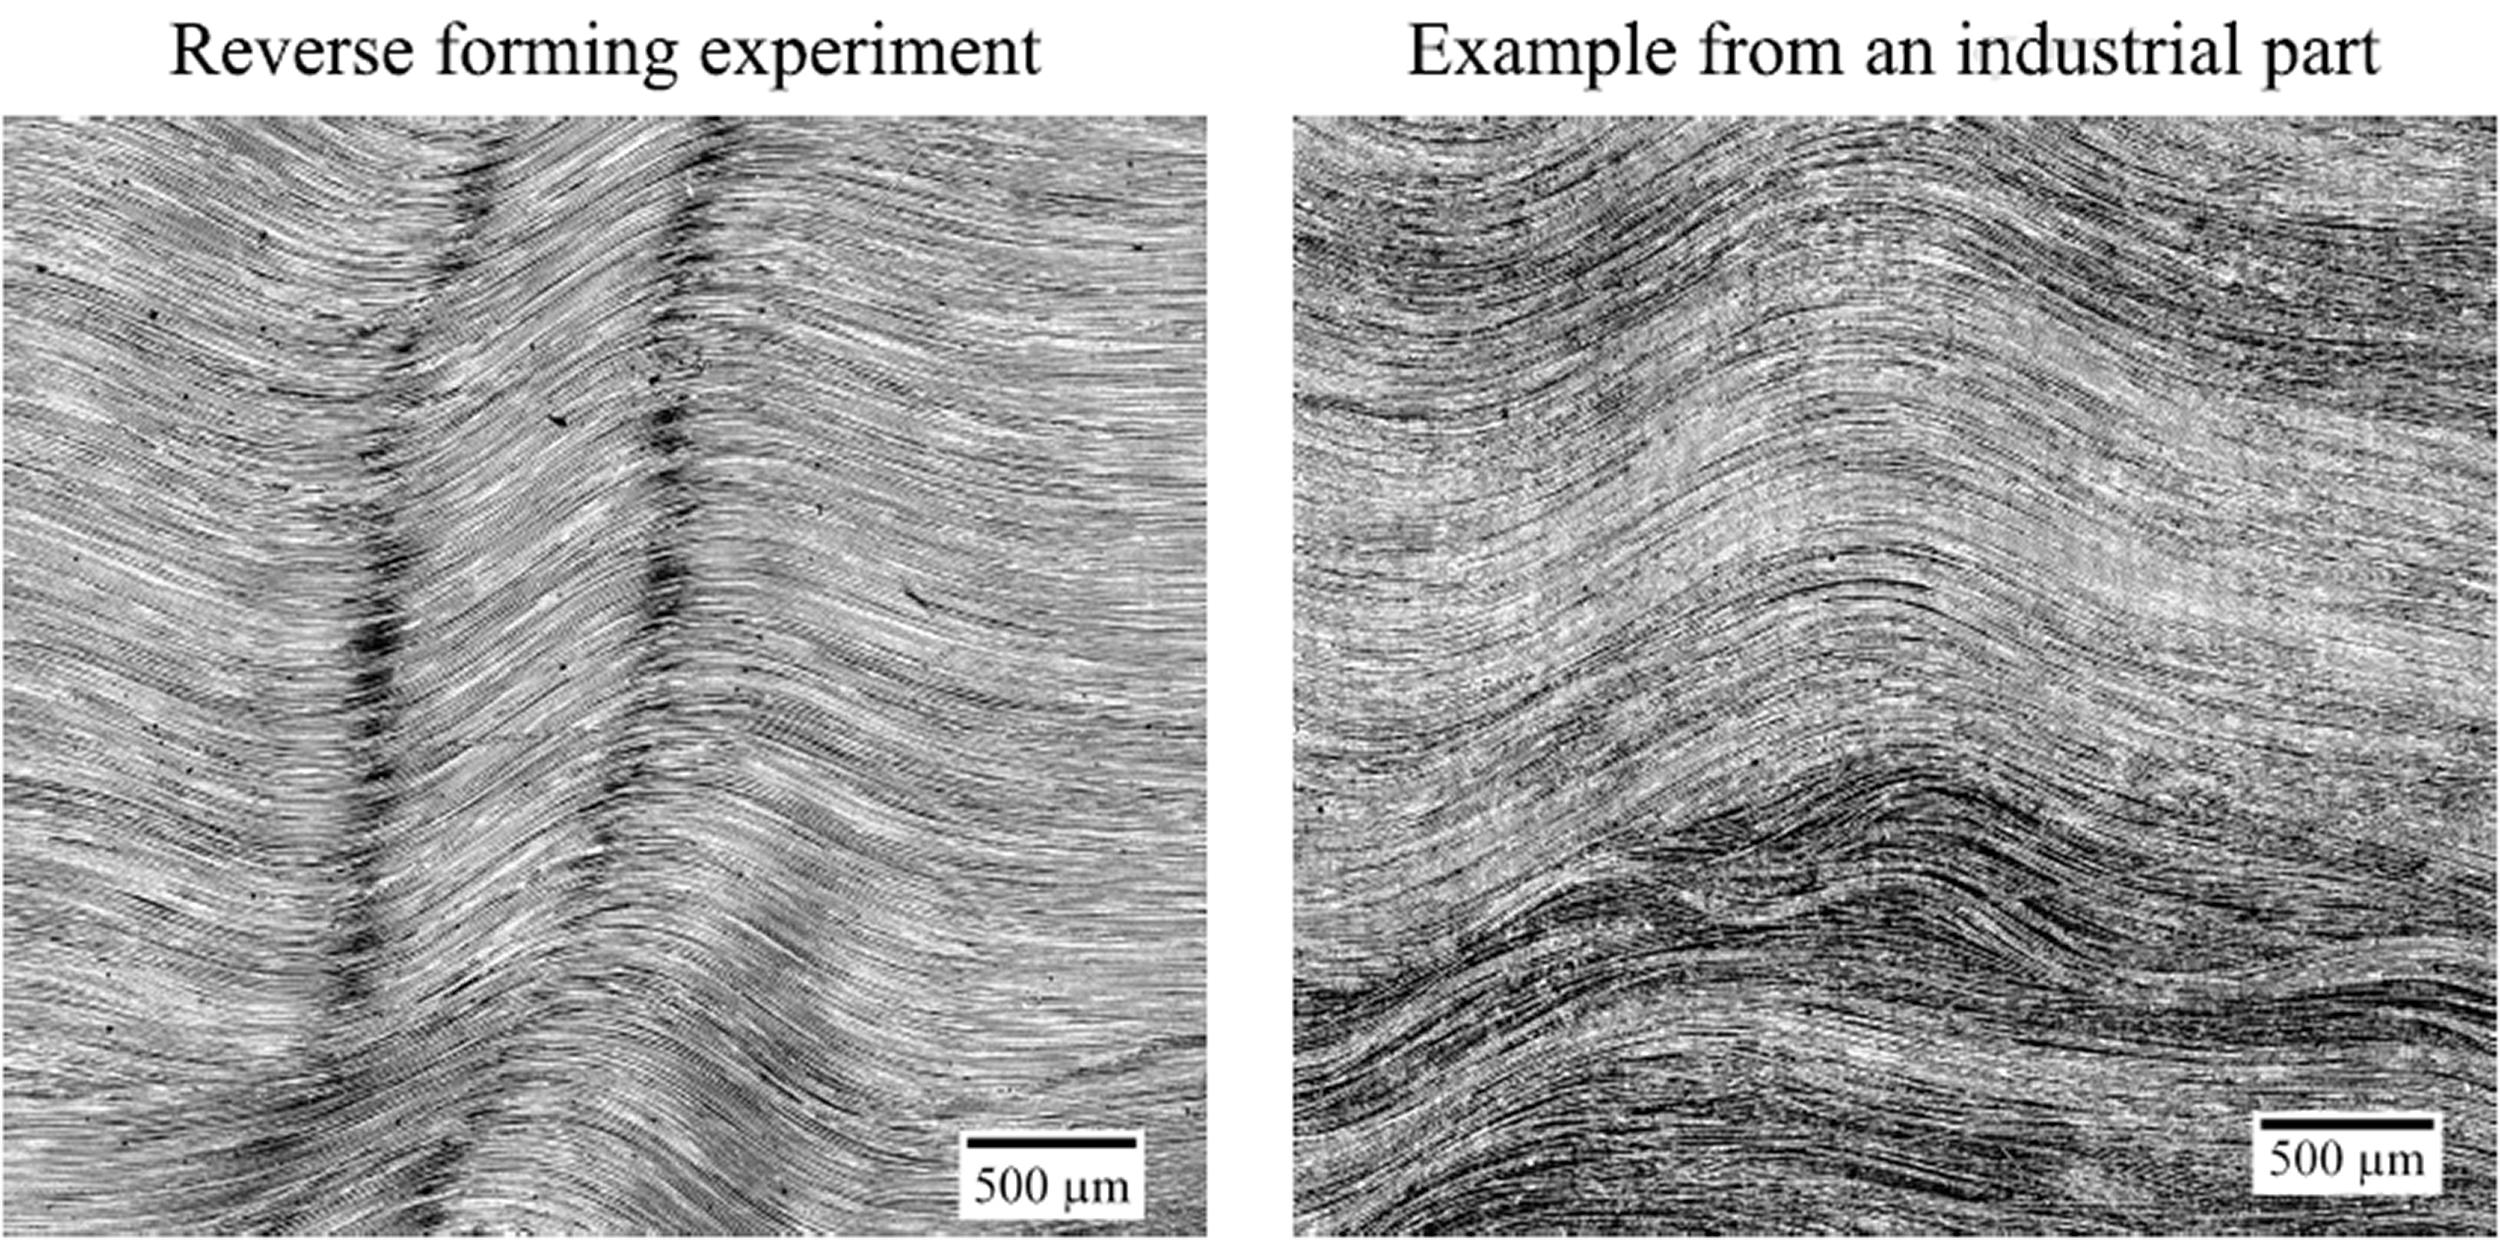
Sections of the typical waviness found on the surface of a reverse-formed laminate and from a stamp-formed industrial part.
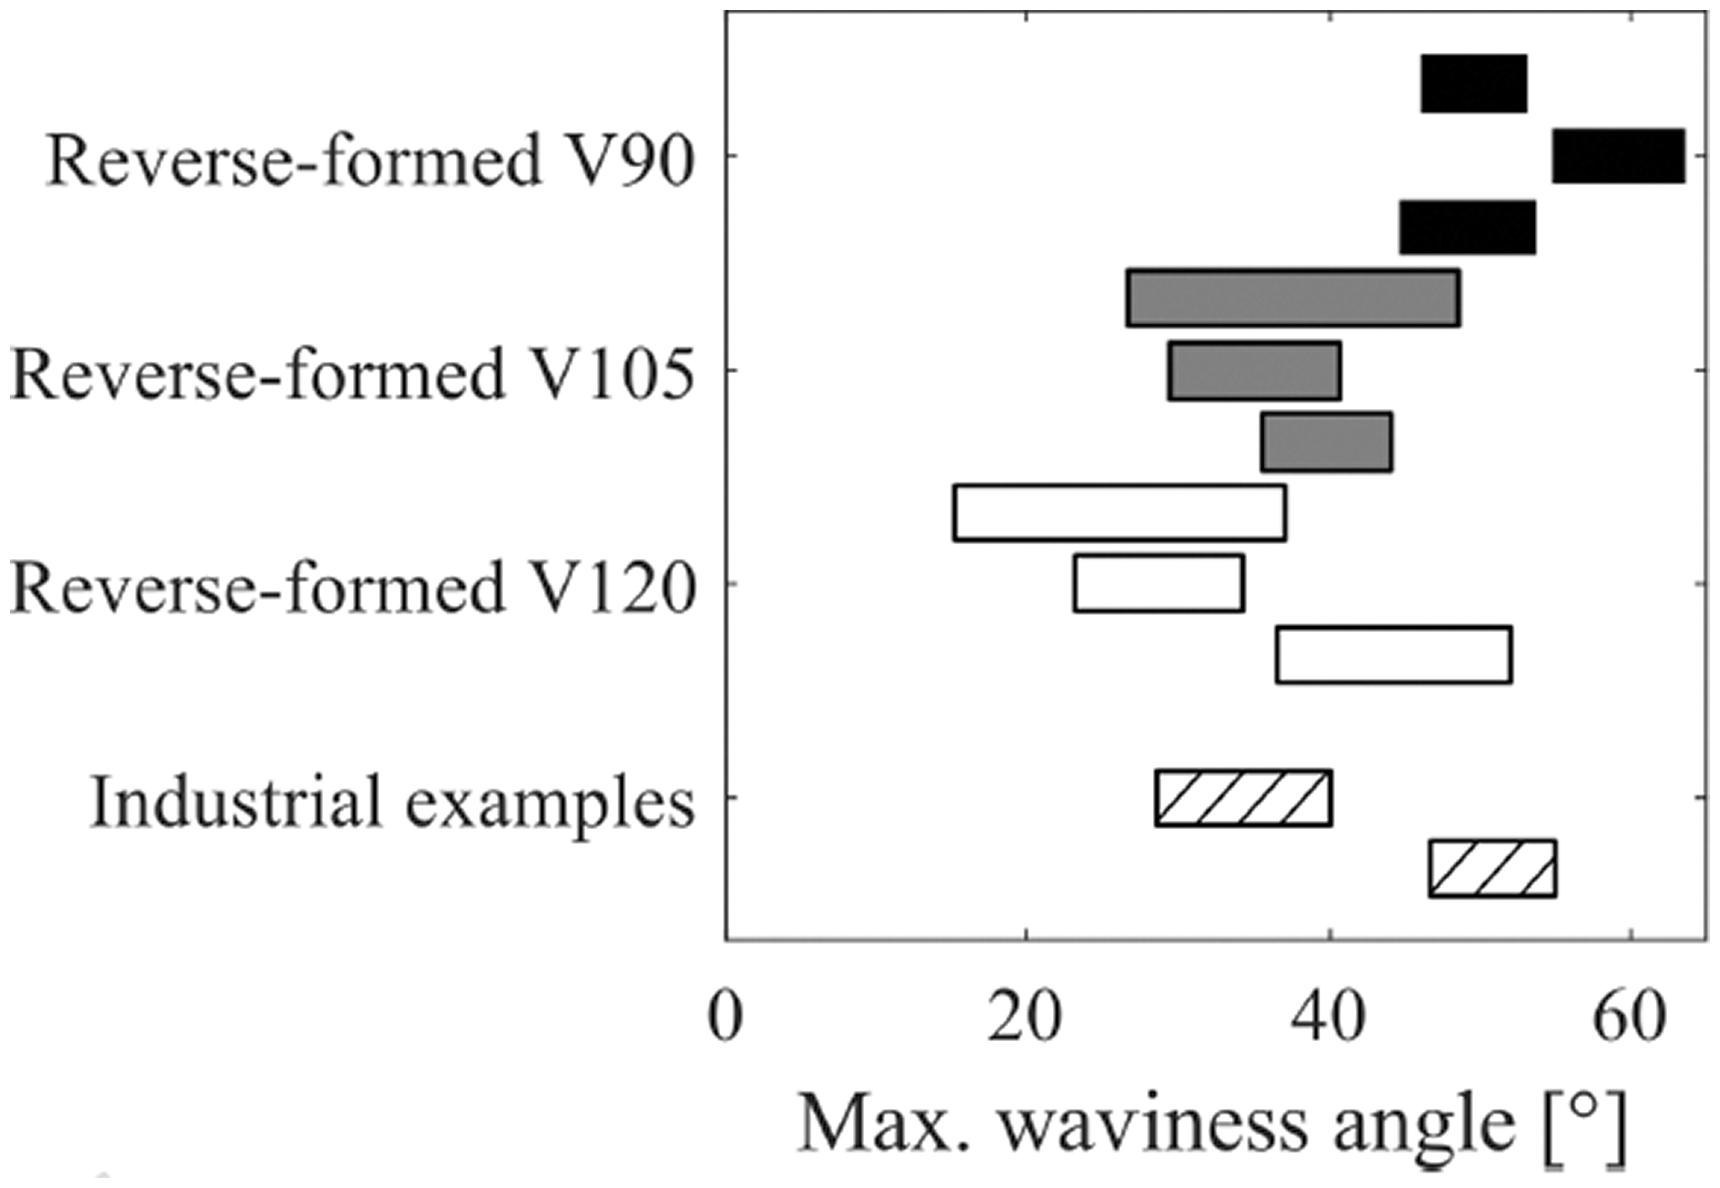
Comparison between the range of maximum waviness angle (
Discussion
The developed coupon manufacturing method makes use of stamp forming and thus employs the same conditions under which waviness is formed during this process in industrial practice. It is worth mentioning that the laminates have been exposed to two thermal cycles which represent the stamp forming process. A separate study on the thermal stability of the same material, however, has shown that no significant change in the degree of crystallinity was found even with a much longer exposure time of up to 20 minutes in the IR oven with the temperature set at 470°C. 27 This indicates that there is no significant degradation, even in a much more severe condition.
The first stamp forming step to manufacture the V-shape part already induced waviness in the inner radius. Similarly to that, the waviness from the industrial stamp-formed parts was also only observed on the concave surface. It is known that bending of a laminate with different fiber orientations is dominated by inter-ply slip to accommodate the path length difference of each ply around the bend. 11 During forming of a radius, if the inter-ply slippage is inhibited by inter-ply friction or constrained boundary conditions, axial compressive stresses are built up in the plies. The fibers in the plies at the inner radius can buckle when the critical buckling stress is reached. After the second stamp forming step, the waviness was only visible on one surface, as shown in Figure 12. The wavy region in the reverse-formed laminate was localized in the middle of the laminate where the convex side of the middle V-shape corner section was initially located. As mentioned earlier, bending of a blank requires inter-ply slip. As a result of this deformation, the plies at the inner radius have slipped with respect to the plies at the outer radius. During heating in the IR oven, when the matrix has melted, the V-shape part was already unfolded into a somewhat flat laminate due to the tension from the springs. In this stage, the excess ply length manifested mainly in the middle outer radius of the V-shape part. After the application of pressure during the second stamp forming step, waviness was formed at such region with excessive material. Similar to the wrinkle formation mechanism over a radius, the excess material in this case has to be accommodated through buckling of the fibers in the form in-plane waviness.28–30
As previously observed from the cross-sectional micrographs, the reverse forming method appears to satisfy the first requirement, i.e. the technique is able to produce laminates with good consolidation quality. Furthermore, the X-Ray microCT scan and the micrographic analysis of the cross-section confirmed that the wavy plies were induced only in the outermost 0° plies that are oriented in the bending direction of the laminate during forming. Up to three 0° plies, which were stacked directly on top of each other, were found to be wavy. The extent of the waviness through the thickness of a ply was found to be consistent for all of the QI1 and QI2 samples, irrespective of the bend angles used during the forming experiments. However, for the QI3 samples, there were slight variations in the thickness of the wavy region within the third innermost 0° ply (see Figure 11). This may be explained by the variation of compressive force through the thickness that was induced during the reverse forming process.
The characterization results showed that a wide range of maximum waviness angles between 14° to 64° was obtained from the forming experiments. As expected, the larger the bend angle and inner radius of the V-shape, the smaller the waviness severity (in terms of
The applicability of the reverse forming method to mimic the typical waviness defects observed from TPC part production is evaluated by comparing the
Finally, considering the last requirement of the coupon manufacturing method, the localized waviness in the laminates produced in this work are well suited for extracting standard mechanical test coupons. The defective region lengths in all of the produced laminates are smaller than the 20 mm requirement which conforms to the required length for the unsupported gage section of standard CLC test coupon. 25 As an example, Figure 16 illustrates the layout of the laminate after trimming. Five CLC test coupons according to the dimensions in ASTM D6641 25 can be cut out from the laminate in such a way that the wavy region can be isolated within the unsupported gage length of 20 mm. Although this work has only demonstrated to reproduce waviness in compression test coupons, the same manufacturing method can be used to fabricate test coupons meant for other types of standard mechanical testing typically performed for material qualification. This is possible since the laminate manufactured using the reverse forming method is in principle a generic flat laminate.
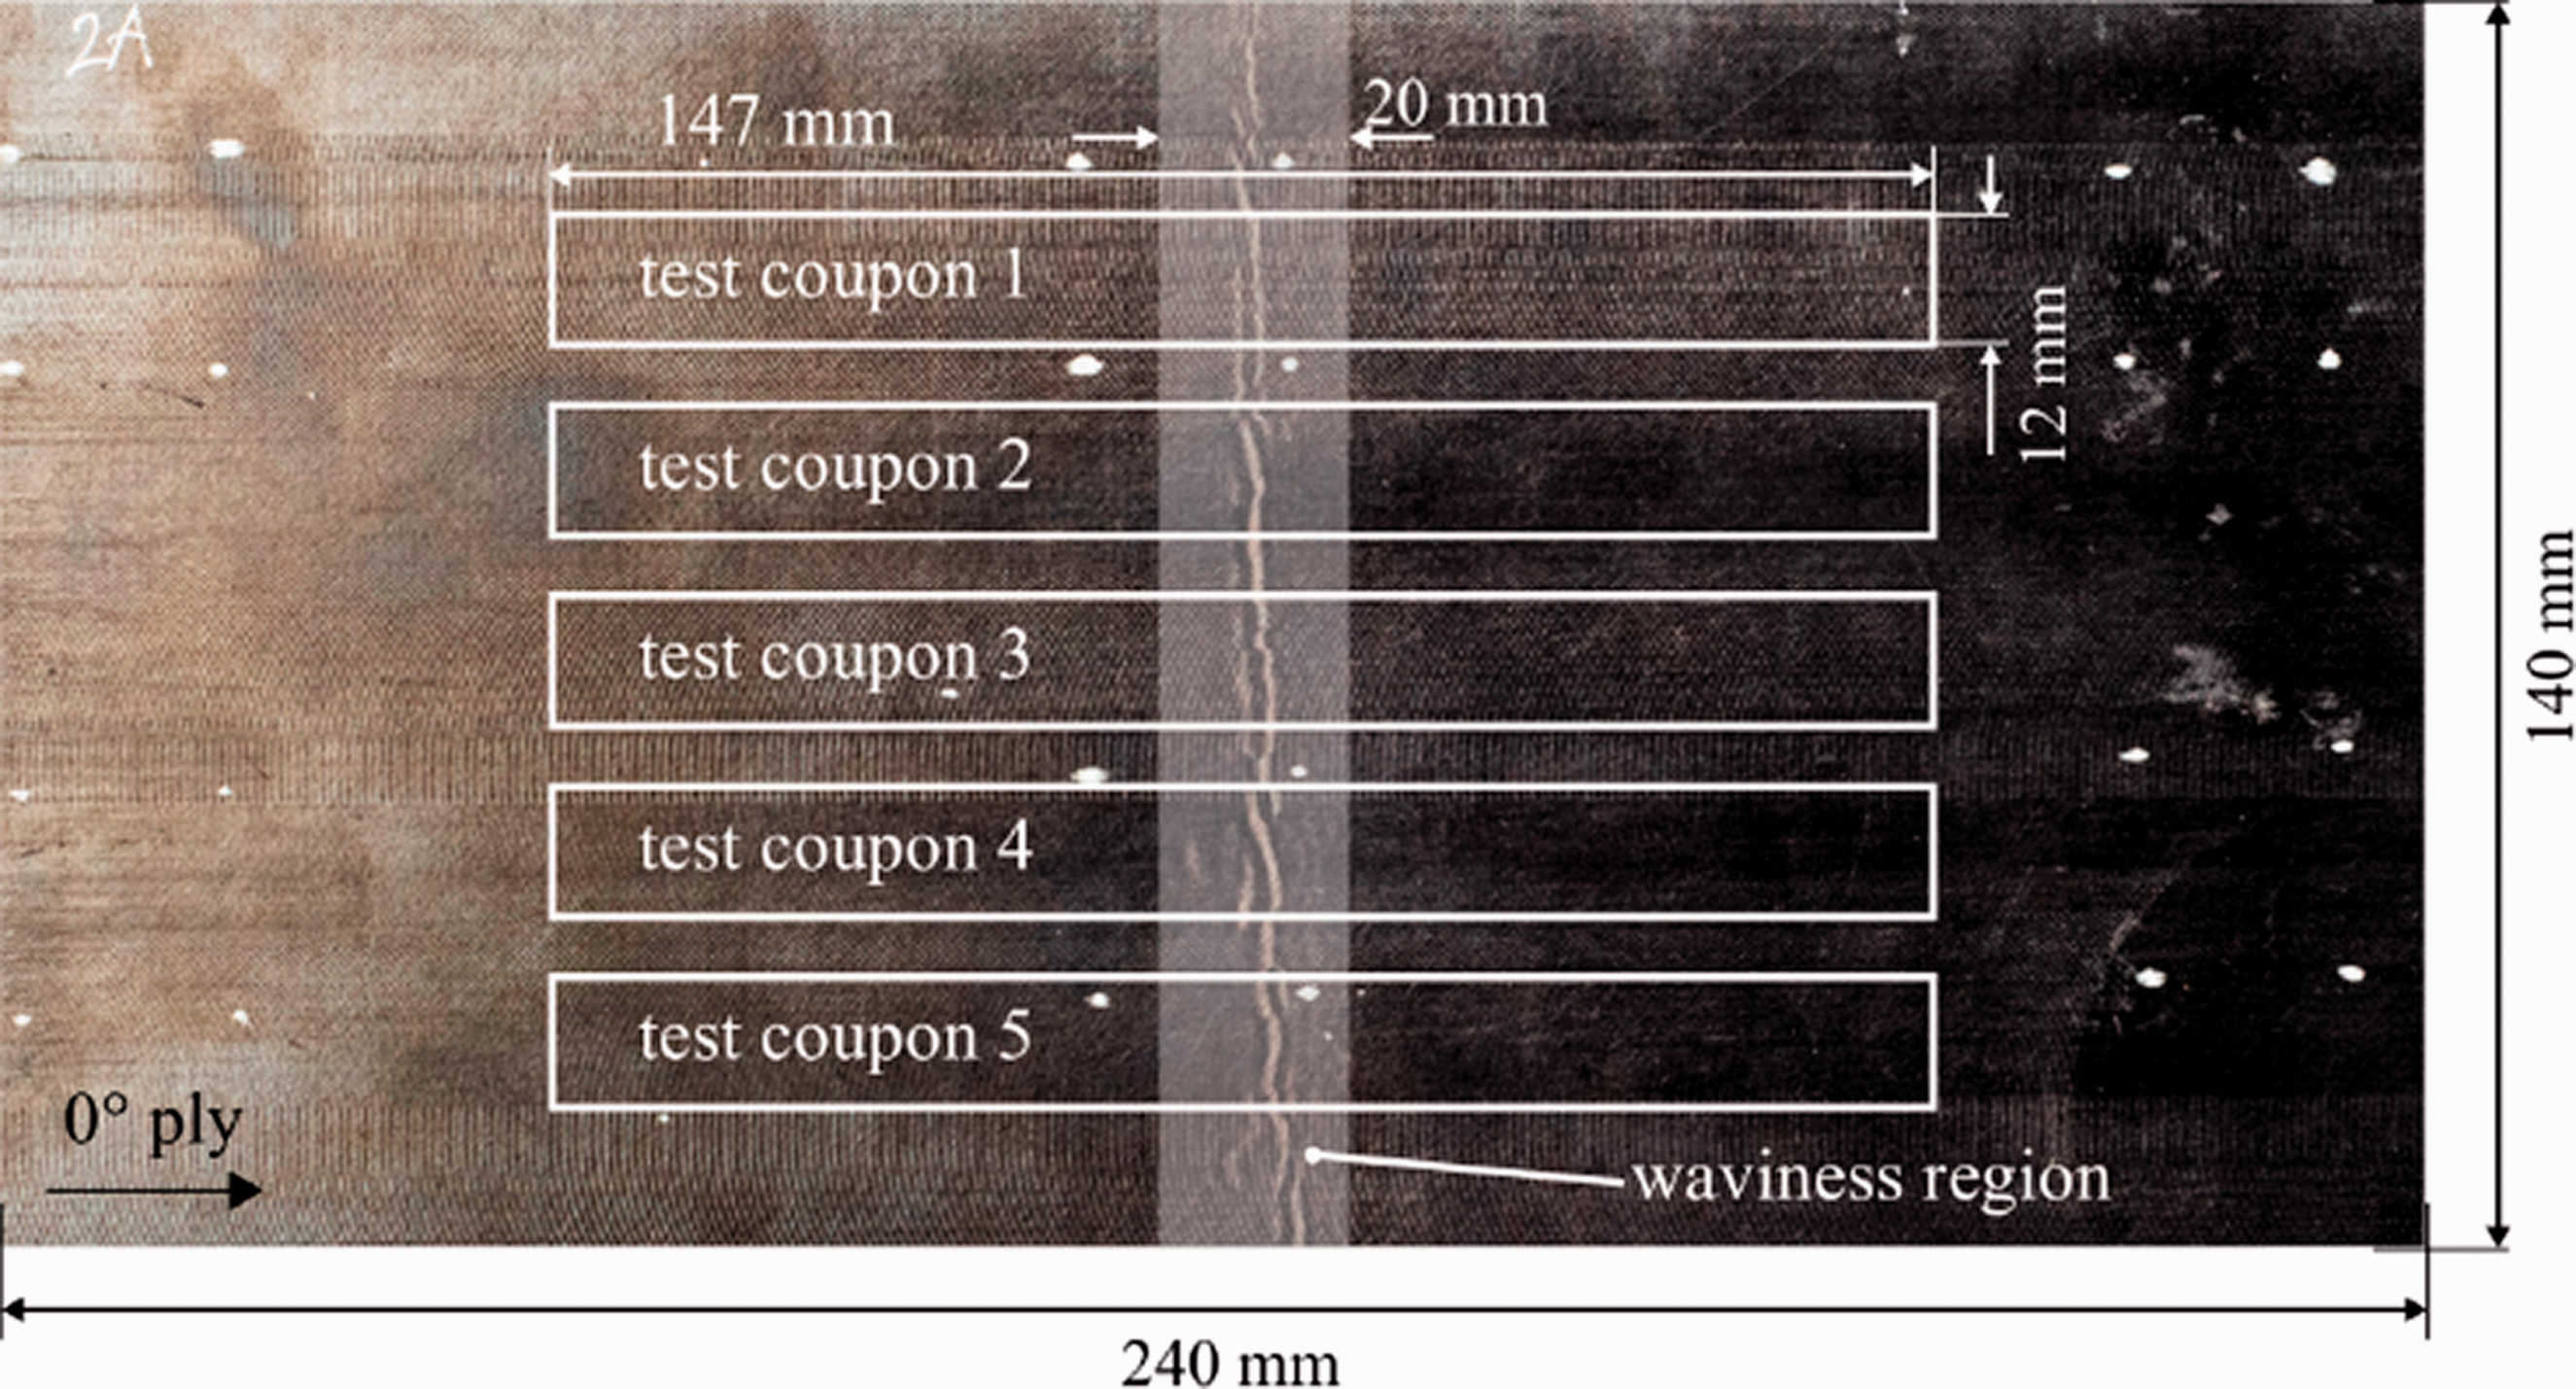
Layout of the laminate with the reproduced waviness and test coupons for standard compression test following the CLC test method according to ASTM D6641.
Conclusions
A test coupon manufacturing method based on a so-called ‘reverse forming’ process has been described in this paper. This method works by unfolding a V-shape part using a stamp forming process and therefore directly mimics the mechanisms by which waviness is formed during this process in industrial practice. With this manufacturing method, the intended wavy plies have to be oriented in the bending direction of the laminate during forming. Several combinations of bending angles and inner radii of the V-shape geometry were evaluated in this work to control the waviness severity.
The experimental results showed that all of the formed 24-ply QI laminates have no voids. Analysis of the surface micrographs showed that a wide range of maximum waviness angles (
Footnotes
Acknowledgements
The authors would like to thank National Institute for Aviation Research (NIAR) for the support in the micro-CT scanning.
Declaration of Conflicting Interests
The author(s) declared no potential conflicts of interest with respect to the research, authorship, and/or publication of this article.
Funding
The author(s) disclosed receipt of the following financial support for the research, authorship, and/or publication of this article: The authors gratefully acknowledge the financial and technical support from the industrial and academic members of the ThermoPlastic composites Research Center (TPRC), as well as the support funding from the Province of Overijssel for improving the regional knowledge position within the Technology Base Twente initiative.