
Abstract
This study investigates the movement of moisture and associated heat loss from the sock to the microclimate and external environment in mountain footwear. As it is not how much sweat is produced, but how much of it can evaporate, a thorough study was carried out to analyse the various contributions to heat exchange in this context. The tests were performed on a thermal manikin with a 100% cotton sock loaded with different amounts of water (0g, 5g, 15g, and 30g) at 10°C and 50% RH. Long-term tests were carried out with the maximum amount of water loaded (30g) to observe the different phases of heat and mass transfer until complete evaporation of all moisture (both from the socks and from the boots). In addition, evaporation tests were performed under semi-isothermal conditions (Tamb = Tman = Tsocks) at 34°C and 12% RH (same vapour pressure as in the cold tests) to isolate the evaporative contribution without any conductive, convective or condensing heat loss component. The actual effect of the evaporation was compared with the theoretical estimates from the mass-loss method. It was found that heat loss by evaporation was overestimated as a fraction of water evaporated from the socks underwent condensation in the boots, which does not contribute to cooling the system and returns heat to the system.
Introduction
When exposed to a cold environment, humans try to maintain their thermal balance through behavioral or physiological changes. When behavioral changes (i.e. change of clothing, posture or location) are not sufficient, the human body uses two important physiological strategies: cutaneous peripheral vasoconstriction and shivering thermogenesis. 1 If the heat produced by the body is higher than the heat lost, the low body temperature rises, otherwise it falls. Humans are homeotherms and need a relatively high deep body temperature to survive. But humans are also endothermic, that is the regulation of body temperature is based on internal heat production. 2
Mountaineering is by nature a physically demanding activity that requires endurance, strength, and agility. Although it usually takes place in cold environments, the exertion associated with climbing can lead to significant sweating. According to previous predictions on sweat production, for an average person with a Body Surface Area (BSA) of 1.8 m2, the equivalent of 410,000 glands can be found on the feet, 77% of which are located on the plantar surface,3–5 but 60%–67% of the sweat produced is located in the dorsal region. With a 0.5°C rise in deep body temperature, a resting individual can produce at least 27 mLh−1 of sweat from each foot.5,6 Since cold-protective footwear usually contains impermeable or semi-permeable membranes that prevent water penetration from the outside, sweat generation inside the footwear tends to be the largest factor contributing to the decrease in insulation. The worsening effect of impermeable membranes in cold environments has already been noted by Havenith et al. 7 Previous studies 8 have shown that even a very low sweating rate can cause a significant change in the insulation of footwear. This is because water can conduct heat 23 times better than air. 9 So, when sweat evaporates from the skin surface and vapor reaches the colder surfaces of the boots, it condenses, replacing air in the insulating layers of the boots. When water condenses on the inside of the boot, the latent heat carried by the water vapor is converted into sensible heat, 10 increasing the temperature of the affected area. The presence of condensation not only affects the thermal properties but also the perception itself, that is, the thermal comfort of the wearer. Apart from causing a rapid drop in temperature as soon as the metabolic heat produced decreases, if sweat evaporation cannot keep up with the sweating rate, the presence of wetness disrupts the interaction between skin and fabric and leads to a feeling of stickiness. In extreme cases, condensation within a garment with low vapor permeability can contribute to a rapid loss of body heat post-activity and increase the risk of hypothermia, especially in cold and wet conditions. However, the synergy between these two mechanisms (evaporation and condensation) that form the water cycle in such a system is more complex than it appears at first glance.
The presence and influence of heterogeneous air layers that reinforce this cycle between the skin and the clothing system (i.e., the footwear) should also be considered.11,12 In their study, Ghali et al. not only emphasized the contribution of this factor to heat and mass loss in the system (by increasing the absorption speed of the clothing system), but also outlined how the presence of heterogeneous layers of air affects thermal properties. They demonstrated that these layers influence the sequence of sweat evaporation and subsequent condensation, and further elucidated that the quantity of mass loss from the boots to the outside (in terms of sweat) is not directly connected with the amount of heat lost as also observed by Havenith et al.13,14 This study aims to analyze in more detail the different phases of the water cycle and their effect on heat loss in the human-boot system using different amounts of water (to simulate different sweating rates) on a thermal manikin. In contrast to previous work15,16 conducted on a foot thermal manikin, this study focuses on the entire foot area to observe the effects of the change of state and movements of the water on the thermal properties of the system.
Materials and methods
Experimental set-up
The measurements were carried out with the “Newton” thermal manikin (Thermetrics, Seattle, WA) shown in Figure 1. The manikin consists of 30 thermal zones, the temperature of which can be controlled individually using a software (ThermDAC Control Software, Thermetrics). The temperature sensors are located in each zone and protected by an epoxy coating. The temperature of each thermal zone was set to 34°C. “Netwon” Manikin (Thermetrics, Seattle, WA) and its standard thermal zones schematic.
The model simulates a male body with the following physical characteristics: 178.5 cm height (body circumferences 90.8 cm chest, 73.2 cm waist, 91.8 cm hips), and 1.8109 m2 body surface area (BSA). The energy consumed by the manikin to maintain a constant surface temperature is an indicator of heat loss to the environment.
The manikin was placed in a standing position in a climatic chamber with controlled temperature and humidity in a wind tunnel, where six fans generated a wind speed of 0.4 m/s. Wind speed, temperature, and humidity data were additionally monitored with the use of sensors placed in front of the manikin. As the study focuses on the foot-shoe system, the sensors were placed at a height of 20 and 44 cm above the ground and 30 cm away from the manikin. The experimental setup is shown in Figure 2. Experimental set-up.
As the aim of the study was to determine how moisture affects the thermal properties of the boots themselves, the whole clothing ensemble was selected and standardized in advance for the entire test procedure, with only the amount of water in the socks changing to simulate the sweat produced by an athlete. The detailed composition of the socks is shown in Table 1.
The clothing consisted of the following parts: a first top layer in contact with the manikin (Alagna half zip light fleece, Karpos, Italy), a middle top layer (K-Performance H-Loft Fleece, Karpos, Italy), an outer top layer (K-Performance GTX PRO Jacket, Karpos, Italy), thighs (KEEPWARM 900, Decathlon, France), gloves (Marmolada Glove, Karpos, Italy), trousers (K-Performance Mountaineer Pant, Karpos, Italy), ankle-socks (Adidas, Germany) and mountaineering boots (Phantom TECH HD, S.C.A.R.P.A., Italy).
The characteristics of the sock are detailed:
The internal surface of the boot is fully lined with a microfleece layer. Moving outward, this layer is overlapped by a layer of Primaloft in the lower part and toe area, given its high insulating power, polyurethane foam on the lateral sides, and honeycomb-structured polyurethane foam coupled with a polymeric mesh in the upper tongue area. The outermost layer of the boot consists of a waterproof membrane-laminated polyester fabric. A more detailed picture of the boot’s composition is shown in Figure 3. The thermal conductivity and thickness properties of the materials, obtained through testing in accordance with UNI EN ISO 9920:2007 and UNI EN ISO 5084:1998 standards, are reported in Table 2. Material composition. Socks fabric characteristics. Properties of the materials involved.


Sweat production was simulated with different amounts of water loaded onto the socks (0g, 5g, 15g, and 30g). The amount of water was indicated based on works that measured the regional sweating rate3–5,17 and on previous studies on human participants simulating real-life activity with the same level of insulation worn. 18 In addition, for the larger amount of water (i.e., 30g), the different stages of the process of evaporation and condensation were investigated through a test of extended duration.
Experimental protocol
The socks were loaded by soaking in a water bath and then spun removing free liquid, to avoid dripping. The spin speed was set at 800 rpm for 5 minutes. Afterward, the socks were removed from the washing machine, weighed, and water was added to reach the desired weight. This process was repeated until the target weight was achieved without any dripping. Socks and boots were weighed before and after the tests to observe their weight change. Each measurement of heat flux from the manikin was repeated three times until the power consumption was constant within ±2% for 10 minutes, as specified in the International Standard ISO 15831:2004. 19 The average environmental conditions were the following: ambient temperature (Ta,1) 10.0 ± 0.5°C, relative humidity (RH1) 50.0 ± 1.8%, and wind speed (ws) 0.4 ± 0.3 m/s. A longer test was carried out overnight with the greatest amount of water (30g) to analyze the different phases until all the water loaded in the socks was evaporated from the system. Based on the observation of different phases in the long-term test, four tests with incremental duration were carried out, at the end of which the weights of socks and shoes were measured to track the progression of moisture dynamics through the system over time. An isothermal test (Ta,2 = 34 ± 0.6°C, RH2 = 12 ± 0.7%, ws = 0.4 m/s), with the highest amount of water loaded in the previous tests (30g), was carried out to avoid the contribution of convective, conductive and radiative heat transfer and to allow the test to be based solely on the evaporative heat flow. The test was repeated three times, until the results were below the acceptable threshold for deviation (i.e., ±2% for 10 minutes). The relative humidity was chosen to give the same partial vapor pressure as the previous test conditions (i.e., creating the same driving force for evaporation), but at a different ambient temperature. The data were smoothed using a Savitzky-Golay filter. This method was proposed by Savitzky and Golay in 1964 and aims to reduce noise using local polynomial least squares approximations.20,21 The filter is controlled by two different parameters: the window size and the polynomial degree. Small window sizes and high polynomial degrees can result in noisy signals (flexible smoothing), while large window sizes and low polynomial degrees can result in distorted signals (rigid smoothing). A window size of 30 and a polynomial degree of three were selected for the data smoothing in this work.
Theoretical background
Calculations have been performed according to the method proposed by Havenith et al.13,14
Dry heat loss
This value was acquired by both dry manikin and clothes:
Apparent heat loss
The “apparent heat loss” refers to the change in heat loss for the dry test when the system is wet as evaporation, increased wet conduction, and condensation may occur simultaneously.
Since the temperature of the wet layer could not be controlled, a correction for the effective temperature of the socks was performed. In this way, Dry heat loss used in Eq. 1 was corrected for the effective temperature difference between skin and environment in the wet tests according to previous works.22,23
Hl and A represent the heat loss in the foot area (Wm−2) and the surface area of the considered zone (m2). This led to correct Eq. 2 as:
Evaporative heat loss
The latent heat loss was evaluated considering the amount of water leaving the system (socks-boots) in the time:

Evaporative cooling efficiency
The evaporative cooling efficiency was estimated by the ratio between the apparent and the latent heat loss (Eq. 2 and Eq. 5):
If
Moreover, this factor gives information about the different contributions of the multiple pathways that could be undertaken by water inside of the system.
Dry thermal resistance RcT
Dry thermal resistance was evaluated as follows23,24: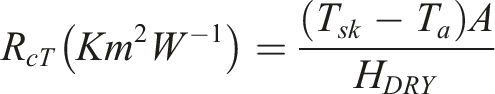
Mainly, it was considered to monitor how the presence of different amounts of water could influence footwear insulation properties.
Evaporative resistance ReT
The evaluation of evaporative resistance ReT was performed according to two different methods as already done by Wang et al.23,24

Permeability index im
Since the boots were impermeable to external water penetration, an additional parameter was used to quantify their ability to manage moisture. The calculation follows the work by
26
and the International Standard ISO 9920:2007
27
:
Water vapor absorption (WVA)
Since it was imposed a wet layer (the sock) between the skin and the boot, water sorption was supposed to happen from the sock to the shoe. This amount was evaluated as water vapor absorption (WVA).
31

Statistical
The statistical analysis was realized with Python (version 3.12.0). The most used libraries were: • scipy.stats: P. Virtanen, R. Gommers, T. E. Oliphant, M. Haberland, T. Reddy et al., and SciPy 1.0 Contributors. (2020) SciPy 1.0: Fundamental Algorithms for Scientific Computing in Python. Nature Methods, 17(3), 261-272. • statsmodel.api: Seabold, S., \& Perktold, J. (2010). statsmodels: Econometric and statistical modeling with python. In 9th Python in Science Conference.
Results and discussion
The heat losses in the foot area of the manikin, measured at 10°C and 50% relative humidity, are shown in Figure 4. Heat loss from the foot area after the first 150 minutes at 10°C, 50% RH, and 0.4 m/s wind speed.
At first glance, a net increase in heat loss was observed in the wet tests, as the amount of water in the sock was higher. However, this aspect is not the only effect of moisture: different amounts of water indeed are associated with a different shape of the heat loss curve. A clustering algorithm was applied to highlight the various phases. The method was based on the K-Means approach, which identified three clusters, namely three different phases in the curves: a first plateau (stable phase) more extended as more water is loaded onto the socks, a declining phase, and a second plateau (second and final stable phase). The curve relating to the test with the lowest amount of water (i.e., 5g) did not show the first plateau but an immediate drop to a lower, stable value comparable to the curve of the dry test. In the experiment involving 5g of water loaded into the socks, the presence of only a few grams of free water prevents the establishment of a constant evaporation rate leading to the formation of the initial plateau phase.
In addition, the decreasing phases of the 15g and 30g curves were analyzed to highlight their slopes with a linear regression: The 30g test showed a steeper fall phase than the 15g which has rather similar values to the 5g curve (R230g = 0.9843, m30g = −0.3937; R215g = 0.9554, m15g = −0.294; R25g = 0.9495, m5g = −0.2537).
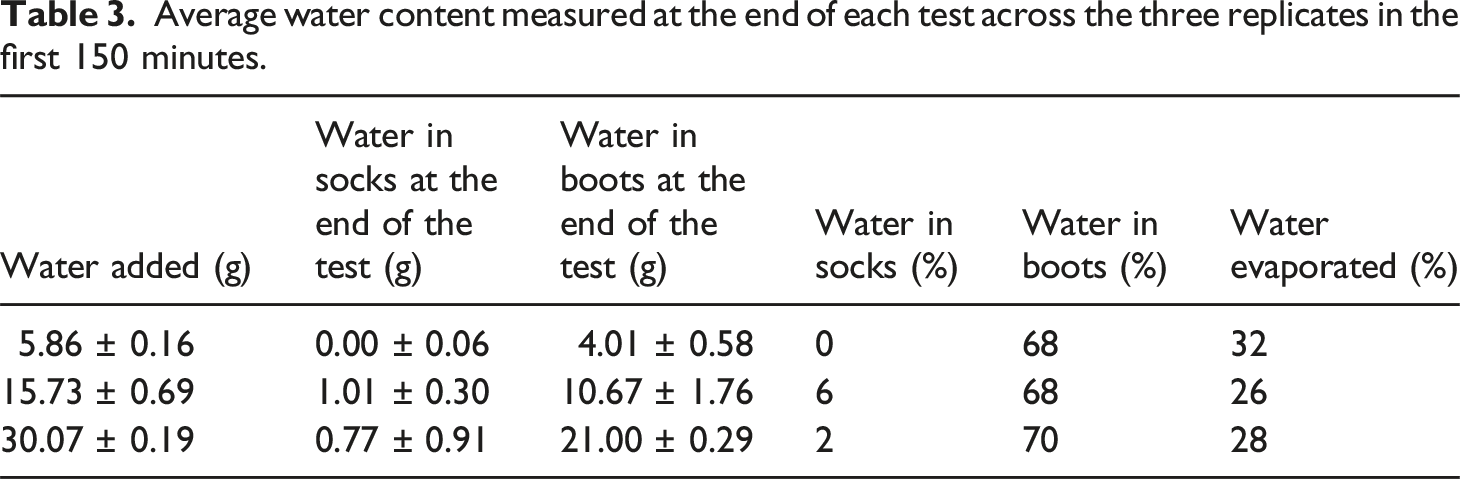
Average water content measured at the end of each test across the three replicates in the first 150 minutes.
For each phase, Eapp was also calculated to observe the contribution of evaporative heat loss and the contributions of wicking (which transports moisture away from the skin where it evaporates at the expense of the environment 32 ) and condensation. In the first phase, the E app value for the 15g test was 47.87 W/m2, while for the 30g test, it was slightly higher at 50.96 W/m2. This difference highlights the increased evaporative heat loss associated with the larger water content in the 30g test. Nevertheless, there is no noticeable difference in terms of initial heat loss between the two tests, despite the water content being almost twice as high in the 30g test.
When water spreads in a cotton fabric, it tends to fill the hydrogen bonds on the fiber surface before filling the free volume in between the fibres. Once the water-bound fibers of the material are saturated, the free water is displaced by gravity and capillary force.
33
Cotton has excellent absorption properties reflected in significantly lower moisture transport,34,35 and the wetting density is distributed over two different areas: the intermediate fibers, which are saturated first, and the intermediate yarn. Water transport in porous media like cotton can be initially described by Fick’s law of diffusion, expressed as:
In this context, free water evaporation is responsible for the first plateau in Figure 4, which is longer for the 30g test (compared to the 15g and 5g tests), as more free water is present in the 30g test. In this phase, free water, which has the highest mobility, evaporates from the fiber matrix, causing an initial stable phase with a higher heat loss compared to the dry test. 10 Once free water has left the system, the microporous trapped water begins to interact with the hydrogen bond water, reducing the mobility of both. 37
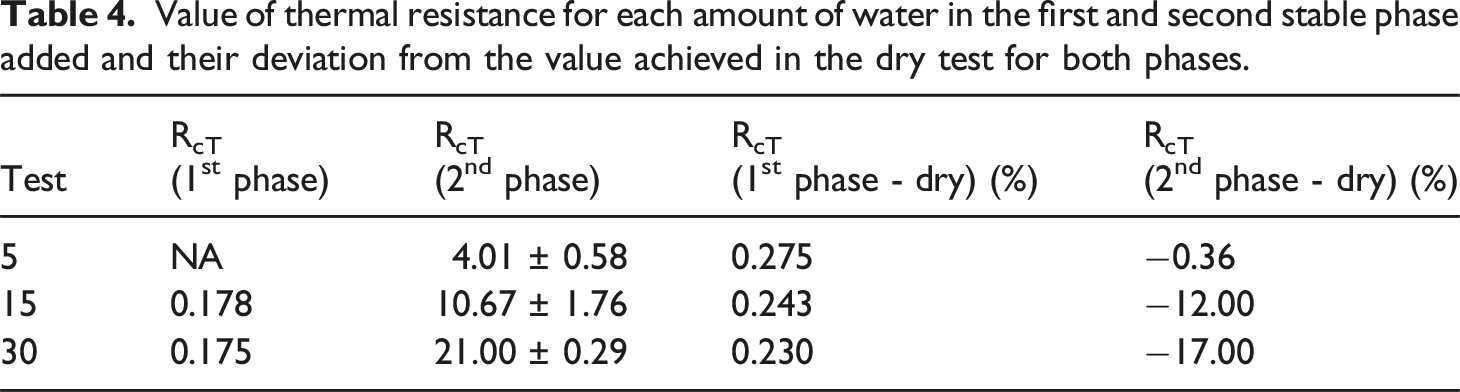
Value of thermal resistance for each amount of water in the first and second stable phase added and their deviation from the value achieved in the dry test for both phases.
In summary, the sharp difference between the diffusion coefficients of water in air and cotton underlines the rapid evaporation of free water, while the hydrophilic nature of the cotton fibers introduces a non-Fickian behavior that slows down the subsequent stages of moisture transport.
In order to observe the paths travelled by the water during the entire process more closely, a longer test (approx. 16 hours) was carried out in which the dry-wet heat loss of the system with the highest amount of water in the socks (30g) was investigated. The results are shown in Figure 5. An overnight test with 30 g water-loaded socks was conducted, with identified phases shown. The test was repeated four times and stopped at set time intervals. The system (socks and boots) was weighted to monitor WVA, as indicated in the four pie charts.
As with the previous results, the data was filtered and clustered, defining five clusters. In this way, five different phases were identified: an initial stable phase (i.e., the plateau phase) up to 100 minutes, a second steep decline up to 121 minutes, a third phase up to 249 minutes, and a fourth phase up to 405 minutes, and finally a steady flat phase until the end of the test. This result is consistent with the data provided by Heinisch et al. 38 who defined the drying process as composed of different stages: an initial warm-up phase, a following phase with a constant drying rate in which the unbounded water leaves the system, and a final period of slower drying rate. As shown in the pie chart in Figure 5, once most free water has evaporated from the socks and entered the boots through the condensation process (i.e., 20g after 235 minutes), evaporation from the boots occurs and transports the water out of the system. Based on the results from the 16-h test, individual tests were subsequently carried out for each identified phase. This approach allowed for a detailed analysis of the dynamics governing each stage of water transport and heat exchange, providing a clearer understanding of the distinct mechanisms observed in different phases of the drying process.
The percentage of water in the socks, in the boots, and the amount evaporated at the end of each phase is shown in the pie chart in Figure 5. Water was progressively displaced from the socks to the boots, where it hardly evaporated. In addition, another interesting aspect emerged: although there was still a non-negligible amount of water in the boots after the fourth phase (17g, 57% of the initial amount), no such remarkable changes in heat loss were observed compared to the dry test.
Indeed, the thermal resistance did not change significantly from the beginning to the end of the fifth phase (when weighing showed that almost all the water had evaporated).
Dry thermal resistance values in the dry test and in the 5th phase of the overnight test.

Water vapour absorption (WVA) value in the five phases of the drying curve detected in the 16-h test and the % of water in socks, boots, and evaporated.

To determine which of the two processes (condensation and absorption) was primarily responsible for the movement of water mass from the sock to the shoe, a drop test was conducted to observe which of the materials used in constructing the inner surface of the boots was more permeable. Material A and B are made of polyester fleece, while material C is a polyurethane foam covered by a large polyester fabric. The results are shown in Figure 6. Water droplets test results on the three different compounds that compose the inside of the boot. The water drop is highlighted in yellow.
“Mat C” completely absorbed the water droplet, while Mat A and B showed a strongly hydrophobic behavior. However, material C represents a negligible percentage of the inner surface of the boots, therefore the greatest contribution in water migration is played by evaporation followed by condensation on the inner surface of the boots. In Figure 7, a comparison between the 30g wet test, the dry test, and the isothermal test is shown. The grey dashed area in the graph represents the estimated contribution of the pure wet component in heat loss. Comparison between the first 120 minutes of the 30 g wet test, dry test, and isothermal test results. The pure wet component is represented by the straight line at the top of the grey area.
By integrating the curves, the value of the energy supplied by the manikin in the observed area was estimated. The calculations of the different components of the heat exchange were as follows:


UE+K+C is given from the difference between the wet and dry component and the pure dry one giving the value of the evaporative, conductive heat loss and the condensation component as well.

Finally, both the evaporative heat loss (QE) and the heat loss due to the presence of condensed water and conduction (UK+C) are evaluated.
Heat of evaporation, apparent heat loss and evaporation efficiency in the different phases of the long test.
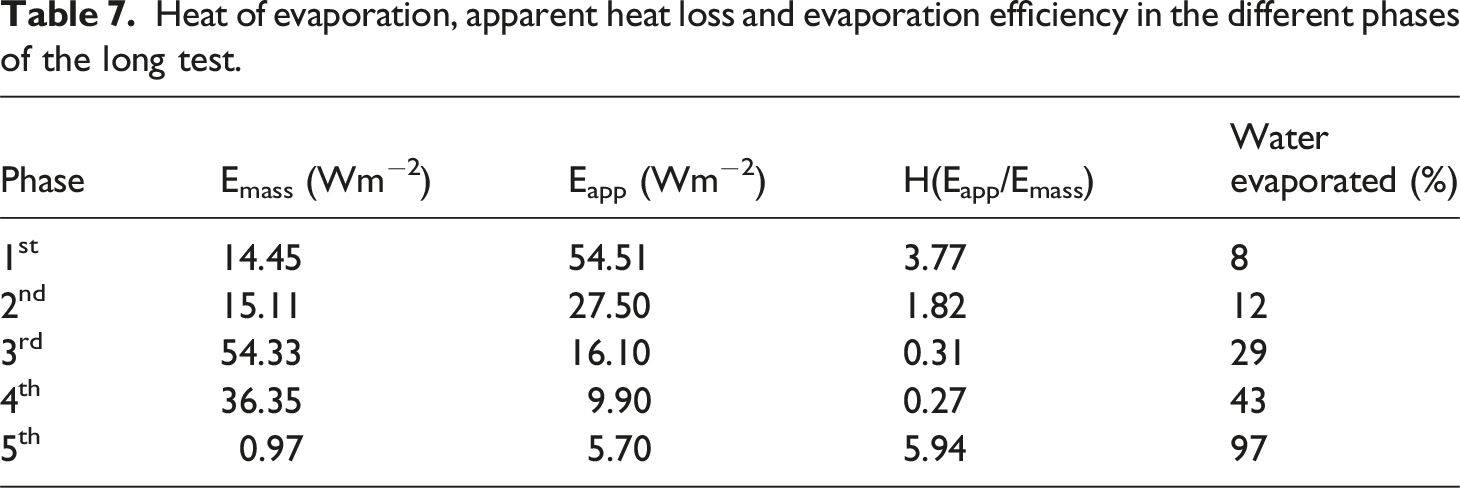
According to ηapp, the value of the effective latent heat of evaporation λeff (Jg−1) seems to decrease with increasing time, even if the total amount of water is almost the same in the first stages. The relationship was then also verified using a regression analysis, where ηapp and time were used as independent values and the water content of the boots as dependent values. The data elaboration showed a good fit of the model to the selected data (R2 = 0.985) and revealed a statistically significant correlation between the value of ηapp and the water content of the boots (p-value < .05). A higher evaporative cooling efficiency does not always deal with higher values of effective evaporation. In the isothermal test, where no condensation takes place, λeff was measured as well showing a lower value compared to the theoretical one (λ = 2419 (Jg−1) at 34°C, Eapp = 21.3 (W m−2), Emass = 24.19 (W m−2), ηapp = .88, λeff = 2128 (Jg−1)).
To summarize, water starts to evaporate from the first moments, but since the materials of the boots are mostly hydrophobic and impermeable (see Figure 6), condensation occurs as the vapor reaches the colder inner surface of the boots. 40 As shown in Figure 6, if the value of ηapp is greater than 1, this means that the latent heat for the effective mass is less than the effective observed heat loss, as the losses due to condensation strongly influence the system. This statement is also confirmed by the value of the energy consumed by the manikin, which was determined by integrating the curves of the various heat flows recorded during the study (see Figure 7). In this way, it was possible to evaluate the amount of each contribution to heat exchange, apart from the pure conduction value, which was considered almost negligible and was embedded in the condensation contribution. The higher value of the heat loss observed (3.1 KJm−2) compared to the value obtained for the evaporative heat loss (1.9 KJm−2) confirms that a high rate of evaporative cooling is not synonymous with a high effective evaporative efficiency. One could wrongly say that the only process that contributes to cooling the body is the one in which water leaves the entire clothing system. This assumption could lead to an incorrect estimation of evaporative heat loss if the moisture condenses in the outer layers. In addition, latent heat transfer in highly impermeable systems such as the one considered leads to strong inaccuracies and limitations, as already emphasized in previous studies. 12 Furthermore, the results obtained confirm what was already stated by Havenith et al. 14 The efficiency of evaporative cooling decreases as soon as the water charged in the system is moved away from the skin (i.e., the manikin), as can be seen in Table 6.
Dry thermal resistance values in the dry test and in the 5th phase of the overnight test.

Conclusions
This work investigated the influence of moisture inside the human clothing system. The paths that water can take and their effects on heat transfer were investigated in mountaineering boots. As it was observed, an initial stable phase of heat loss is due to a steady state evaporation of moisture. Most of the water, which is only weakly bonded to the fibers, leaves the system very easily, and part of it subsequently condenses on the inside of the boots, returning some of the heat loss. Furthermore, the efficiency of evaporative cooling decreases drastically when the evaporation front is far away from the skin (from the socks to the boots). The unit value of ηapp ideally is the value at which the enthalpy is close to the theoretical value, it becomes clear that ηapp assumes a higher value than unity in the initial stages of the process, which means that the latent heat of evaporation calculated by the mass loss method is overestimated due to the process of condensation that involves part of the water evaporated formerly. When wicking and condensation processes start to decrease because almost all the water contained in the socks has been released to the inside of the boots, the evaporation process becomes more significant. Still, the calculated value of the effective enthalpy of evaporation (λeff) is reduced compared to the theoretical value because the process took place at a certain distance from the skin (even if the highest percentage of water is still on the boots, evaporation took place very slowly). From a practical point of view, this means that the heat losses in the system do not entirely concern the body, which contributes to the cooling of the foot, but could also be taken from the environment. In this case, it was observed that the insulation properties do not appear to be strongly affected by the presence of residual water still connected to the fibers by hydrogen bonds which is in relatively small amount if compared to the weight of the boots.
The importance of the water cycle was highlighted by showing the effects of condensation in particular at the interface between clothing and body, which can cause an after-cooling effect and an increase in some thermal properties (such as heat transfer).
The results of this study contribute to a better understanding of water transport and evaporation dynamics in heavy insulating footwear and provide insights that could support the development of materials and manufacturing technologies aimed at improving thermal comfort and moisture management under specific environmental conditions. By identifying the different phases of water diffusion and their thermal effects, these results can help refine testing protocols and improve the assessment of moisture behavior in hydrophilic fiber-based materials. This knowledge could prove useful in the development of footwear and clothing systems designed to perform better in demanding climatic conditions.
In addition to the general implications for footwear material science and design, this study highlights the critical role of the presence of water vapor in a system designed for cold insulation, especially in extreme environments where boots are worn during intense physical activity, making perspiration a non-negligible factor. In such conditions, improper moisture management can compromise thermal efficiency and overall comfort, emphasizing the need for in-depth research into the mechanisms of vapor transport. For a company specializing in technical sports equipment but operating in an environment closely aligned with personal protective equipment (PPE) standards, understanding these dynamics is essential for product innovation and optimization.
Although this research was conducted on a single boot model, the results are broadly relevant to high altitude cold protection systems where thermal insulation is always a primary design objective. Regardless of the choice of material or layering strategy, hydrophobic barriers are always incorporated into such systems to prevent snow and moisture from penetrating from the outside and compromising insulation. These results therefore provide valuable insights for the development of next-generation protective footwear that can withstand extreme weather conditions while ensuring optimal performance and comfort.
Footnotes
Declaration of conflicting interests
The author(s) declared no potential conflicts of interest with respect to the research, authorship, and/or publication of this article.
Funding
The author(s) received no financial support for the research, authorship, and/or publication of this article.