
Abstract
This study investigated the relationship between thermal perceptions during human wear trials and thermal foot manikin measurements of heat and vapour resistance for five running shoes varying in material and construction. Measurements of thermal/evaporative resistance were performed using a 12-zone sweating thermal-foot manikin. Eleven males performed running trials on five occasions, wearing shoes of same design, differing in materials and construction, to achieve a range of heat/vapour resistances and air permeabilities. Trials in 20°C/60% RH consisted of three phases: 15 min rest, 40 min running, 15 min recovery. In-shoe temperature/humidity were measured at two sites on the left foot. Thermal sensation/wetness perception/thermal comfort were provided for the left foot and four foot regions. Variations in shoe material and construction resulted in differences in thermal and evaporative resistance. These differences were reflected in in-shoe temperature and in-shoe absolute humidity assessed during wear trials. At the end of the rest period, thermal sensation was strongly related to thermal insulation (r2 = 0.69, p<0.001). During exercise however, thermal sensation, wetness perception and thermal discomfort were related to both thermal insulation and evaporative resistance. Thermal foot manikins provide a sensitive, effective evaluation of footwear thermal properties, which are also reflective of changes to in-shoe parameters during actual use. This discriminate power may be enhanced using higher, more realistic air-speeds during testing, as well as simulating foot movement. While thermal foot manikins are highly sensitive to design features/attributes of footwear (e.g. ventilation openings, air-permeabilities and coatings), subjective evaluations of footwear do not seem to have the same sensitivity and discriminative power.
Introduction
The thermal properties of footwear (insulation, evaporative resistance, permeability and the related shoe microclimate) are important characteristics, which in addition to the mechanical properties of footwear (fit and dynamic function) determine the level of comfort experienced by the wearer.1–4 Little published information with regard to how the thermal properties of shoes influence perceptions of comfort is available,1,2,4 despite it being known that, like clothing, footwear acts as a barrier to heat and moisture transfer from the skin to the environment.
In warm environments and with physical activity, increased delivery of warm blood to the foot causes elevations in foot skin temperature, impacting the temperature profile within footwear. 4 Although heat loss can be aided through the evaporation of sweat, containment of the foot within the shoe negatively impacts evaporative heat transfer.5–7 Therefore, heat input into the foot tends to exceed heat loss from the foot, thus causing a progressive increase in foot temperature, foot skin temperature and shoe microclimate variables (in-shoe temperature and in-shoe humidity). These changes have been shown to cause sensations of discomfort.1,4,8,9 The insulative and evaporative resistance properties of footwear are therefore important parameters which can influence local thermal responses and local thermal comfort at the foot.
The thermal properties of clothing and footwear can be assessed through subjective assessments on human participants.10,11 Subjective assessments are advantageous, allowing a comparison of garments tested with respect to performance and thermal comfort under simulated field conditions. 12 However, assessments using human participants tend to be less reproducible and consistent due to inter-individual and intra-individual variations. The assessment of the thermal insulation and evaporative resistant properties of clothing garments and/or ensembles using whole body or multi-segment thermal manikins seem to offer an objective, time efficient and reliable alternative. 13 However, very few results from these manikin measurements are in the public domain having primarily been used by commercial companies and defence research establishments. Also, linking results from manikin measurements to human responses is documented rather poorly, thus compromising actual validity.
Thermal foot manikin measurements, which are available in the literature, have primarily been utilised to determine the effect of insulation on foot skin temperature responses in cold conditions with low activity levels.8,14 Results highlighted the importance of insulation for keeping the feet warm and indicated a correlation between mean foot skin temperature and thermal sensation in the cold, despite considerable individual variation.8,14 Insulation calculated based upon foot skin temperature data from human participants and thermal foot manikin outputs have also been compared. 10 Results indicated the thermal manikin to be a good method for thermal testing of footwear in cold protection. 10 A subsequent validation of Lotens et al. 15 model for predicting foot skin temperatures 15 was therefore conducted using a combination of footwear insulation values obtained from a thermal foot manikin and actual measurements of foot skin temperature obtained from participants exposed to cold environments. 16 Regarding the assessment of water vapour uptake and permeability properties of shoes, although consistent results have been reported for an artificial foot, comparisons between safety shoes with variations in lining materials indicated relatively small differences. 17 Furthermore, when assessed in relation to foot skin temperature data, the effects on comfort were unclear. 18
More recently, thermal foot manikin measurements have been utilised to determine the effect of different fabrics, membranes, or safety features (e.g. toe cap types) on heat loss and moisture retention, allowing for assessment of footwear functionality, suitability and performance.1,19,20 The development of a sweating thermal foot manikin incorporating a gait simulator has also been used to determine thermal insulation and water vapour resistance of footwear under static (standing) and dynamic (walking) conditions. 21
The exploration of the link between manikin and human responses has been further encouraged to validate manikin data. 22 The use of whole body thermal manikins and a thermal head manikin has been validated in tests with human participants.11,23 However, the relationship between subjective evaluations of footwear assessed during wear trials and objective thermal foot manikin measurements for neutral or warm conditions requires further investigation. To date, the use of a thermal foot manikin for the evaluation of thermal insulation for several lining materials in hiking boots revealed that evaluations provided by users did not necessarily match the results from the manikin tests. 1 Further exploration of this link would therefore be valuable, as assessments of the thermal properties of footwear on human participants can be challenging, which explains why limited published information is currently available.1,4,9
This study therefore investigated the relationship between thermal perception (thermal sensation, wetness perception and thermal comfort) assessed in a controlled wear trial and thermal foot manikin measurements (thermal insulation, evaporative resistance, dry and evaporative heat loss) for five running shoes. Given that testing for cold protection may be quite different from testing for athletic performance, the focus of this paper was to explore thermal foot manikin measurements in relation to local thermal responses in warm environments with physical activity.
Method
Participants
Eleven aerobically trained male runners (age: 30.9 ± 10.5 years; height: 176.0 ± 4.8 cm; body mass: 75.4 ± 8.7 kg) volunteered to take part in this study. Participants had a shoe size of 8.5 UK (42 2/3 EU). This criteria was chosen to reflect the thermal foot manikin which is suitable for testing footwear sized 8.5 UK (42 2/3 EU). Experimental procedures were fully explained to the participants before obtaining written informed consent and completion of a health screen questionnaire. Participants reported no history of diabetes, cardiovascular or neurological disease, skin-related conditions or perceptual contraindications. Ethical approval was obtained from the local ethical review board.
Footwear
Five prototype running shoes in size UK 8.5 and a standardised running sock (62% cotton, 34% polyester, 3% elastane, 1% nylon) were selected for testing (adidas AG, Herzogenaurach, Germany). All running shoes were made using the same shoe last (a mechanical form, shaped like a foot which determines the size and style of the shoe) and were of the same design, but different in material and construction. This variation was selected to produce a range of heat and vapour resistances, as well as air permeabilities, to elicit different shoe microclimates. Details regarding shoe design are outlined in Table 1 and shown in Figure 1. Participants were not informed about any of the shoe variations, nor were they allowed to visually inspect the shoes.
Running shoe specifications according to colour, weight and shoe materials used.
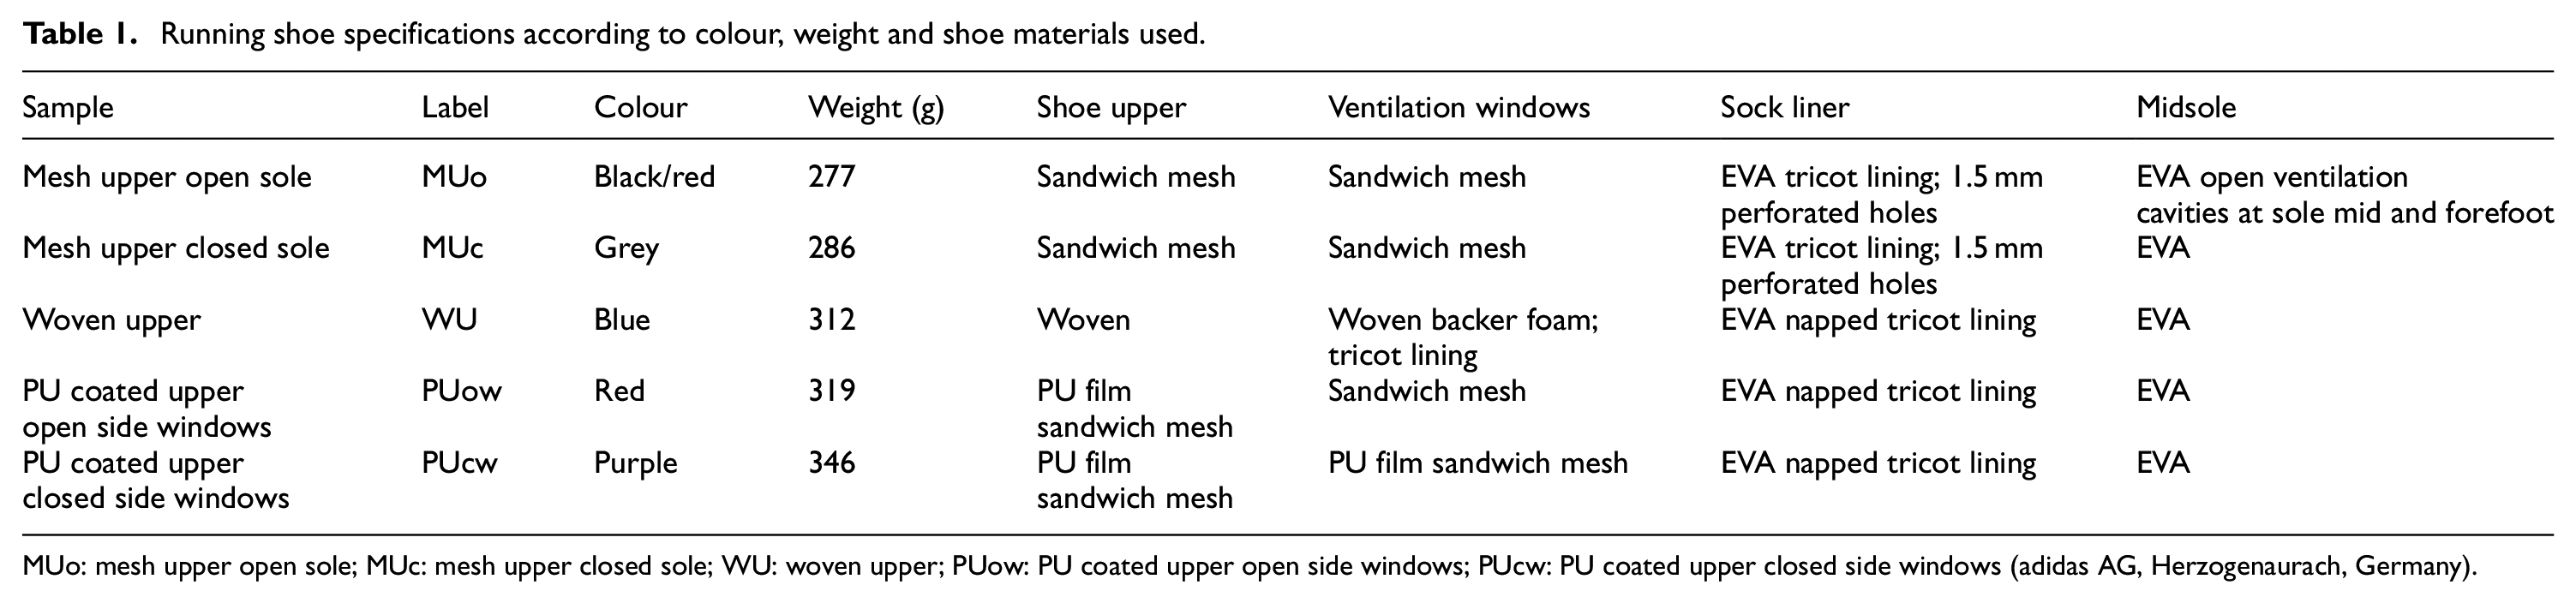
MUo: mesh upper open sole; MUc: mesh upper closed sole; WU: woven upper; PUow: PU coated upper open side windows; PUcw: PU coated upper closed side windows (adidas AG, Herzogenaurach, Germany).
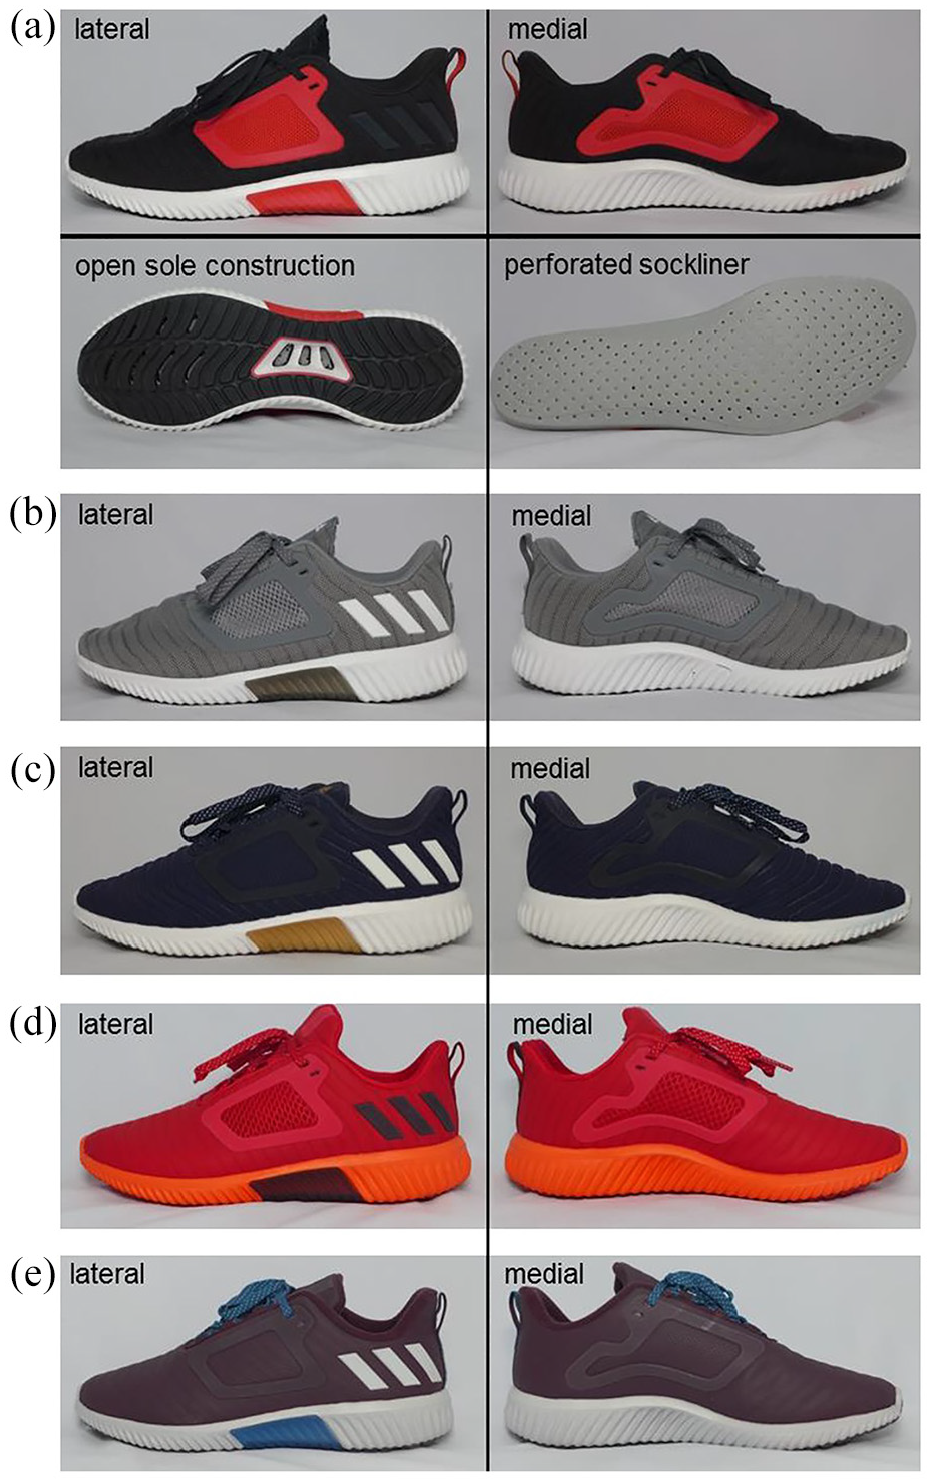
Running shoes assessed: (a) Mesh upper open sole (MUo), (b) Mesh upper closed sole (MUc), (c) Woven upper (WU), (d) PU coated upper open side windows (PUow), (e) PU coated upper closed side windows (PUcw).
Thermal foot manikin measurements
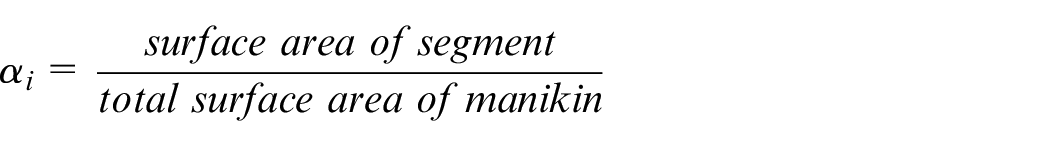
Heat loss measurements were performed using a 12 zone sweating thermal foot manikin as shown in Figure 2 (THERMETRICS, Measurement Technology Northwest, Seattle, USA). The thermal foot manikin (foot and lower leg) has a total surface area of 0.1069 m2 and is suitable for testing footwear sized 8.5 UK (42 2/3 EU), left shoe only. The thermal foot manikin is set within a controlled climatic chamber (width 101 × depth 127 × height 169 cm), allowing for the adjustment and monitoring of air temperature, relative humidity and wind speed during testing (temperature and humidity chamber Plantinous J series, type 3, ESPEC CORP, Osaka, Japan).
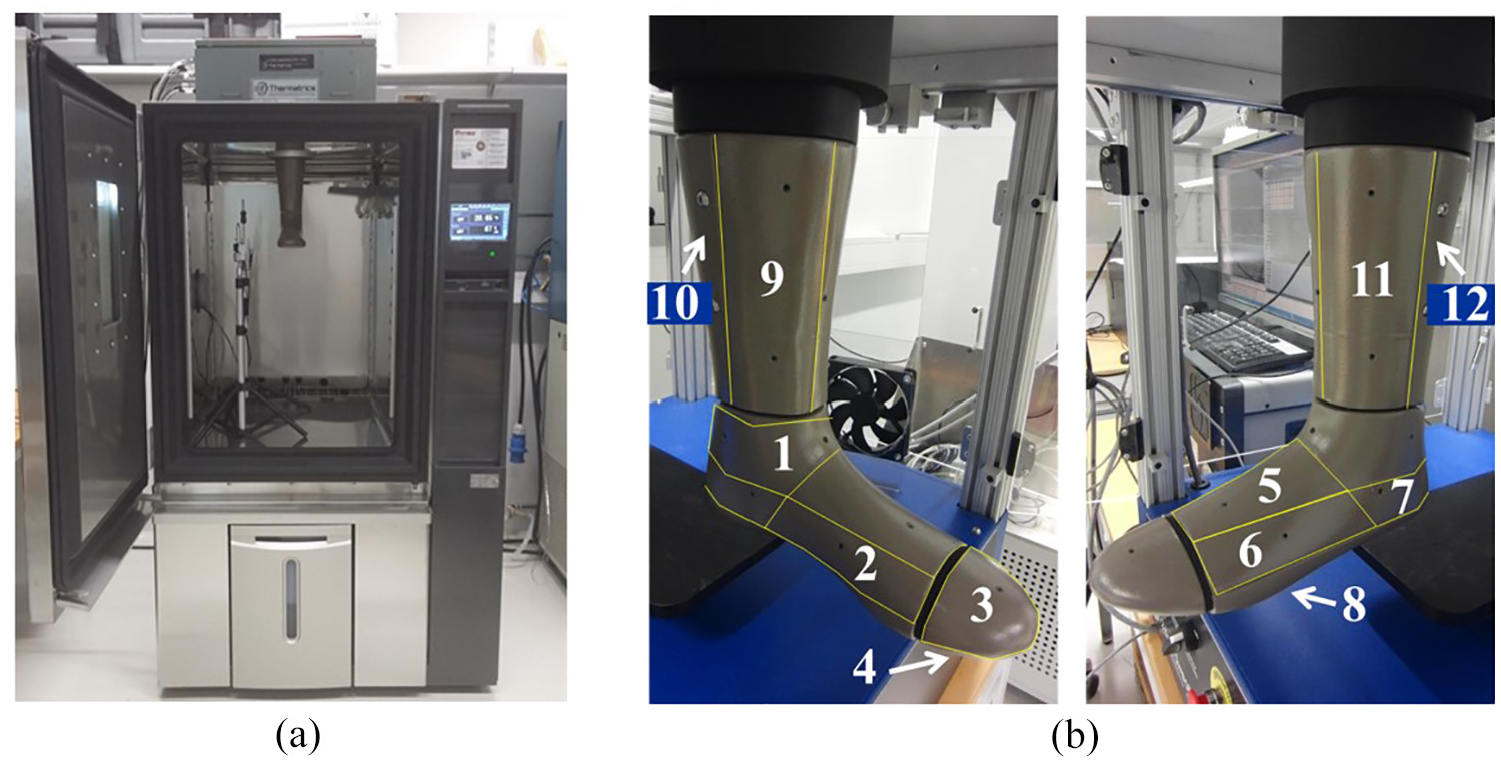
Climatic chamber and thermal foot manikin. Foot site codes: 1-ankle; 2-insole; 3-toe top; 4-toe bottom; 5-foot top; 6-foot outer; 7-heel; 8-foot bottom. Lower leg site codes: 9-front inside leg; 10-back inside leg; 11-front outer leg; 12-back outer leg.
Each independent zone of the thermal foot manikin is equipped with temperature sensors and heating elements. Twenty-two perspiration nozzles (pores) are distributed evenly over the manikin surface for the simulation of sweating. Flow rates can be adjusted across different regions to reflect regional differences in foot sweat rate. Control of the surface temperature or power to each zone can be measured, enabling the calculation of heat losses and therefore thermal resistance of footwear and/or footwear ensembles. Calculations can be carried out for each zone separately, for grouped zones or for the whole manikin, as outlined in ISO 9920: 2009. 24
Measurements of thermal insulation were made in line with test procedures outlined in ISO 15831: 2004. 25 The surface temperature of the thermal foot manikin was controlled and maintained at 34.0 ± 0.2°C. Environmental conditions were fixed, allowing for heat loss to be determined by measuring the heating power required to maintain a constant surface temperature of each segment. Lower leg zones were excluded from the calculation of footwear thermal properties with only the eight foot zones (surface area 0.060 m2) included for assessment (Figure 2).
Thermal foot manikin test procedures
Running shoes and socks were conditioned in a climate controlled room of 21°C, 65% RH for 12 h before testing. With application of footwear onto the manikin, shoes were carefully laced to achieve a similar tension on the laces each time and so not to influence the fit of the shoe on the manikin.
Dry heat resistance measurements were performed in environmental conditions controlled at 21°C, 50% RH with 0.20 m·s−1 air speed within the climate controlled chamber. The test was performed for a duration of 1 h, ensuring a steady state in heat loss was present.
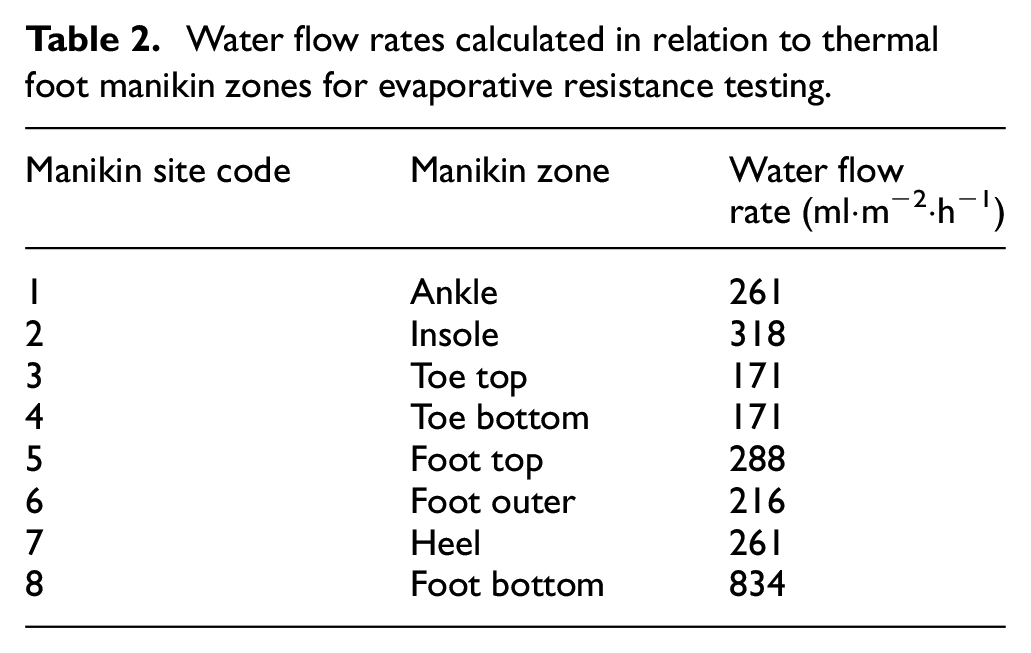
In a separate test, evaporative heat resistance measurements were taken in isothermal conditions in a climate controlled chamber regulated at 34°C, 50% RH with 0.20 m·s−1 air speed. Dry heat loss would be minimal or absent in these tests, improving the accuracy of evaporative heat loss measures. Thermal foot manikin zones were preheated to 34°C and flow rates to independent pores were set at 5,000 ml·h−1 for a flow verification check. A visual inspection of all pores was performed to ensure all pores were operational. The water temperature was controlled at 34°C when entering the foot manikin. Following pre-heating and flow verification, the foot manikin was dried and fitted with a tight fitting, moisture wicking textile ‘skin’ (80% polyamide, 20% elastane). The skin was pre-wetted with water, ensuring uniform coverage to simulate a sweating skin surface. A pumping unit connected to a distilled water reservoir was used to distribute water to independent pores to prevent the skin from drying out during the measurement period. Flow rates to independent pores were determined from physiological sweat data collected at 14 foot regions during low intensity running. 7 To determine flow rates to manikin zones, flow rates were adjusted in relation to surface area and set accordingly (Table 2). Following installation and wetting of the textile skin, the footwear ensemble was installed onto the thermal foot manikin. The test was performed for a duration of 1 h 30 min.
Water flow rates calculated in relation to thermal foot manikin zones for evaporative resistance testing.
Dry and evaporative heat resistance measurements were replicated and if steady measurement states were not achieved, a third measurement was performed.
Dry heat resistance calculation
Total thermal insulation (It) of the footwear was calculated by the parallel method 24 using equation (1):
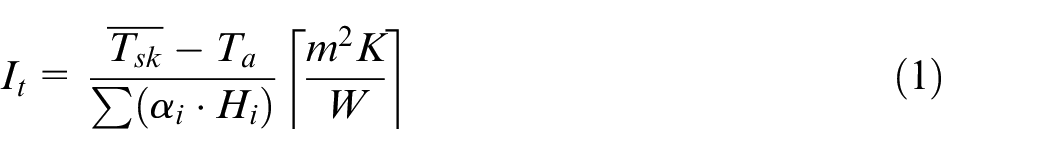
where;


Evaporative heat resistance calculation
Evaporation of the water from the thermal foot manikin through footwear or a footwear ensemble draws heat away from the manikin. Using the manikin surface temperature, the water vapour pressure at the manikin surface and the vapour pressure gradient between the skin and the environment, evaporative resistance (Ret) can be calculated 24 using equation (2).
Although measurements were performed in isothermal conditions with air temperature at 34°C, dry heat loss caused by small deviations from isothermal conditions was subtracted from total measured heat loss.
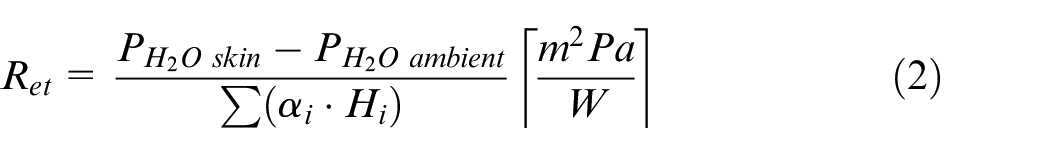
where;


Experimental protocol for wear trials
Participants were required to visit the laboratory on five separate occasions at approximately the same time of day. Trials were performed in a climatic chamber, maintained at 20°C, 60% RH. Trials differed only with regard to the running shoe worn. A standardised sock was donned for all trials. The conditions were presented in a counterbalanced order.
Upon arrival, participants changed into running shorts and t-shirt. Each participant was fitted with a Polar heart rate monitor (H7, Polar Electro Oy, Kempele, Finland). Temperature and relative humidity sensors (HTU21D, Measurement Specialities, USA) were attached to two sites on the left foot (longitudinal arch of the sole and third metatarsal at the distal end of the upper foot region) to record changes to in-shoe temperature and in-shoe relative humidity. Sensors were applied to the standardised sock using transpore surgical tape. Tape was applied to the plastic edges surrounding the sensors to ensure they were not covered. Data were collected wirelessly at 10 s intervals through a custom made Bluetooth acquisition system (University of Applied Sciences Kaiserslautern, Zweibrücken, Germany) and simultaneously displayed and recorded in LabVIEW software (2016, National Instruments). In-shoe absolute humidity was calculated from in-shoe temperature and in-shoe relative humidity using the Antoine equation. 26
Following instrumentation, participants donned test shoes and rested for 15 min in an upright seated position. Participants then performed 40 min of treadmill running at a constant speed of 8.5 km·h−1 (h/p cosmos sports and medical GmbH, Traunstein, Germany). This was followed by a 15 min seated recovery period. Aural temperature was measured from the auditory canal (Braun Thermoscan 7, IRT6520, Braun GmbH, Kronberg, Germany) at the beginning/end of each protocol phase. A non-invasive core temperature measurement was taken to avoid discomfort.
Perceptual measurements
Ordinal scales were used to assess subjective perception of thermal sensation, wetness perception and thermal comfort (Figure 3(a)–(c)). Descriptors were provided in both English and German due to several German speaking participants. Participants were instructed on how to use the perceptual scales and given time to practice under the guidance and assistance of the experimenter. Scales were used to gain subjective information for the whole body, whole foot and four foot regions (Figure 3(d)). Participants were required to give ratings every 5 min for the left foot only.
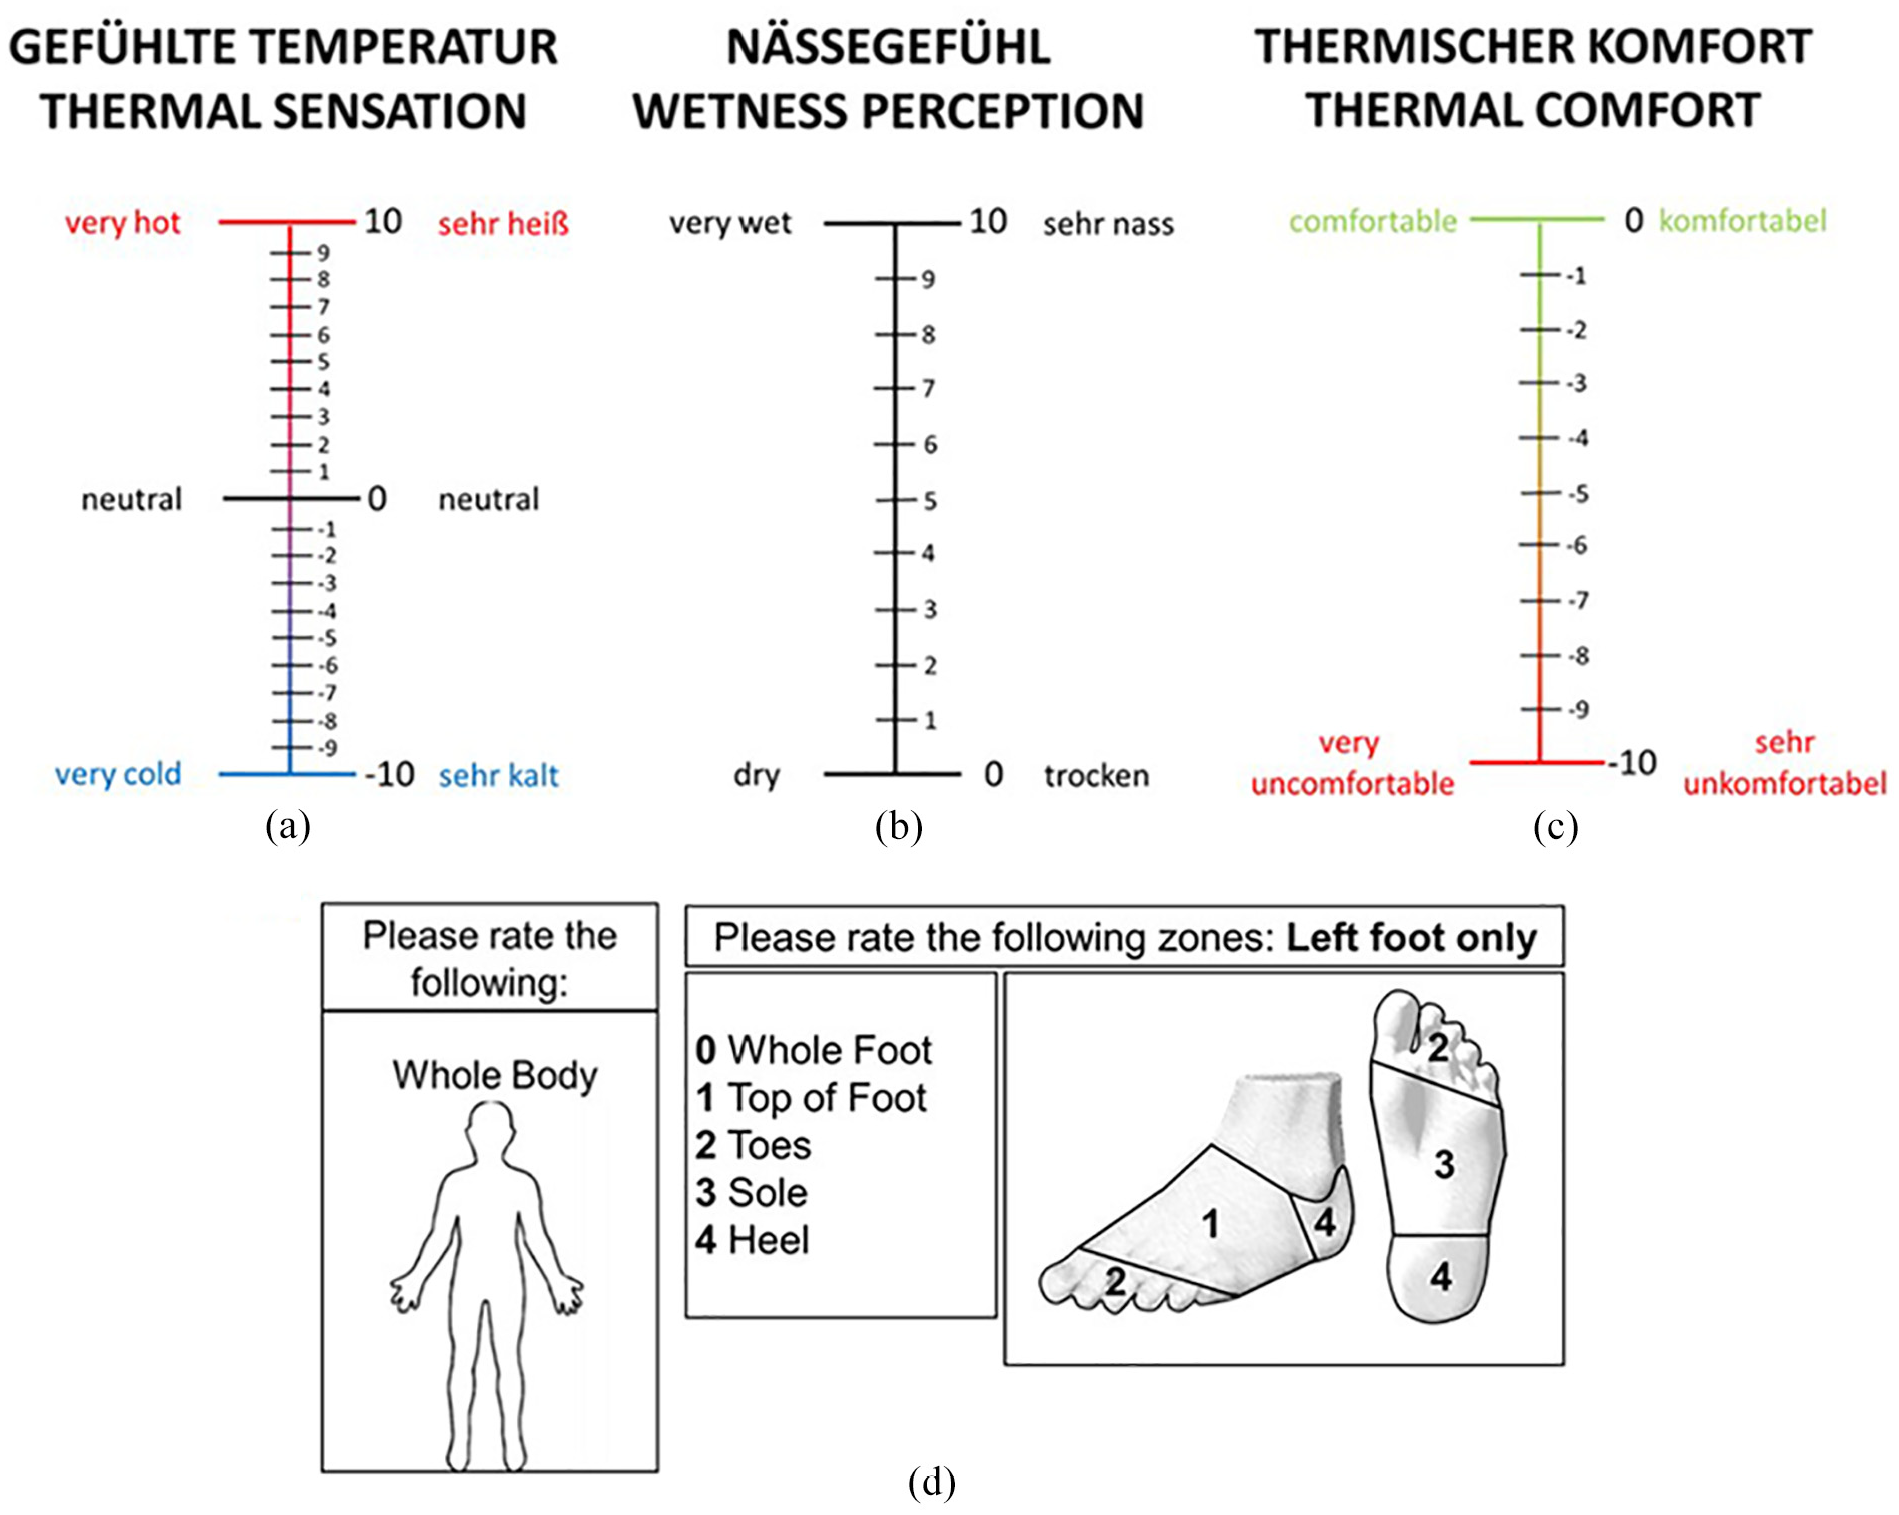
Scales and locations for subjective evaluation (a) thermal sensation scale; (b) wetness perception scale (c) thermal comfort scale and (d) reference sheet used to highlight areas for subjective evaluation during wear trials.
Analysis
To investigate temporal characteristics of shoe microclimate and determine whether shoe microclimate is affected by shoe permeability, a two-way repeated measure analysis of variance (ANOVA) was performed with post hoc multiple comparisons (Bonferroni correction). To investigate the subjective perception of shoe microclimate over time and between shoe conditions, a Friedman test was conducted. When significant effects were observed, post hoc analysis was conducted with a Wilcoxon signed rank test. Regression analyses were performed to study the relationships between thermal perception and thermal foot manikin measurements, as well as between shoe microclimate and thermal foot manikin measurements. For clarity, relationships shown in the figures are for the means of individual shoes at different time points, however, r2 and significance are reflective of analysis with individual data. Statistical analysis was performed using IBM SPSS Statistics 24 (IBM, USA) and reported as means ± standard deviation (SD). The level of significance was set at p < 0.05.
Results
Environmental conditions
Mean (±SD) environmental conditions for dry heat resistance and evaporative resistance measures were 21.0 ± 0.1°C, 50.3 ± 0.5% RH and 34.2 ± 0.1°C, 50.1 ± 0.4% RH, respectively. Environmental conditions for wear trials were 20.2 ± 0.2°C, 59.7 ± 0.7% RH.
Thermal insulation
Despite clear design differences in terms of ventilation features, thermal insulation measured on the thermal foot manikin showed only limited, although relevant (approx. 15%), variations from 0.13 to 0.15 m2·K W−1 (Table 3). Thermal insulation provided by PUow was lower in comparison to PUcw (0.13 vs 0.15 m2·K W−1, respectively), indicating an effect of the sandwich mesh ventilation openings located on the lateral and medial sides of the shoe upper for PUow. The ventilation openings located in the midsole and sock liner of MUo also resulted in a lower thermal insulation compared to the closed midsole construction of MUc (0.13 vs 0.14 m2·K W−1, respectively).
Thermal insulation, evaporative resistance and permeability index for five footwear samples.
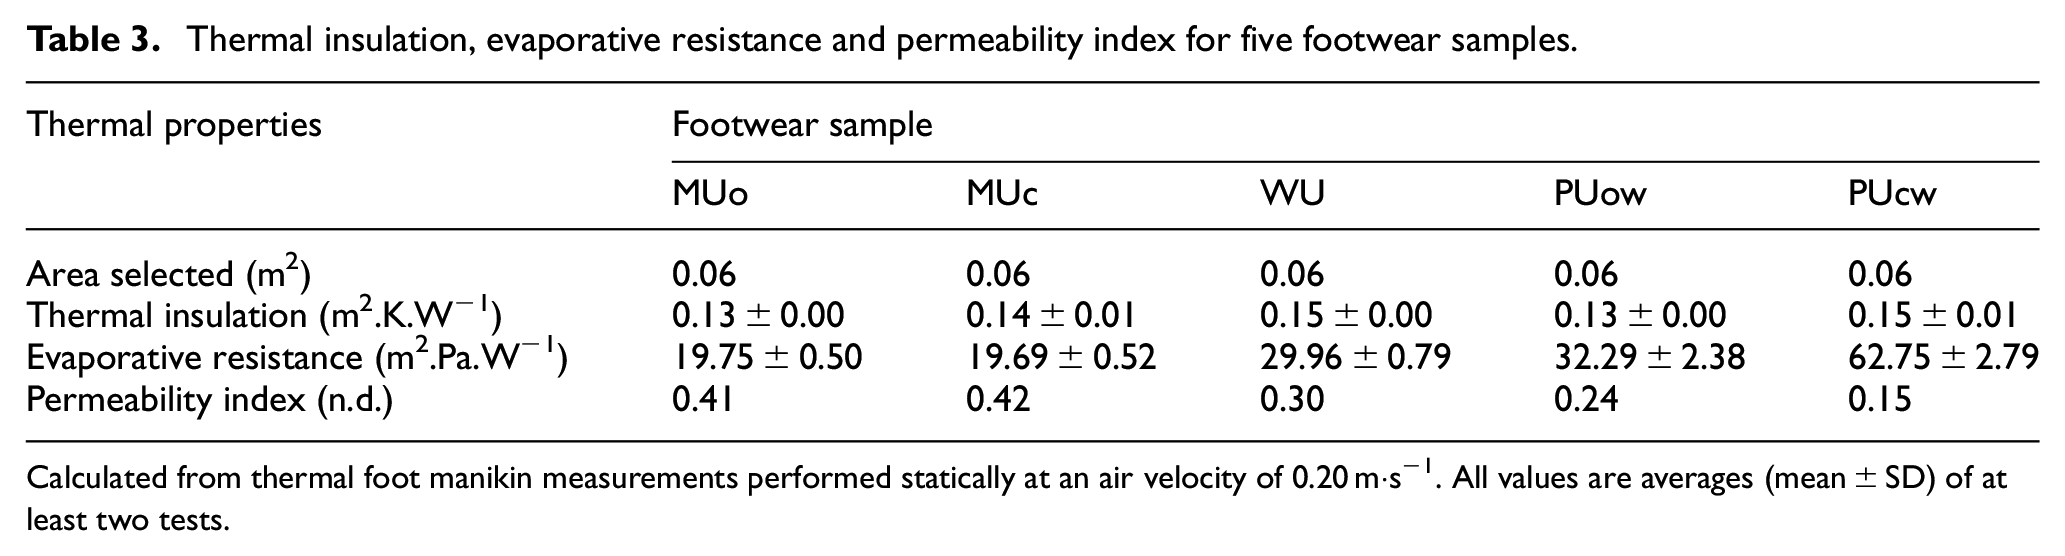
Calculated from thermal foot manikin measurements performed statically at an air velocity of 0.20 m·s−1. All values are averages (mean ± SD) of at least two tests.
Evaporative resistance
The material features and coatings caused evaporative resistance to vary substantially (19.8 to 62.8 m2·Pa W−1; Table 3). The ventilation openings in the midsole and sock liner of MUo had little effect on evaporative resistance when compared to MUc (19.8 vs 19.7 m2·Pa W−1, respectively). Evaporative resistance was lower for PUow compared to PUcw (32.3 vs 62.8 m2·Pa W−1, respectively), indicating an effect of the sandwich mesh ventilation openings. Yet, the application of coatings to PUow and PUcw resulted in considerably high evaporative resistance (32.3 and 62.8 m2·Pa W−1, respectively).
Relationship between thermal insulation and evaporative resistance
Evaporative resistance and thermal insulation measured using a thermal foot manikin were not related (r2 = 0.33, p = 0.31; Figure 4).
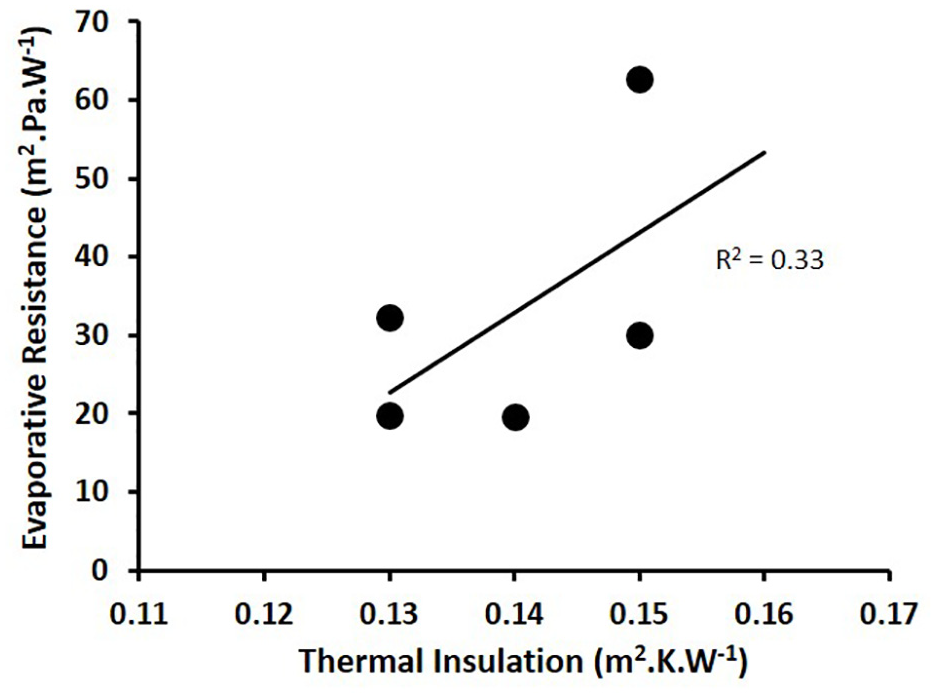
Relationship between evaporative resistance and thermal insulation for five shoe conditions determined using a thermal foot manikin. p = 0.31.
Shoe microclimate
Mean in-shoe temperature and mean in-shoe absolute humidity during the experimental protocol for all five shoe conditions are presented in Figure 5(a) and (b), respectively. The range in heat and evaporative resistances achieved by variations in shoe material/construction resulted in different shoe microclimates. These differences were primarily reflected in differences for in-shoe absolute humidity compared to in-shoe temperature. Although significant differences were not consistently observed between conditions, in-shoe temperature and in-shoe humidity were observed to be lowest for MUo and MUc. The highest in-shoe temperature was observed for PUcw and WU. Highest in-shoe absolute humidity was observed for PUcw.
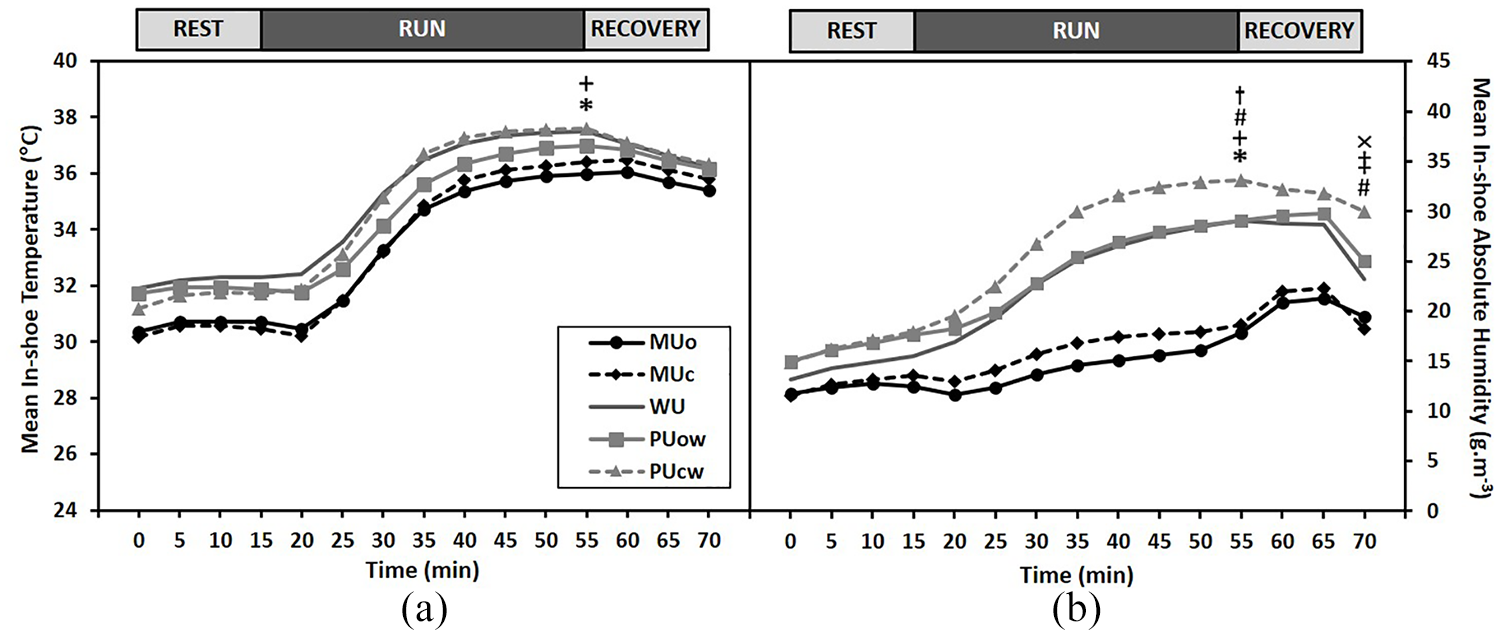
Mean (a) in-shoe temperature and (b) in-shoe absolute humidity for five shoe conditions during the experimental protocol consisting of rest, run and recovery. *Significant difference between MUo and PUcw (p < 0.05). +Significant difference between MUc and WU (p < 0.05). †Significant difference between MUo and PUow (p = 0.01). #Significant difference between MUo and PUcw (p < 0.03). ‡Significant difference between MUc and PUow (p = 0.01). xsignificant difference between PUow and PUcw (p = 0.04).
Perceptual responses
Perceptual responses varied between shoes and were reflective of the observed differences in shoe microclimate. Thermal sensations (Figure 6(a)) and wetness perceptions (Figure 6(b)) were greatest for PUcw and WU and lowest for MUo. Although several significant differences in thermal sensation were observed between shoe conditions during rest, practically these differences were minor, ranging between −0.2 and 0.5 on the thermal sensation scale.
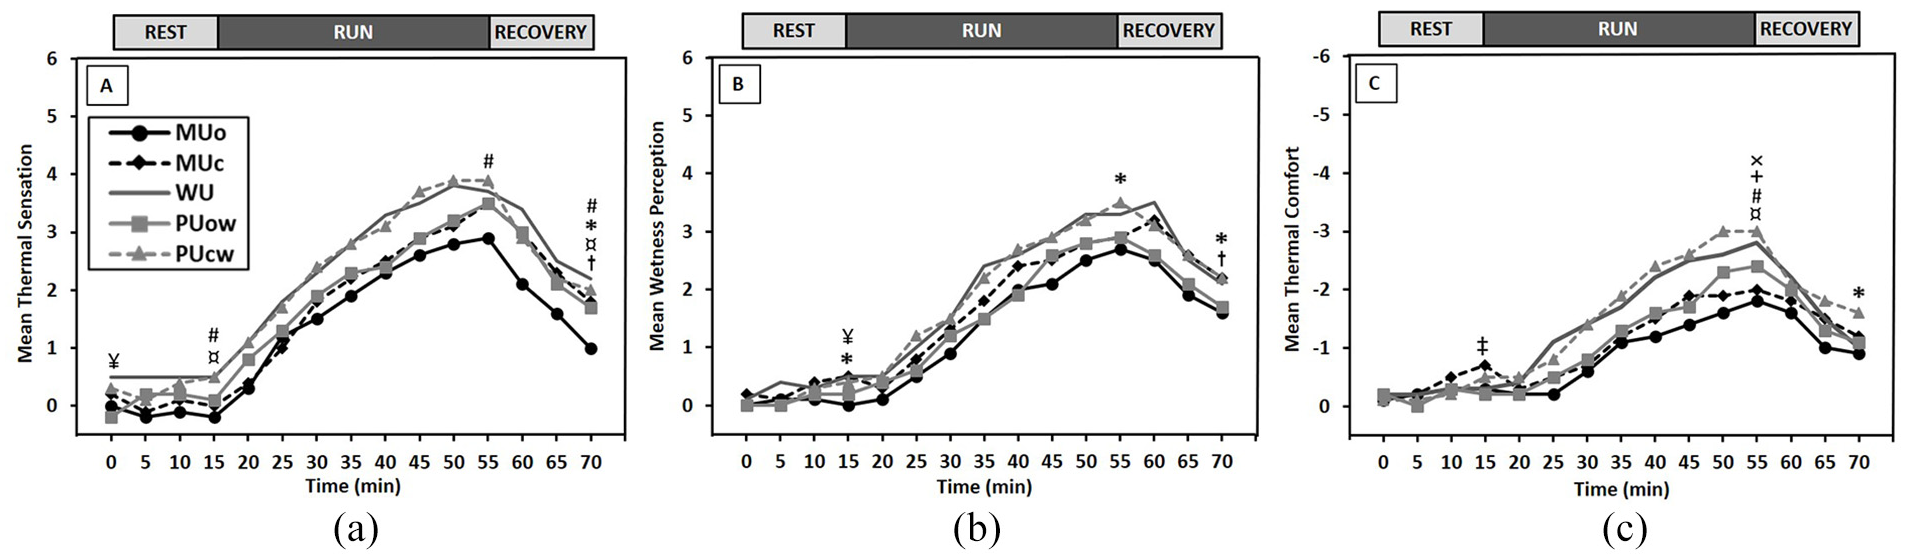
Mean (a) thermal sensation, (b) wetness perception and (c) thermal comfort for five shoe conditions during the experimental protocol consisting of rest, run and recovery. ¥Significant difference between PUow and WU. ¤Significant difference between WU and MUo. #Significant difference between PUcw and PUow. †Significant difference between MUc and MUo. *Significant difference between PUcw and MUo. +Significant difference between WU and MUc. xSignificant difference between PUcw and MUc. Significance set at p < 0.05.
Differences in thermal comfort were primarily observed at the end of RUN (Figure 6(c)). A significant difference in thermal comfort was observed between PUcw and PUow, indicating a perceivable benefit of the sandwich mesh ventilation openings located on the lateral and medial sides of the shoe upper for PUow.
Relation between shoe microclimate and thermal foot manikin measurements
Positive relationships were observed between mean in-shoe temperature and thermal insulation (p < 0.01; Figure 7(a)) and between mean in-shoe temperature and evaporative resistance (r2 > 0.40, p < 0.05; Figure 7(b)).
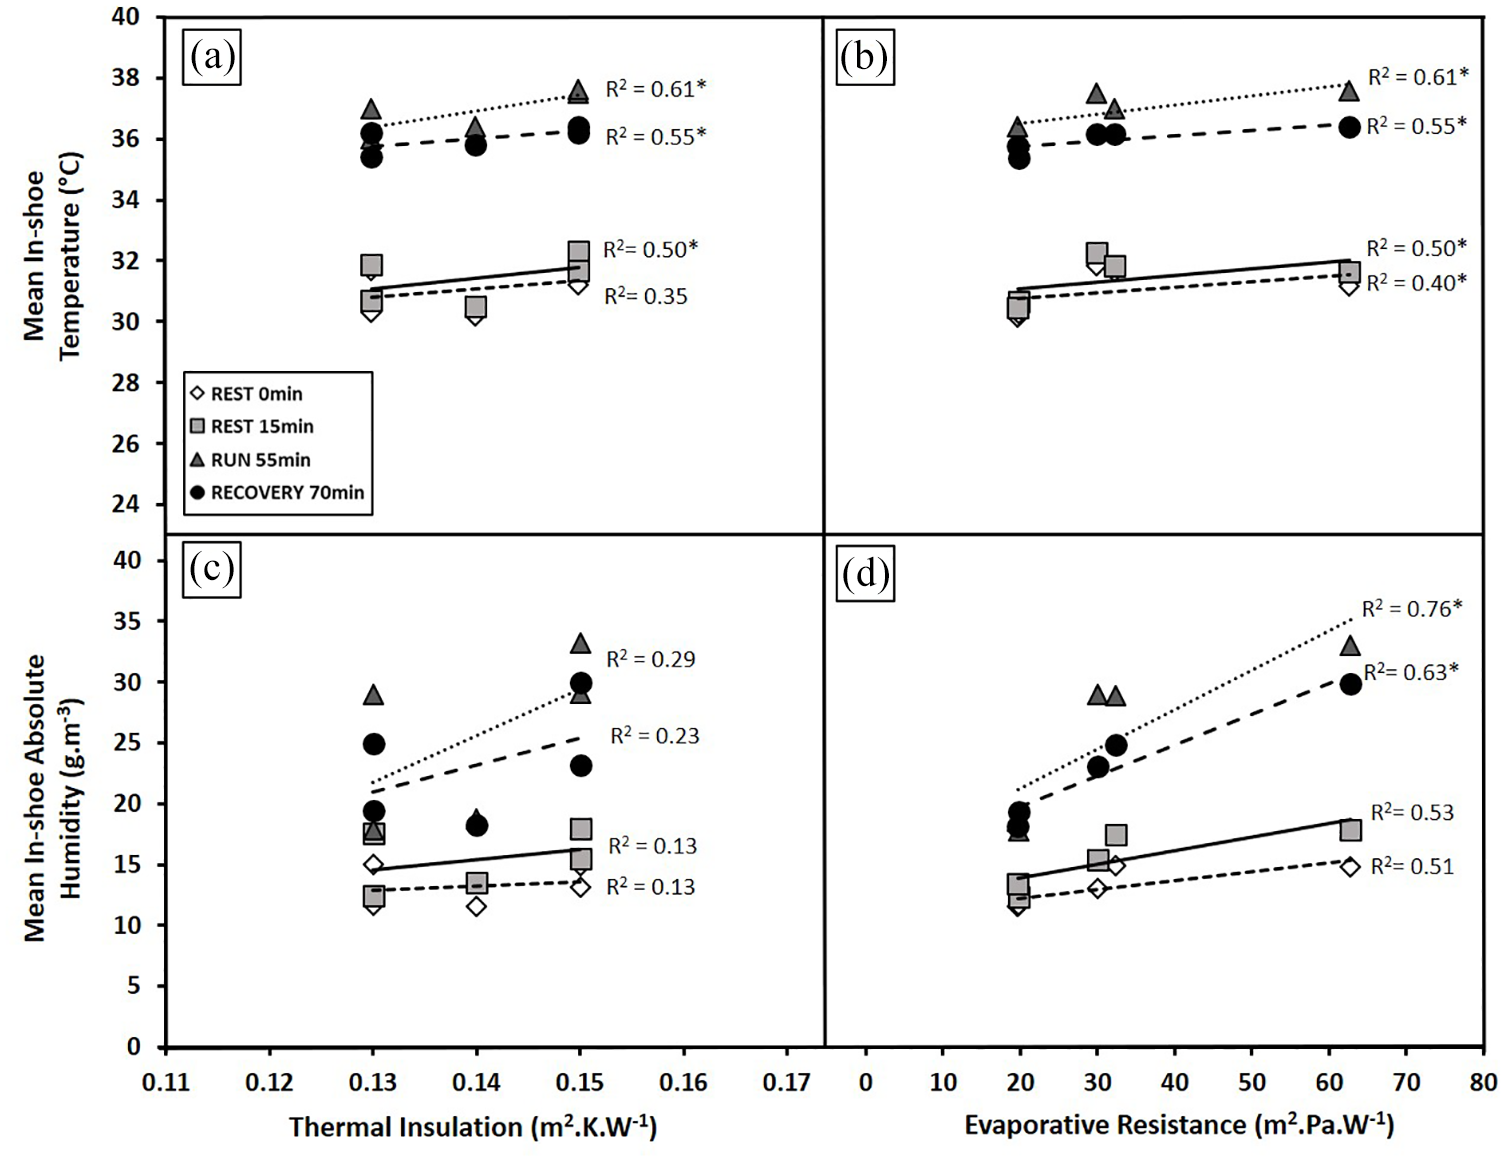
Relationship between in-shoe temperature and (a) thermal insulation and (b) evaporative resistance and the relationship between in-shoe absolute humidity and (c) thermal insulation and (d) evaporative resistance for five shoe conditions. In-shoe temperature and in-shoe absolute humidity assessed during the experimental protocol consisting of rest, run and recovery and thermal insulation and evaporative resistance determined using a thermal foot manikin. Relationships shown are for the means of individual shoes at different time points, however r2 and significance are reflective of analysis with individual data. *Indicates a significant relationship (p < 0.05).
A higher predictive power of evaporative resistance was observed for mean in-shoe absolute humidity at the end of RUN (r2 = 0.76, p < 0.001; Figure 7(d)) and RECOVERY (r2 = 0.63, p = 0.05; Figure 7(d)). It is important to consider that this relationship is dependent upon the high evaporative resistance of PUcw.
Relation between thermal perception and thermal foot manikin measurements
At the end of the REST, thermal sensation was strongly related to thermal insulation (r2 = 0.69, p < 0.001; Figure 8(a)). However, with EXERCISE, thermal sensation, wetness perception and thermal discomfort were related to both thermal insulation and evaporative resistance (Figure 8).
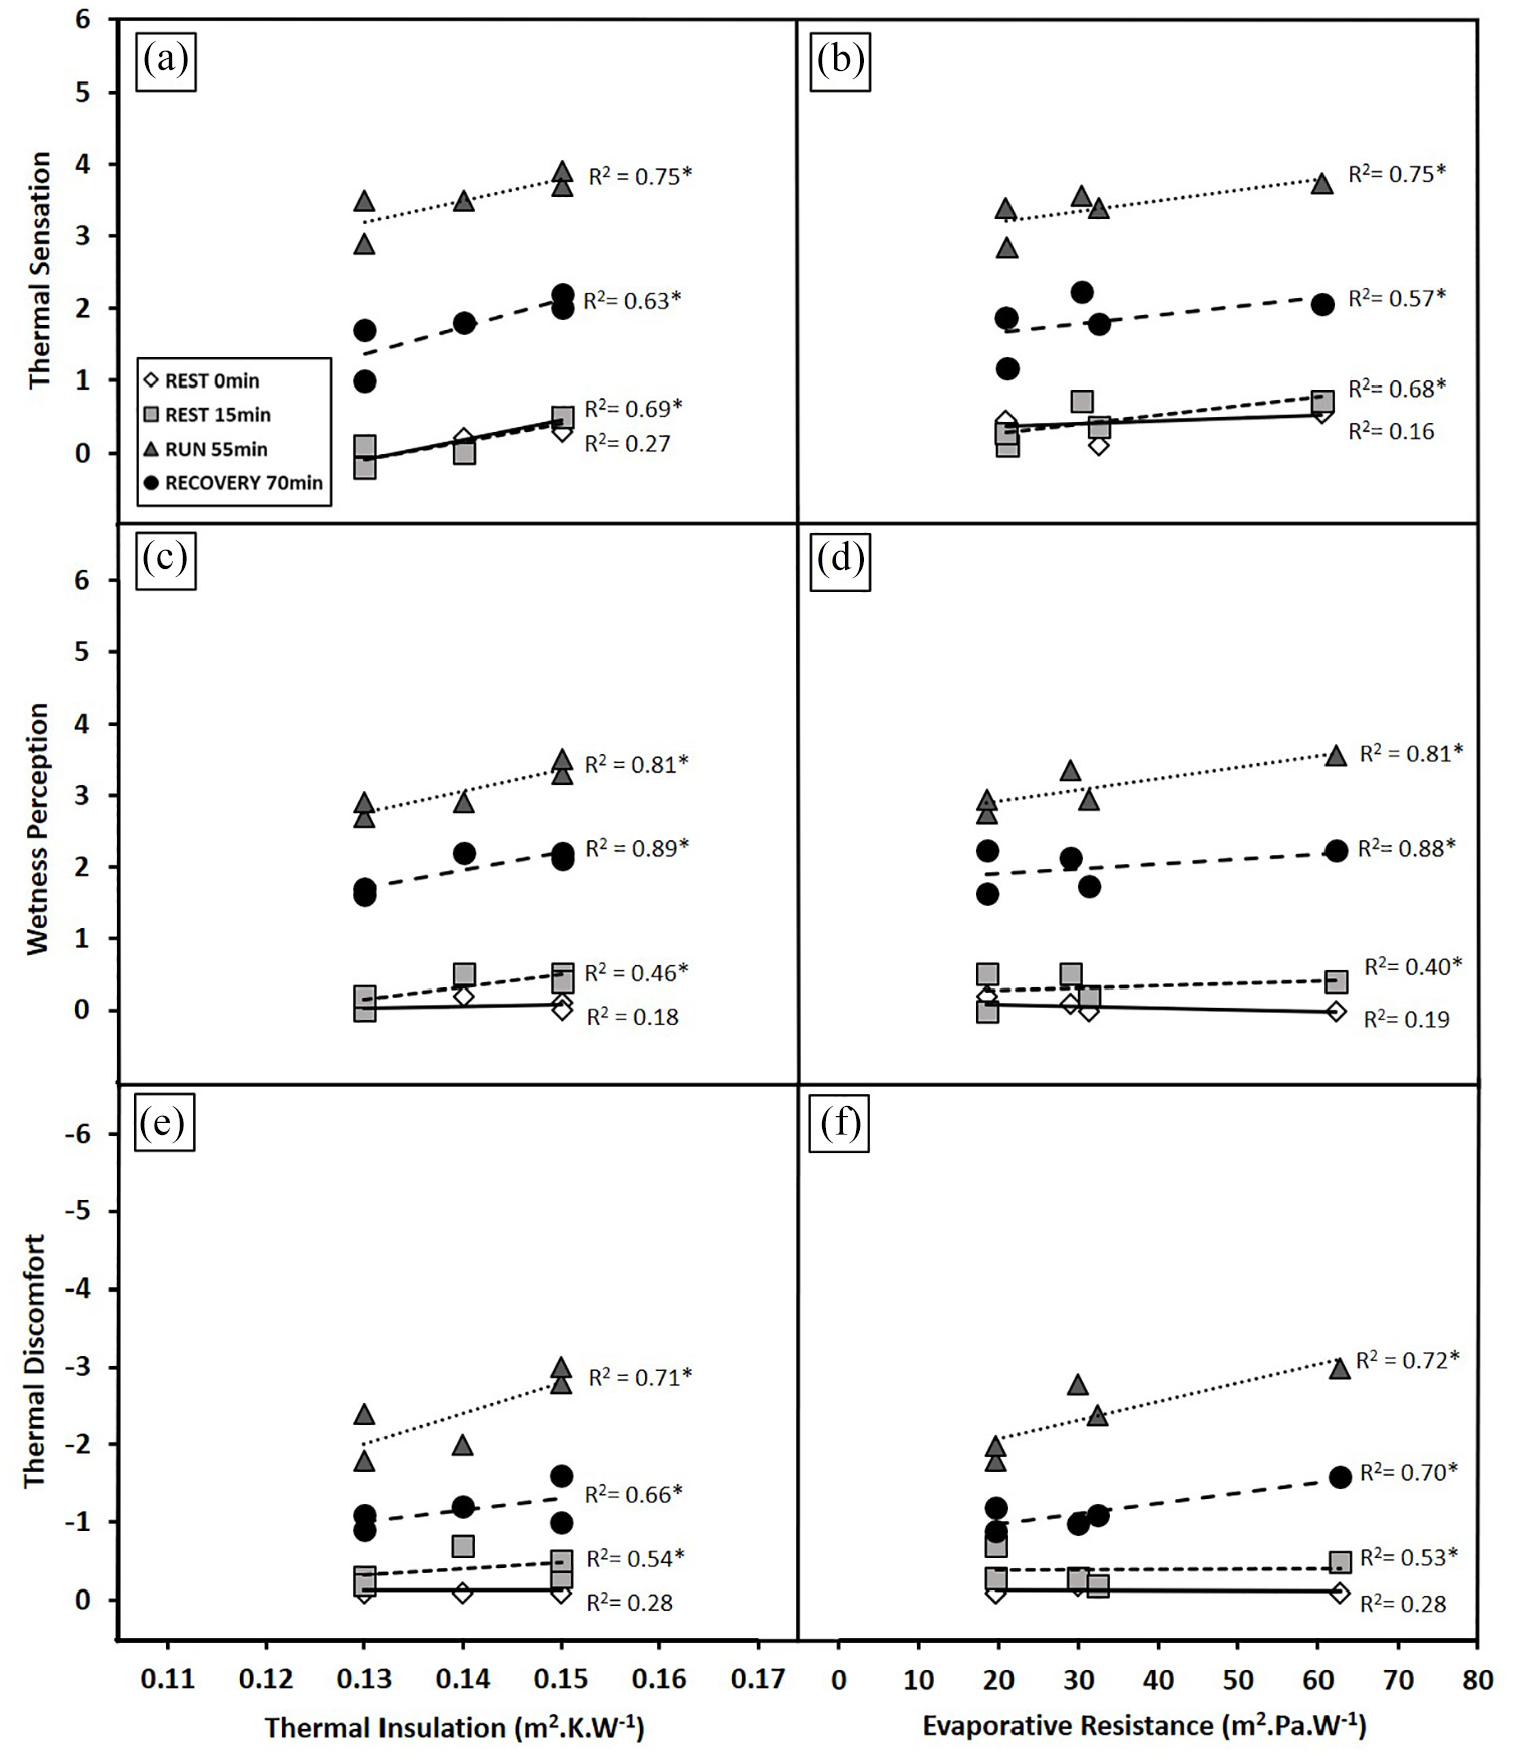
Relationships for thermal insulation and evaporative resistance with (a) and (b) thermal sensation, (c) and (d) wetness perception and (e) and (f) thermal discomfort. Perceptual responses assessed during the experimental protocol consisting of rest, run and recovery and thermal insulation and evaporative resistance determined using a thermal foot manikin. Relationships shown are for the means of individual shoes at different time points, however r2 and significance are reflective of analysis with individual data. *Indicates a significant relationship (p < 0.05).
Dry heat loss by thermal foot manikin regions
Dry heat loss by manikin foot regions were greatest at the toe region and lowest at the heel and sole regions (Table 4). The greatest variation in dry heat loss between footwear samples (38.8 ± 17.2 W·m−2) was observed at the upper foot region. Ventilation openings in the midsole and sock liner of MUo resulted in a 5.9 ± 4.2 W·m−2 higher dry heat loss at the sole region compared to MUc. The application of the sandwich mesh ventilation openings on the medial and lateral sides of PUow also resulted in a 28.8 ± 20.4 W·m−2 greater dry heat loss at the upper foot region compared to PUcw.
Total dry and evaporative heat loss for the upper, toe, sole and heel regions for five footwear samples.
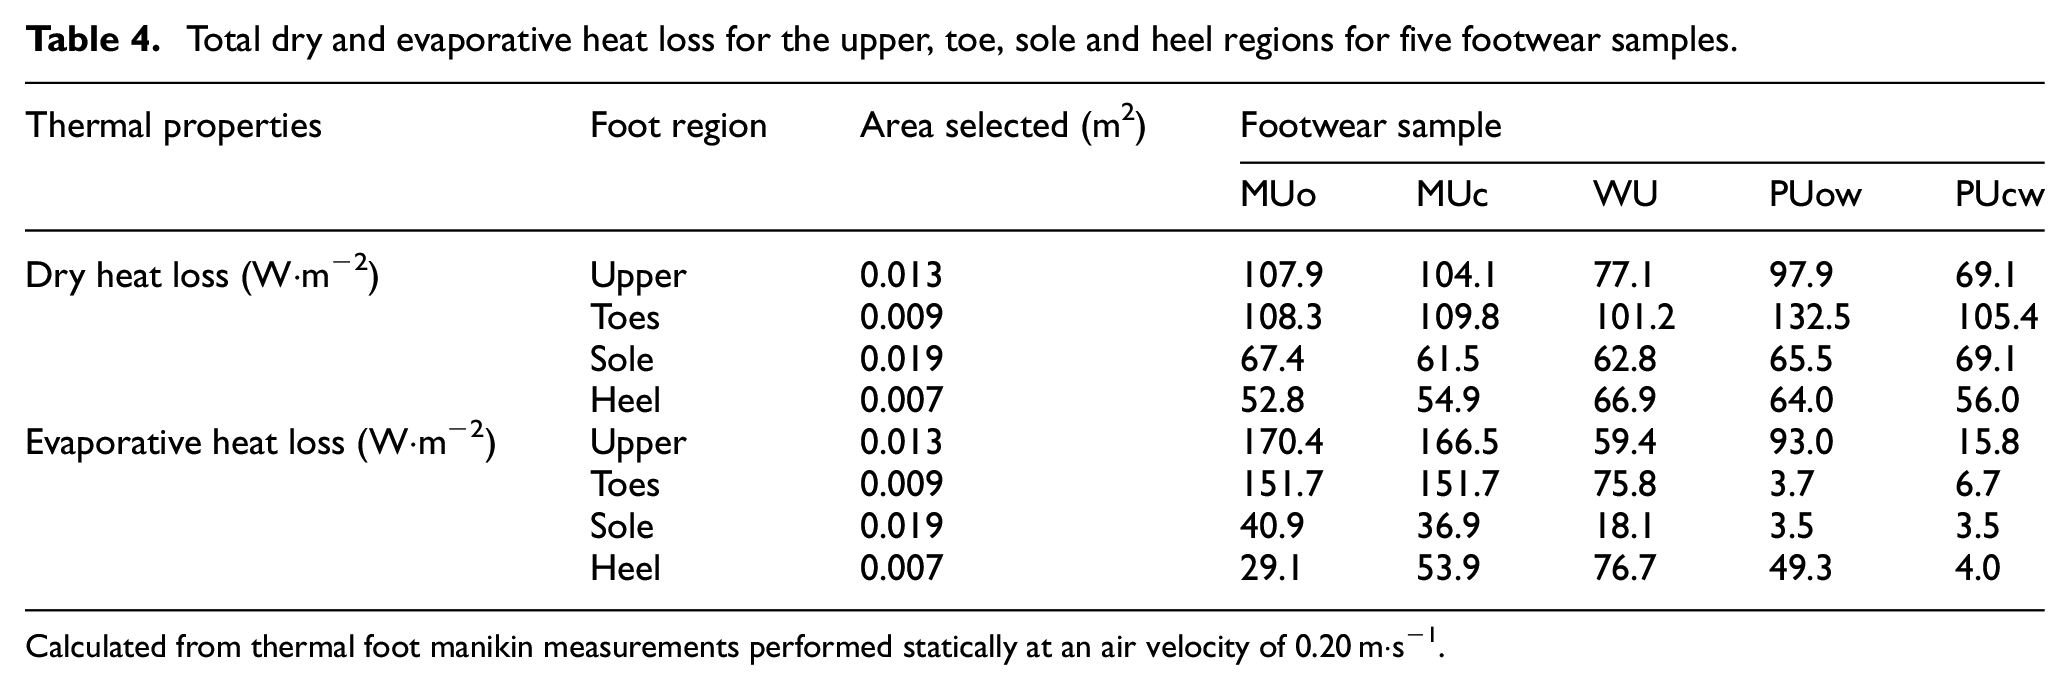
Calculated from thermal foot manikin measurements performed statically at an air velocity of 0.20 m·s−1.
Evaporative heat loss by thermal foot manikin regions
Due to a large range in evaporative resistance values between footwear samples and foot regions, evaporative heat loss showed substantial variation (Table 4). Evaporative heat loss was lowest at the heel and sole regions and highest at the upper foot and toe region. The greatest variation in evaporative heat loss between footwear samples (155 ± 67.4 W·m−2) was observed at the upper foot region.
Ventilation openings in the midsole and sock liner of MUo did not improve evaporative heat loss compared to MUc (41 and 36 W·m−2, respectively). However, the application of the sandwich mesh ventilation openings on the medial and lateral sides of PUow improved evaporative heat loss by 77 W·m−2 in comparison to PUcw at the upper foot region.
Thermal perception by foot regions
The sandwich mesh ventilation openings on the medial and lateral sides of PUow and the ventilation openings in the midsole and sock liner of MUo did not result in significantly lower thermal sensations, perceptions of wetness or reduced thermal discomfort in comparison to PUcw and MUc at the upper foot or sole regions, respectively (p > 0.05).
Discussion
Thermal foot manikin measurements have primarily focused on the evaluation of protective or occupational footwear for use in cold conditions.8,10,15,16 Little information is available regarding the thermal properties of footwear for use in warm environments and/or with physical activity. In addition, the relationship between thermal perception obtained from human participants during wear trials and thermal foot manikin measurements needs validation and was therefore the aim of this study.
Thermal foot manikin measurements
In the current study, despite substantial differences in the materials and the construction of the shoes assessed, the range in overall thermal insulation measured was limited to 15% (0.13–0.15 m2·K·W−1). However, the range in overall evaporative resistance varied substantially (19.7–62.8 m2·Pa W−1). This could explain the lack of relationship observed between evaporative resistance and thermal insulation (r2 = 0.33, p = 0.31; Figure 4). The largest local difference in thermal insulation and evaporative heat loss between footwear samples (0.07 m2·K W−1 and 155 W·m−2, respectively) were primarily observed at the upper foot region. This is not surprising considering most variation in shoe design occurs in the construction of the shoe upper.
Ventilation openings applied to the midsole and lateral and medial sides of the shoe upper resulted in lower overall thermal insulation and evaporative resistance in comparison to shoes without ventilation openings. Differences in shoe construction also resulted in regional improvements in thermal insulation at the upper and sole region and evaporative heat loss at the upper region. Ventilation openings in the sole however, did not improve evaporative heat loss in this region.
It has been shown that body movement and exposure to wind enhance heat and vapour transfer by convection and can therefore reduce the level of thermal insulation and evaporative resistance provided by clothing.27–29 In the current study, the air speed within the climatic chamber was constant and stable around the thermal foot manikin and was regulated to 0.2 m·s−1. This air speed is lower than the recommended air speed of 0.4 m·s−1 for whole body manikin testing as outlined in ISO15831 (2004). Regardless, air speeds used to assess the thermal properties of clothing/footwear are not realistic of air speeds generated through body movement and exposure to wind during wear conditions. In an applied sense, it could be expected that participants in the current study, running at a speed of 8.5 km·h−1, would have elicited an air speed close to 2.4 m·s−1 with fluctuating air speeds between 0 and 5 m·s−1 around the foot.
Lower air speeds and thermal foot manikin measurements being performed in static conditions with the absence of a pumping effect caused by insufficient movement between the thermal foot manikin and footwear may therefore not represent the level of thermal insulation and evaporative resistance provided by the footwear during actual wear conditions. Walking movements alone have previously been reported to reduce clothing insulation by 20% to 30%28,30 and the combination of walking movements in air velocities of 4 m·s−1 have been reported to reduce evaporative resistance by up to 80%.27,31 Therefore, although a high level of sensitivity was observed in thermal foot manikin measurements, it is important to consider that measurements performed dynamically, such as a moving foot, rolling against a solid surface 21 and with greater air speeds could be more sensitive to ventilation features or fabric air permeability and also indicate greater effects of specific differences in shoe construction than currently reported.
Relationship between thermal perception, in-shoe measurements and thermal foot manikin measurements
During physical activity, thermal discomfort has previously been attributed to the evaporative resistance and accumulation of moisture within a clothing ensemble, rather than the level of thermal insulation provided. 12 In the current study however, despite the limited range in thermal insulation achieved between footwear samples, at the end of rest, thermal sensation was governed by thermal insulation (r2 = 0.69, p < 0.001). During exercise however, thermal sensation, wetness perception and thermal discomfort were governed by both thermal insulation and evaporative resistance.
These results suggest that subjective evaluations of footwear in wear trials do not have the same sensitivity and discriminative power of that achieved with thermal foot manikin measurements. It has previously been reported to be difficult to subjectively discriminate between temperature and moisture accumulation within footwear. 4 Moreover, the perception of wetness in shoes has been shown to be dominated by tactile inputs generated at the skin which alter cutaneous perceptions of wetness independently of the presence or level of moisture.4,7 Together, these findings indicate a more complex interaction of parameters for the subjective evaluation of footwear comfort. Despite this, it seems logical that a shoe which provides greater thermal insulation, greater evaporative resistance and consequently unfavourable changes to shoe microclimate would be perceived, in the end, as warmer, wetter and more uncomfortable. Indeed, changes to shoe microclimate over time and between shoe conditions have previously been reported to be perceivable by the wearer. 4 Subjective evaluations of footwear will therefore indicate links between parameters, but clear differences based upon design features/attributes (e.g. ventilation openings, air permeability and coatings) may be harder to subjectively identify.
With this being considered, the high sensitivity of thermal foot manikin measurements in the identification of differences (small or large) in footwear design remain valuable for footwear research, innovation and development. However, it is important that interpretation of these differences are considered in the context of what may be perceivable to the wearer, relative to the cost and resources associated with incorporating engineered design features.
Limitations
This study has several limitations. Firstly, thermal foot manikin measurements were performed statically. Hence, no pumping effect within the shoe is present. Secondly a low air speed of 0.2 m·s−1 was used. Considering the influence of body movement and wind on clothing heat transfer, static measurements in low wind may not be reflective of the insulation and evaporative resistance provided during wear conditions, 30 especially where the shoe has design features to increase ventilation. A dynamic measurement with greater air speeds may have resulted in more substantial variation in thermal insulation and would have indicated to a greater extent the impact of specific design features/attributes. Hence, more realistic wind speeds for walking/running would be appropriate to increase sensitivity of the manikin data. Secondly, perceptual scales with additional descriptors and greater sensitivity could have resulted in a higher level of discriminative power for the subjective evaluation of footwear and will therefore be considered for subsequent studies. Furthermore, although participants were not allowed to visually inspect footwear samples or have insight into the design features/variations, some inferences based upon the styles could have influenced their perceptions. Finally, it is important to consider that the correlation analysis is based upon the evaluation of thermal properties and subjective evaluations for five footwear samples only.
Conclusion
This study is the first to show thermal foot manikins to provide an effective and sensitive evaluation of the thermal properties of footwear for use in warm environments and with physical activity. Thermal foot manikin measurements were reflective of changes to in-shoe temperature and in-shoe absolute humidity during wear trials and indicated a high level of sensitivity with regard to footwear design features/attributes. The subjective evaluation of footwear however, did not seem to achieve the same level of sensitivity or discriminative power.
In order to further increase sensitivity of the manikin testing, more realistic air speeds are required, for example, around 1.2 m·s−1 for walking and 2.4 m·s−1 for running. A dynamic foot, pushing the foot against a surface (or vice versa), similar to the movement in gait, would further improve realism and sensitivity, but may be technically challenging. Interpretation of thermal foot manikin measurements should be considered in the context of what may be perceivable by the wearer, relative to the cost and resources associated with incorporating engineered design features.
In an applied sense, the use of thermal foot manikin measurements may help to assign footwear with a ‘label of insulation’ or a ‘label of evaporative resistance’, improving the transparency and comparability between product categories for consumers and providing the possibility to choose footwear appropriate to individual preferences and use. However, measurable improvements to the level of thermal insulation and evaporative resistance may not always be perceived by the wearer.
Footnotes
Declaration of conflicting interests
The author(s) declared no potential conflicts of interest with respect to the research, authorship, and/or publication of this article.
Funding
The author(s) disclosed receipt of the following financial support for the research, authorship, and/or publication of this article: The research presented was funded by adidas Future team, adidas AG, Germany and the Environmental Ergonomics Research Centre, Loughborough Design School, Loughborough University.