
Abstract
The cleanroom environment is fundamentally influenced by the required class of cleanliness, with thermal conditions not primarily set to ensure occupant comfort. The inability to adjust temperatures, combined with strict clothing policies that do not consider clothing insulation, often leads to user dissatisfaction, potentially compromising cleanliness. Without insulation values, thermal comfort assessment, prediction of comfort temperatures, or clothing optimisation are impossible. This study aimed to determine the thermal insulation of 15 frequently used cleanroom clothing ensembles for ISO 8 to ISO 5 cleanliness using a thermal manikin. For each ensemble, the comfort air temperature was predicted according to ISO7730, and the predicted mean vote (PMV) was assessed for different ambient temperatures. Thermal insulation values ranged from 0.71 clo to 1.16 clo, resulting in predicted comfort temperatures between 17.6°C and 21.1°C. The assessment confirmed that cleanroom ensembles differ in thermal insulation depending on the class of cleanliness, leading to variations in thermal perception. Different levels of thermal satisfaction, described using the PMV index, were predicted in cleanrooms with the same air temperature but various prescribed ensembles. Selecting suitable clothing can achieve thermal comfort even in cleanrooms where user adjustment of temperature is not possible. This can account for different activity levels, personal preferences, and gender, leading to higher user satisfaction and more efficient cleanroom operation. Further research into suitable textiles and alternative clothing options is suggested to improve thermal comfort, especially for higher indoor air temperatures or specific body zones.
Keywords
Introduction
The rapid development and trend of using the latest high-tech technologies in many sectors beyond the healthcare or space industry show an increasing need for cleanrooms. Undoubtedly, the design and operation of cleanrooms face even higher technological demands and greater emphasis on energy efficiency than before. ‘Despite the wide automatization, people still play an important role’ 1 in most cleanroom operations. ‘Considering the fact that people present the major source of contaminants’,1,2 it is not only the pre-training of staff, but also their well-being which should receive a greater priority to avoid ‘inappropriate behaviour caused by dissatisfaction’, 1 which can ‘significantly influence the cleanroom operation’, 1 not only by the lower quality of products but also by the level of contamination.
In cleanrooms, indoor environmental conditions are fundamentally influenced by the required cleanliness following ISO 14644-1 3 or GMP Annex 1. 4 As the study of Roškotová and Adamovský 5 highlighted, the cleanroom environment is not primarily set up to provide a suitable working environment that enhances the thermal comfort of users; therefore, a higher dissatisfaction with the environment is likely. Mora et al. in their study 6 stated that in cleanrooms, and unlike in many other types of indoor environment, thermal comfort is only a secondary consideration, often overlooked in favour of cleanliness. According to GMP Annex 1, the air temperature and relative humidity are set according to the requirements of the product and the ongoing processes. 4 In many cleanroom applications, due to the installed precise air conditioning or sensitive technologies and processes, user adjustment of comfort temperature is often not possible. Unfortunately, the maintained conditions frequently do not correspond to the level of activity and the required clothing.
In general, most of the thermal comfort studies of cleanrooms, such as literature reviews7,8 or real case studies,9–12 focus on the environment of operating theatres. Some studies also used the advantages of Computational Fluid Modelling (CFD) for the prediction of thermal comfort in operating rooms.13,14 Studies15–18 investigated indoor environmental quality or thermal comfort in healthcare facilities and studied the perception of the environment by patients, nurses, and doctors; however, most of these facilities were not designed or operated as cleanrooms. Within the operating theatres, as several studies have pointed out, difficulties have been found to ensure thermal satisfaction among all occupants on the account of different activities, clothing levels, and personal preferences.6,19–21 Generally, thermal comfort in operating theatres is closely monitored to enhance the success of the surgery, but rarely are all participants fully satisfied within the environment. As a priority, conditions are set on behalf of the patient, 22 resulting in a faster recovery. 23
With COVID-19, new thermal comfort studies focused on the healthcare sector have been published.24,25 Many studies examined the impact of Personal Protective Equipment (PPE) on the well-being of healthcare workers during the pandemic and evaluated the level of heat stress with related consequences.26–28 The PPE used by hospital staff during COVID-19, due to similar conditions of use and properties such as the barrier filter against particles 2 or limited heat and moisture transfer 29 compared to, e.g., office clothing, is partially similar to the clothing used in other cleanroom applications. Contrarily, extreme work conditions, the level of stress, demanded long-term shifts together with extreme exhaustion of healthcare workers24,30 significantly affect the perception of the environment compared to other cleanroom workers who were not affected by similar psychological and physical demanding tasks. Additionally, clothing protection against liquids, which is not used in all types of other cleanroom applications, can significantly influence heat and moisture transfer and affect the level of thermal comfort.
It can be assumed that working conditions in other cleanrooms are generally less demanding than in, for instance, surgery or intensive care units during the COVID-19 pandemic. However, the strict policy of cleanroom operation still does not allow many adjustments in order to satisfy the needs of cleanroom users. Thermal stress caused by inadequate temperatures, as many studies, including the case study of Chinnaduari et al. 31 showed, can have an adverse effect on health and productivity. Furthermore, as Lee et al. noted in their study, 24 the use of PPE heightens the risk of thermal stress.
Moreover, each class of cleanliness requires different clothing ensembles 32 with different thermal insulation, resulting in variations in comfort temperatures, but the thermal conditions do not change appropriately. 33 A typical cleanroom clothing consists of a coverall, a coat, or a two-piece suit with additional accessories, such as gloves or overboots, depending on the actual class of cleanliness. With higher cleanliness, a more complex clothing ensemble is required. 32 Nevertheless, increased body coverage, along with clothing properties, may result in thermal discomfort for wearers. 32
Unfortunately, low thermal satisfaction often leads to adaptive actions taken by cleanroom users to improve thermal comfort and overall well-being. 5 As the investigation carried out in six research cleanrooms showed, more than 90 % of the respondents declared performing at least one adaptive action with the aim of higher thermal satisfaction. 5 Nonetheless, the simplest and most effective action of changing the number of clothing layers was found to represent a high risk to the desired cleanliness when an inappropriate choice of material (e.g. cotton) or clothing layer is made. 33 Furthermore, exposure to an unexpected source of contamination in cleanrooms can result in higher energy consumption, lower quality products with production delays, postponement of research and consequently higher operating costs.5,34 Even in such a specific environment, appropriate measures can mitigate the issue of unsuitable conditions and improve the well-being of users.
Unlike clothing designed for other types of environment, the thermal insulation of cleanroom clothing cannot be estimated on the basis of tabular data, as these specific ensembles are not included in the standards ISO 9920 34 and ISO 7730. 35 A comparison of the thermal insulation of different coveralls from standard ISO 9920 34 explained the impossibility of using these thermal insulation values for cleanroom garments due to different properties and intended use. 33 As Skoog et al. 15 acknowledged in the study of the thermal environment in hospitals, incorrect identification of thermal insulation can easily lead to misleading results in thermal comfort assessment. 1 In many thermal comfort studies of hospital cleanrooms, no detailed description of the dressed clothing and material is revealed. Therefore, the values can hardly be used for further studies.
The next method to determine the thermal properties of clothing by testing the thermal resistance of textile materials used for cleanroom clothing offers an easy solution for the assessment of flat textiles. However, Matusiak and Sybilska 36 pointed out that with devices such as Alambeta or Permetest, the air layer between the skin and the inner layer of clothing or between two layers of clothing is not considered. Abreu et al. 37 concluded that the air layer between the skin and clothing contributes to more than 55 % of the thermal insulation of clothing. Thus, with this method, it is not possible to capture the overall effect of the clothing on the wearer essential for the thermal comfort assessment.34,37 Other methods, such as mathematical models based on heat balance equations 38 do not accurately account for the effect of uneven thickness of air layers between different layers of clothing or clothing and skin.
Clearly, as Roškotová and Adamovský 33 found out, the most suitable method to determine the thermal insulation of cleanroom clothing is the thermal assessment of clothing by means of a thermal manikin that follows the standards ISO 15831 39 or ISO 9920. 34 Despite the undoubted benefits of this method in the form of high accuracy and repeatability, a high investment outlay together with time-consuming experiments carried out by skilled personnel involving significant operating costs, the result is a low application of this method. As Matusiak and Sybilska 36 noted, this method is not commonly applied to the testing of regular clothing and is preferably used for the testing of special ensembles with protective properties. Despite the availability of determined thermal insulation of selected medical clothing using a thermal manikin in studies of Pamuk et al. 40 Bogdan et al., 41 Zwolińska and Bogdan 29 or Abreu et al., 37 the values are not transferable to represent cleanroom clothing in general due to different textiles and properties, cuts and fits of clothing, and also differences in the intended use of clothing (single-use vs reusable clothing).
As stated above, the results of comfort studies in the healthcare sector are not fully transferable to all types of cleanroom applications and among other cleanroom applications, such as the microelectromechanical system laboratory investigated by Wang et al., 42 the thermal comfort of the occupants is still rarely considered or evaluated. Also, with the current absence of relevant sources of thermal insulation values for different cleanroom ensembles, a thermal comfort evaluation is inaccurate and the determination of comfort temperatures is impossible, as well as the feasibility of a search for more suitable clothing options and materials that are beneficial, especially in cleanroom environments without possible temperature optimisation. 33 Therefore, more comprehensive research of thermal insulation of cleanroom clothing using a thermal manikin is essential. When determining the thermal insulation of cleanroom clothing by a precise method of thermal manikin, the quality of the indoor environment in cleanrooms can be improved, the number of discontented occupants lowered and their productivity and well-being enhanced, the risk of sudden contamination can be minimised and result in a higher efficiency of cleanroom operation with lower operating costs.
Based on the aforementioned findings, this study hypothesises that cleanroom ensembles differ from each other depending on the class of cleanliness and related different clothing requirements, resulting in varying thermal insulation that affects the thermal perception of the environment and comfort temperature. Knowledge of thermal insulation is crucial to improving the thermal comfort of cleanroom users. The main aim is to present outcomes that, when applied, help improve the thermal comfort of cleanroom users in various types of cleanroom applications. The following objectives were set to fulfil this aim: • Determination of suitable cleanroom ensembles for ISO 8 to ISO 5 classes of cleanliness based on the literature review and onsite investigation to create a summary of commonly used specific clothing for various cleanroom environments in non-healthcare applications. • Assessment of the thermal insulation of each cleanroom ensemble by a precise method of a thermal manikin to address the absence of values in existing literature and standards, which is beneficial both for cleanroom design and operation. • Prediction of comfort temperature for each ensemble based on ISO 7730 to understand the real effect of clothing on body heat balance and related thermal comfort of the wearers. • Additionally, the predicted mean vote index PMV was determined to show differences of thermal sensation under certain conditions.
Methodology
Thermal manikin and calculation of clothing insulation
To determine the thermal insulation of the selected cleanroom ensembles, the stationary Newton manikin placed inside the climatic chamber was used. The surface of the Newton thermal manikin is divided into 36 independently heated and controlled zones (Figure 1) that can be grouped together into 18 segments representing individual body parts for a further analysis of local thermal insulation or thermal comfort assessment (Table 1). The assessment was conducted following the standard ISO 15831.
39
The experimental position of the stationary thermal manikin was chosen to best represent the standing posture and activities of cleanroom users during their daily work tasks in various laboratory and industrial settings. Based on our findings from cleanroom visits, these users typically have limited and irregular movement or position changes, which can be imitated by a stationary manikin. Unfortunately, this setting does not include the important dynamic effect of activity on clothing, such as the “pumping effect” addressed by Havenith and Nilsson,
43
which affects heat exchange. However, elastic cuffs tucked into additional accessories, such as gloves, overboots, or hoods, can help mitigate this effect by limiting air exchange with the environment. For all experiments, the manikin was operated in the mode of constant (uniform) surface temperature 34 ± 0.2°C in all zones. The maximum change in heat flux remained below ±2 %. The accuracy of skin temperature control is ±0.1°C and the accuracy of measuring the heat flux is ±1 %.
44
Newton thermal manikin and division into individually controlled body zones.
44
Body zones and body segments with respective areas of the thermal manikin.

To calculate the total thermal insulation of the clothing ensemble, an interval of 30 minutes was selected to apply the parallel method from the standard ISO 15831.
39
Total thermal insulation was calculated using equations (1) and (2):
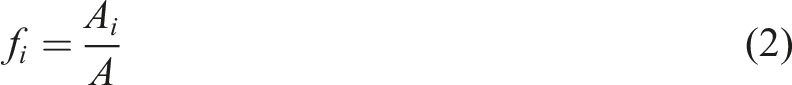
The total thermal insulation I
t
considers the thermal resistance from the skin surface to the environment and takes into account all clothing and enclosed air layers, but also the boundary air layer. However, to understand the real effect of clothing on body heat balance and to allow the thermal comfort assessment and the prediction of comfort temperatures, the basic (intrinsic) clothing insulation I
cl
was calculated by equation (3):
The clothing area factor f
cl
represents the ratio of the surface area of the clothed body to the surface area of the nude body and can be determined by the photographic method explained in ISO 15831 or estimated by the following empirical equation (4) given in ISO 9920:
34

The effective thermal insulation I
cle
, calculated by equation (5) helps to understand the effect of the addition of a layer of clothing or a clothing ensemble compared to the nude body of the manikin.
The thermal insulation of the surface air layer I a was determined by measurement with the nude manikin under the same environmental conditions and manikin posture as for the analysed ensembles and was calculated using the equation (1), where the total thermal insulation I t was replaced by I a .
Initially, the measurement of the nude manikin was performed and was followed by the measurement of the dressed manikin in different ensembles. The measurement of each ensemble lasted at least 30 minutes, during which the steady-state conditions were maintained. Each ensemble was tested twice and the experiment was considered valid when the difference in the results of these cycles was less than 4 %. Then, the value of the total thermal insulation was calculated as the average of both cycles and used for further calculations and analysis.
Climatic chamber and testing conditions
All experiments were conducted in the controlled environment of a climatic chamber located at the University Centre for Energy Efficient Buildings, Czech Technical University in Prague. The dimensions of the chamber were
4.4 m x 3.1 x 2.9 m, which met the criteria for the thermal insulation assessment given by the standard ISO 15831. The following environmental conditions were maintained for the duration of each measurement: • ambient temperature: 20.68 ± 0.08°C (Std.) • relative humidity: 46 ± 9%, • relative velocity: 0.05 ± 0.01 m/s.
Intentionally, the maintained air velocity was lower than stated in the standard ISO 15831 (<0.4 m/s) due to the mixed-flow type of the air distribution system. Otherwise, with a higher air velocity, the homogeneous ambient conditions would not have been achieved. Moreover, the prescribed air velocity in the standard does not represent lower air velocities in the majority of cleanrooms. Based on the requirement defined in ISO 15831, the ambient temperature was set at least 12°C below the skin temperature to allow a sufficient heat flux of at least 20 W/m2 in all zones.
Characteristics of thermal manikin sensors.

Characteristics of additional sensors.
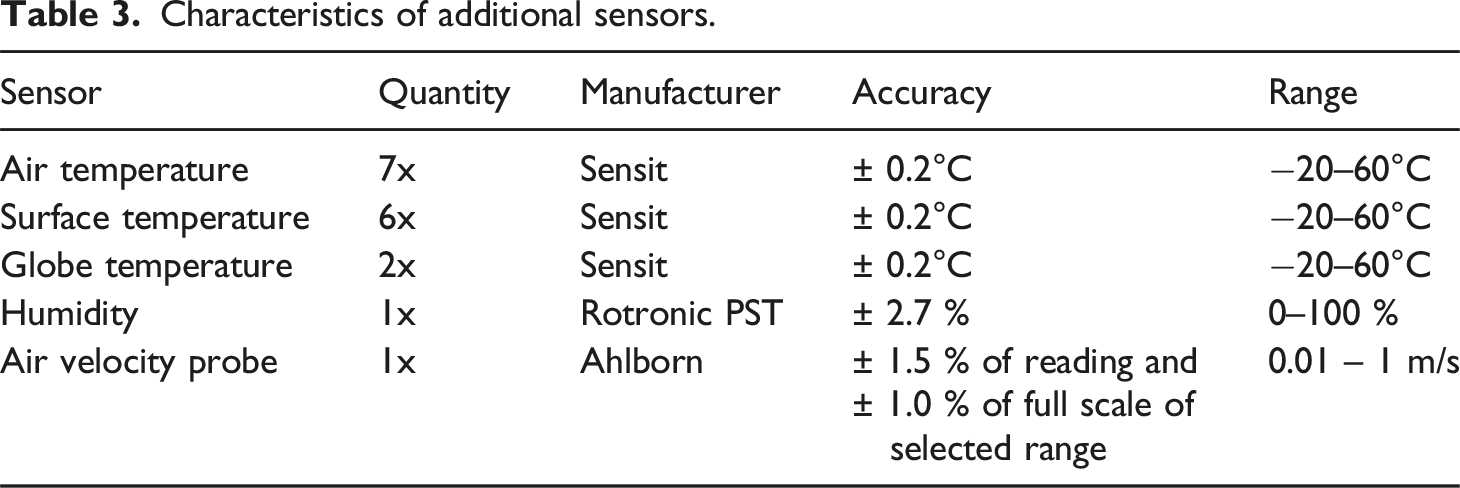

Layout of installed measurement equipment and sensors.
Selected clothing ensembles
In this study, 15 cleanroom clothing ensembles were selected for the thermal insulation assessment. These ensembles (No. 1A to No. 6C) represent the sets of garments frequently used in cleanrooms with the class of cleanliness ISO 8, ISO 7, ISO 6 and ISO 5. Based on the findings from previous cleanroom visits, the given class of cleanliness of these ensembles is not strictly defined or followed, for example, ensemble No. 2A for ISO 8 cleanliness may be found even in ISO 7 cleanroom depending on the actual requirements of each application. In particular, the use of additional accessories (e.g. gloves, overboots, etc.) may vary according to the specific requirements of applications.
Description of cleanroom clothing ensembles.

Abbreviations: (C) – cotton; EVA – ethylene-vinyl acetate; N – nitrile; NW – nonwovens, disposable; PES – polyester; PP/C – knitted fabric polypropylene/cotton with silver ion content.
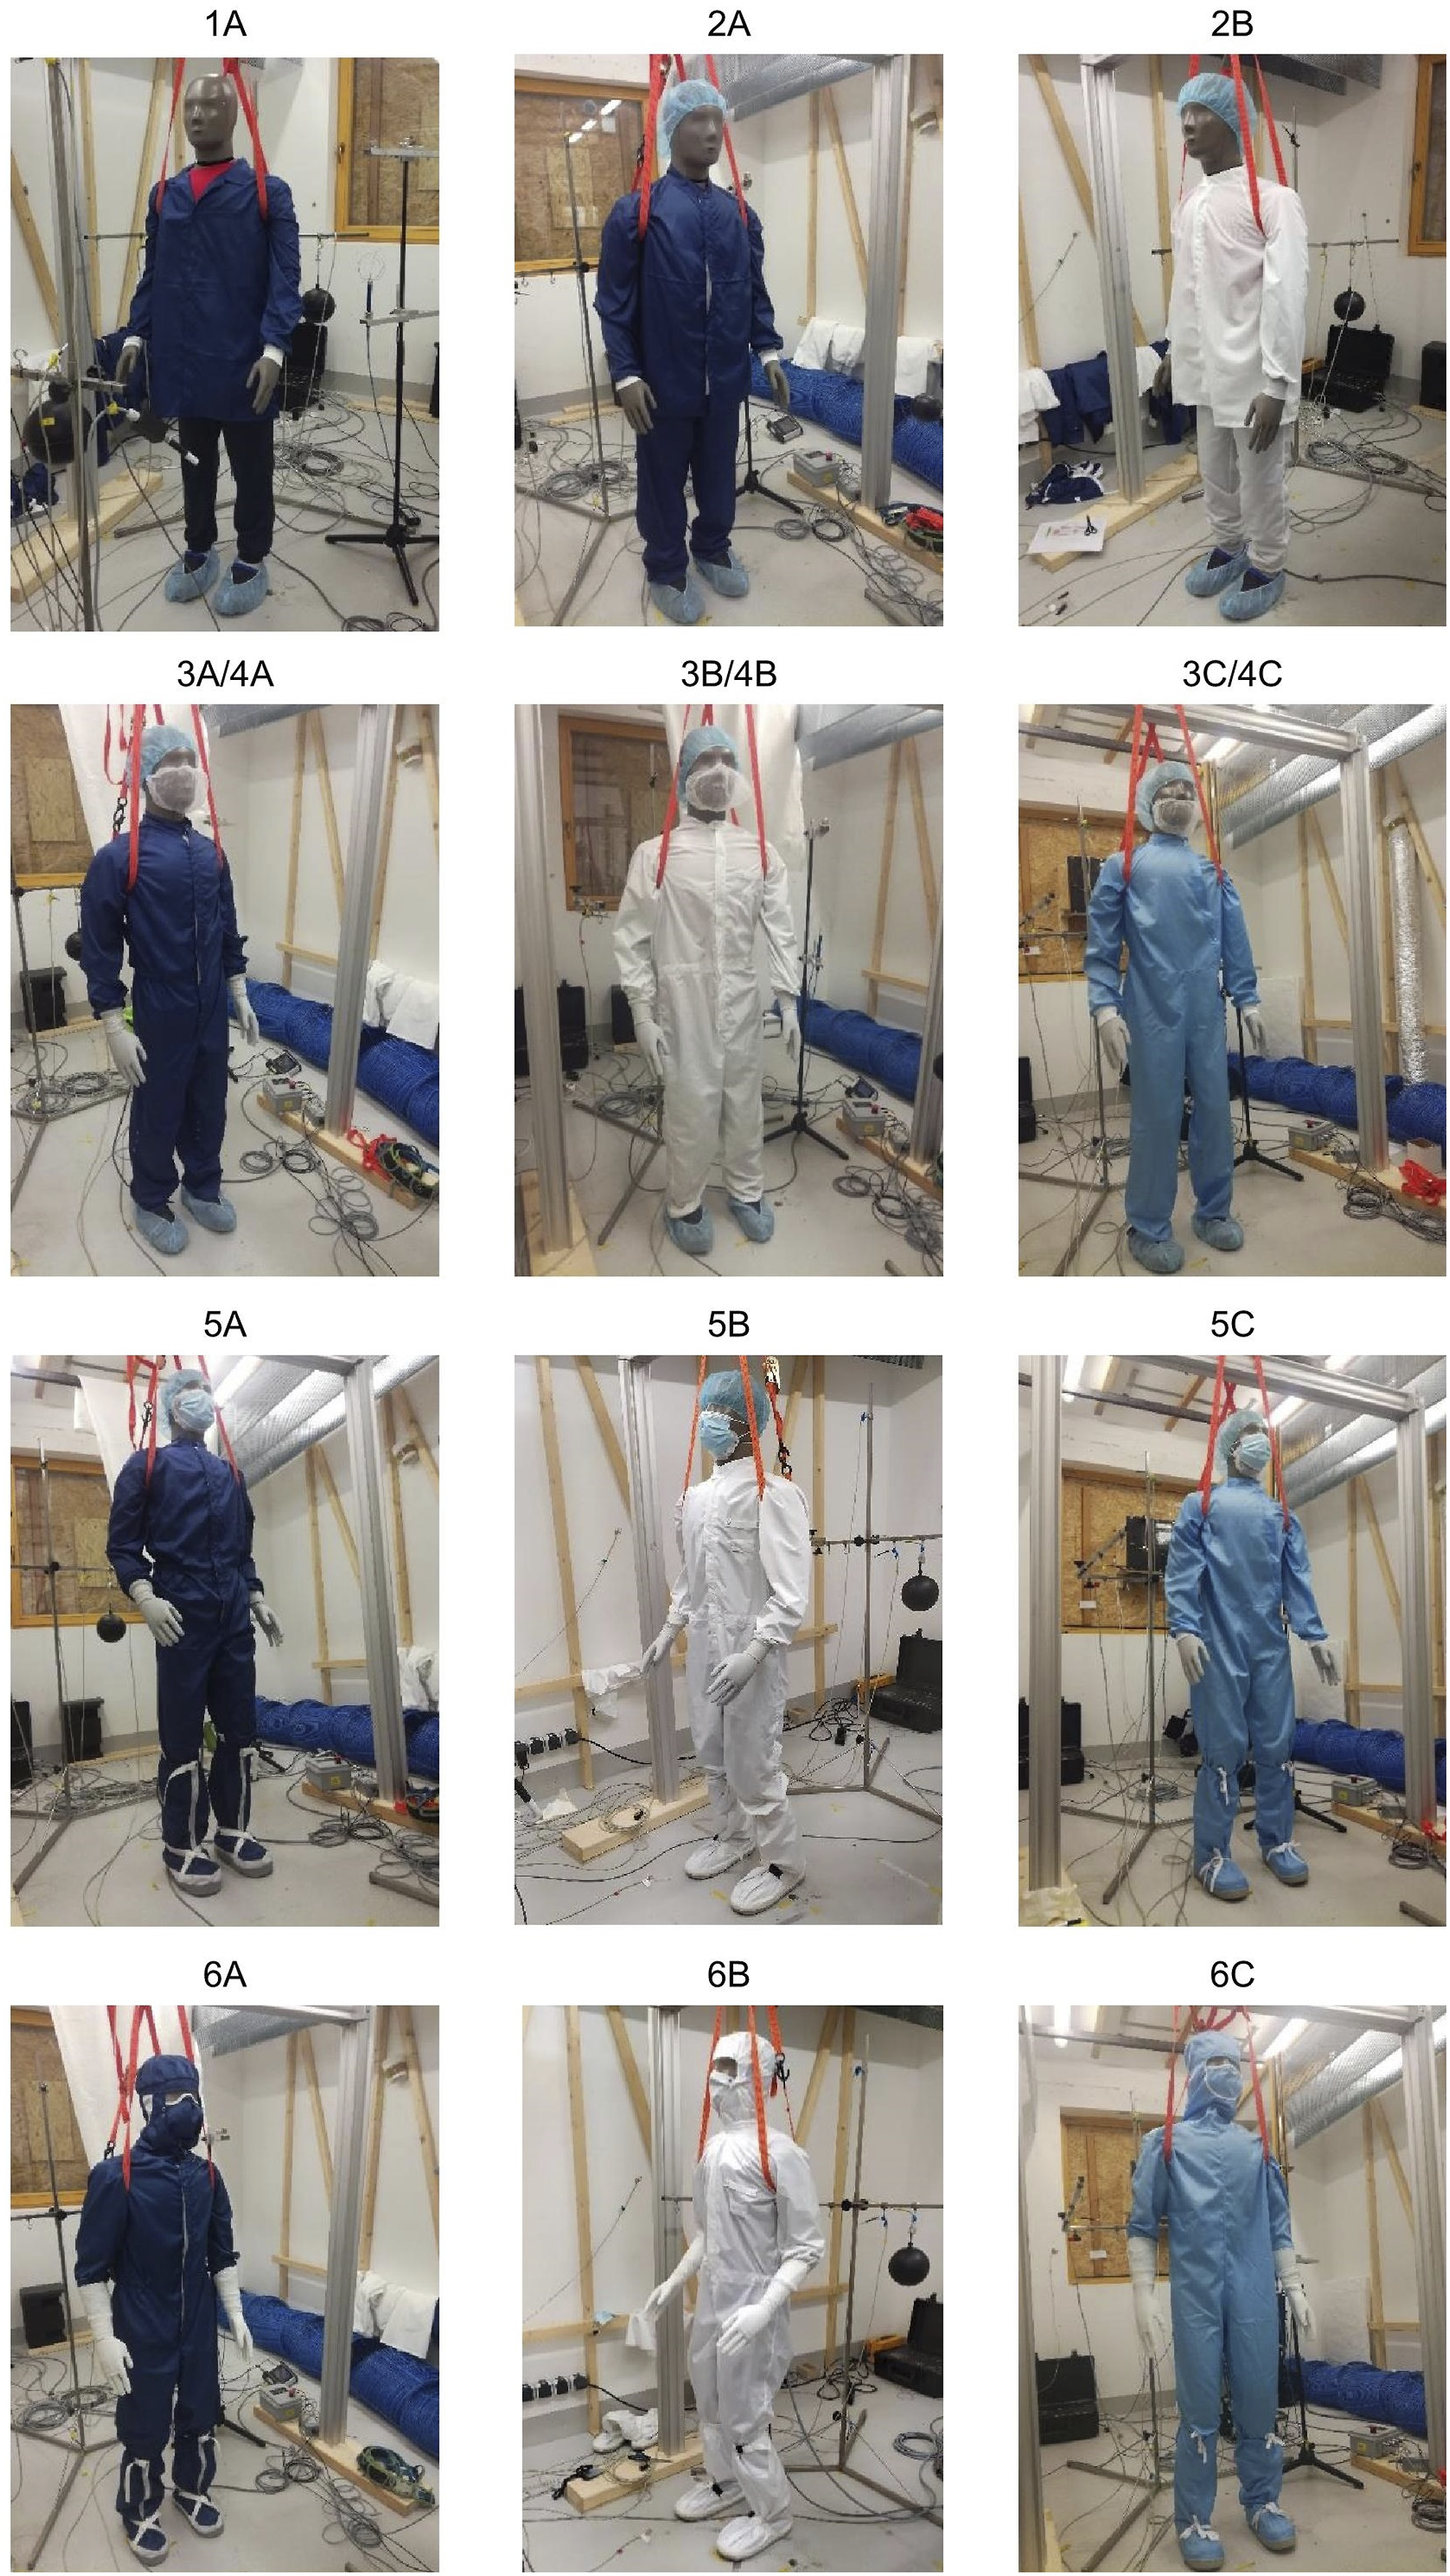
Selected cleanroom ensembles.
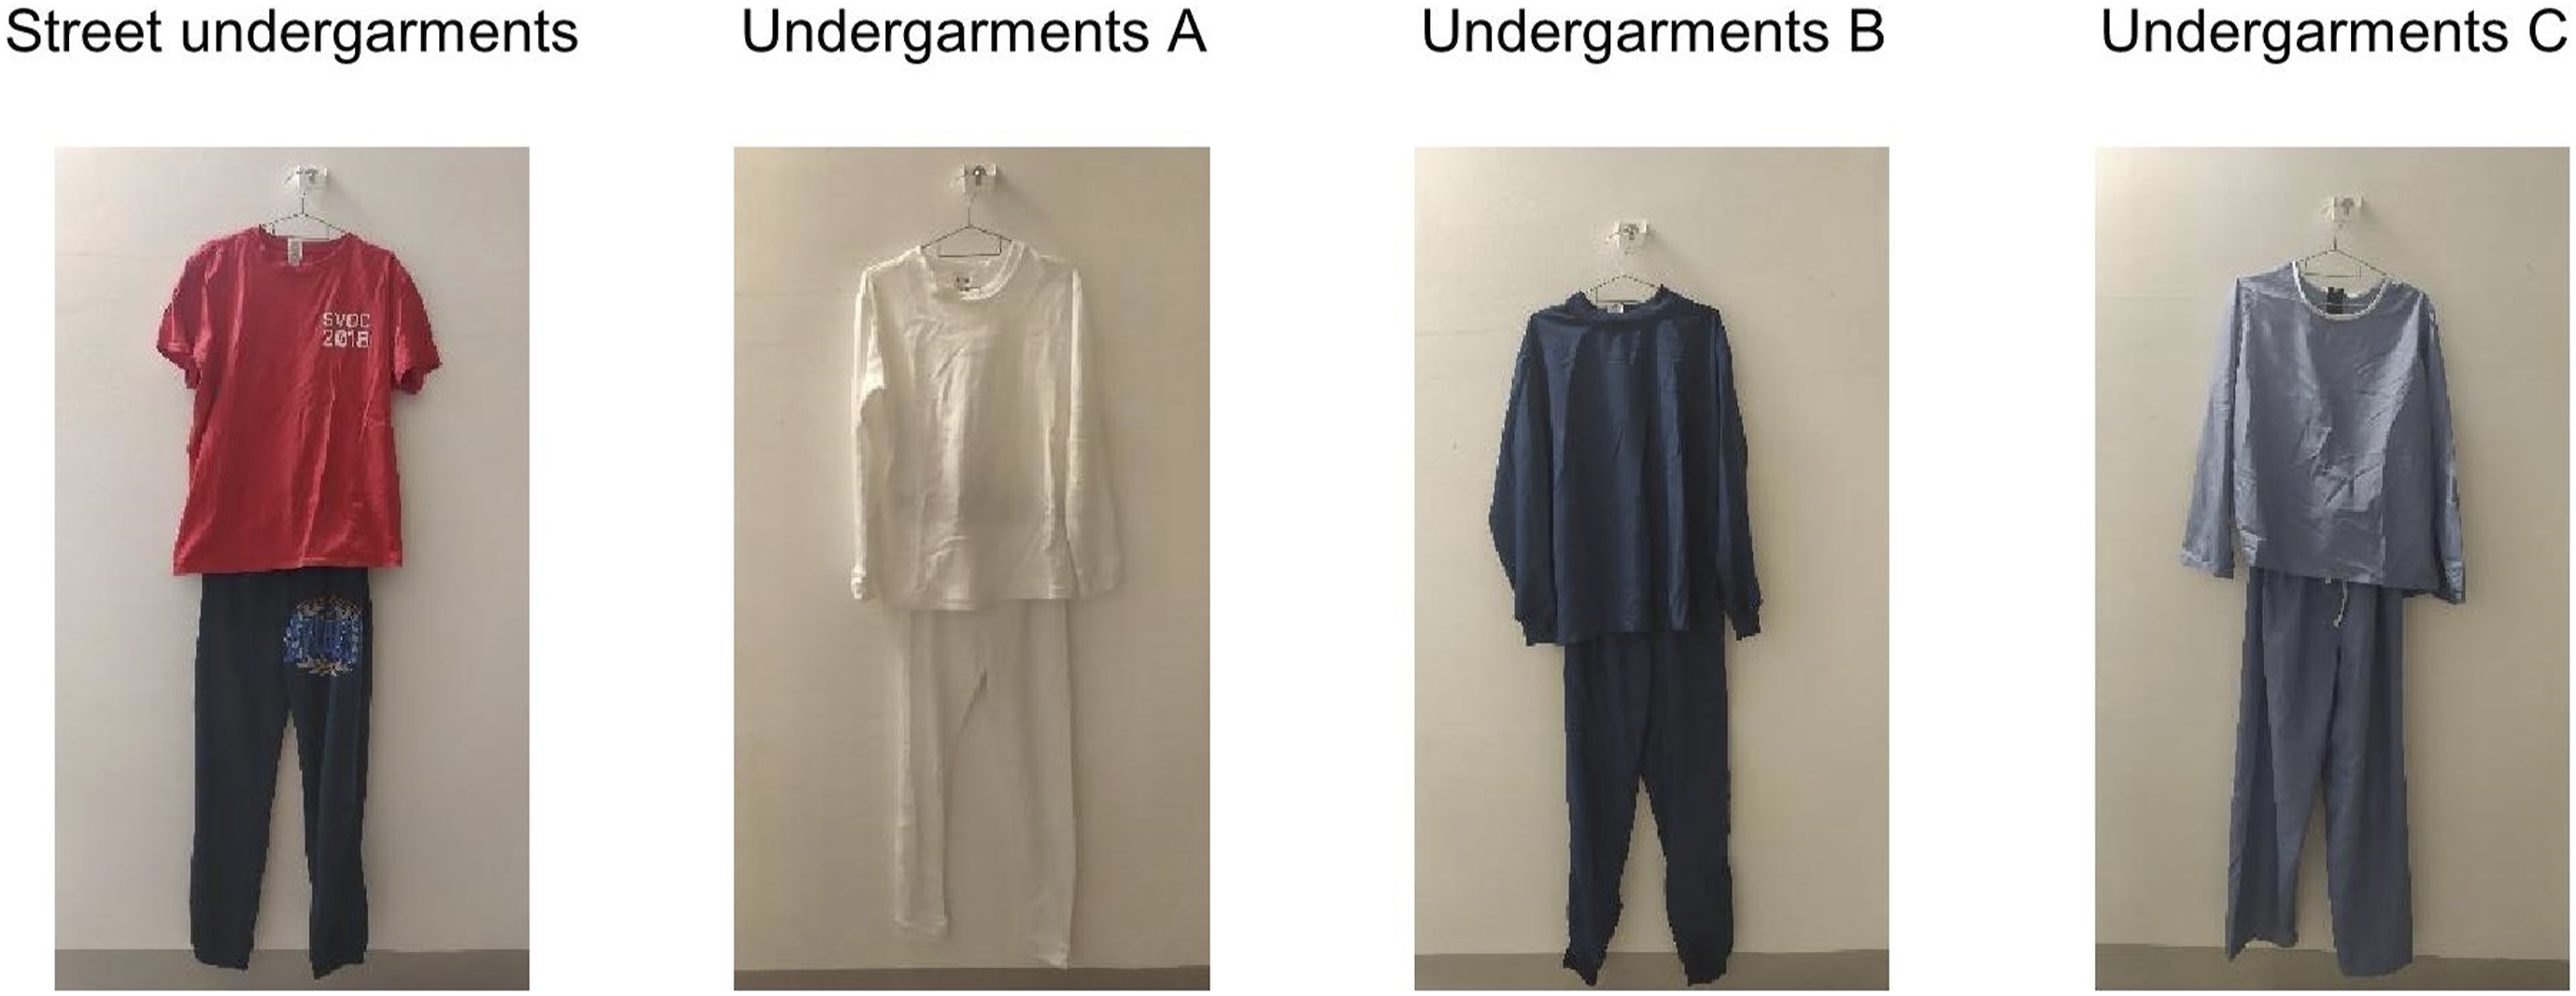
Types of cleanroom undergarments used for ensembles.
Thermal comfort assessment
The possible impact of clothing thermal insulation on the thermal comfort of cleanroom users was expressed with the use of comfort air temperature and the predicted mean vote index (PMV). The predicted comfort air temperature for each ensemble was iterated by inverting the formula designed for the calculation of PMV in ISO 7730.
35
The following boundary conditions were set for the calculation: • air temperature = mean radiant temperature, • air velocity = 0.15 m/s, • relative humidity = 45 %, • a light activity of a standing person, 93 W/m2 = 1.6 met, • effect of sweating neglected due to light activity, only sensible heat was considered, • PMV = 0, PPD = 5 %.
Besides given personal and measurable factors, additional factors which influence the thermal comfort sensation, such as age, gender, or personal preferences and other psychological factors, were not considered. Then, for all ensembles with different thermal insulation, the comfort temperatures were predicted to satisfy the PMV = ± 0.5, PMV = ± 0.2 and PMV = 0. Within this range, the Predicted Percentage Dissatisfied (PPD) does not exceed 10 % of dissatisfied occupants. 35
Results
Validity of experiments
For all selected clothing ensembles, the percentage differences between both test cycles met the criteria for the validity of the thermal insulation assessment. The percentage differences ranged from 0.11 % to 2.23 % (Figure 5), with the majority (73.3 %) below 1 %. When performing the same procedures and avoiding human errors, differences in results are likely caused by the occurrence of new or modified air layers under garments. The position of each garment may vary slightly due to the necessity of redressing the thermal manikin before each test cycle, resulting in the change in the overall interaction of the clothing layers and other accessories. However, this fully corresponds with the real use of clothing. Percentage difference in the total thermal insulation of ensembles from two test cycles (ISO 8 – yellow, ISO 7 – blue, ISO 6 – red, ISO 5 – green).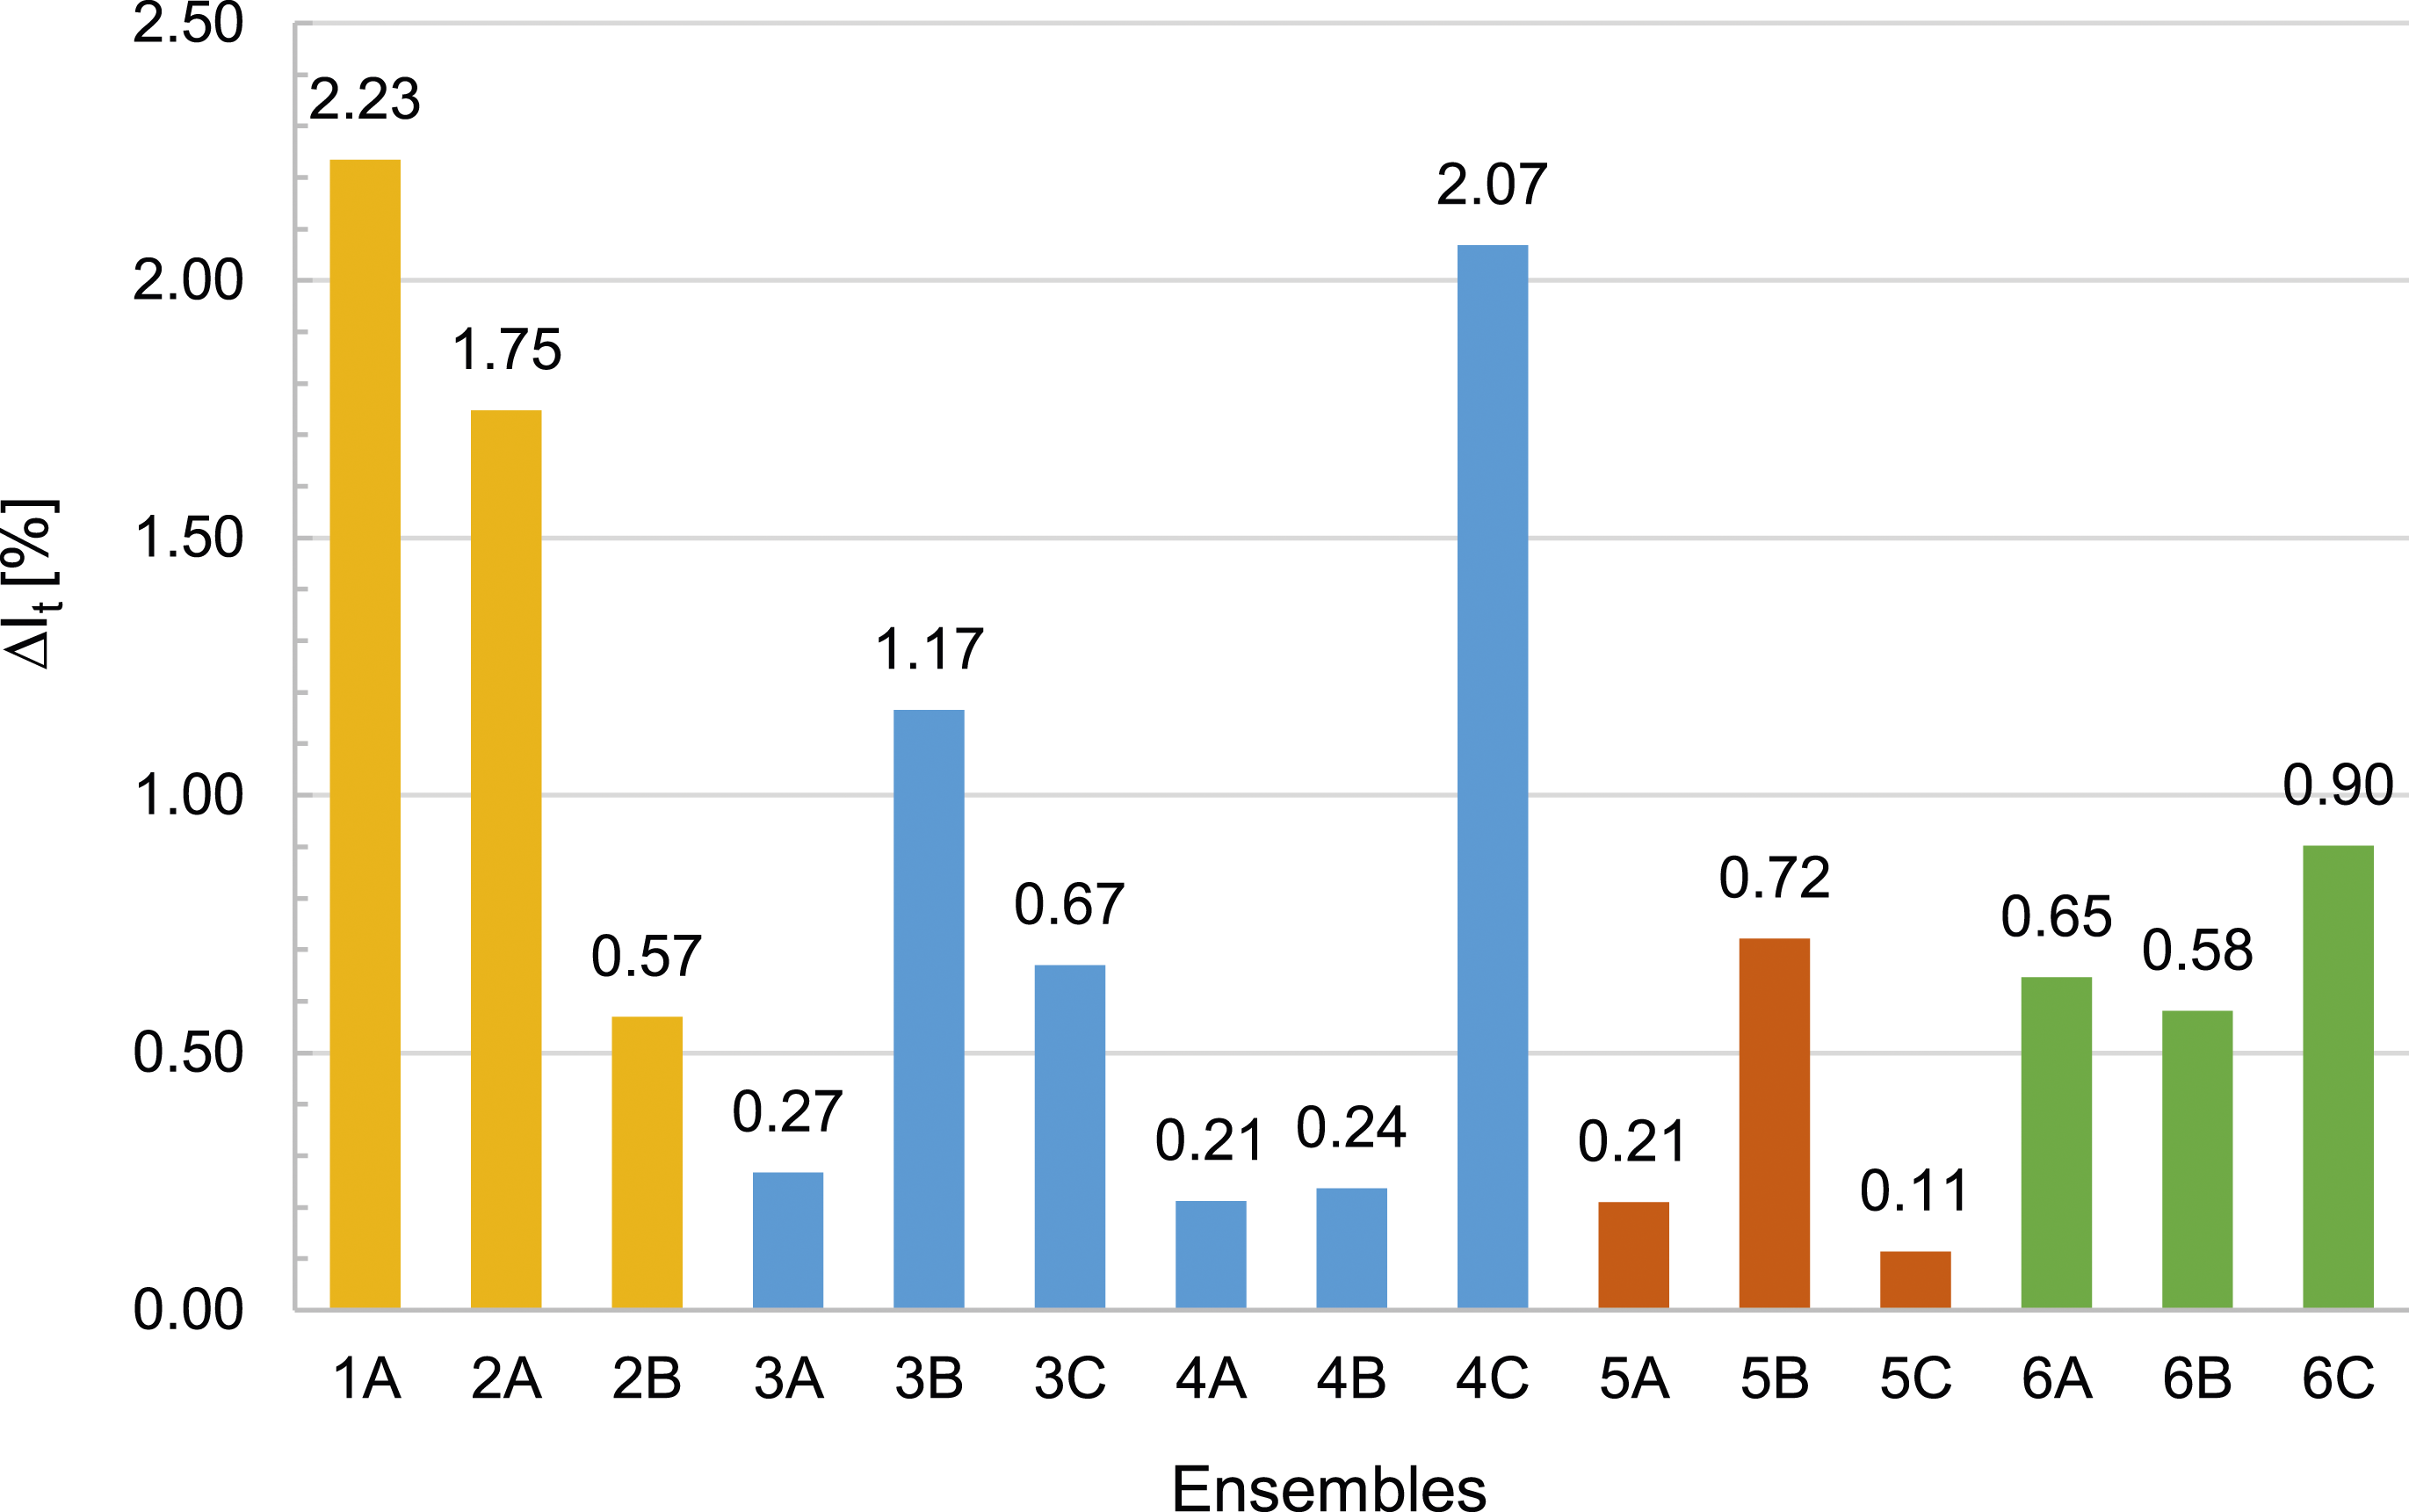
Assessment of the thermal insulation
A one-way ANOVA (Analysis of Variance) was conducted to test differences in thermal insulation between ensembles across different classes of cleanliness (ISO 8, ISO 7, ISO 6 and ISO 5). The results indicated that thermal insulation significantly varies (F (3, 11) = 4.19, p = .034) according to the class of cleanliness. A linear regression analysis revealed a strong relationship between cleanliness and thermal insulation (Multiple R = 0.72, R2 = 0.52, p = .003) indicating that cleanliness significantly affects the thermal insulation values of the ensembles, with higher thermal insulation associated with higher cleanliness. According to the post-hoc statistical analysis (Tukey HSD Test), significant differences were found only between the ensembles for cleanliness ISO 8 to ISO 5 (p = .032). Marginally non-significant differences were detected between ISO 7 and ISO 5 (p = .066).
Results of the experiments.

Calculated basic thermal insulations for each ensemble displayed in Figure 6 are coloured by a different class of cleanliness. On average, the basic thermal insulation I
cl
was 35.8 % lower than the total thermal insulation I
t
, ranging from 0.71 clo to 1.16 clo. Clearly, the lowest percentage difference between I
cl
and I
t
was found for ensembles with the highest total thermal insulation due to the highest clothing area factor. Basic clothing insulation of the cleanroom ensembles. (ISO 8 – yellow, ISO 7 – blue, ISO 6 – red, ISO 5 – green).
The thermal insulation of the boundary air layer equal to 0.68 clo accounted for an average of 45.4 % to the total thermal insulation.
For ensembles A, when same undergarments were considered, additional accessories and a different area weight of a fabric resulted in an increase of 0.08 clo for ISO 6 (5A) compared to ensemble 4A for ISO 7 and an additional increase of 0.15 clo for ISO 5 (6A). Similarly, the changes in the sets of ensembles C accounted for an increase of 0.09 clo for ISO 6 (5C) and a further increase of 0.1 clo for ISO 5 (6C). In contrast, the I cl for ensembles B used for ISO 5 (6B) increased by 0.1 clo compared to ISO 7 (4B), but for ISO 6 (5B) the insulation increased by 0.01 clo only. In a comparison of ensembles A for ISO 8 and ISO 7, the changes in the upper clothing layer resulted in an increase of 0.24 clo when a coverall (3A) was used instead of a coat (1A) and a reduction of 0.05 clo when a two-piece suit (2A) changed to a coverall (3A). In contrast, replacing the two-piece suit with the coverall in ensemble B did not result in any change in the insulation.
Prediction of comfort temperatures
With the known basic insulation of clothing, the comfort air temperature was determined for each clothing ensemble. In Figure 7 the predicted comfort temperatures are displayed for each ensemble. The values range from 17.6°C to 21.1°C and describe the importance of choosing the suitable ensemble in a given indoor conditions of the cleanroom environment. The average predicted comfort temperatures for ensembles designed for different cleanliness are the following: 19.8°C for ISO 8, 19.3°C for ISO 7, 18.8°C for ISO 6 and 18.0°C for ISO 5. Obviously, the higher thermal insulation of ensembles resulted in a lower comfort temperature required for the thermal satisfaction of the users. Predicted comfort air temperatures (PMV = 0) for each analysed cleanroom ensemble and additional comfort temperatures for different levels of PMV.
Discussion
Comparison of ensembles
Thermal insulation of ensembles based on the cleanliness
The analysis confirmed the hypothesis of differences between ensembles based on the class of cleanliness. This indicates that the assessment of thermal insulation of cleanroom ensembles is essential and a single representative value cannot be used to describe thermal insulation of ensembles across different cleanliness.
Analysing the results by ANOVA, significant differences between the thermal insulation of ensembles designed for various classes of cleanliness were found. According to the post-hoc statistical analysis, the significant differences were found only between the ensembles for cleanliness ISO 8 to ISO 5. Marginally non-significant differences were detected between ISO 7 and ISO 5 ensembles, which may warrant further investigation with a larger sample size. Results of linear regression analysis revealed the strong relationship between cleanliness and thermal insulation indicating that as the higher cleanliness is required (ISO 8 to ISO 5), the thermal insulation of the ensembles increases. This finding is consistent with expectations, as higher cleanliness levels involve more complex clothing sets with higher body coverage or clothing multilayers and advanced materials.
Although with higher cleanliness the thermal insulation of ensembles increased in general, the thermal insulation of the ensemble 2A (1.53 clo) exceeded the value of the next ensemble designed for the nearest higher class of cleanliness 3A (1.49 clo). According to the study of Matusiak and Sybilska, 36 ‘the thermal insulation of the air layers is much higher than the thermal insulation of the textile material’. The larger air layers created between the body surface and the clothing are responsible for a significant increase in thermal insulation compared to visually tight-fitting clothing, therefore, are likely responsible for the unexpectedly higher thermal insulation of the ensemble with the two-piece suit (2A) compared to the coverall (3A). The addition of a beard cover and gloves in 3A has not reversed this phenomenon due to low thermal resistance of the garment. However, the same thermal insulation of 2B and 3B raised the question of the level of possible interaction of two clothing layers, for example a shirt with trousers or uppergarments with undergarments. Furthermore, the fabric and its interaction with the body skin might also be partially responsible for the differences in the results between the ensembles.
Different types of clothing garments/undergarments and a number of additional accessories, resulting in different body coverage as well as textile properties with different thermal resistance and various clothing cuts, all accounted for the differences in thermal insulation. For example, with the addition of overboots and a face mask, the basic thermal insulation has increased by 0.08 clo for Ensemble 5A prescribed for ISO 6 (I cl = 0.9 clo) compared to Ensemble 4A for ISO 7 (I cl = 0.82 clo). Higher differences are visible when the cleanliness is increased from common class ISO 7 (4A, I cl = 0.82 clo) to the high cleanliness of ISO 5 (6A, I cl = 1.05 clo). Hence, adapting to higher cleanliness, than previously designed and maintained, can be difficult also in terms of implementing suitable ensembles as the differences are not negligible.
Thermal insulation with regards to different undergarments
Undergarments, their materials properties, and clothing cuts/fits play an important role not only in the barrier properties of ensembles but also in the level of thermal satisfaction. To show the effect of different textile materials of undergarments, the comparison of ensembles consisting of polypropylene (4A) or polyester undergarments (4B and 4C) and ensembles consisting of cotton undergarments (3A, 3B and 3C) was made. The change from cotton (3A) to polypropylene (including cotton with silver content (4A) resulted in a 0.13 clo decrease in the basic thermal insulation. Contrarily, the polyester material with carbon fibres accounted for the insulation increase of 0.11 clo (4B) and 0.05 clo (4C). Comparing the textile materials of the ensembles, the results confirmed a higher thermal resistance of the polyester fabric compared to the polypropylene mentioned by Abdel-Rehim et al. in their study 45 . In addition, a loose fit of the undergarments in Ensembles 4B and 4C and a tighter fit of the undergarments in Ensemble 4A, based on the visual assessment, also contributed to the differences.
Besides cuts and fits, different material solutions can serve as a possible alternative for users to cater personal preferences, generally leading to higher thermal comfort and thus overall satisfaction.
Thermal insulation with regards to different manufacturers
Three different manufacturers with various garment cuts, fits, and textile materials resulted in variations in thermal insulation among the similar type of ensembles. Clearly, slight differences in basic thermal insulation were found for Ensembles 3A, 3B and 3C (SD = 0.02 clo), which can be explained by the same brand of undergarments, whereas the highest variations were found for Ensembles 4A, 4B, and 4C (SD = 0.08 clo) with undergarments from different manufacturers. Hence, the variations are not mainly caused by differences in additional accessories, but more likely by properties of upper or undergarments. Although the properties of the accessories also vary, the impact of accessories on the overall value of thermal insulation may not be high compared to upper or undergarments due to their low thermal resistance, however, it can greatly affect the local insulation and subsequent thermal sensation in individual body zones.
Local thermal insulation of ensembles
In addition to comparison of overall values of thermal insulation, a detailed view into the local thermal insulation values was conducted with the use of graphs in Figure 8, where the differences in the local effective thermal insulation of the individual zones of each ensemble are displayed. Clearly, in some zones, the local effective insulation is much higher than in the rest of the body, representing the effect of a single garment as well as the interaction of different layers of clothing. Impact of clothing changes on the local thermal insulation of body segments. (a) Ensembles A for ISO 8 and ISO 7. (b) Ensembles A for ISO 7, ISO 6 and ISO 5. (c) Ensembles B for ISO 8 and ISO 7. (d) Ensembles B for ISO 7, ISO 6 and ISO 5. (e) Ensembles C for ISO 8 and ISO 7. (f) Ensembles C for ISO 7, ISO 6 and ISO 5.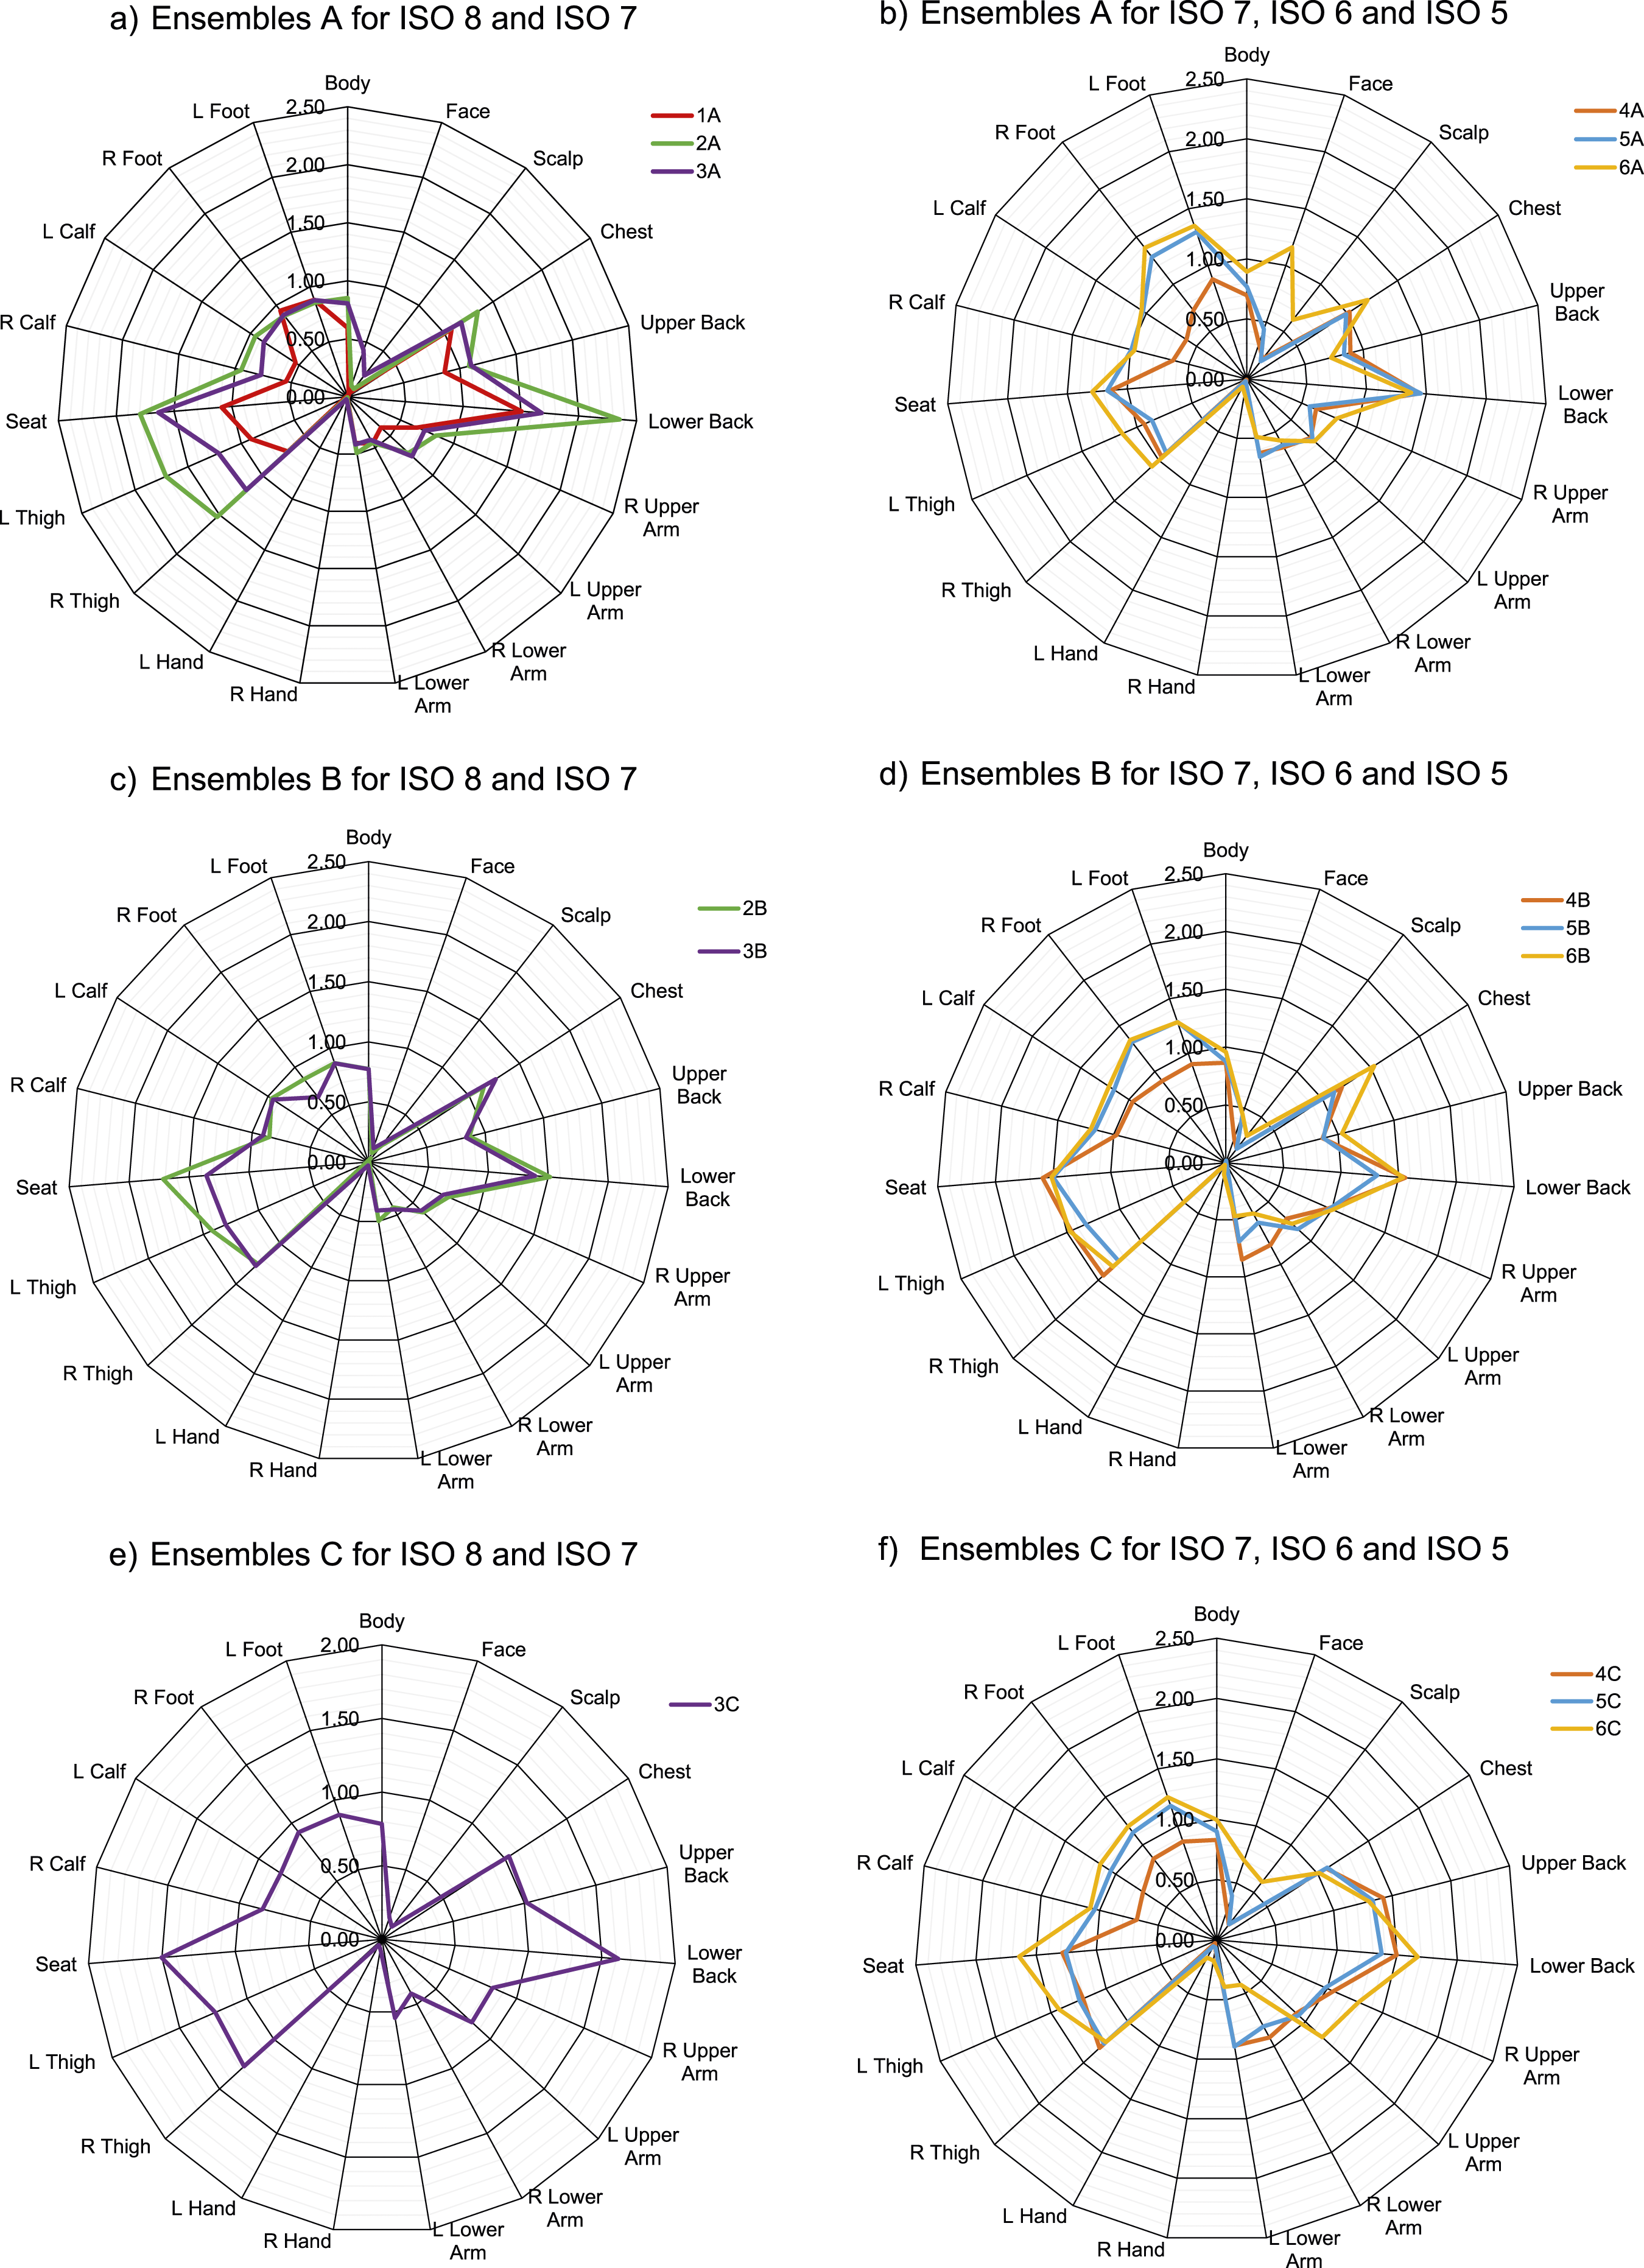
In general, the highest levels of the local thermal insulation for all classes of cleanliness were reached in the area of Lower Back, Seat, where trousers are overlapped by a shirt, thus the number of layers is higher at this point than in other zones, and in the area of Chest frequently followed by L and R Thigh.
Out of all ensembles, the highest local effective insulation was determined in the Back Lower zone of the Ensemble 2A consisting of a loose-fit two-piece suit (Figure 8(a)). The value increased by more than 40 % compared to the same area of the Ensemble 3A due to different cuts, the occurrence of new air layers and the interaction of the uppergarment with the undergarment. In addition, high changes were also found in the zones L Thigh and R Thigh.
The addition of overboots and a face mask due to the change of cleanliness from ISO 7 to ISO 6, the increase in the local effective insulation in some zones is clearly visible (Figure 8(b), (d) and (f)). As expected, especially in the area of the feet, the effective insulation more than doubled. Conversely, the insulation of the face has not changed significantly. Despite the low thermal insulation of the face mask itself, the difficult placement of the face mask on the manikin may have contributed to the lack of high differences.
The further improvement of cleanliness, demonstrated by the effect of the integrated hood and integrated face mask on the local insulation values is displayed as a substantial increase of 169 % and 81 % in the effective insulation in the Face zone for ensembles 5A/6A and 5C/6C, while for Ensembles 5B/6B the value remained similar. Tailoring of the garments, textile density, interaction of clothing layers with the body skin and the advent of new air layers may be responsible for these variations. Also, a major change, however not clearly visible due to the large scale of graphs, is attributable to the addition of sterile gloves, which are required for most cleanroom operations under ISO 5 conditions, resulted in the increase from 0.06 clo to 0.17 clo in the area of hands for Ensembles 5C/6C, detecting a possible change in the zonal thermal perception.
Summary of differences
As demonstrated in the results, the thermal insulation of the ensembles increases with higher cleanliness due to the increased coverage of the body surface by additional accessories such as gloves, face masks, or overboots. In some zones, there are more than two layers of clothing. Also, the density of the textile (e.g., comparison of Ensembles 5A and 6A) affecting the thermal properties increases with the requirement of barrier properties to minimize the pass through of particles. Nevertheless, the impact of each additional item is different which can be ascribed to the different cut, garment fit, and textile material of the garments, as well as the interaction with other layers of clothing or with the skin of the body. Therefore, the addition of the same garment to different ensembles can result in variations in thermal insulation.
The main causes of differences in thermal insulation can be explained by the following groups: • type of clothing (complexity of clothing set), • textile properties (density, thermal resistance), • addition of extra clothing layers (undergarments) or accessories (overboots, face mask, etc.) and related modification or advent of new air layers, • clothing tailoring (cut and fit, size), • interaction of clothing layers and clothing-skin interaction.
Impact of thermal insulation on predicted comfort temperatures and thermal comfort of cleanroom users
In general, the higher the cleanliness, the lower the comfort temperature for the prescribed ensembles. Therefore, to ensure the thermal comfort of cleanroom users, it is not possible to set the same temperature for all types of clothing. Otherwise, a different level of thermal sensation can be expected. Clearly, when dressed in any of the analysed ensembles with the basic insulation between 0.71 clo and 1.16 clo, thermal comfort (-0.5 < PMV < + 0.5) should be ensured in all cases for ambient temperatures between 18.5°C and 20.9°C (displayed in aforementioned Figure 7). Therefore, within this temperature range, the Predicted Percentage Dissatisfied (PPD) should not exceed 10 %. Contrarily, there is no acceptable ambient temperature that meets the comfort requirements of the highest category A (PMV level from -0.2 to +0.2, PPD = 6 %) of the thermal environment in ISO 7730 for all selected ensembles simultaneously. For ensembles with the lowest thermal insulation, the suitable temperatures range from 18.5°C up to 23.6°C, while for the highest insulation, conditions can go as low as 14°C.
Moreover, with known thermal insulation, the actual level of thermal satisfaction of cleanroom users expressed by PMV index can be predicted for different air temperatures. In general, it is a greater challenge to satisfy thermal comfort requirements of occupants in cleanrooms operated under higher cleanliness and with higher air temperatures because of the prescribed clothing layers that cannot be omitted. Based on the results of thermal insulation and the available selection of ensembles displayed in Figure 9, under conditions above 23°C a higher percentage of dissatisfied cleanroom users is likely. Furthermore, in ISO 5 cleanrooms, despite higher air velocities, thermal comfort may hardly be achieved when temperatures rise above 21.5°C. New sets of clothing consisting of layers from new materials or cuts can be the key solution to thermal comfort under these conditions. Predicted levels of thermal satisfaction (by PMV) for different air temperatures and selected clothing ensembles.
When indoor conditions are unsuitable, the selection of alternative clothing sets can prevent the risk of thermal discomfort. Furthermore, the thoughtful choice of alternatives can improve thermal satisfaction even in cleanrooms with strictly controlled conditions (e.g., precise air conditioning) where the temperature optimisation is not possible. As stated in ISO 7730, ‘the modification of the clothing can also contribute to balance individual differences’. 35 The selection of suitable undergarments, with regard to both materials and cut, can significantly help improve the satisfaction of cleanroom users. In certain thermal conditions, undergarments made of, for example, cotton with polypropylene, propylene, or polyester are all usable, but only some of them are suitable for these conditions based on the value of thermal insulation.
It is also important to note that, higher cleanliness garments can be used in cleanrooms with a lower level of cleanliness but not vice versa. Therefore, a garment intended for ISO 5 cleanrooms may substitute garment in ISO 7, and thus, on behalf of its higher thermal insulation, increases the comfort in cold conditions. For example, a coverall or two-piece suit can replace a coat for users with lower thermal sensation. Replacement will surely also have a positive effect on the reduction of particles generated by cleanroom users. Despite the benefits, financial costs have to be considered, as these options are not always feasible, especially in smaller cleanrooms with fewer users and types of ensemble. Contrarily, larger centres with more cleanrooms of different classes of cleanliness may use this advantage without additional costs and gain extra savings in lower operating and maintenance costs.
With thermal insulation assessment followed by thermal comfort assessment, it is possible to predict the level of thermal satisfaction with environmental conditions, as well as the suitable comfort temperatures for different ensembles. However, the real experience of users with the cleanroom environment may be different. Although the comfort temperatures are maintained, and the neutral thermal state should be achieved, the users can sense each body zone differently due to the aforementioned differences in local thermal insulation. Especially in the end parts of the body such as the head, hands, or feet, local perception can vary. Also, the risk of draught can play a role in the local perception of conditions. Therefore, it might also be beneficial to assess the perception in each body zone individually with the use of comfort zone diagrams introduced by Nilsson. 46
Limitations and further research
This study considers a static thermal insulation of clothing due to a light physical activity and low ambient airflow. In case of higher body movement or increased air velocity, which affect the value of thermal insulation with a subsequent impact on the level of thermal satisfaction, the effect of these factors must be taken into account by determining the correction factors for the calculation of dynamic clothing insulation, as Havenith and Nilsson declared in their study. 43 Subsequently, the comfort temperatures should be recalculated according to ISO 7730. Also, sweating of occupants was not considered due to the use of the non-sweating thermal manikin. Different activity levels, various indoor environmental conditions and the effect of sweating can be the subject of a future research.
The given comfort temperatures represent the recommended values expected to ensure thermal comfort for the highest number of regular cleanroom users dressed in the selected ensembles. However, the recommendation of a single value of air temperature does not take into account personal preferences and needs of cleanroom occupants, or the occurrence of spatial environmental variations and local discomfort, such as draughts.
Despite the number of selected ensembles for different classes of cleanliness from a number of manufacturers, the size of the dataset is limited and cannot cover all possible variations in ensembles considering individual specific of each applications. Also, the single-use ensembles were not analysed in this study. Future studies should include new ensembles with modified undergarments in length to explore more alternative options of ensembles for improving thermal comfort. Unfortunately, implementing different clothing alternatives can be financially demanding, especially for smaller facilities with lower number of cleanliness classes. The feasibility of implementation needs to be further investigated.
The thermal insulation analysis of frequently used cleanroom ensembles and predicted comfort temperatures should help to develop a unique tool, which would ease the selection of ensembles for given cleanroom conditions or the design of suitable cleanroom environment for occupants. Research of new materials with lower thermal insulation while maintaining sufficient barrier properties is needed.
Conclusion
In this study, cleanroom ensembles were assessed using a thermal manikin to determine thermal insulation values and predict the possible impact on thermal sensation of cleanroom users, leading to potential thermal comfort improvements. The following results were achieved: • In total, 15 commonly used clothing ensembles were selected from available cleanroom garments from three different manufacturers, corresponding to the requirements of different classes of cleanliness ISO 8 to ISO 5 in various non-healthcare cleanroom applications. A novel, complex database of clothing ensembles, consisting of individual garments as well as required accessories with brief material descriptions, was created to provide suitable options for many cleanroom applications. This database offers alternatives for different environmental conditions or to satisfy individual personal preferences. It will serve as a valuable source for selecting appropriate cleanroom attire tailored to specific cleanliness requirements and operational conditions. • A complement of missing thermal insulation values of specific cleanroom clothing in literature and standards conducted by a precise method of a thermal manikin. The assessment confirmed the hypothesis that cleanroom ensembles differ from each other depending on the class of cleanliness which resulted in differences in thermal insulation and subsequent thermal perception of the cleanroom environment. For the assessed sets of ensembles, the basic thermal insulation varied from 0.71 clo to 1.16 clo with generally higher values for ensembles designed for higher cleanliness. However, a determination of single representative values for each class of cleanliness tends to be misleading due to the assessed set of clothing including alternatives designed to cover different options for various types of applications. • Differences in the basic thermal insulation are responsible for variations in predicted comfort temperatures, ranging from 17.6°C to 21.1°C. The results help to understand the real effect of clothing on thermal comfort and to set suitable environmental conditions, or vice versa, to find suitable clothing alternatives based on the current conditions. Also, the results highlighted the issue of thermal comfort in higher-cleanliness cleanrooms (e.g., ISO 5) for warmer conditions (21.5°C) even for low levels of activity. • Consequently, different levels of thermal satisfaction, described using PMV index, were predicted in cleanrooms with the same air temperature but various prescribed ensembles.
The importance of knowledge of thermal insulation for different clothing ensembles was highlighted due to variations not only among different classes of cleanliness, but also within the same class. Although statistically significant differences in thermal insulation were only found between ISO 8 and ISO 5 cleanliness classes and not between the other classes, the actual impact of these differences may be much higher. Different thermal insulation values are the key to improving the thermal perception of the given environment by individuals. With a suitable choice of clothing, thermal comfort can be achieved even in cleanrooms where the user adjustment of comfort temperature is not possible. Moreover, a selection of clothing alternatives can take into account different levels of activity, as well as personal preferences and gender, and can lead towards a higher percentage of satisfied cleanroom users. Improved user satisfaction is closely related to more efficient cleanroom operation.
Also, the investigation of thermal insulation values brought a possible increase of accuracy of thermal comfort assessment with accurately determined clothing insulation values used as the important input for the assessment. With the application of findings, the improvement of thermal comfort of cleanrooms users due to optimised setting of cleanroom temperatures or due to suitable selection of different clothing sets based on particular environmental conditions and individual personal preferences is possible.
Finally, our evaluation of thermal insulation of selected cleanroom ensembles opens possibilities for further research of suitable textiles and alternative clothing options for cleanrooms. Especially for higher indoor air temperatures (above 23°C) or particular body zones, a new material and clothing development may be the key solution for improving a thermal comfort.
Footnotes
Declaration of conflicting interests
The authors declared no potential conflicts of interest with respect to the research, authorship, and/or publication of this article.
Funding
The authors disclosed receipt of the following financial support for the research, authorship, and/or publication of this article: This paper was supported by the Grant Agency of the Czech Technical University in Prague, grant No. SGS20/098/OHK1/2T/11.