
Abstract
Flexible strain sensors in textiles are attractive for sensing human body posture changes. Knitted compression garments used in various medical applications can be a suitable choice for such smart applications. However, compression stockings haven’t been scientifically described for such applications. In this study, smart knitted stockings have been engineered using plain, honeycomb, and birdeye structures. Acrylic, lycra, and conductive polyamide coated with silver colloidal particles were used to architect sensors. The stockings were employed to develop a correlation between strain-indued electrical resistance variations with interface pressure between clothing and wearer’s body. Moreover, thermo-physiological comfort and serviceability characterization were carried out to ensure the comfortable wearing of stockings. Decreasing the percentage of Lycra and increasing the percentage of conductive yarn increased the electrical resistance variations with changing body circumference. Increasing the circumference of the fabric increased the pressure exertion phenomenon causing an increase in electrical resistance owing to the yarns being apart from each other. The comfortability of stockings had a parabolic trend, decreasing yarn accumulation enhanced the comfort i.e., air permeability was enhanced due to tuck stitch porosities in honeycomb structures.
Keywords
Introduction
Textile base smart knitted fabrics find applications in various aspects of life. 1 They are either produced into textile-based goods or designed to be incorporated into a textile life that is considered intelligent since it reacts to variations in its environment. 2 Smart fabrics can detect material deformations through electrical resistance variation and are an area of interest regarding pressure exerted and strain produced. 3 Numerous wearable devices have been engineered in fashion, healthcare, fitness, and entertainment areas in the expanse. 4 Smart knitted fabrics can be engineered by varying base material architectures i.e., yarns, woven, knitted fabrics, or stitched panels, etc. 5 Among discussed textile techniques knitting is most favorable for stretchy and body-fit clothing engineering. 6 Knitted fabrics with different structures and conductive materials with different percentages are being utilized in smart fabrics, electromagnetic shielding, antistatic clothing, and more preferably in elongation sensing applications. 7 Smart knitted fabrics represent a compelling convergence of intelligent materials and textile technology in conventional textiles and contemporary electronics to create innovative and functional fabrics. 8 To enhance operational capabilities and promptness, these textiles are fabricated utilizing intelligent constituents such as embedded sensors and conductive threads. 9 As a category of smart textiles, commonly referred to as e-textiles, intelligent knitted fabrics strive to transform apparel and textiles from just passive coverings. 4 Smart knitted textile sensing mechanism entails the integration of numerous sensors and conductive components into the fabric structure, allowing it to detect and respond to varied stimuli. 10 The resistance or inductance of the conductive yarns may be altered by external pressures like as compression, stretching, or contact with an object. 11 For instance, when the garment is stretched, the space between the conductive parts changes, which impacts the electrical properties of the fabric. 5
Investigated findings report easy fabrication of a high-performance pen-ink decorated knitted strain sensor having exceptional linearity and ease of connectivity to the human body to track motions. 12 A portable graphene knitted textile strain sensor has been produced and checked different direction-sensitivity by the change of lateral and vertical interlaced knitted structure. 13 Skin-mountable and lightweight sensors composed of graphene oxide coated polyester knitted rubber band have been engineered with ability to measure strain as little as 0.2%. 14 A Wearable knitting strain sensor has been constructed utilizing weft knitting with nylon/nylon-wrapped spandex and silver-coated fiber. In contrast to the two-dimensional sensing performance testing, the three-dimensional sensitivity test demonstrated a higher degree of approximation to the actual sensor distortion experienced while worn on the human body. 15 A breathing belt with knitting silver-coated polymeric yarn with elastomeric yarn resulted in a looped knitted fabric with conductive knots organized in an S/J pattern showing the maximum percentage of strain reaching. 16 Increasing the amount of tuck and miss stitches in smart weft knitted fabrics decreases the average resistance of fabrics, enhancing the electromechanical properties. Those constructions that were less compact like having fewer knit stitches demonstrated enhanced accuracy of electrical monitoring during the test phase. 17 Manipulating the sensing qualities of knitted fabric is possible by modifying manufacturing conditions such as yarn supplying tension and the number of conducting lines in the sensor structure. 18 Knitted fabric stretch sensor designed out of cotton and stainless steel (SS) yarn demonstrated much greater sympathy than sensors made from metallized threads. The great sensitivity of the cotton knitted fabric sensor is found to be mostly attributable to the yarn-to-yarn surface energy, which varies significantly as the fabric is extended and force is applied to yarn. 19 Knitted draining sensor with suitable linearity and hysteresis values developed for fingers and wrists, showed results that with increasing in surface area, resistance and pressure also increases. 20
The literature embraces a vast number of treasured studies on smart knitted fabrics using different structures and comfort characterization of textiles; however, both divisions of the research are kept segregated, and much importance is given to sensing characteristics enhancement. Moreover, there are not sufficient studies on the assessment of the correlation between strain-induced electrical resistance and pressure exerted by knitted fabrics. Hence, this study focuses on the development of knitted compression stockings using different combinations of knit, tuck, and miss stitches. Acrylic, elastane/lycra, and silver-coated polyamide have been employed for knitting on fully fashioned jacquard flatbed knitting machine. A laboratory scale method was developed to analyze the correlation between interface pressure (within the body and compression garment) and strain-induced into fabric by varying diameters of wearing body. Thermo-physiological comfort characteristics also have been evaluated using standard heat and mass transfer characterization to predict the structures for prolonged wearing. Such intelligent fabrics can have successful applications in detecting body motions, and swollen body areas by taking strain-induced electrical resistance as a function wearer’s body dimensional changes i.e., swelling of legs.
Materials and experimental methods
Materials
Physical properties of materials.

Methodology
Knitting of compression stockings
Tubular stockings having sensing functionality were knitted using a whole-garment jacquard flatbed knitting machine (STOLL CMS530HP). The machine comprised two rib gated beds with V-shaped alignment and 14 gauge was set during specimens knitting. As aim of this study was also to analyze the influence of varying knitting structures on sensing attributes. Hence, three different structures having different combinations of knit, tuck, and miss stitches were selected to develop compression stockings. Diagrammatic notations of designed structures have been presented in Figure 1. Variation in the different percentages of conductive polyamide and Lycra was set as an experimental variable as highlighted in Table 2. The acrylic yarn was employed for base knitting in each course. However, different percentages were controlled by feeding ratios of conductive yarn and lycra i.e., for 100:100 ratio consisted of feeding conductive yarn and lycra in each course, and a 50:50 ratio was maintained by feeding conductive yarn and lycra in each second course. Similarly, other ratios were maintained as entailed in complete design of experiment in Table 3. Specimens were placed for dry conditioning at 20 ± 5oC and relative humidity of 65 ± 2% for 24 h. Afterwards the stockings were moved for characterization where all testing was performed at same temperature and humidity conditions. Diagrammatic notations of structures (a) plain (b) birdeye (c) honeycomb. Experimental factors and levels. Design of experiment/sampling plan.


Characterization
Interface pressure measurement
A computerized pressure sensing device (MST MK1V) by SALZMANN GROUP was used to sense the pressure of different fabrics with different percentages of Lycra and conductive yarns on different points of the body. The leg mannequin was used to wear different fabric tubes with attached prob (A-G Standard 2020) to produce pressure between the fabric and mannequin. The test method described by A. Abbas et al. was followed to take interface pressure measurements.
21
Prob was attached with the mannequin and Salzmann device to show results on a computerized screen. Pressure (mmHg) values were taken on lower calf (b1) point, upper calf (c) point, and thigh (f) point respectively as shown in Figure 2(a). (a) Module for characterizing interface pressure (b) measurement point lower calf b1 (c) measurement point upper calf c (d) measurement point thigh f.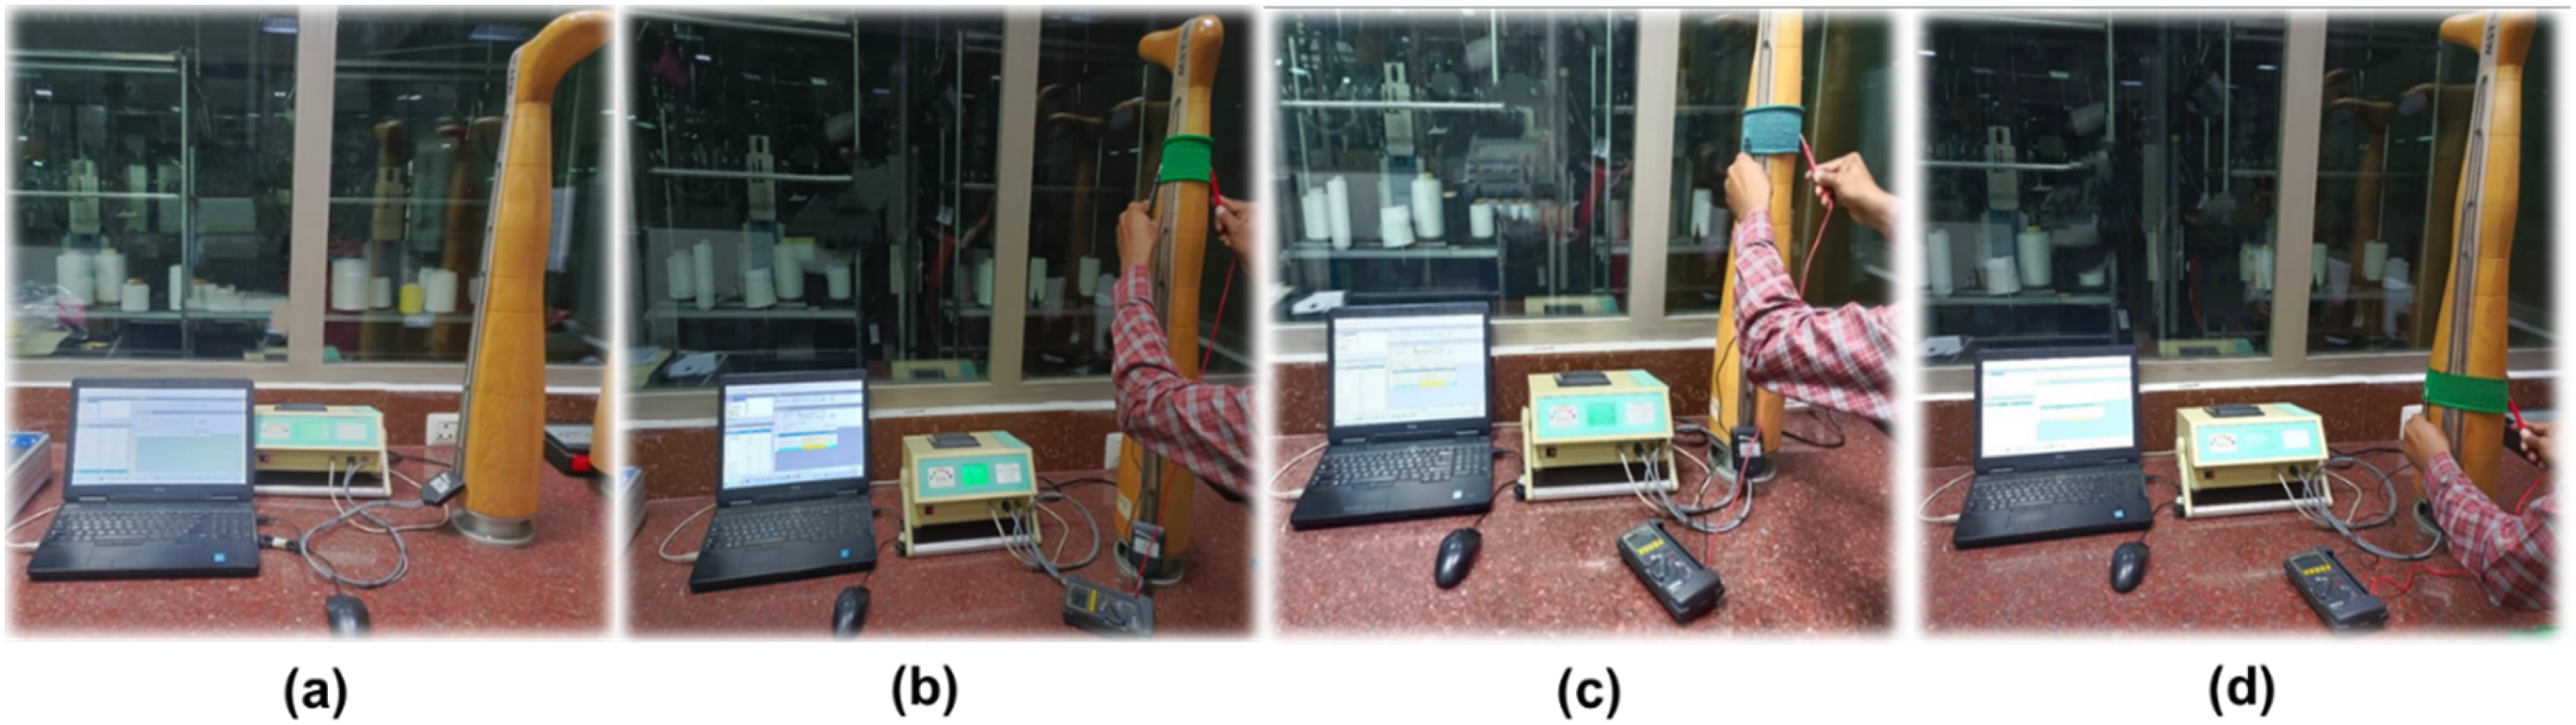
Correlating interface pressure with electrical resistance
There isn’t any specific international standard defined for the measurement of correlation between pressure and resistance. Hence, a laboratory-developed method was adopted for describing a correlation between fabric strain-induced electrical resistance and pressure exerted between wearer and clothing. Smart knitted stockings were worn onto different body parts of a mannequin, and electrical resistance values between two constant points of compression stockings were measured at each stage. Interface pressure values were obtained from the abovementioned MST MK1V module. In this way, correlation between pressure and resistance was calculated. Figure 2(a) shows a mannequin body with different body parts, each part has a different diameter that induces different strain onto the fabric and different pressure values between the wearer and fabric. Figure 2(b)–(d) entail the different points of the mannequin where fabric tubes were worn to measure pressure and resistance values.
Thermo-physiological comfort and serviceability
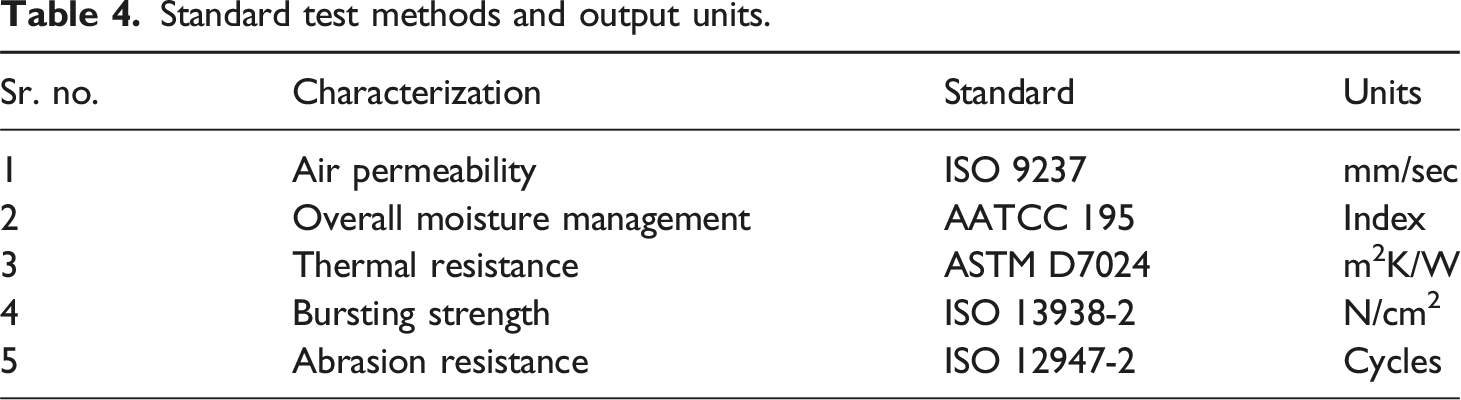
Standard test methods and output units.
Results and discussion
Physical parameters
Knitted fabrics can be designated in terms of their physical properties, like stitch length (SL), stitch density, areal density (GSM), wales and courses in specific length (Inch). Fabric strength in terms of its looseness and tightness can also influence the functionality and comfort and performance, therefore assessing these physical properties is vital for understanding the trends in fabric characterization. The quantity of yarn used in a single loop is proportional to the stitch length. Stitch density reveals the total number of loops in a given area and is calculated by multiplying the number of wales and courses in that particular area. The areal density of fabric is dignified in terms of grams per square meter (GSM). Figure 3 portrays the number of wales and courses of concocted different strain fabrics, whereas 5 displays actual physical values of engineered strains sensors. Honeycomb structures H-50:50, H-50:100, H-100:50 and H-100:100 showed a smaller number of CPI and WPI. Whereas Plain structures P-50:50, P-50:100, P-100:50 and P-100:100 showed higher number of CPI and WPI due to availability of knit loops. Variation in WPI and CPI was associated favorably with GSM and fabric thickness. Due to the availability of Tuck loops, the Honeycomb fabrics had higher GSM and higher thickness (Table 5). GSM and thickness increased by increasing percentage of Lycra and conductive up to 100%. Specimens can be seen in Figure 3. Physical parameters (a) CPI and WPI plot (b) thickness and GSM plot. Physical parameters of knitted strain sensors.

Correlation of interface pressure and electrical resistance
Correlation was extracted between pressure exerted on the human body and strain induced in fabric. Different fabric structures demonstrated various values of resistance using different percentages of Lycra and conductive yarn. A digital voltmeter was used to calculate resistance (Ω) produced as the result of strain at every stage. Figure 4 demonstrates the setup of resistance measurement at the lower Calf (b1) area of mannequin. The lower Calf (b1) point evaluated low values of resistance of plain, honeycomb, and bird eye fabric sensors. P-50:50 showed a low value of pressure and resistance of 1.4 Ω due to the availability of knit loops. Knit loops have a higher tendency of stretch and recovery as compared to tuck and miss loops.
22
The specimen P-50:100 resulted higher value of pressure but lower value of resistance 1.2 Ω because conductive yarn feeding increased from 50% to 100% as compared to P-50:50, comparatively 11% less resistance was observed due to increase in conductive yarn percentage.
23
Conductivity increased and resulted in less electric resistance value. P-100:50 showed 2.9 Ω resistance, higher among all plain fabric sensors due to increase in percentage of Lycra resulted increase in resistance value. P-100:100 showed comparatively low resistance 2.5 Ω as compared to P-100:50 due to an increase in conductive yarn percentage along with lycra as shown in Figure 4. The same scenario observed in Honeycomb as due to availability of tuck loops, honeycomb sensor fabrics showed comparatively higher value of pressure and resistance than Plain sensor fabrics.
24
H-50:50 showed resistance of 3.9 Ω which was 1.2 Ω for P-50:50. The H-50:100 specimen showed comparative lower resistance of 3.5 Ω, about 10% less than H-50:50 due to increase in conductive yarn percentage.
23
H-100:50 demonstrated a higher resistance of 4.9 Ω than H-50:100 and at the end H-100:100 resulted in a 4.5 Ω resistance which was less than H-100:50. Bird eye fabric sensors proved pressure and resistance correlation values higher than plain and Honeycomb structure due to availability of miss loops in structure. Miss loops have a lower tendency to stretch and recovery than plain and Honeycomb structures. B-50:50 resulted in a higher value to pressure and resistance 7.2 Ω as compared to P-50:50 and H-50:50. The B-50:100 showed comparative lower resistance 6.8 Ω than B-50:50 due to increase in percentage of conductive yarn. B-100:50 proved resistance 8.9 Ω higher with increase in Lycra percentage. B-100:100 showed resistance 8.6 Ω higher than P-100:100 and H-100:100 as shown in Figure 4. Pressure and resistance correlation of lower calf (b1) position.
Figure 5 demonstrates the correlation graph values of pressure and resistance of the Upper Calf (c) position on the leg body. As the circumference area increases on Upper Calf (c) position to 33 cm as compared to Lower Calf (b1) 27 cm, fabric got more stretch hence compression values increased on Upper Calf (c) position and due to increase in compression values resistance also increased.
21
Due to fabric got more stretch on higher circumference area, loops of fabric got straighten and made conductivity poor and resulted in increase of the resistance values.
25
P-50:50 in Figure 5 showed higher pressure of 17 mmHg and higher resistance value of 1.6 Ω than P-50:50 in Figure 4 lower Calf (b1) position value. Increase in the amount of Lycra and conductive from 50% to 100% increased the value to Pressure exerted on body and resistance created in the form of strain in P-50:100 and P-100:50. More resistance resulted in the poor conductivity of developed compression stockings. The same case was observed in the H-50:50, Figure 5 Upper Calf (c) position showed higher resistance of 4.1 Ω as compared to H-50:50 in Figure 4 lower Calf (b1) position 3.9 Ω. H-50:100 showed resistance 3.8 Ω less than H-100:50 5.5 Ω. H-100:100 showed higher resistance values than all of other honey comb sensor fabrics owing to simultaneous increase in conductive and elastomeric yarns. An identical trend was observed in the bird eye specimen as it showed comparatively higher pressure on Upper Calf (c) position than Lower Calf (b1). B-50:50 resulted in a higher value of pressure 33.2 mmHg and higher value of electrical resistance, about 40% to 50% higher than P-50:50 and H-50:50 respectively. The B50:100 stocking showed higher pressure of 35.9 mmHg but low resistance 7.1 Ω due to increase in conductive yarn percentage. Opposite results were observed in the case of B-100:50 due to increase in Lycra percentage. Pressure and resistance correlation of upper calf (c) position.
Figure 6 shows the resistance measurement setup at thigh (f) part of mannequin. The circumference area of Thigh (f) was 45 cm. The circumference was bigger than lower Calf (b1) (27 cm) and upper Calf (c) (33 cm) so, thigh (f) part demonstrated higher values of pressure and resistance as compared to lower Calf (b1) and upper Calf (c). Increase in circumference increased pressure and resistance as compared to lower calf (b1) and upper Calf (c) body point as shown in Figure 6. The P-50:50 specimen on thigh (f) point indicated higher values of pressure 17.9 mmHg and resistance of 1.9 Ω owing to its more straighten loops due to which conductive path increased and hence disclosed lower conductivity and increased resistance. Increases in percentage of conductive yarn from 50% to 100% in P-50:100, H50:100 and B-50:100 indicated less resistance as compared to increase in Lycra percentage from 50% to 100%. B-100:100 ratio sensor fabric produced higher value of pressure with increasing lycra percentage; however, a comparative low resistance than B-100:50 was observed due to increasing percentage of conductive yarn as well. Pressure and resistance correlation of thigh (f) position.
Thermo-physiological comfort evaluation
Air permeability
Air permeability, indicating a fabric’s ability to transport dry fluids towards and away from the body, is a critical aspect of thermal performance. Fabrics that permit more dry fluid movement are phenomenal for summer clothing and vice versa. Figure 7(a) entails the air permeability of face side of knitted strain sensors and Figure 7(b) entails the air permeability of back side of knitted strain sensors. Air permeability provides efficacy of knitted fabrics towards air flow through it. Results justified the honeycomb fabrics having higher porosity offered better air permeability values as entailed in microscopic images of Figure 8.
26
H-50:50 and H-50:100 showed the highest air permeability values due to the availability of tuck and less percentage of lycra, as lycra can make structure compact with less porosity. Tuck loops consume comparatively higher length of yarn than knit and miss loops. H-50:100 and H-100:100 exhibited the second highest air permeability values about 24% higher than H-50:50 and H-50:100. Microscopic analysis in Figure 8 revealed that higher porosity of tuck loops enhanced air permeability values. P-50:50, P-50:100, B-50:50 and B-50:100 demonstrated the third highest values of air permeability about 37% less than H-50:50 and H-50:100. P-100:50, P-100:100, B-100:50 and B-100:100 showed less values of air permeability than H-50:50 and H-50:100. Availability of knit and miss loops shown in microscopic analysis Figure 8 in plain and bird eye fabrics made less porous structure hence air permeability values found least. However, values were found within range of comfort fabrics. Air permeability plots (a) face (b) back. Microscopic images of developed specimens.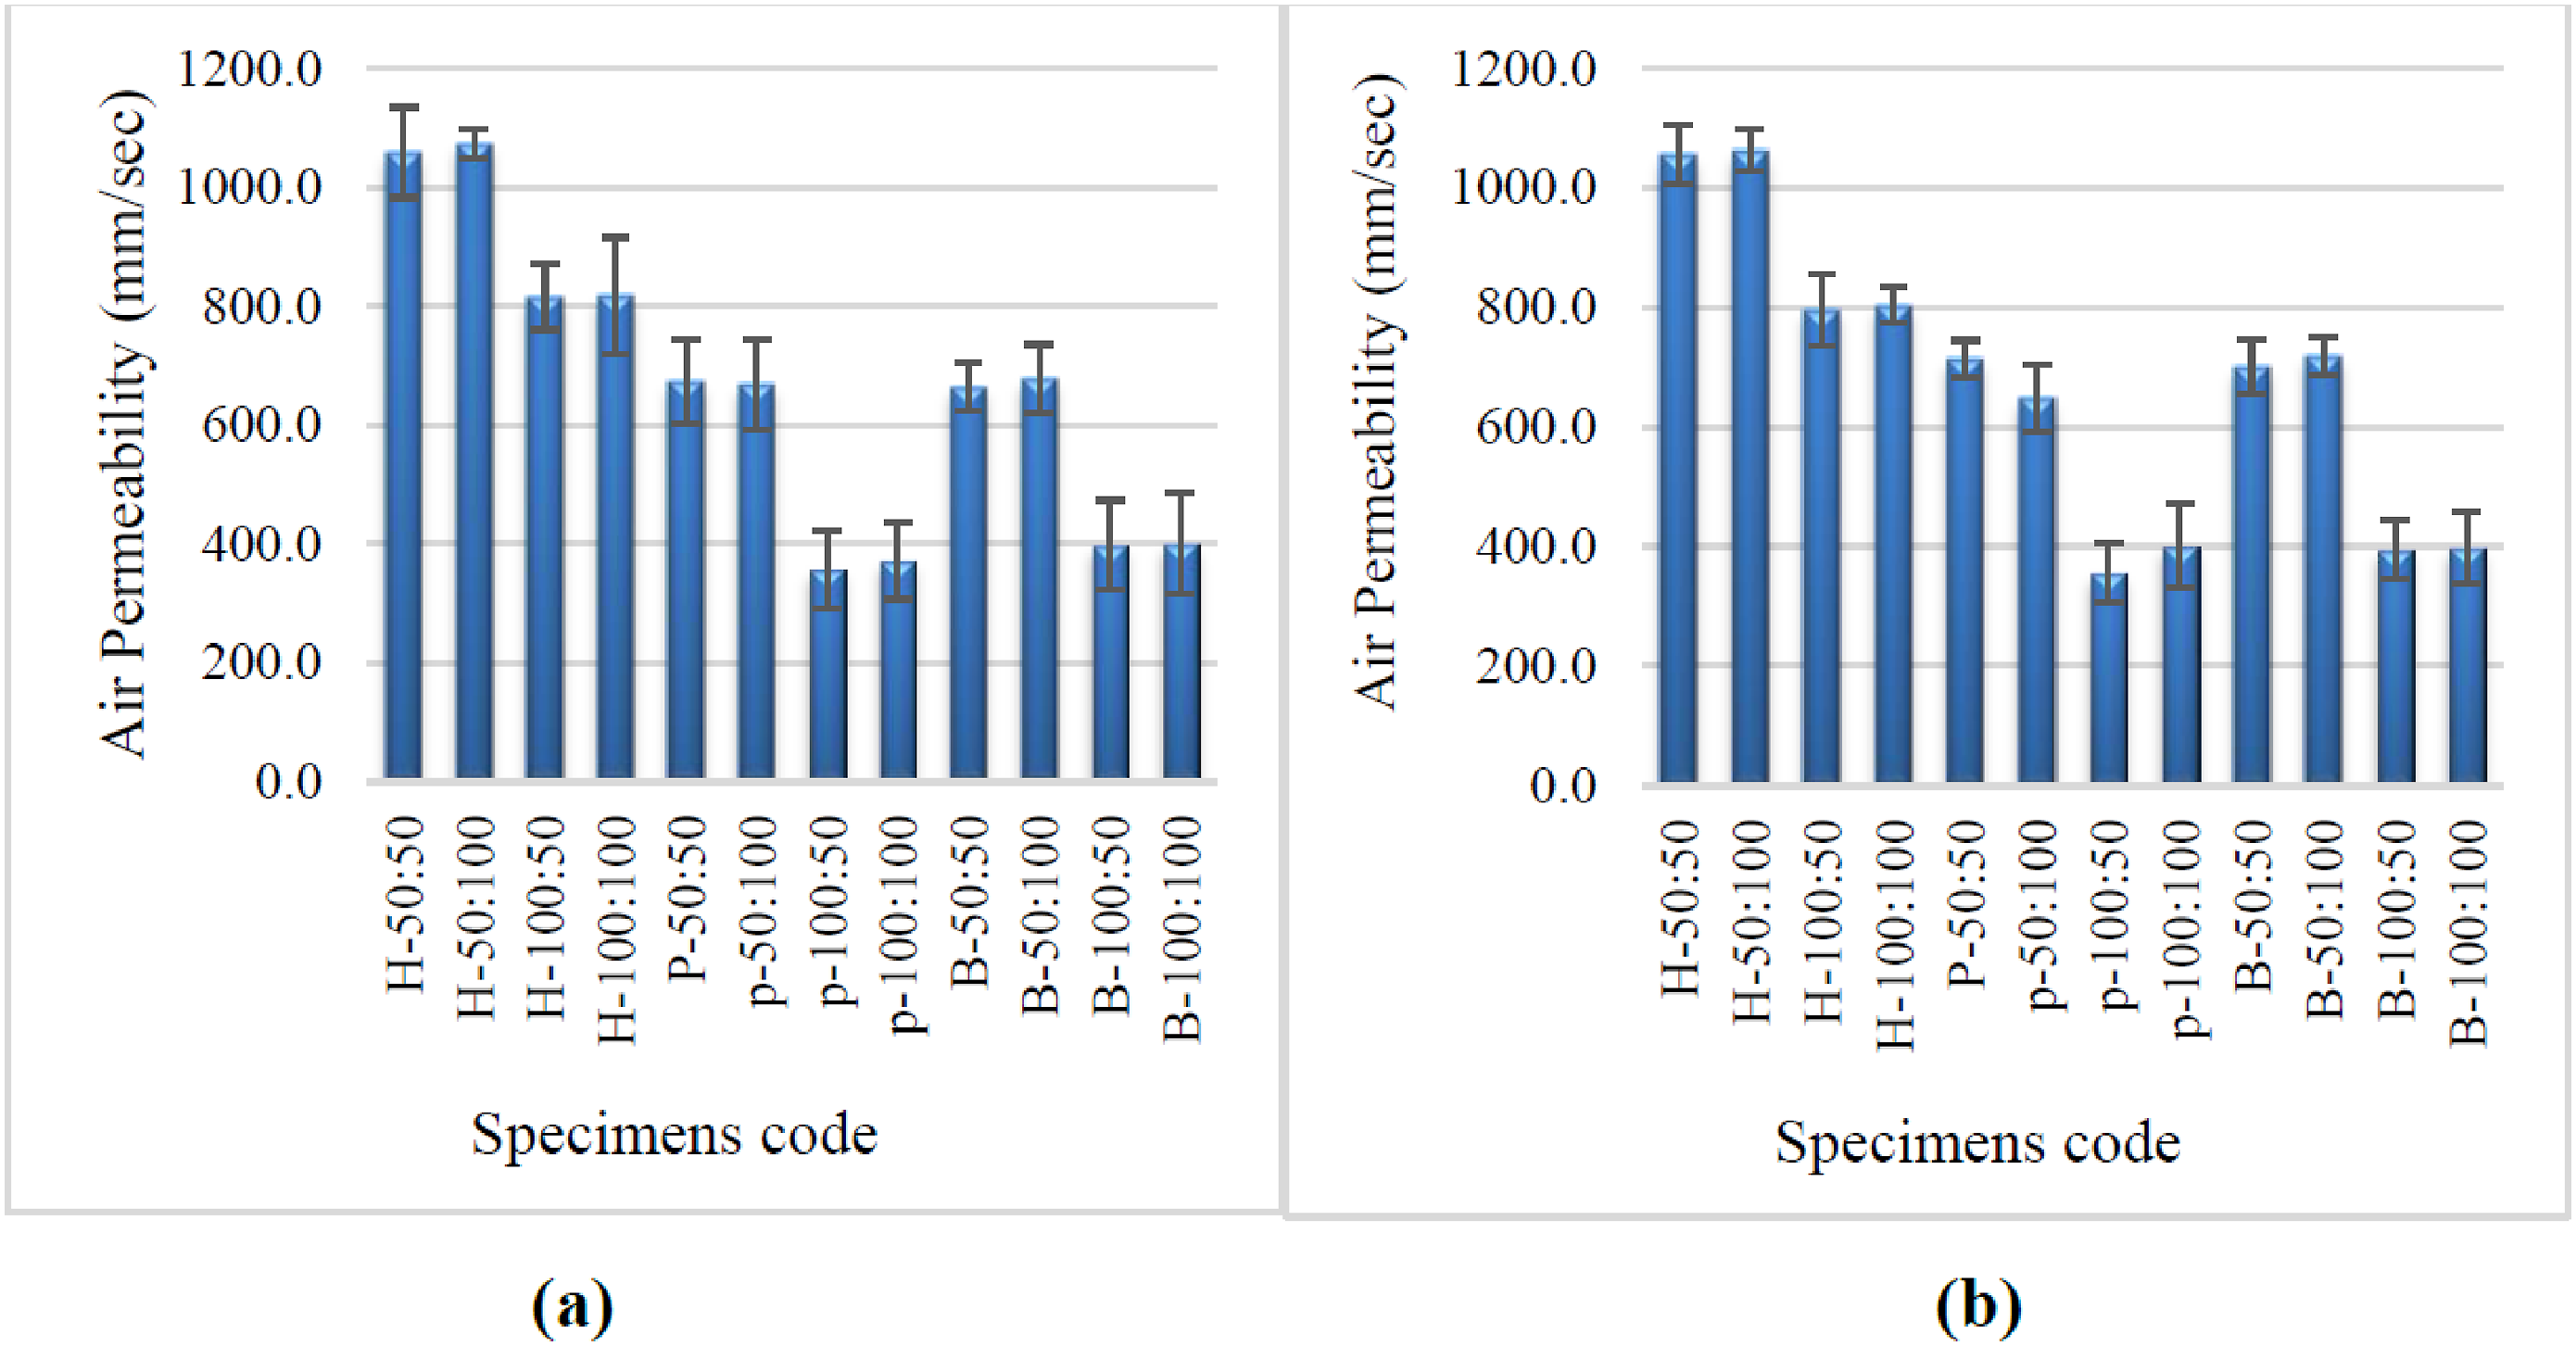

Overall moisture management capability & thermal resistance
Overall moisture management capability (OMMC) index comprises fabric moisture management performances concerning wicking, water permeability and wetting times etc. Increase in OMMC index has more efficient moisture management handling capability. OMMC index is mainly reliant on the intrinsic material individualities used and secondary factor is fabric architecture. Figure 9 presents the obtained OMMC index results of developed smart knitted compression stockings. Due to the high porous structure shown in Figure 8, honeycomb fabrics showed higher values of OMMC. Tuck loops have a higher tendency of moisture management properties. After Honeycomb, plain fabrics showed relatively moderate values of moisture management. Following the literature trend tuck stitches specimens showed higher OMMC index, whereas all other sensor specimens OMMC files were in a thin equivalent range creating them appropriate to wear in humidity environment, except B-100:50 and B-100:100. Thermal resistance on the other hand indicates fabric capability to hinder heat flow. Provides the wearer with a warm feeling towards body. Thermal resistance can have two major factors; first one it entraps air resistance in heat flow and second one is heat barrier towards fabric with its bulkiness itself. These both possibilities work together up to some limits; after more porous fabric itself entrapped air a becomes a transportation medium and same with increase in fabric bulkiness. Figure 10 shows the thermal resistance results of tested specimens. H-50:50 and H-50:100 Honeycomb fabrics exhibited higher thermal resistance relating to their porosity from tuck loops creating air pockets shown in Figure 8. H-100:50 exhibited relatively poor value of thermal resistance due to increase in percentage of Lycra. H-100:100 showed almost equal results of thermal resistance with H-100:50. Bird eye fabrics B-50:50 and B-50:100 having knit and miss loops showed second highest thermal resistance as compared to honeycomb structures. Plain fabrics having knit loops showed least thermal resistance due to tight structures creating least porous structure, and by increasing percentage of Lycra and conductive yarn up to 100% caused least thermal resistance of Plain fabrics. OMMC index plot. Thermal resistance plot.

Serviceability; bursting strength and abrasion resistance
Bursting strength refers to the amount of pressure or force a fabric can withstand before it ruptures. Knitted fabrics being nearly isotropic cannot be characterized through in vitro uniaxial loadings. Multiaxial bursting strength characterization is usually employed for knitted fabrics elongating the fabrics at 360°. It is an important measure of the fabric’s durability and resistance to failure under tension. Plain single jersey fabrics showed higher values of bursting strength due to the availability of Knit loops as shown in Figure 11. Knit loops usually have higher tendency of stretch and recovery and hence have higher capability of bearing pressure. By increasing percentage of Lycra, bursting strength also increased. Bursting strength of P-50:50 is examined 320 N/cm2. While P-50:100, P-100:50 and P-100:100 had relatively preeminent bursting strength values than honeycomb and Bird eye fabric sensors. Honeycomb fabrics exhibited relatively lower busting strength values than Plain fabric sensors due to the availability of tuck loops. Tuck loops have a higher tendency to stretch and have lower tendency of recovery, due to which honeycomb fabrics exhibited lower bursting strength values than plain fabric sensors. H-50:50 found 296 N/cm2 around 8% less than P-50:50. H-50:100 exhibited strength 304 N/cm2 around 6% less than P-50:100. H-100:50 displayed bursting strength 288 N/cm2 around 10% less than P-100:50 and at the end H-100:100 with 100% of conductive and Lycra displaced 290 N/cm2 around 9% less than P-100:100 fabric sensor. Bird eye fabric sensors showed lower values of bursting strength around 11%, 13% less than plain and honeycomb fabrics. Abrasion resistance in Figure 12 states the ability of fabric to withstand wear and tear from rubbing, friction, or repeated contact with other surfaces. Honeycomb specimens showed satisfactory abrasion resistance results due to complex structures with raised patterns, which can provide better durability and resistance to wear. Plain fabrics showed relatively low abrasion resistance values due to their simpler construction. Bird eye fabric sensors showed moderate values less than honeycomb and higher than plain due to distinctive patterns. Bursting strength plot. Abrasion resistance plot.

Conclusion
This research presented the successful development of smart knitted compression stockings using acrylic, lycra, and conductive polyamide yarn on a fully fashioned jacquard flatbed knitting machine. Responsiveness of the structures was based on their percentages of lycra and conductive yarns. Stockings were capable of changing their electrical resistance upon a change in the interface pressure during wearing. Plain fabric structure P-50:50 consisting of knit loops had the least amount of pressure and showed the least electrical resistance. An increase in the percentage of lycra and conductive yarns up to 100% caused an increase in the pressure exerted on the body, and an increase in resistance was also experienced as lycra made conductive yarns apart from each other. Pressure and resistance values increased by increasing the circumference of the body part and resulted in a decrease in electrical resistance of designed stockings. However, the thermo-physiological comfort properties of plain fabric were not significant making it a difficult choice for long-term wearing. Honeycomb H-50:50 and Bird eye B-50:50 with 50% conductive polyamide fabrics were both strain-sensitive and comfortable as well. Hence, these are suitable choices in the areas where the human body’s postural changes are to be noticed in the long run.
Footnotes
Declaration of conflicting interests
The author(s) declared no potential conflicts of interest with respect to the research, authorship, and/or publication of this article.
Funding
The author(s) received no financial support for the research, authorship, and/or publication of this article.