
Abstract
This study assesses the shielding efficacy of local electromagnetic shield for the thyroid gland. The investigation employed a mechanical model of a thyroid shield gear, integrating it within a high-resolution three-dimensional virtual model (Duke). The simulation environment and biological electromagnetic model were constructed from 1 to 6 GHz, with the Finite-Difference Time-Domain (FDTD) algorithm. The results indicated that the specific absorption rate (SAR) values of the thyroid were significantly elevated under forward irradiation and in the L band (1–2 GHz). In addition, the local electromagnetic shield reduced the SAR values at the thyroid position, with a shielding efficiency ranging from 15 to 40 dB across the evaluated frequency range. Further, the local shielding effectiveness of the thyroid have obvious variety between frequency and polarization. However, the data also indicated a potential increase in SAR values in other tissues, notably the eyes by up to 4 dB. The study determines that local electromagnetic shields markedly reduce radiofrequency radiation to the thyroid, necessitating a balanced design approach that accounts for both protective benefits and side effects on other tissues. The method and result provide a new perspective and quantitative data for thyroid protection, which has important guiding significance for the design and practical application of electromagnetic protection products.
Keywords
Introduction
The thyroid is a crucial endocrine organ in the human body, responsible for synthesizing thyroid hormones and regulating physiological processes such as metabolism, growth, and development. In recent years, the proliferation of wireless communication and electronic devices has raised concerns about the potential public health implications of radiofrequency (RF) radiation.1,2 Although RF radiation is non-ionizing and has low energy in terms of microscopic particles, studies have shown that long-term exposure might have certain effects on the thyroid.3–5 RF radiation can affect the thyroid through both thermal and non-thermal mechanisms. 6 These effects include alterations in the structure and function of thyroid tissue, as well as changes in thyroid hormone synthesis and secretion.7–9 Additionally, RF radiation may negatively impact the iodine uptake process of the thyroid gland, thereby influencing the normal synthesis of thyroid hormones. 10
Whether thermal or non-thermal, the core of the effects of RF radiation on the thyroid gland is the energy coupled into the thyroid tissue and the biological side effects caused by the couple energy. 6 Given the significance of the thyroid gland and the potential risks that RF radiation may pose, it is particularly important to take appropriate protective measures and reduce the coupling energy of biological tissues. Individual protection strategies11–13 include moderating the use of electronic devices, maintaining safe distances, and employing electromagnetic radiation protection products, such as thyroid shields.
Thyroid shields is one of the most effective methods of protection because it reduces the radiation dose to the body’s tissues through physical isolation.14,15 The electromagnetic shields can be divided into general protection 16 and local protection. 17 For general protection, whole-body RF radiation shielding protective clothing is usually used for isolation. For local protection, shielding gears like scarves are wrapped around the neck to protect the thyroid gland.
The advantage of general protection is that it can safeguard most tissues of the body. However, the limitations of general protection are also evident. Wearing full-body protective clothing may affect the convenience of work, especially for some physical workers, people in a sitting position, and those who only need local protection. For them, convenience of protective shields is the primary consideration. Additionally, general protection is not conducive to heat dissipation, 18 and the sensory effect of the population is even poorer. In contrast, local protection is more portable, easier for heat dissipation, and convenient to wear, meeting the requirements of those special populations.
However, for thyroid local shielding protection, the current deficiency in product testing lies in the measurement and evaluation of shielding efficacy. Shielding efficiency is an important parameter to measure the performance of electromagnetic protective gears.19–21 Although a large number of products for local thyroid shielding gears have emerged in the market, there are relatively few reports on the testing and evaluation of the shielding efficacy. This is mainly because the existing laboratory testing standards, like German DIN 32780-100 and Chinese GB/T 33615,22,23 are primarily designed for general protection. They typically test the chest and lower abdomen but do not cover special areas like the thyroid. 24 Furthermore, the thyroid’s location in the neck and its compact geometry pose challenges. The large size of the electric field probe makes it difficult to position within the test mold, increasing the test complexity and complicating the evaluation process. Without any measurement and evaluation, there is considerable doubt about the actual protective effect of the local protective device for the thyroid tissue. Consequently, assessing the shielding effectiveness of local thyroid protection presents a significant challenge, particularly when it comes to examining the rationality of the design of current local shielding products.
In contrast, the simulation-based assessment of specific absorption rate (SAR)15,25,26 provides an effective alternative.16,21,27 This method utilizes electromagnetic simulation and virtual modeling technology, which can more accurately evaluate the coupled energy or power of RF radiation in biological tissues. It can further explore the changes in the coupled SAR values in key tissues and organs due to shielding, thereby verifying the feasibility of electromagnetic shielding. For example, the finite-difference time-domain (FDTD) algorithm 16 effectively simulated whole body general protection, proving from an electromagnetic simulation perspective that protective clothing can significantly reduce the average total-body SAR. The research 17 used finite element analysis (FEA) and 3D FEA bio-electromagnetic models to explore the electric field and SAR distribution, finding that the inner layer provides good shielding against electromagnetic radiation in the testicles. Furthermore, the research also showed that electromagnetic shielding may cause SAR value increases in tissues and organs outside the target, such as local SAR peak values in the head that are higher than the calculated values for the unprotected model in certain exposure scenarios. 16
Therefore, the simulation-based assessment of SAR, by integrating biological dosimetry, achieves the evaluation of the electromagnetic protection performance of shielding, 28 which meets the needs of protection. Its multi-location point assessment method is more objective in reflecting the actual situation of human protection compared with the traditional laboratory probe assessment method, providing more data information. It also solves the limitations of the traditional laboratory probe assessment in measuring the electromagnetic shielding efficiency with physical space limitations.
Despite significant progress in the application of SAR simulation assessment in various fields, research on the efficacy of thyroid-specific local protective shielding is still relatively scarce. This limits our comprehensive understanding of the effectiveness of thyroid protection measures and optimization of electromagnetic shielding product design. In this study, we investigated the shielding effectiveness of a thyroid protector by calculating the SAR dose. Initially, we developed a mechanical model of the protective equipment. Subsequently, we utilized electromagnetic simulation software to create a biological electromagnetic simulation environment model. This model was then computationally analyzed and simulated using the FDTD method. We scrutinized the exposure characteristics of the thyroid and examined the shielding performance under various polarization directions and frequencies. Notably, we also assessed the impact of local thyroid protection on the safety properties of the body system by studying the increments in SAR values for the eyes, brain, and whole body.
The aim of this study is to furnish quantitative data for evaluating the electromagnetic shielding of the thyroid target, offering insights that can inform the design and practical application of electromagnetic protection products.
Materials and methods
Theory and analysis of shielding efficacy
Definition of basic shielding effectiveness
Shielding effectiveness (SE) is a pivotal metric for assessing the capacity of a shield to attenuate or obstruct electromagnetic energy transmission. Defined as the ratio of the electromagnetic field intensity at a specific location in the absence of a shield to the intensity when the shield is present, it is conventionally measured in decibels (dB). The formula for calculating shielding efficiency is as follows:

Definition of SAR-based shielding effectiveness
When direct measurement of electromagnetic fields in the laboratory faces unique challenges, SAR-based evaluation of shielding effectiveness offers a practical alternative. The shielding efficiency of anti-electromagnetic radiation garments for human biological tissues is determined by the induced electromagnetic fields within the body due to external fields. Since all human organs act as conductive media, these fields generate electric currents that absorb and dissipate electromagnetic energy. In bio-electromagnetics, the SAR is the standard parameter to describe this phenomenon, defined as the rate at which electromagnetic wave power is absorbed per unit mass of human tissue.
To present a more intuitive and clear depiction of the shielding performance of protective clothing from the SAR perspective, the formula for field-based shielding effectiveness, as shown in equation (1), is adapted for SAR-based shielding effectiveness evaluation. The resulting shielding effectiveness, calculated on the basis of SAR, is expressed as follows
29
:

In detail, SAR is defined as the absorption rate of electromagnetic radiation energy per unit mass of biological tissue. The SAR calculation formula is usually expressed as:

Human virtual model
The development of bio-electromagnetic simulations hinges on accurate virtual models of the human body that incorporate electrical parameters. For this study, we selected the Duke model, developed by ZMT Zurich MedTech AG (ZMT), as our foundational simulation model. This model leverages detailed anatomical data to provide precise simulations of electromagnetic wave propagation within the human body. It includes a high-resolution model of the human body, complete with detailed tissue and organ representations, making it highly suitable for a range of bio-electromagnetic simulations.
Basic parameters of Duke model.


Schematic diagram of Duke model and thyroid gland.
Modeling of local protection gear
In this study, we utilized the Sim4Life software platform, developed by ZMT, to conduct a comprehensive modeling of the thyroid protector. The modeling process involved intricate steps of crossing, stretching, and trimming, as depicted in Figure 2. These steps were instrumental in successfully constructing a support model with a uniform thickness of 1 mm. The modeled dimensions of the protector, as shown in Figure 3, were 430 mm in length, 200 mm in width, and 242 mm in height. Modeling process diagram of thyroid local protective equipment. Modeling effect of protective gear.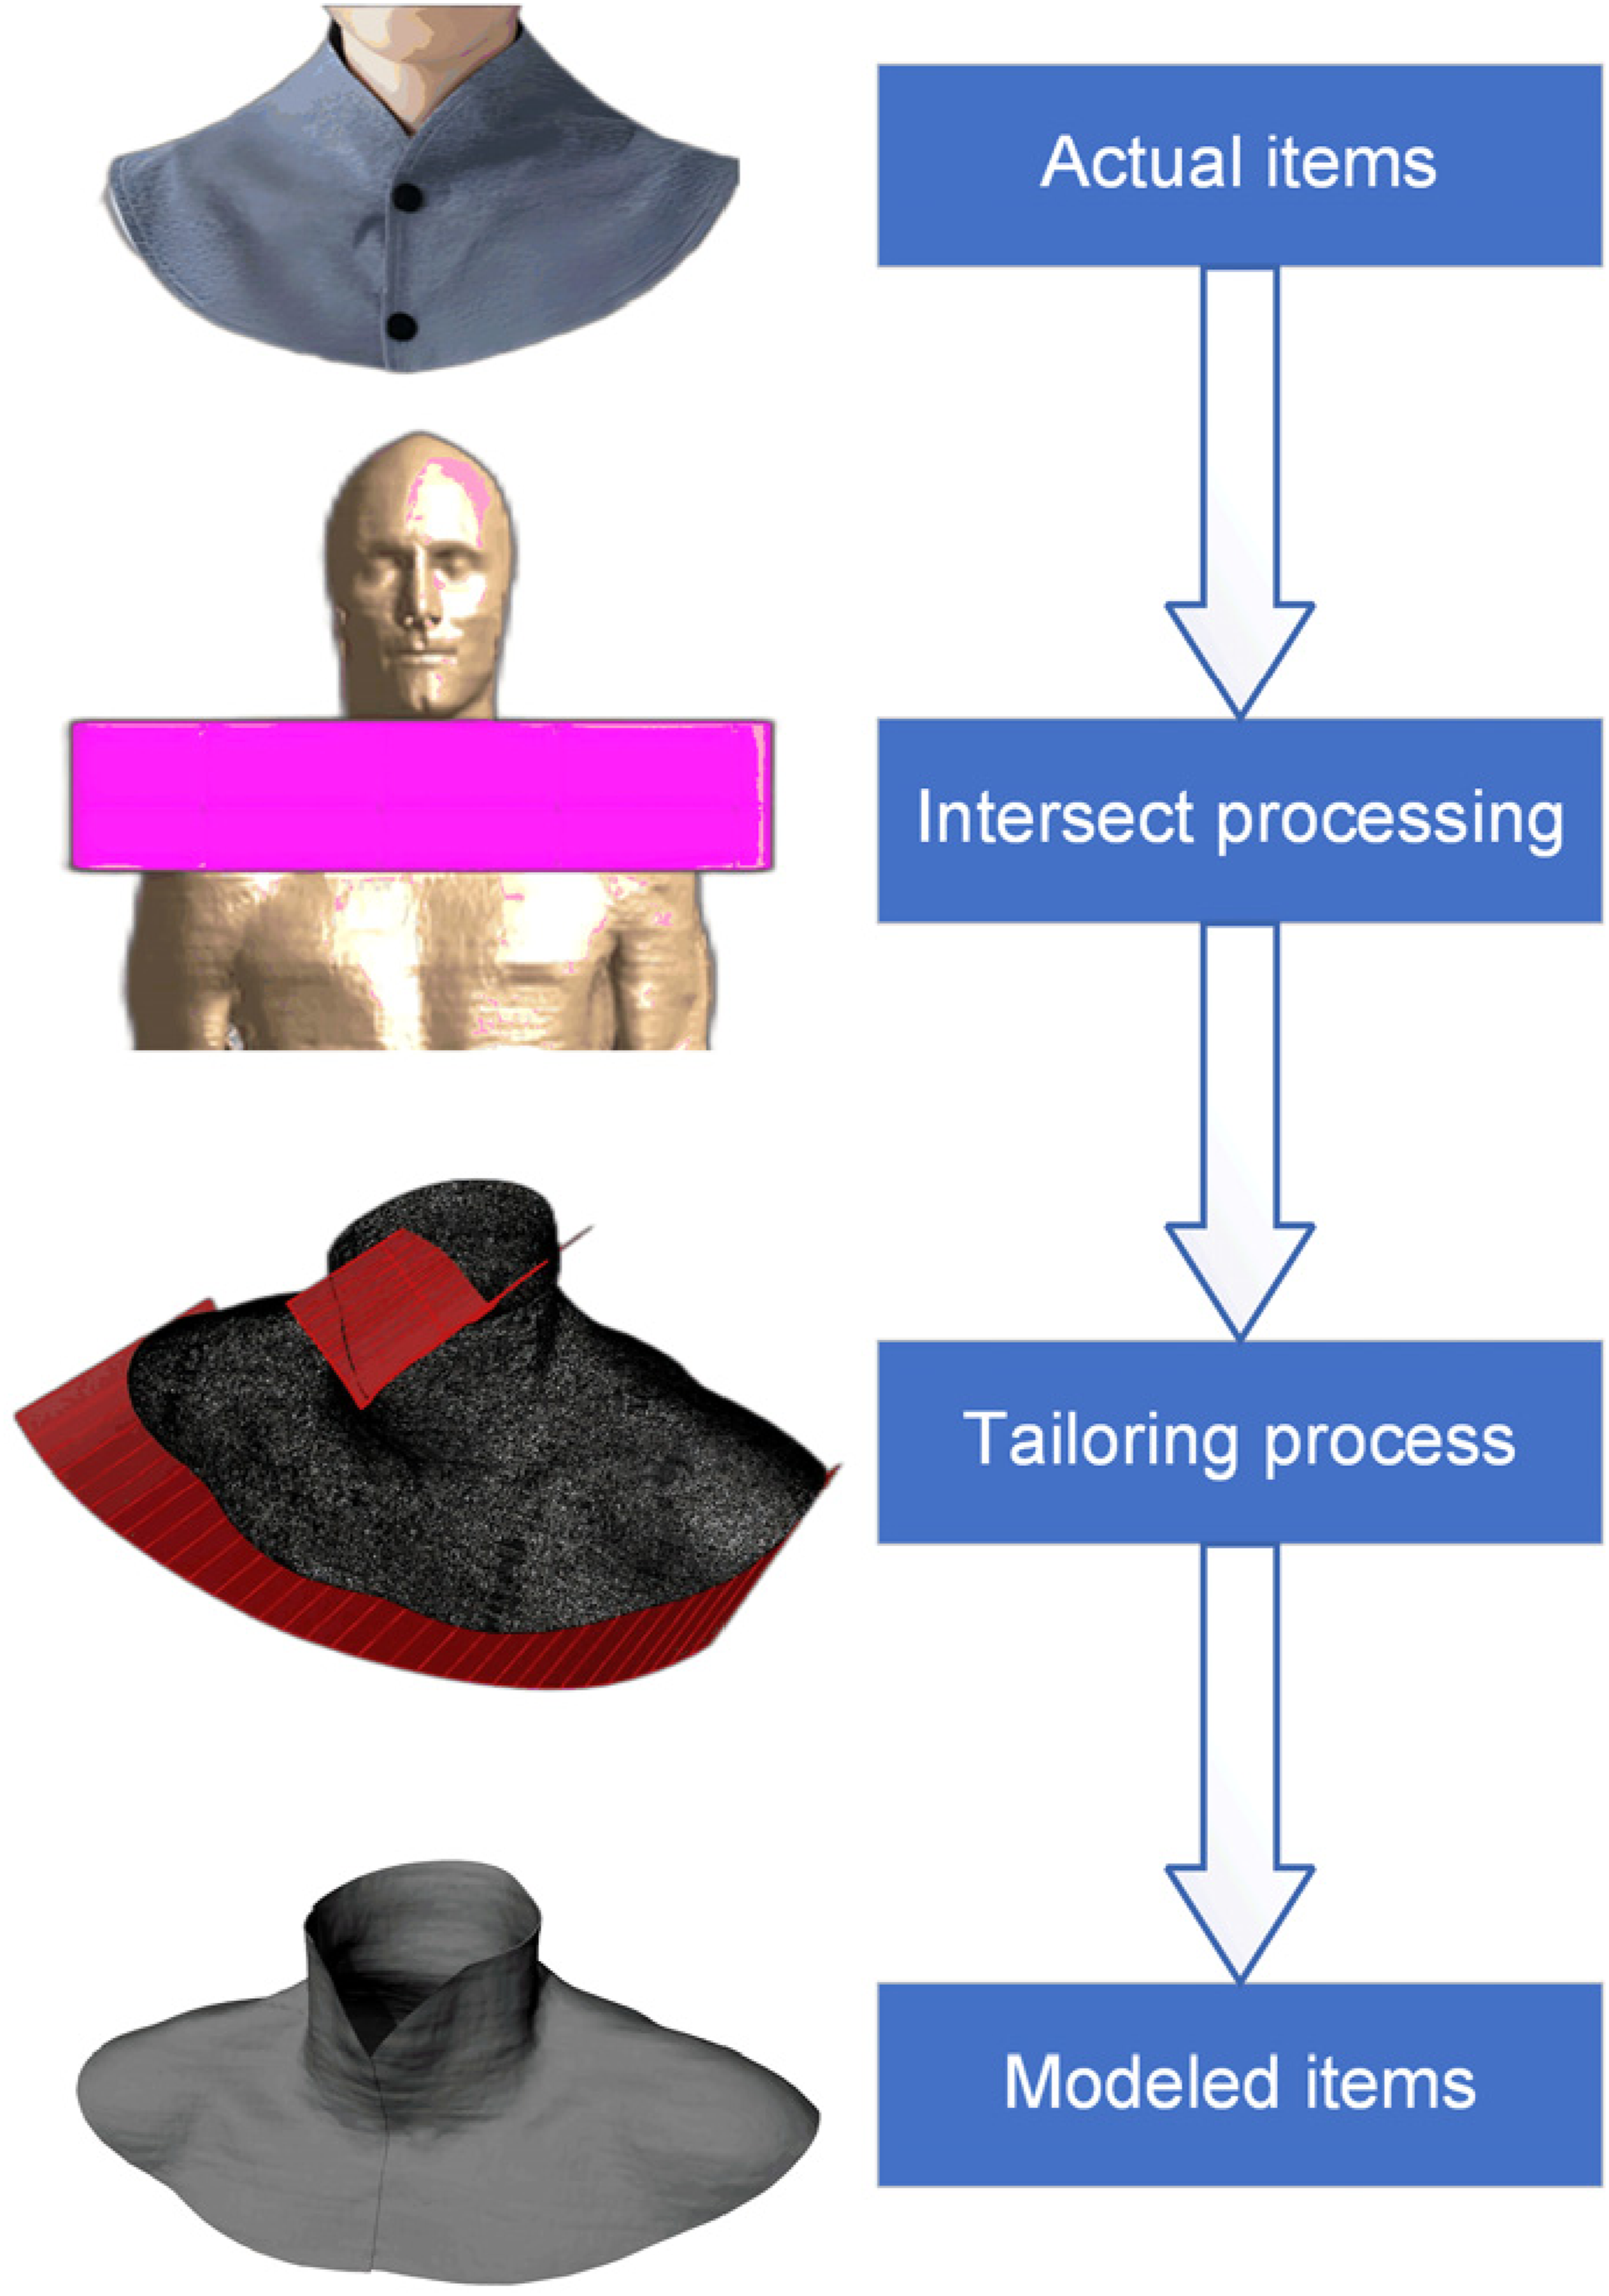

The cross-modeling technique employed brought the skin tissue of the thyroid protector model into close proximity with the Duke model. As a result, the gap between the two tissue models was minimal and could be considered negligible for the purposes of our simulation. This precision in modeling is crucial for accurately representing the interaction between the protector and the human body in the simulation environment.
Calculation of specific absorption rate
Utilizing the Sim4Life software, we conducted bio-electromagnetic simulations based on the FDTD algorithm. Sim4Life is an advanced multi-physics simulation platform, renowned for its comprehensive human body model construction capabilities and extensive database of human tissue physical properties. The software automatically assigns simulation model parameters, including electrical conductivity, magnetic permeability, and tissue density.
The process of SAR calculation of the Duke model using the FDTD algorithm of the Sim4Life software typically includes the following steps:
Schematic diagram of the incident direction and planned direction in the simulation environment: (a) incidence plane; (b) polarization plane.
Furthermore, the system SAR (SSAR) for an organ system is articulated through the following expression:
Results
Thyroid exposure characteristics
The impact of the incidence angle on the SAR of thyroid tissue was investigated using electromagnetic wave excitation at a frequency of 3 GHz under vertical polarization. Figure 5 illustrates that the thyroid tissue’s SAR values peak with forward irradiation at 0° and are significantly lower with back irradiation at 180°, differing by approximately one to two orders of magnitude. The relationship between thyroid SAR value and incident angle under 3 GHz conditions @ vertical polarization and excitation value of 1 V/m.
Figure 6 displays the two-dimensional spatial distribution of neck SAR values for three incident directions: forward irradiation (0°), lateral irradiation (90°), and back irradiation (180°). The hotspots of SAR values are predominantly found at areas with a small radius of curvature and coincide with the incidence locations. Notably, for the thyroid gland, the SAR value is considerably higher with forward irradiation. Distribution map of two-dimensional SAR values of neck under 3 GHz conditions @ vertical polarization and excitation value of 1 V/m: (a) forward irradiation (0°); (b) lateral irradiation (90°); (c) backward irradiation (180°).
Consequently, in the design of protective measures, the SAR values should be predominantly considered for the forward irradiation scenario, given its significantly higher impact on thyroid tissue.
SAR characteristics with shielding
The local SAR values of the thyroid under forward irradiation conditions across a range of frequencies (1 GHz to 6 GHz), polarization modes (vertical and horizontal), and shielding states were calculated. Figure 7 presents a comparative analysis of the thyroid tissue’s SAR values in unshielded and shielded conditions. SAR value of thyroid under forward irradiation @ 1 V/m excitation value: (a) unshielded; (b) shielded.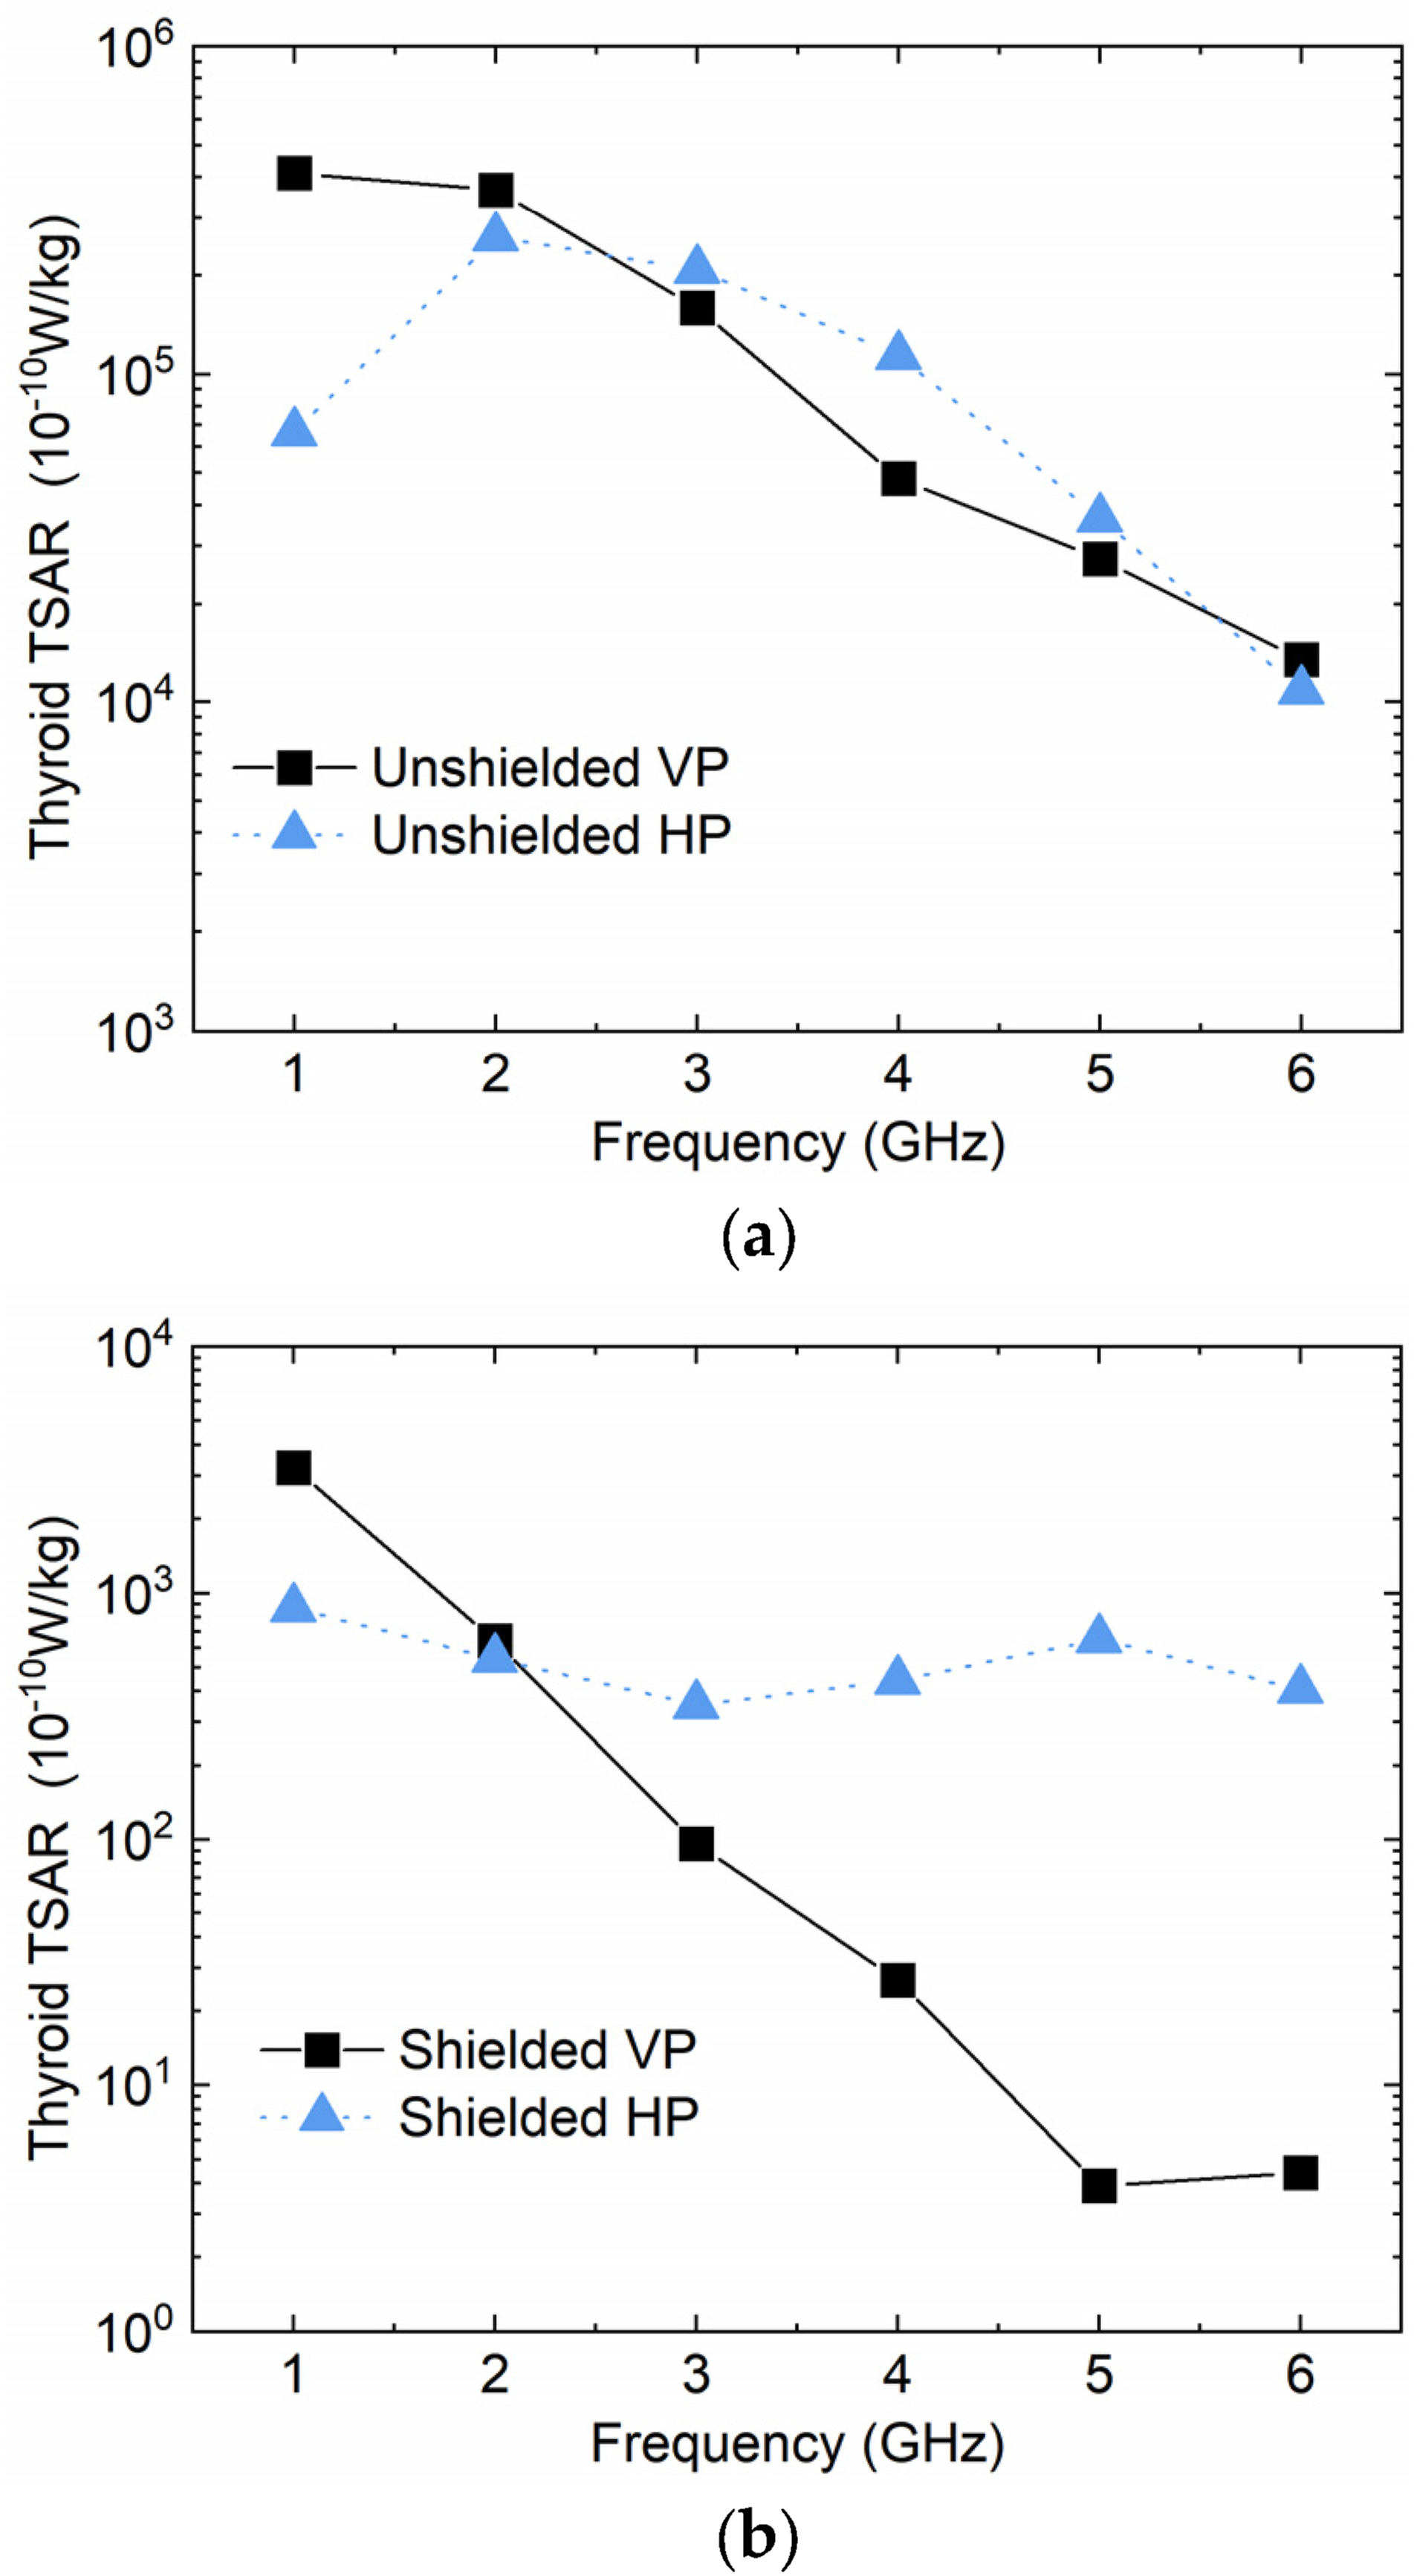
In the unshielded state, the SAR value generally decreases with increasing frequency as shown in Figure 7(a), with the exception of the horizontally polarized case at 1 GHz, where an anomaly is observed. The polarization mode appears to have a minimal impact on the SAR of thyroid tissue. This observation implies that additional protection measures may be necessary at lower frequencies, which are common in radar and communication systems.
In the shielded state, the SAR values exhibit distinct trends under the different polarization modes as shown in Figure 7(b). A more pronounced decrease in SAR with frequency is observed under vertical polarization, while the variation under horizontal polarization is comparatively mild.
Figure 8 further illustrates the impact of local shielding on the spatial distribution of SAR values in the neck and thyroid region under 3 GHz. It is evident that local shielding significantly reduces the SAR values at the thyroid, underscoring the effectiveness of shielding measures in protecting this sensitive area. Screenshot of two-dimensional SAR value distribution under 3 GHz condition @ 1 V/m excitation value forward irradiation: (a) vertical polarization; (b) horizontal polarization.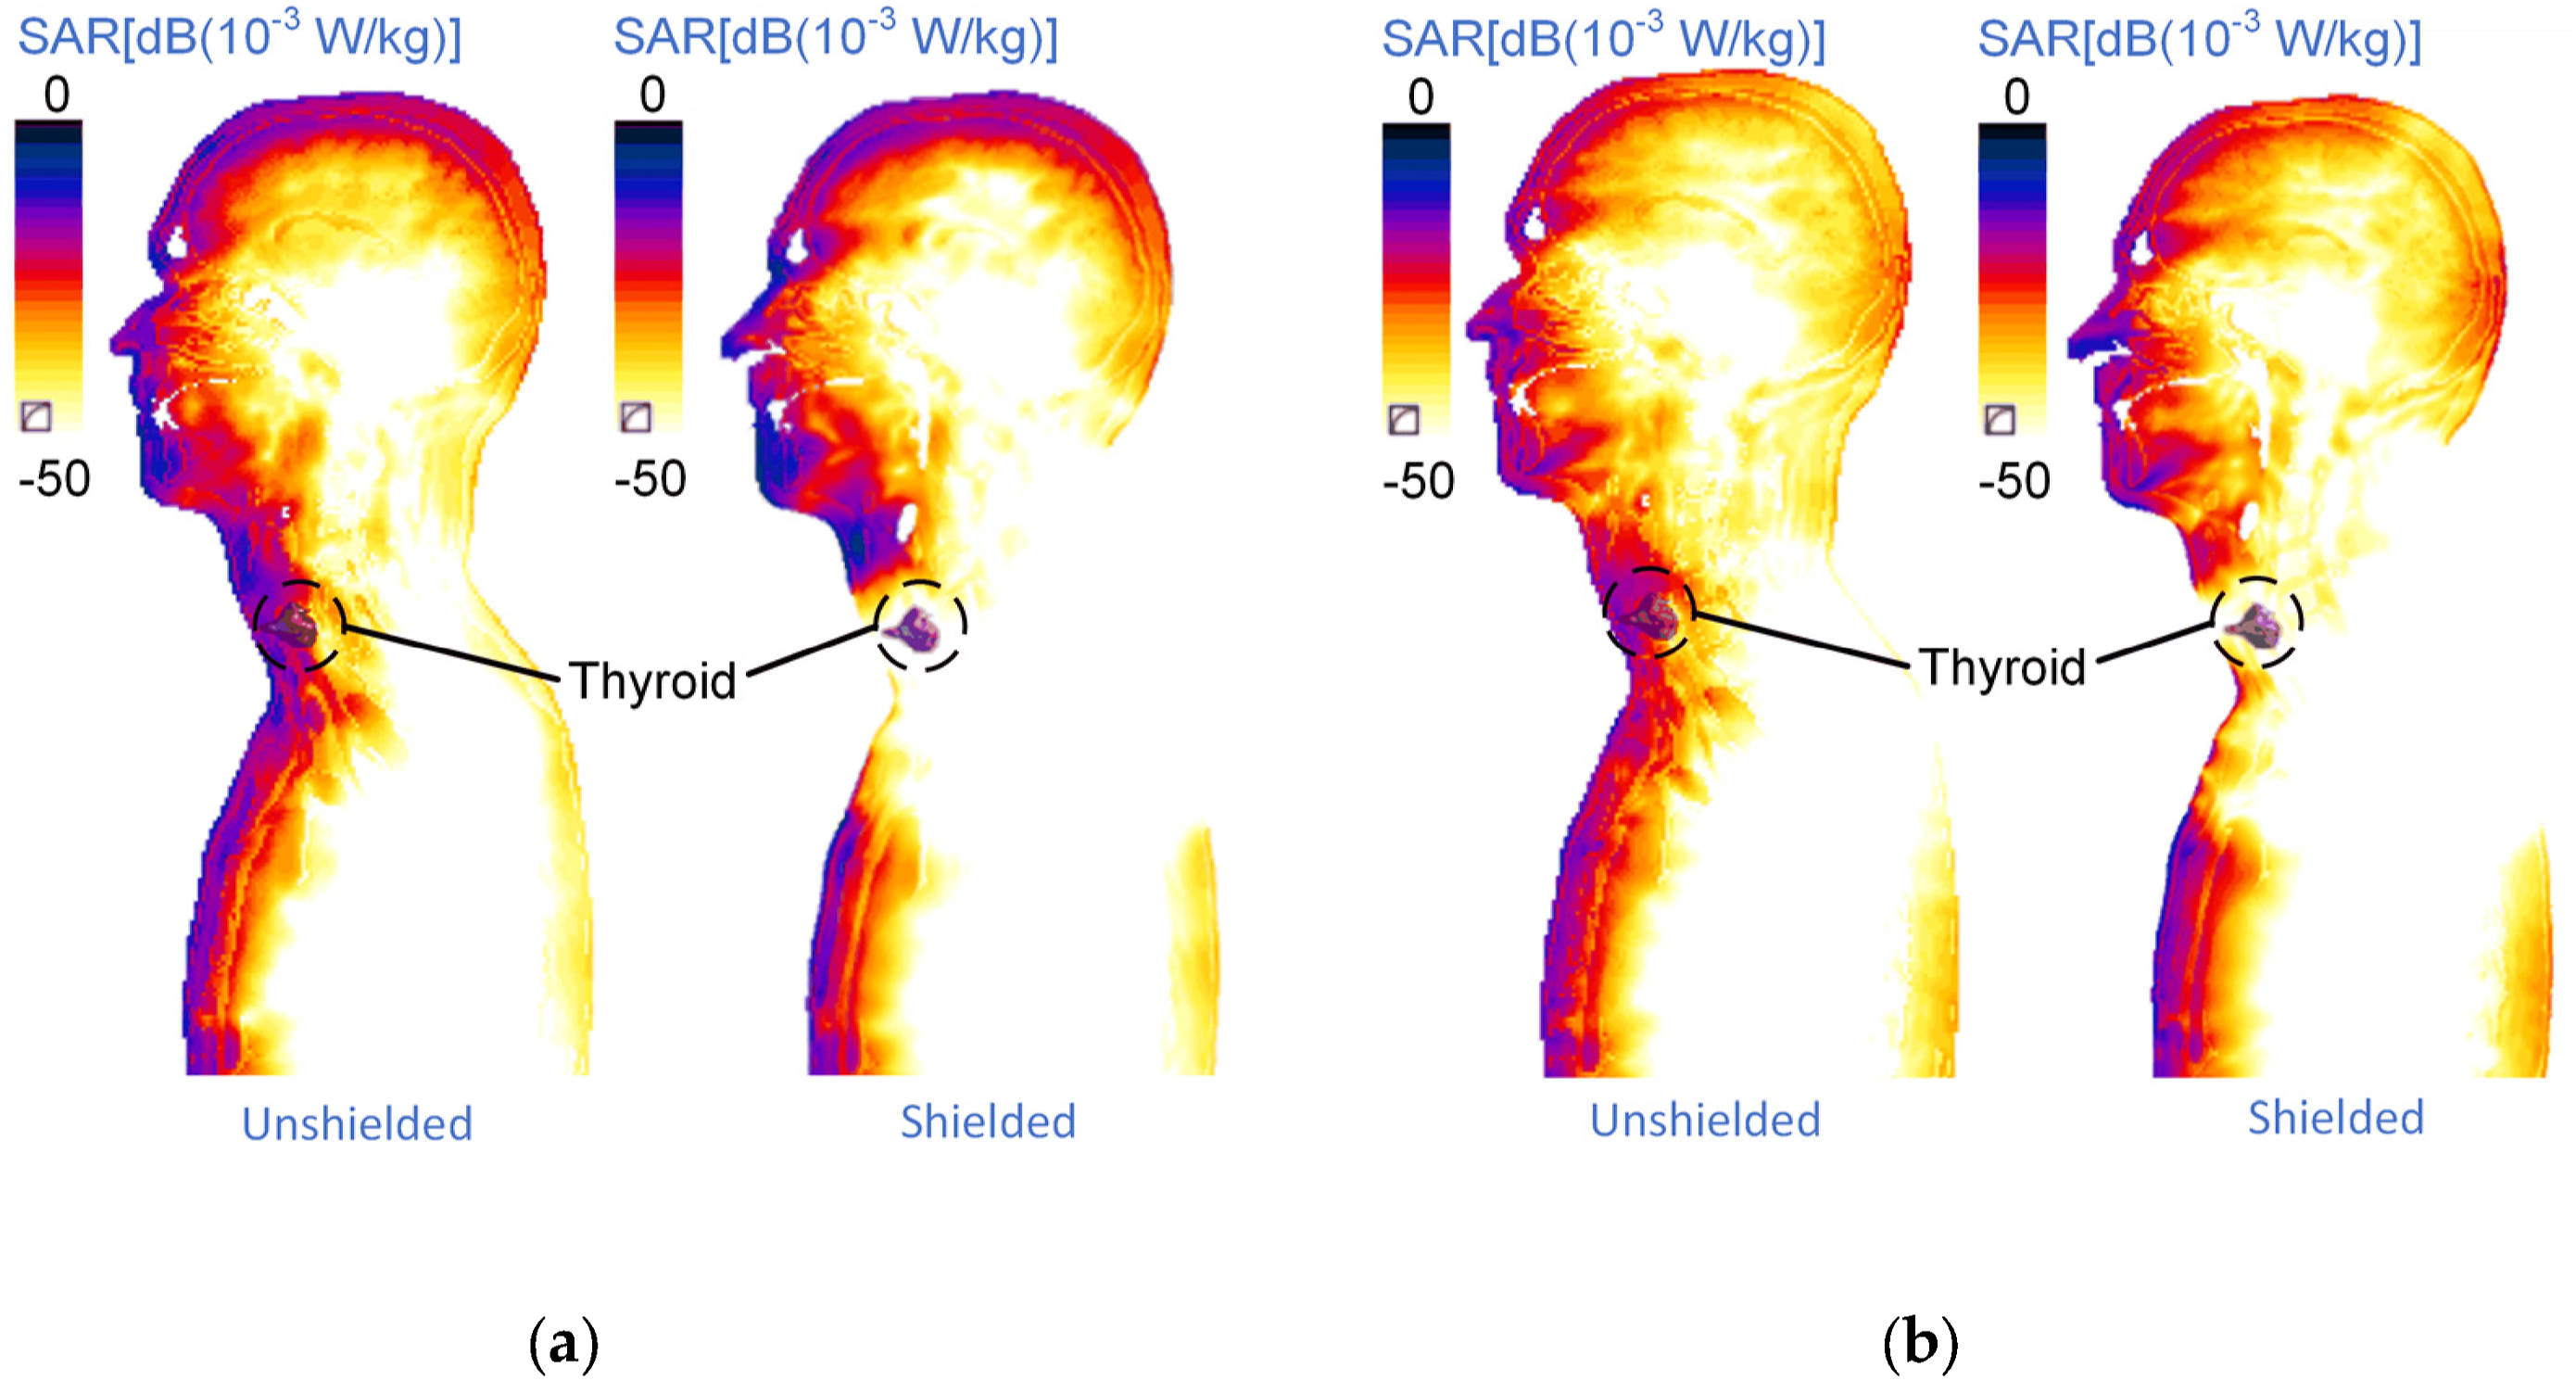
SE results
Analyzing the SAR values of thyroid tissue before and after shielding, as depicted in Figure 7, we determined the shielding effectiveness, illustrated in Figure 9. Within the 1–6 GHz frequency range, the shielding efficiency for vertical polarization varies from 20 to 40 dB, demonstrating an increase with frequency. For horizontal polarization, the shielding efficacy fluctuates between 14 and 28 dB, with a distinct peak at approximately 3 GHz. Shielding effectiveness of thyroid protective equipment under forward irradiation.
Generally, the shielding efficiency of vertical polarization exceeds that of horizontal polarization, particularly at 6 GHz, where the difference reaches approximately 20 dB. This disparity suggests that the polarization significantly influences the effectiveness of the shielding at different frequencies.
Equivalent SE for other tissues
In addition to assessing thyroid TSAR, we also explored changes in Whole-Body Averaged SAR (WBASAR) and SSAR for the brain and eye. WBASAR values were directly obtained using the Sim4Life software. In contrast, SSAR values were calculated using the formula provided as equation (4). Appendix A contains detailed tissue parameters for the brain and eye in Tables A1 and A2, respectively. The WBASAR and TSAR values for various tissues in the brain and eye, both before and after shielding, are presented in Table A3, A4, A5 and A6 of Appendix A.
Employing the calculation method for thyroid shielding effectiveness outlined in equation (2) and referencing the SSAR calculation method in equation (4), we evaluated and calculated the equivalent shielding effectiveness values for whole-body, brain, and eye. These values are depicted in Figure 10. The whole-body equivalent SE values were minimal, ranging from −0.4 dB to 0.3 dB, as illustrated in Figure 10(a). For the brain, the equivalent SE values fluctuated between −2 dB and 0 dB, as shown in Figure 10(b), while the eye’s equivalent SE values oscillated around −4 dB to 0 dB, as indicated in Figure 10(c). Furthermore, the equivalent SE values for SAR in the brain, eyes, and whole body exhibited a decreasing trend with an increase in frequency. Equivalent SE values for other tissues under forward irradiation: (a) whole body (WB); (b) brain; (c) eye.
It is noteworthy that the equivalent SE values were negative in the majority of cases, suggesting that local shielding might have led to a gain phenomenon in other unshielded tissues, resulting in an increase in SAR values.
Discussion
Opportunity and needs for thyroid protection
It is crucial to discuss the appropriate timing and circumstances for electromagnetic protection. Unnecessary or excessive shielding may affect both operational efficiency and daily activities. Observations from the relationship between the unshielded SAR and the incident direction of the thyroid gland, as shown in Figure 5, suggest that the thyroid is more susceptible to frontal exposure. This is determined by the anatomical structure of the thyroid gland, which is characterized by being located directly in front of the neck. However, an analysis of the frequency distribution, as presented in Figure 7(a), shows that the thyroid is especially at risk in the lower L-band range (1–2 GHz).
Consequently, in common working environments such as those involving communication radar and base stations, it is vital for workers to be alert to the potential of forward radiation and L-band frequencies affecting the thyroid. Special attention should be paid to thyroid shielding in these situations.
Evaluation of shielding efficiency
Shielding effectiveness is a critical parameter for evaluating the performance of protective gear. When assessing this parameter, tests typically need to account for factors such as polarization direction and frequency. In our study, we set a fixed forward irradiation condition and focused on the shielding efficiency of the thyroid under both vertical and horizontal polarizations within the 1–6 GHz frequency range. The results, as illustrated in Figure 9, indicate that the thyroid’s shielding efficiency can range from 14 to 40 dB, demonstrating a significant shielding effect, as also evident in Figure 8.
These quantitative results indicate that the electromagnetic shielding effect of protective gear is feasible and can effectively reduce the internal dose of high-intensity electromagnetic exposure in occupational environments or special environments such as mobile phone base stations. This helps mitigate the potential health risks associated with electromagnetic radiation exposure to the thyroid gland.
The research methodology employed in this study has notable advantages. Laboratory evaluations, however, are challenging, particularly in the selection of suitable electric field probes for precise measurements of the small thyroid gland. To circumvent this issue, we utilized a simulation method based on SAR values, which surmounts the limitations inherent in traditional laboratory shielding efficiency assessments. Comparable SAR value assessments, such as the numerical simulation of male underwear shielding, have previously concentrated on simulating the shielding effectiveness for the male reproductive system and analyzing the two-dimensional distribution of SAR values. 17 Our research extends these approaches by not only comparing the two-dimensional distribution of SAR values (Figure 8) but also by providing a quantitative analysis of the local shielding effectiveness values (Figure 9). This holistic strategy yields actionable insights for the design and advancement of protective products with measurable performance standards.
Therefore, for local shielding protection schemes that are challenging to evaluate directly in laboratory settings, particularly for thyroid protection, biological electromagnetic dose simulations can be performed using human body models integrated with protective gear models. By comparing the SAR values of tissues, the protective efficacy can be quantitatively assessed, thereby facilitating the optimization of the protection design.
Variety in shielding efficiency
Research findings indicate that the polarization direction plays a crucial role in determining the shielding efficiency trend. As depicted in Figure 9, the shielding efficiency for the thyroid gland under vertical polarization shows a consistent increase with rising frequency. In contrast, the efficiency under horizontal polarization initially rises but then experiences a decline. The pronounced influence of polarization direction on shielding efficiency necessitates careful consideration during both testing protocols and practical protection evaluations.
To understand the underlying causes for these polarization-dependent differences, we conducted an initial analysis. As shown in Figure 7(b), the SAR value of the thyroid gland in vertical polarization diminishes more swiftly post-shielding compared to the horizontal polarization, where the SAR variation with frequency is less distinct. This discrepancy may be explained by the diffraction effect, a phenomenon where waves bend around obstacles or pass through narrow openings.
In our study, the gear acts as an obstacle, and the collar behaves akin to a slit. 30 When the electromagnetic wave’s polarization aligns parallel to this slit, the diffraction is more pronounced than when the polarization is orthogonal to it. As a result, the reduction in SAR for the thyroid gland in horizontal polarization is less pronounced, which consequently translates to a comparatively lower shielding efficiency in horizontal polarization than in vertical polarization.
Side effects of local shielding
In the context of protective gear, side effects refer to the unintended scattering of electromagnetic energy, which can be particularly pronounced in areas not covered by the gear, such as the face. As noted by Ref. 16, full-body protective clothing can, under certain exposure conditions, lead to elevated local SAR peaks in the head compared to when no protective gear is worn. Our study investigated this issue, with a focus on the secondary effects of local thyroid protection on other critical organs, specifically the SAR values for the eyes and brain.
Figure 10 illustrates our findings, showing that local protection may inadvertently result in an increased SAR dose across the whole body, with the brain and eyes being particularly affected. Although the overall impact on the whole body is negligible, with a change of less than 1 dB, the effect on the brain is more significant, increasing by less than 2 dB. However, the most substantial change is observed in the SAR dose to the eyes, which can increase by up to 4 dB at higher frequencies. This suggests that the use of local thyroid protection may place additional importance on the need for effective eye protection.
To clarify the reasons behind the observed frequency and target-specific differences, we conducted a preliminary analysis. The predominant cause of the elevated SAR in the eyes and head seems to be attributed to electromagnetic scattering. According to scattering theory, 30 at higher frequencies, the scattering effect of the protective gear on electromagnetic waves intensifies, leading to increased scattering intensity. Since the eyes are located at the front of the head, they are particularly susceptible to this scattering, resulting in a pronounced frequency-dependent increase in the SAR dose value.
Limitation and future work
This study also has its limitations. To simplify the FDTD grid division, the thickness of the shielding material was arbitrarily set to 1 mm, which is considerably thicker than the actual thickness of typical electromagnetic functional materials.14,31,32 This decision was necessitated by the computational constraints of the FDTD algorithm. Reducing the thickness to the sub-millimeter level for large-scale human body simulations would require an impractically high number of grid points. As a result, it is difficult to accurately evaluate the impact of microscopic material characteristics, such as actual thickness, on the shielding effectiveness.
In future research, the influence of various material parameters on the shielding effectiveness of protective clothing can be more thoroughly investigated using FEA methods. While this approach is computationally intensive and complex, it may provide a more accurate representation of material behavior. Additionally, to mitigate the issue of increased eye dose values due to scattering, future studies could investigate the application of specialized electromagnetic functional materials designed to reduce scattering. 33 The effectiveness and practicality of these materials require detailed examination and validation through experimental studies. Besides, alternative shielding designs could be explored to minimize the unintended increase in SAR values in sensitive areas like the eyes, while still providing effective thyroid protection.
Conclusion
In conclusion, our computational study utilizing the Finite-Difference Time-Domain (FDTD) method has provided compelling evidence that a local electromagnetic shield can significantly reduce the specific absorption rate (SAR) in the thyroid gland, especially when exposed to forward irradiation and frequencies within the L-band (1–2 GHz). The shield demonstrated a robust shielding efficiency, ranging from 15 to 40 dB across the evaluated frequency spectrum. However, this study also identified a critical consideration: the potential for increased SAR values in other tissues, particularly the eyes, which could be elevated by up to 4 dB due to the shielding. This highlights the need for a balanced design approach that optimizes the protective benefits of thyroid shielding while mitigating potential adverse effects on other sensitive tissues.
The findings of this research enhance our understanding of the intricate interactions between electromagnetic radiation and the human body. By providing quantitative data and analytical insights, our study supports the informed design and application of electromagnetic protection products. We hope that these results will guide future advancements in the field, contributing to the development of more effective and safer protective measures against the potential health risks associated with electromagnetic radiation exposure.
Footnotes
Acknowledgments
Thanks to Engineer Yimin Yang for the advice and help of our mechanical modeling; Thanks to Engineer Zhenghai Lu of Beijing TianYuan Technology Corporation Ltd for helping us with electromagnetic simulation modeling.
Author contributions
Conceptualization, JJ. L. and J. L.; methodology, JJ. L.; software, JJ. L.; validation, X. L.; formal analysis, JJ. L.; investigation, X. L.; resources, J. L.; data curation, X. L.; writing—original draft preparation, X. L.; writing—review and editing, J. L.; visualization, JJ. L.; supervision, J. L.; project administration, J. L.; funding acquisition, JJ. L. All authors have read and agreed to the published version of the manuscript.
Declaration of conflicting interests
The author(s) declared no potential conflicts of interest with respect to the research, authorship, and/or publication of this article.
Funding
The author(s) disclosed receipt of the following financial support for the research, authorship, and/or publication of this article: This research was funded by the Research of Fourth Military Medical University, grant number 2023JSYX35.
Disclaimer/Publisher’s Note
The statements, opinions and data contained in all publications are solely those of the individual author(s) and contributor(s) and not of MDPI and/or the editor(s). MDPI and/or the editor(s) disclaim responsibility for any injury to people or property resulting from any ideas, methods, instructions or products referred to in the content.
Appendix
Items and mass of various brain tissues.
Number
Tissue
Mass (g)
1
Cerebellum
164.9
2
Cerebrospinal fluid
362.5
3
Cerebrum grey matter
574.0
4
Cerebrum white matter
522.8
5
Dura mater
140.2
6
Hippocampus
6.5
7
Hypophysis
1.0
8
Hypothalamus
0.6
9
Midbrain
14.9
10
Pons
15.4
11
Thalamus
9.1
Items and mass of various eye tissues.
Number
Tissue
Mass (g)
1
Cornea
0.7
2
Lens
0.3
3
Sclera
4.2
4
Vitreous humor
8.1
Specific absorption rate of tissues without shielding under vertical polarization @ 1 V/m excitation value.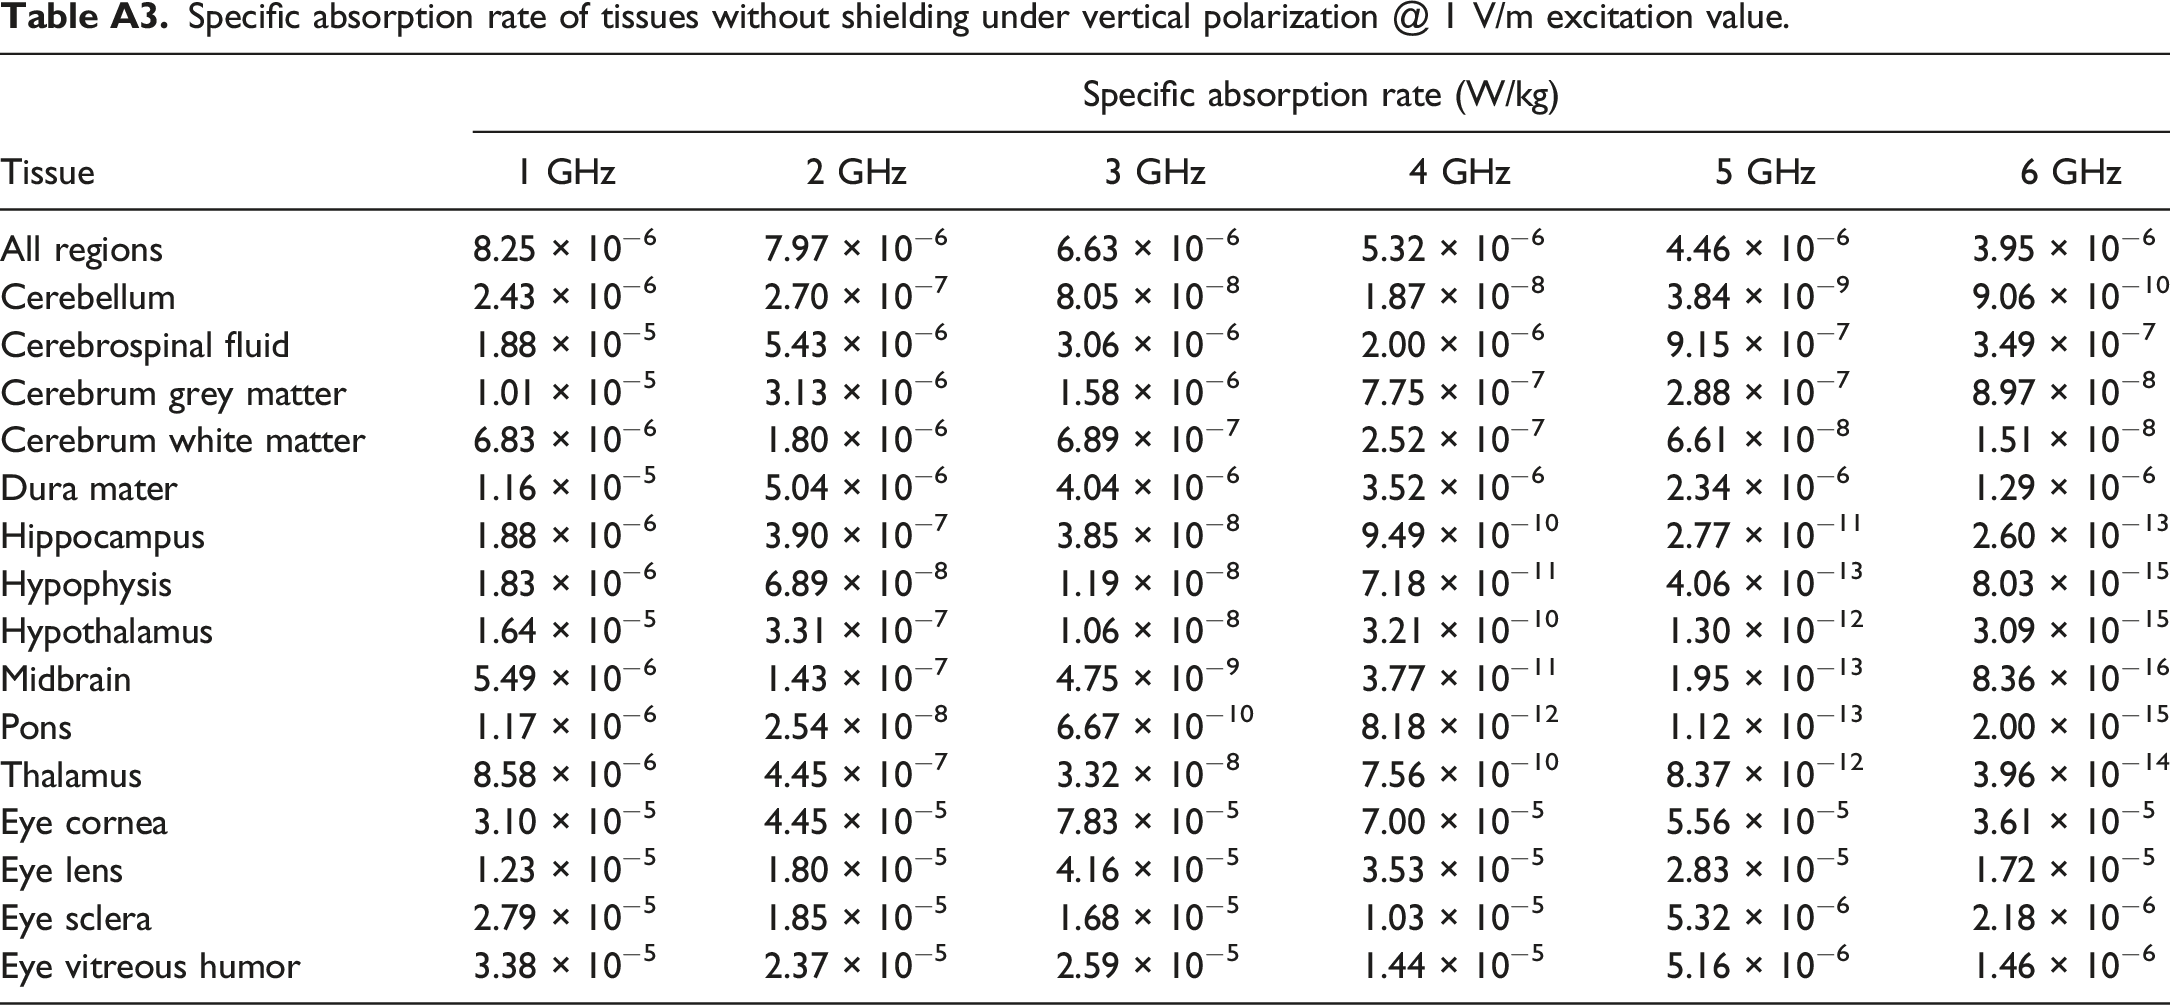
Tissue
Specific absorption rate (W/kg)
1 GHz
2 GHz
3 GHz
4 GHz
5 GHz
6 GHz
All regions
8.25 × 10⁻⁶
7.97 × 10⁻⁶
6.63 × 10⁻⁶
5.32 × 10⁻⁶
4.46 × 10⁻⁶
3.95 × 10⁻⁶
Cerebellum
2.43 × 10⁻⁶
2.70 × 10⁻⁷
8.05 × 10⁻⁸
1.87 × 10⁻⁸
3.84 × 10⁻⁹
9.06 × 10⁻¹⁰
Cerebrospinal fluid
1.88 × 10⁻⁵
5.43 × 10⁻⁶
3.06 × 10⁻⁶
2.00 × 10⁻⁶
9.15 × 10⁻⁷
3.49 × 10⁻⁷
Cerebrum grey matter
1.01 × 10⁻⁵
3.13 × 10⁻⁶
1.58 × 10⁻⁶
7.75 × 10⁻⁷
2.88 × 10⁻⁷
8.97 × 10⁻⁸
Cerebrum white matter
6.83 × 10⁻⁶
1.80 × 10⁻⁶
6.89 × 10⁻⁷
2.52 × 10⁻⁷
6.61 × 10⁻⁸
1.51 × 10⁻⁸
Dura mater
1.16 × 10⁻⁵
5.04 × 10⁻⁶
4.04 × 10⁻⁶
3.52 × 10⁻⁶
2.34 × 10⁻⁶
1.29 × 10⁻⁶
Hippocampus
1.88 × 10⁻⁶
3.90 × 10⁻⁷
3.85 × 10⁻⁸
9.49 × 10⁻¹⁰
2.77 × 10⁻¹¹
2.60 × 10⁻¹³
Hypophysis
1.83 × 10⁻⁶
6.89 × 10⁻⁸
1.19 × 10⁻⁸
7.18 × 10⁻¹¹
4.06 × 10⁻¹³
8.03 × 10⁻¹⁵
Hypothalamus
1.64 × 10⁻⁵
3.31 × 10⁻⁷
1.06 × 10⁻⁸
3.21 × 10⁻¹⁰
1.30 × 10⁻¹²
3.09 × 10⁻¹⁵
Midbrain
5.49 × 10⁻⁶
1.43 × 10⁻⁷
4.75 × 10⁻⁹
3.77 × 10⁻¹¹
1.95 × 10⁻¹³
8.36 × 10⁻¹⁶
Pons
1.17 × 10⁻⁶
2.54 × 10⁻⁸
6.67 × 10⁻¹⁰
8.18 × 10⁻¹²
1.12 × 10⁻¹³
2.00 × 10⁻¹⁵
Thalamus
8.58 × 10⁻⁶
4.45 × 10⁻⁷
3.32 × 10⁻⁸
7.56 × 10⁻¹⁰
8.37 × 10⁻¹²
3.96 × 10⁻¹⁴
Eye cornea
3.10 × 10⁻⁵
4.45 × 10⁻⁵
7.83 × 10⁻⁵
7.00 × 10⁻⁵
5.56 × 10⁻⁵
3.61 × 10⁻⁵
Eye lens
1.23 × 10⁻⁵
1.80 × 10⁻⁵
4.16 × 10⁻⁵
3.53 × 10⁻⁵
2.83 × 10⁻⁵
1.72 × 10⁻⁵
Eye sclera
2.79 × 10⁻⁵
1.85 × 10⁻⁵
1.68 × 10⁻⁵
1.03 × 10⁻⁵
5.32 × 10⁻⁶
2.18 × 10⁻⁶
Eye vitreous humor
3.38 × 10⁻⁵
2.37 × 10⁻⁵
2.59 × 10⁻⁵
1.44 × 10⁻⁵
5.16 × 10⁻⁶
1.46 × 10⁻⁶
Specific absorption rate of tissues without shielding under horizontal polarization @ 1 V/m excitation value.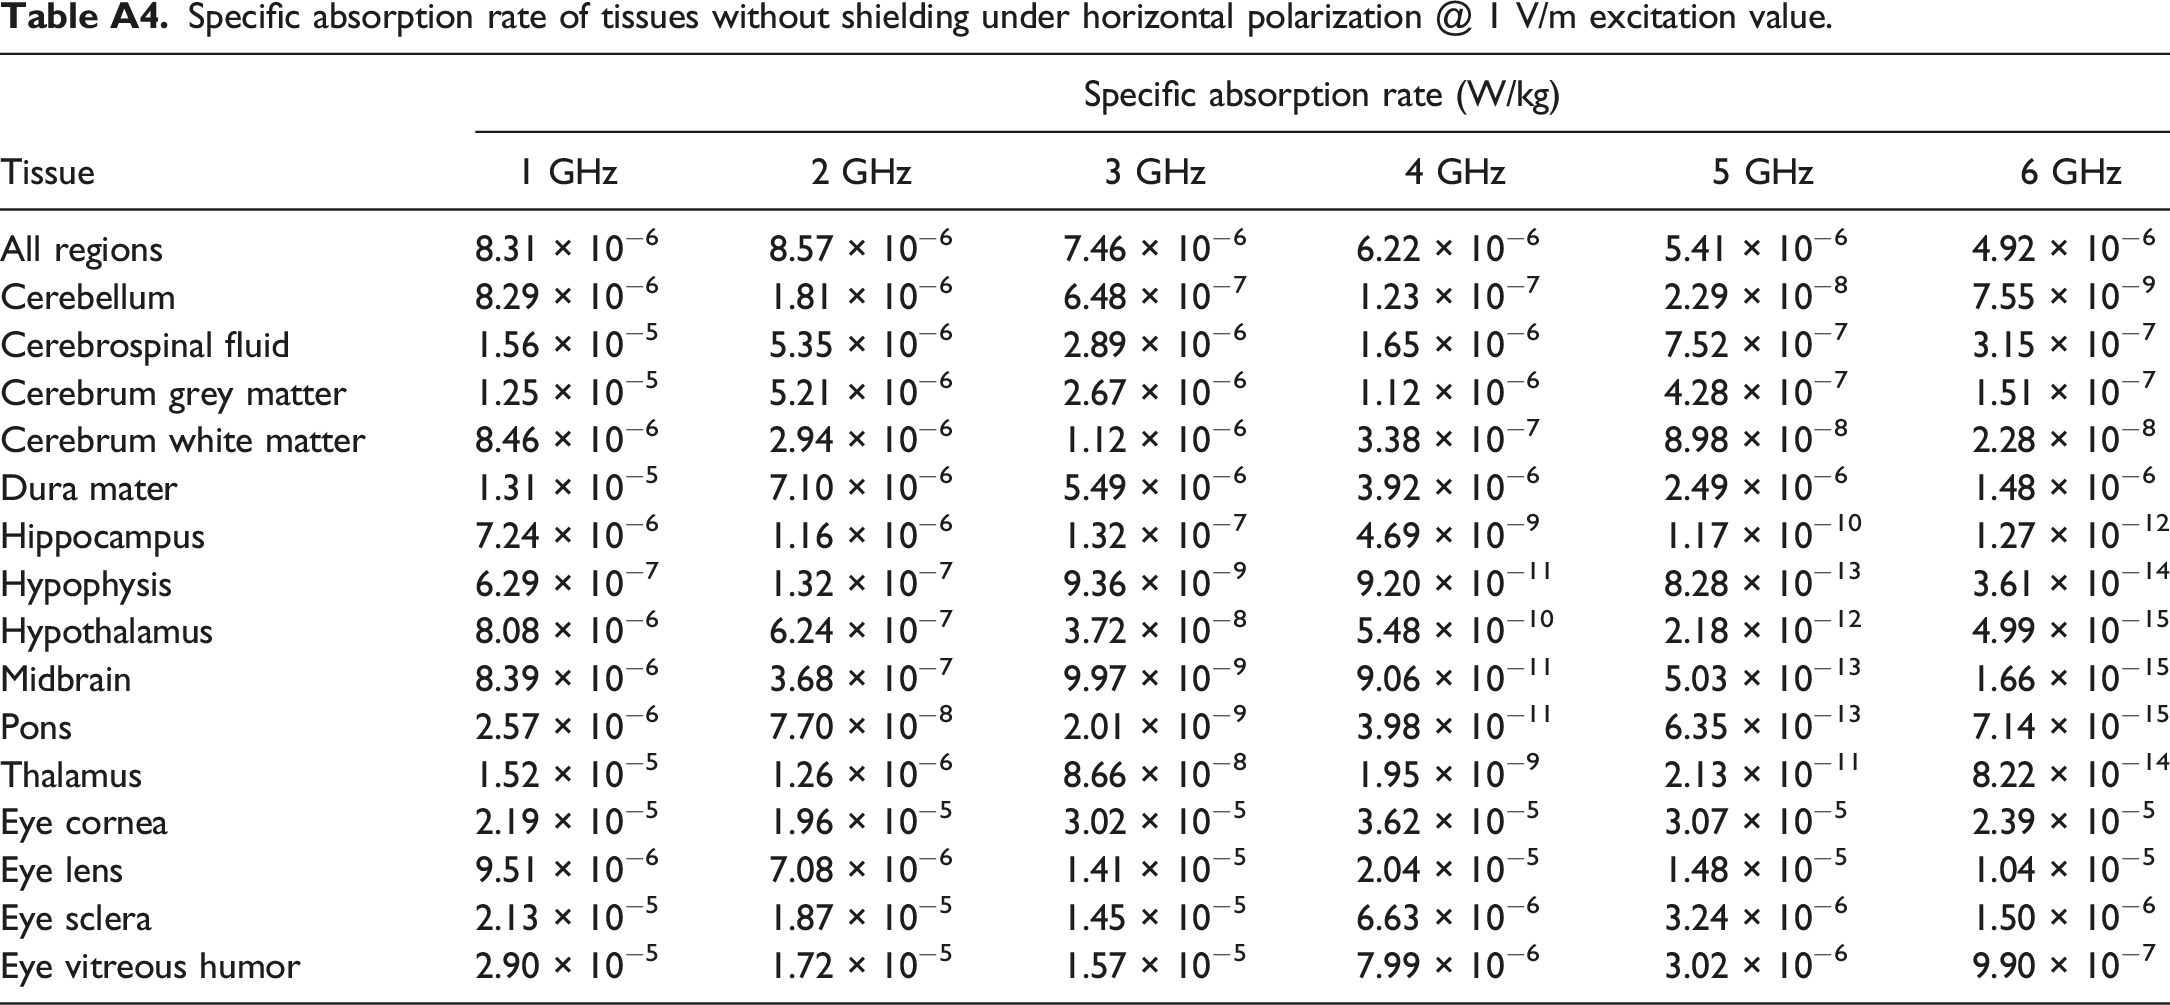
Tissue
Specific absorption rate (W/kg)
1 GHz
2 GHz
3 GHz
4 GHz
5 GHz
6 GHz
All regions
8.31 × 10⁻⁶
8.57 × 10⁻⁶
7.46 × 10⁻⁶
6.22 × 10⁻⁶
5.41 × 10⁻⁶
4.92 × 10⁻⁶
Cerebellum
8.29 × 10⁻⁶
1.81 × 10⁻⁶
6.48 × 10⁻⁷
1.23 × 10⁻⁷
2.29 × 10⁻⁸
7.55 × 10⁻⁹
Cerebrospinal fluid
1.56 × 10⁻⁵
5.35 × 10⁻⁶
2.89 × 10⁻⁶
1.65 × 10⁻⁶
7.52 × 10⁻⁷
3.15 × 10⁻⁷
Cerebrum grey matter
1.25 × 10⁻⁵
5.21 × 10⁻⁶
2.67 × 10⁻⁶
1.12 × 10⁻⁶
4.28 × 10⁻⁷
1.51 × 10⁻⁷
Cerebrum white matter
8.46 × 10⁻⁶
2.94 × 10⁻⁶
1.12 × 10⁻⁶
3.38 × 10⁻⁷
8.98 × 10⁻⁸
2.28 × 10⁻⁸
Dura mater
1.31 × 10⁻⁵
7.10 × 10⁻⁶
5.49 × 10⁻⁶
3.92 × 10⁻⁶
2.49 × 10⁻⁶
1.48 × 10⁻⁶
Hippocampus
7.24 × 10⁻⁶
1.16 × 10⁻⁶
1.32 × 10⁻⁷
4.69 × 10⁻⁹
1.17 × 10⁻¹⁰
1.27 × 10⁻¹²
Hypophysis
6.29 × 10⁻⁷
1.32 × 10⁻⁷
9.36 × 10⁻⁹
9.20 × 10⁻¹¹
8.28 × 10⁻¹³
3.61 × 10⁻¹⁴
Hypothalamus
8.08 × 10⁻⁶
6.24 × 10⁻⁷
3.72 × 10⁻⁸
5.48 × 10⁻¹⁰
2.18 × 10⁻¹²
4.99 × 10⁻¹⁵
Midbrain
8.39 × 10⁻⁶
3.68 × 10⁻⁷
9.97 × 10⁻⁹
9.06 × 10⁻¹¹
5.03 × 10⁻¹³
1.66 × 10⁻¹⁵
Pons
2.57 × 10⁻⁶
7.70 × 10⁻⁸
2.01 × 10⁻⁹
3.98 × 10⁻¹¹
6.35 × 10⁻¹³
7.14 × 10⁻¹⁵
Thalamus
1.52 × 10⁻⁵
1.26 × 10⁻⁶
8.66 × 10⁻⁸
1.95 × 10⁻⁹
2.13 × 10⁻¹¹
8.22 × 10⁻¹⁴
Eye cornea
2.19 × 10⁻⁵
1.96 × 10⁻⁵
3.02 × 10⁻⁵
3.62 × 10⁻⁵
3.07 × 10⁻⁵
2.39 × 10⁻⁵
Eye lens
9.51 × 10⁻⁶
7.08 × 10⁻⁶
1.41 × 10⁻⁵
2.04 × 10⁻⁵
1.48 × 10⁻⁵
1.04 × 10⁻⁵
Eye sclera
2.13 × 10⁻⁵
1.87 × 10⁻⁵
1.45 × 10⁻⁵
6.63 × 10⁻⁶
3.24 × 10⁻⁶
1.50 × 10⁻⁶
Eye vitreous humor
2.90 × 10⁻⁵
1.72 × 10⁻⁵
1.57 × 10⁻⁵
7.99 × 10⁻⁶
3.02 × 10⁻⁶
9.90 × 10⁻⁷
Specific absorption rate of tissues with shielding under vertical polarization @ 1 V/m excitation value.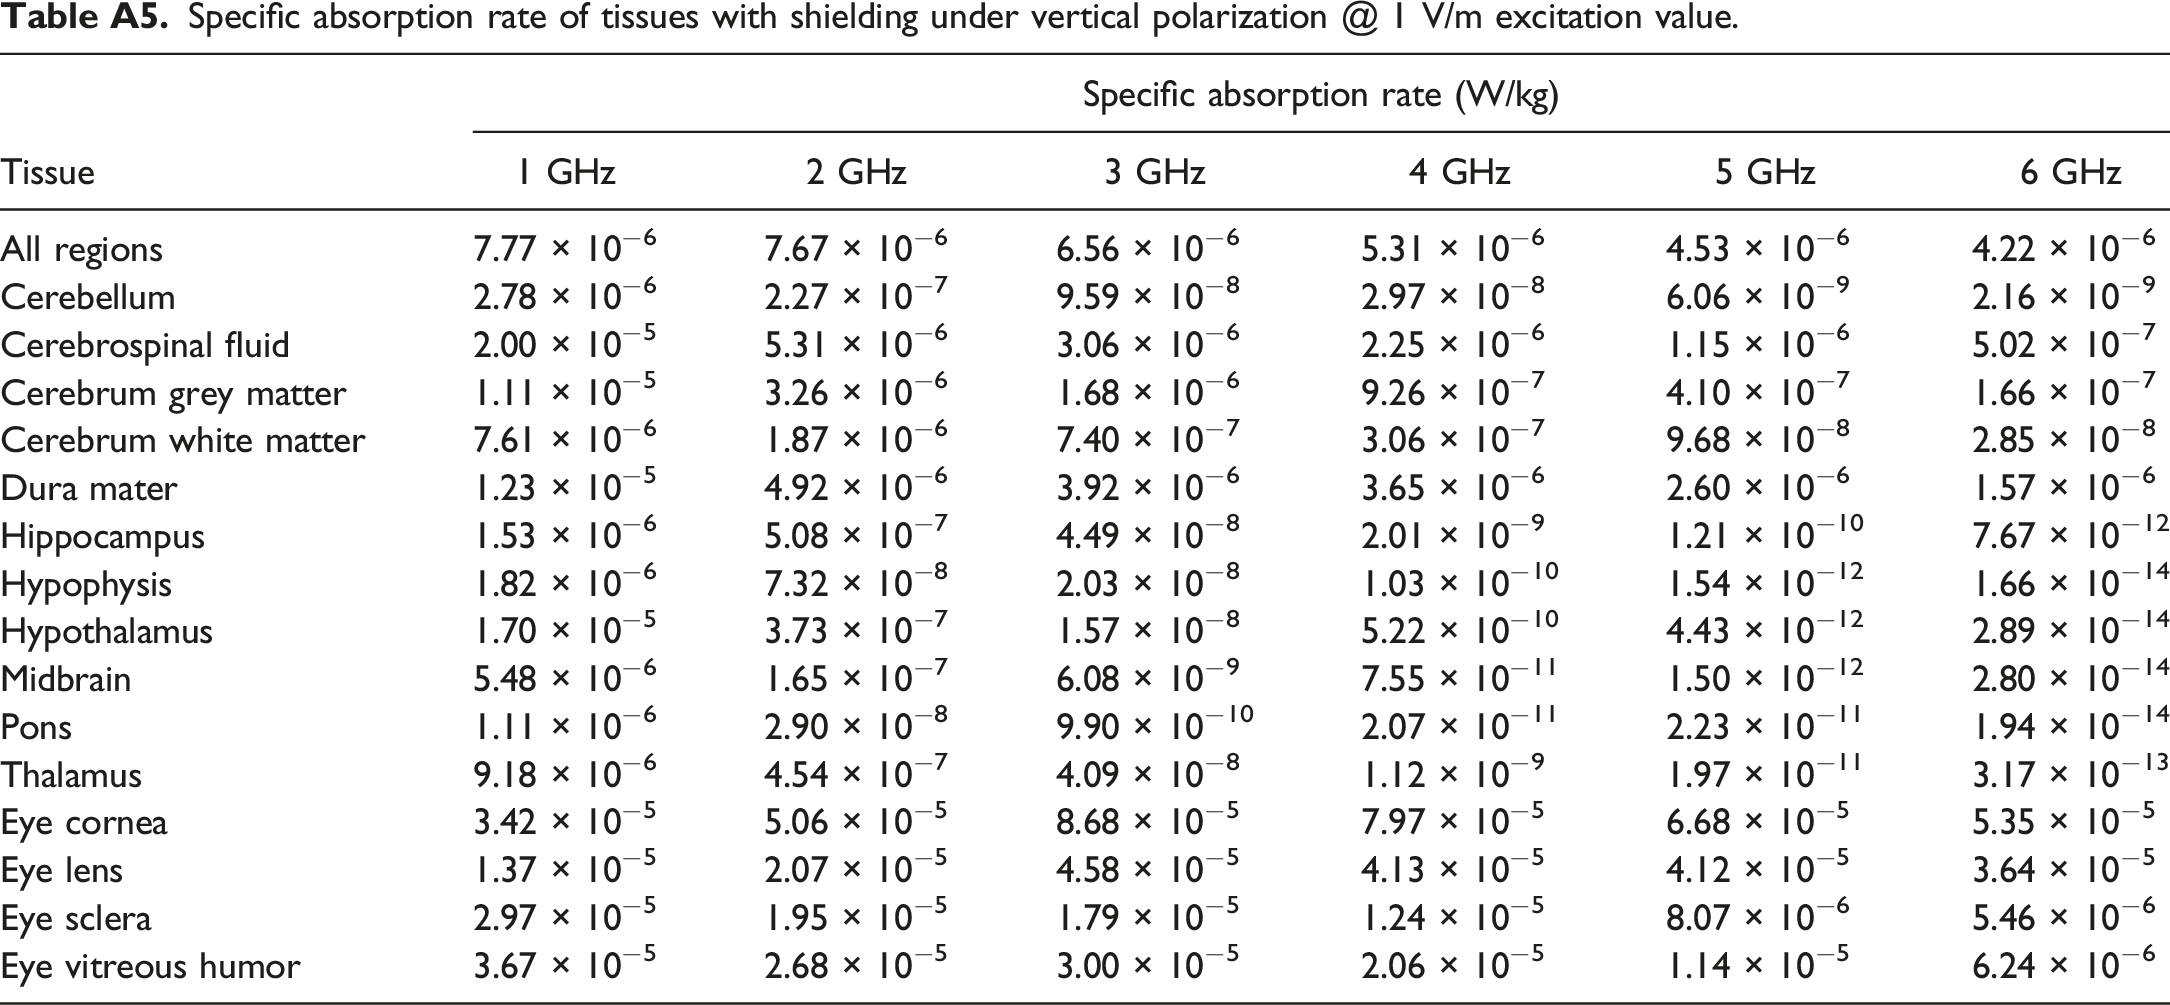
Tissue
Specific absorption rate (W/kg)
1 GHz
2 GHz
3 GHz
4 GHz
5 GHz
6 GHz
All regions
7.77 × 10⁻⁶
7.67 × 10⁻⁶
6.56 × 10⁻⁶
5.31 × 10⁻⁶
4.53 × 10⁻⁶
4.22 × 10⁻⁶
Cerebellum
2.78 × 10⁻⁶
2.27 × 10⁻⁷
9.59 × 10⁻⁸
2.97 × 10⁻⁸
6.06 × 10⁻⁹
2.16 × 10⁻⁹
Cerebrospinal fluid
2.00 × 10⁻⁵
5.31 × 10⁻⁶
3.06 × 10⁻⁶
2.25 × 10⁻⁶
1.15 × 10⁻⁶
5.02 × 10⁻⁷
Cerebrum grey matter
1.11 × 10⁻⁵
3.26 × 10⁻⁶
1.68 × 10⁻⁶
9.26 × 10⁻⁷
4.10 × 10⁻⁷
1.66 × 10⁻⁷
Cerebrum white matter
7.61 × 10⁻⁶
1.87 × 10⁻⁶
7.40 × 10⁻⁷
3.06 × 10⁻⁷
9.68 × 10⁻⁸
2.85 × 10⁻⁸
Dura mater
1.23 × 10⁻⁵
4.92 × 10⁻⁶
3.92 × 10⁻⁶
3.65 × 10⁻⁶
2.60 × 10⁻⁶
1.57 × 10⁻⁶
Hippocampus
1.53 × 10⁻⁶
5.08 × 10⁻⁷
4.49 × 10⁻⁸
2.01 × 10⁻⁹
1.21 × 10⁻¹⁰
7.67 × 10⁻¹²
Hypophysis
1.82 × 10⁻⁶
7.32 × 10⁻⁸
2.03 × 10⁻⁸
1.03 × 10⁻¹⁰
1.54 × 10⁻¹²
1.66 × 10⁻¹⁴
Hypothalamus
1.70 × 10⁻⁵
3.73 × 10⁻⁷
1.57 × 10⁻⁸
5.22 × 10⁻¹⁰
4.43 × 10⁻¹²
2.89 × 10⁻¹⁴
Midbrain
5.48 × 10⁻⁶
1.65 × 10⁻⁷
6.08 × 10⁻⁹
7.55 × 10⁻¹¹
1.50 × 10⁻¹²
2.80 × 10⁻¹⁴
Pons
1.11 × 10⁻⁶
2.90 × 10⁻⁸
9.90 × 10⁻¹⁰
2.07 × 10⁻¹¹
2.23 × 10⁻¹¹
1.94 × 10⁻¹⁴
Thalamus
9.18 × 10⁻⁶
4.54 × 10⁻⁷
4.09 × 10⁻⁸
1.12 × 10⁻⁹
1.97 × 10⁻¹¹
3.17 × 10⁻¹³
Eye cornea
3.42 × 10⁻⁵
5.06 × 10⁻⁵
8.68 × 10⁻⁵
7.97 × 10⁻⁵
6.68 × 10⁻⁵
5.35 × 10⁻⁵
Eye lens
1.37 × 10⁻⁵
2.07 × 10⁻⁵
4.58 × 10⁻⁵
4.13 × 10⁻⁵
4.12 × 10⁻⁵
3.64 × 10⁻⁵
Eye sclera
2.97 × 10⁻⁵
1.95 × 10⁻⁵
1.79 × 10⁻⁵
1.24 × 10⁻⁵
8.07 × 10⁻⁶
5.46 × 10⁻⁶
Eye vitreous humor
3.67 × 10⁻⁵
2.68 × 10⁻⁵
3.00 × 10⁻⁵
2.06 × 10⁻⁵
1.14 × 10⁻⁵
6.24 × 10⁻⁶
Specific absorption rate of tissues with shielding under horizontal polarization @ 1 V/m excitation value.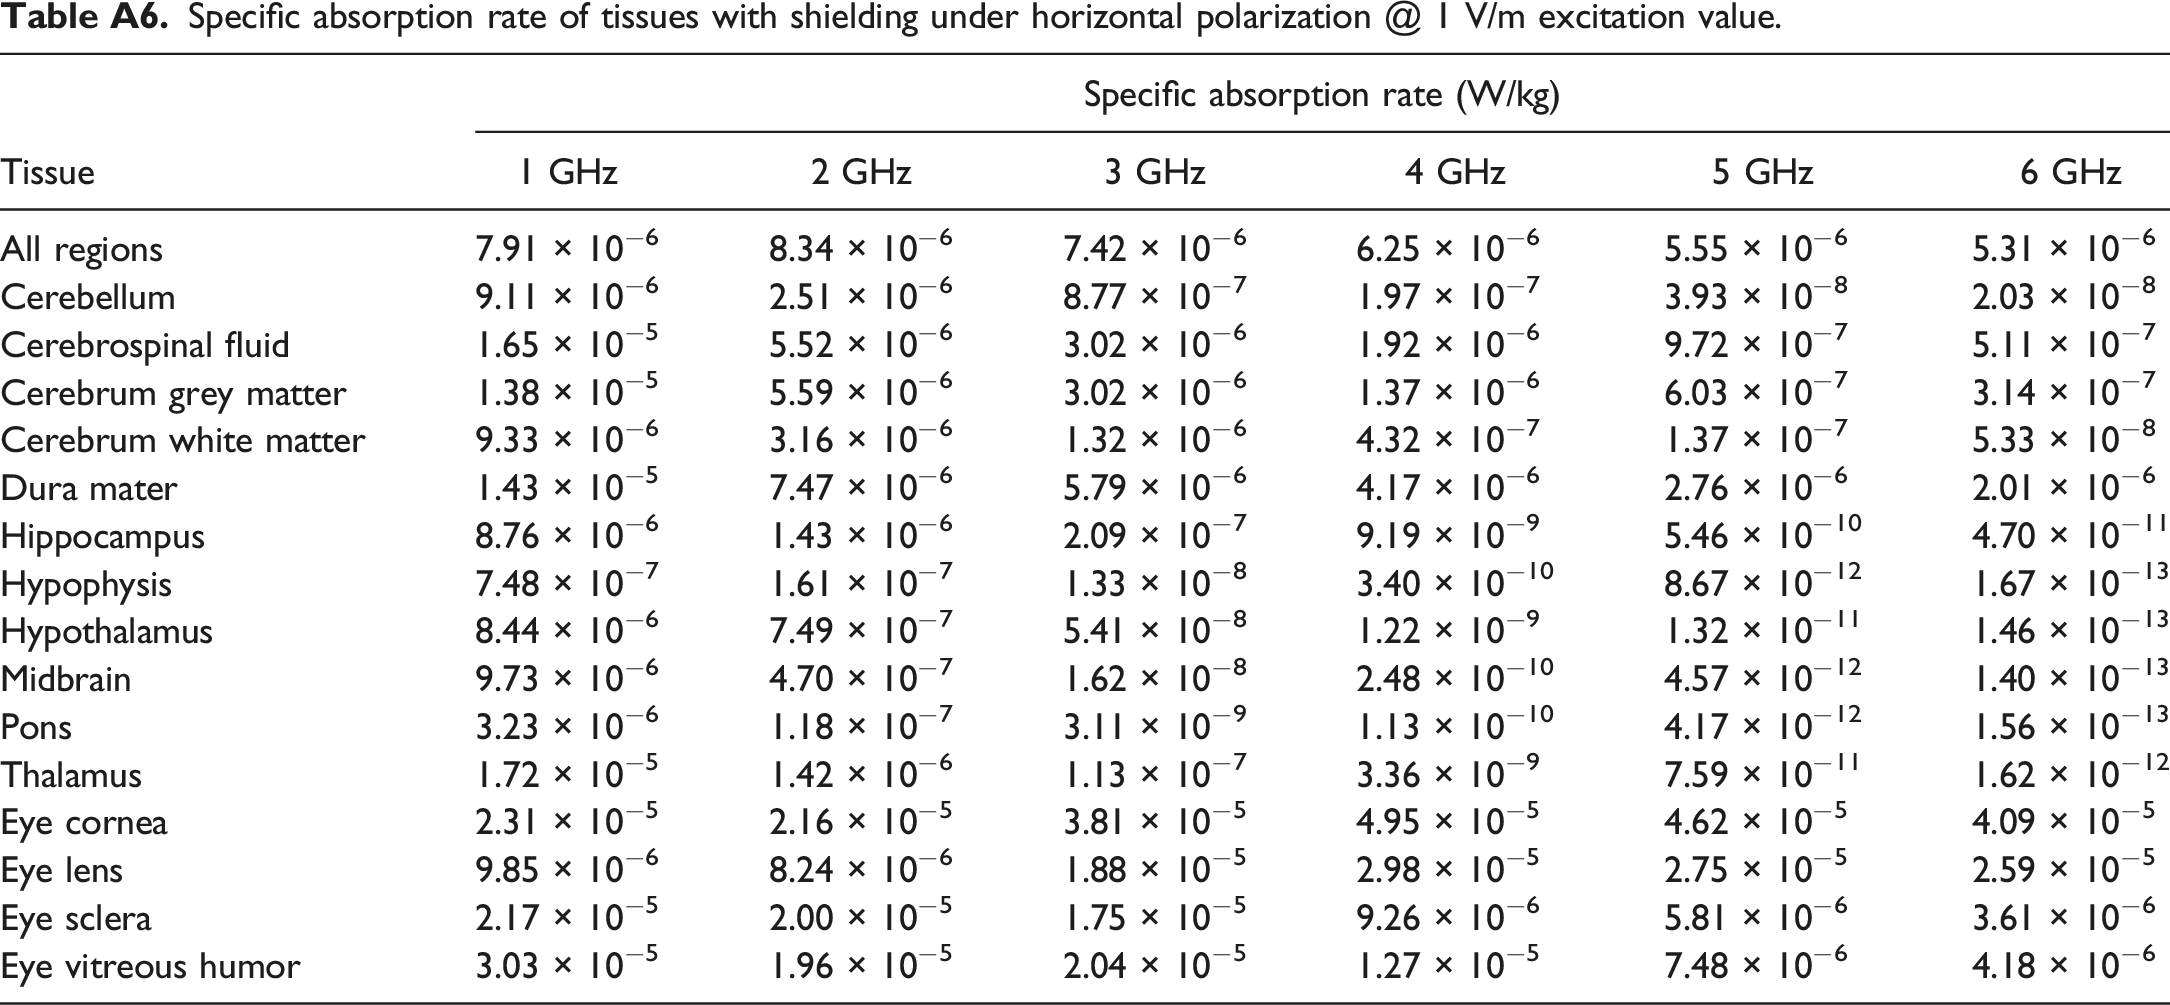
Tissue
Specific absorption rate (W/kg)
1 GHz
2 GHz
3 GHz
4 GHz
5 GHz
6 GHz
All regions
7.91 × 10⁻⁶
8.34 × 10⁻⁶
7.42 × 10⁻⁶
6.25 × 10⁻⁶
5.55 × 10⁻⁶
5.31 × 10⁻⁶
Cerebellum
9.11 × 10⁻⁶
2.51 × 10⁻⁶
8.77 × 10⁻⁷
1.97 × 10⁻⁷
3.93 × 10⁻⁸
2.03 × 10⁻⁸
Cerebrospinal fluid
1.65 × 10⁻⁵
5.52 × 10⁻⁶
3.02 × 10⁻⁶
1.92 × 10⁻⁶
9.72 × 10⁻⁷
5.11 × 10⁻⁷
Cerebrum grey matter
1.38 × 10⁻⁵
5.59 × 10⁻⁶
3.02 × 10⁻⁶
1.37 × 10⁻⁶
6.03 × 10⁻⁷
3.14 × 10⁻⁷
Cerebrum white matter
9.33 × 10⁻⁶
3.16 × 10⁻⁶
1.32 × 10⁻⁶
4.32 × 10⁻⁷
1.37 × 10⁻⁷
5.33 × 10⁻⁸
Dura mater
1.43 × 10⁻⁵
7.47 × 10⁻⁶
5.79 × 10⁻⁶
4.17 × 10⁻⁶
2.76 × 10⁻⁶
2.01 × 10⁻⁶
Hippocampus
8.76 × 10⁻⁶
1.43 × 10⁻⁶
2.09 × 10⁻⁷
9.19 × 10⁻⁹
5.46 × 10⁻¹⁰
4.70 × 10⁻¹¹
Hypophysis
7.48 × 10⁻⁷
1.61 × 10⁻⁷
1.33 × 10⁻⁸
3.40 × 10⁻¹⁰
8.67 × 10⁻¹²
1.67 × 10⁻¹³
Hypothalamus
8.44 × 10⁻⁶
7.49 × 10⁻⁷
5.41 × 10⁻⁸
1.22 × 10⁻⁹
1.32 × 10⁻¹¹
1.46 × 10⁻¹³
Midbrain
9.73 × 10⁻⁶
4.70 × 10⁻⁷
1.62 × 10⁻⁸
2.48 × 10⁻¹⁰
4.57 × 10⁻¹²
1.40 × 10⁻¹³
Pons
3.23 × 10⁻⁶
1.18 × 10⁻⁷
3.11 × 10⁻⁹
1.13 × 10⁻¹⁰
4.17 × 10⁻¹²
1.56 × 10⁻¹³
Thalamus
1.72 × 10⁻⁵
1.42 × 10⁻⁶
1.13 × 10⁻⁷
3.36 × 10⁻⁹
7.59 × 10⁻¹¹
1.62 × 10⁻¹²
Eye cornea
2.31 × 10⁻⁵
2.16 × 10⁻⁵
3.81 × 10⁻⁵
4.95 × 10⁻⁵
4.62 × 10⁻⁵
4.09 × 10⁻⁵
Eye lens
9.85 × 10⁻⁶
8.24 × 10⁻⁶
1.88 × 10⁻⁵
2.98 × 10⁻⁵
2.75 × 10⁻⁵
2.59 × 10⁻⁵
Eye sclera
2.17 × 10⁻⁵
2.00 × 10⁻⁵
1.75 × 10⁻⁵
9.26 × 10⁻⁶
5.81 × 10⁻⁶
3.61 × 10⁻⁶
Eye vitreous humor
3.03 × 10⁻⁵
1.96 × 10⁻⁵
2.04 × 10⁻⁵
1.27 × 10⁻⁵
7.48 × 10⁻⁶
4.18 × 10⁻⁶