
Abstract
Carboxymethyl cellulose (CMC)/polyvinyl alcohol (PVA)-Mn0.25Fe2,75O4/Ag ferrogels was fabricated by using the freezing-thawing method. Mn0.25Fe2.75O4/Ag magnetic fillers of ferrogels were synthesized by using coprecipitation and chemical reduction methods. Characterization of Mn0.25Fe2.75O4/Ag nanopowders was carried out using X-ray Diffraction (XRD), Transmission Electron Microscopy (TEM), Vibrating Sample Magnetometer (VSM) instrument, and antimicrobial activity. At the same time, CMC/PVA-Mn0.25Fe2.75O4/Ag ferrogels were characterized by using magnetothermal instrument. The XRD pattern of the magnetite filler shows the peaks by the Fe3O4 and Ag phases, respectively. The TEM image, there are Mn0.25Fe2.75O4 and Ag with particle size distributions of 5–7 and 10–13 nm, respectively. The hysterical curve from VSM characterization shows a decrease in the value of magnetization saturation from 16.9 to 14.7 emu/g along with the addition of Ag material. Antimicrobial activity was tested using the agar diffusion method. Mn0.25Fe2.75O4/Ag samples showed very good results indicated by the widening of the zone of inhibition around the sample. Thus, CMC/PVA-Mn0.25Fe2.75O4/Ag ferrogels has the potential application to be applied in hyperthermia therapy as well as antimicrobial materials.
Introduction
Hydrogel magnetic or ferrogel is a composite material whose constituents consist of a polymer matrix and magnetic filler. Through its magnetic filler characteristics, ferrogel can respond to external magnetic fields and fall into the category of multipurpose material. 1 With this multipurpose nature, ferrogel can be applied in various fields such as industrial technology, biomedicine, and medicine for sensitive magnetic field transformers, 2 artificial muscles, 3 sensors, 4 drug delivery, 5 anti-toxins, 6 antibacterial, 7 antifungal, 8 and hyperthermia therapy. 9 To obtain a material with certain properties, the selection of magnetic filler material in ferrogel must be modified so that it can be applied in certain fields.
In the last 5 years, studies on silver fillers (Ag) which have nontoxic material characteristics and have antimicrobial activity and potential applications in the biomedical field have been widely reported by researchers.10–17 Ferrogel with magnetite and Ag fillers is a composite material that has the potential to be applied in hyperthermia therapy with the characteristic of being able to increase changes in material temperature through magnetic induction 18 and antimicrobials. Ding et al. has successfully fabricated Fe3O4-Ag composite materials and conducted a magneto-thermal test using a 390 kHz and resulted at a temperature rise of up to 12°C within 600 s and a SAR value of 83 W/g. 18 In addition, other studies related to ferrogel with Ag fillers were also conducted by Dong et al. 19 They explained that the zone of inhibition of testing using S. Aureus and E. Coli bacteria on Ag@Fe3O4@Cellulose samples were in areas 2.8 and 2.4 mm. 19 However, there are still few studies that report on Carboxymethyl Cellulose (CMC)/Polyvinyl Alcohol (PVA) based hydrogel-based ferrogel with Mn-doped Fe3O4 and Ag filler.
To optimize the saturation value of magnetite material saturation, Mn atoms on Fe3O4 nanoparticle doping was done with a concentration of 25%. 20 In addition, CMC/PVA based hydrogels were chosen because CMC has high biocompatibility and biodegradable, 21 active antimicrobials, non-toxicity, 3 and environmentally friendly materials. 22 However, CMC has a complicated polymer chain distribution and high viscosity so that it can reduce its spinnability. 23 Thus, PVA was added, 24 which is a semi-crystalline polymer which hydroxyl groups produce inter hydrogen bonds and intramolecular 25 to increase spinnability due to differences in molecular weight and hydrolysis degree of CMC/PVA polymer composites. 26 Meanwhile, PVA has good biodegradability 27 and is applicable in biomedical fields such as an antimicrobial agent 28 and artificial articular cartilage. 29 Furthermore, CMC/PVA hydrogels can be easily fabricated since it has excellent hydrophilicity. 30 Characterization of the Specific Absorption Rate (SAR) value of the CMC/PVA- Mn0.25Fe2.75O4/Ag ferrogel is the focus of this study.
Experimental method
Materials
The material employed in this study was natural iron sand from Tulungagung Sine beach in Indonesia. The synthesis materials used were hydrogen chloride (HCl) 12.063 M (Merck), ammonium hydroxide (NH4OH) 6.5 M, (Merck), MnCl2.4H2O (Merck), AgNO3 (Merck), Carboxymethyl Cellulose (CMC-Na) Mw∼90.000 (Sigma Aldrich), Polyvinyl Alcohol (PVA) Mw∼60.000 (Merck) aquades, methanol, dan DMSO (Dimetil Sulfoksida).
Synthesis of Mn0.25Fe2.75O4/Ag filler
Mn0.25Fe2.75O4/Ag magnetic material filler was used in this study, which was synthesized by using co-precipitation and chemical reduction methods. The iron sand powder was dissolved in HCl and stirred by using a magnetic stirrer for about 30 min to produce a solution of FeCl2 and FeCl3. The FeCl2 and FeCl3 solution were deposited with NH4OH. The precipitate was then filtered and washed using distilled water to a normal pH. Synthesis of Mn0.25Fe2.75O4 was carried out by dissolving the iron sand powder in HCl and stirring by using a magnetic stirrer for 30 min. After the solution was formed, filtering was done by using filter paper. The result was mixed with MnCl2.4H2O and precipitated with NH4OH. Then the precipitate was filtered and washed with distilled water to a normal pH.
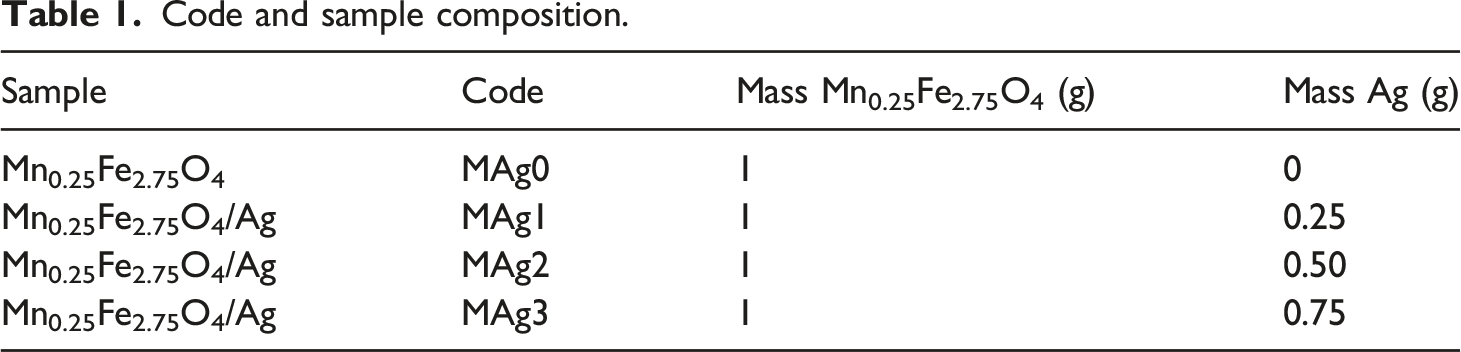
Code and sample composition.
Fabrication of CMC/PVA- Mn0.25Fe2.75O4/Ag ferrogel
CMC and PVA polymers were dissolved in distilled water with the ratio of 21:100 and ratio CMC:PVA of 1:1 to produce hydrogels. The hydrogel was mixed with Mn0.25Fe2.75O4/Ag material and stirred evenly to produce ferrogel. This process was carried out through the freezing-thawing method three times with a duration of 2 h freezing at ambient temperatures −10°C and 1 h thawing at room temperature. The complete fabrication step shown in Figure 1. Fabrication of CMC/PVA- Mn0.25Fe2.75O4/Ag ferrogel.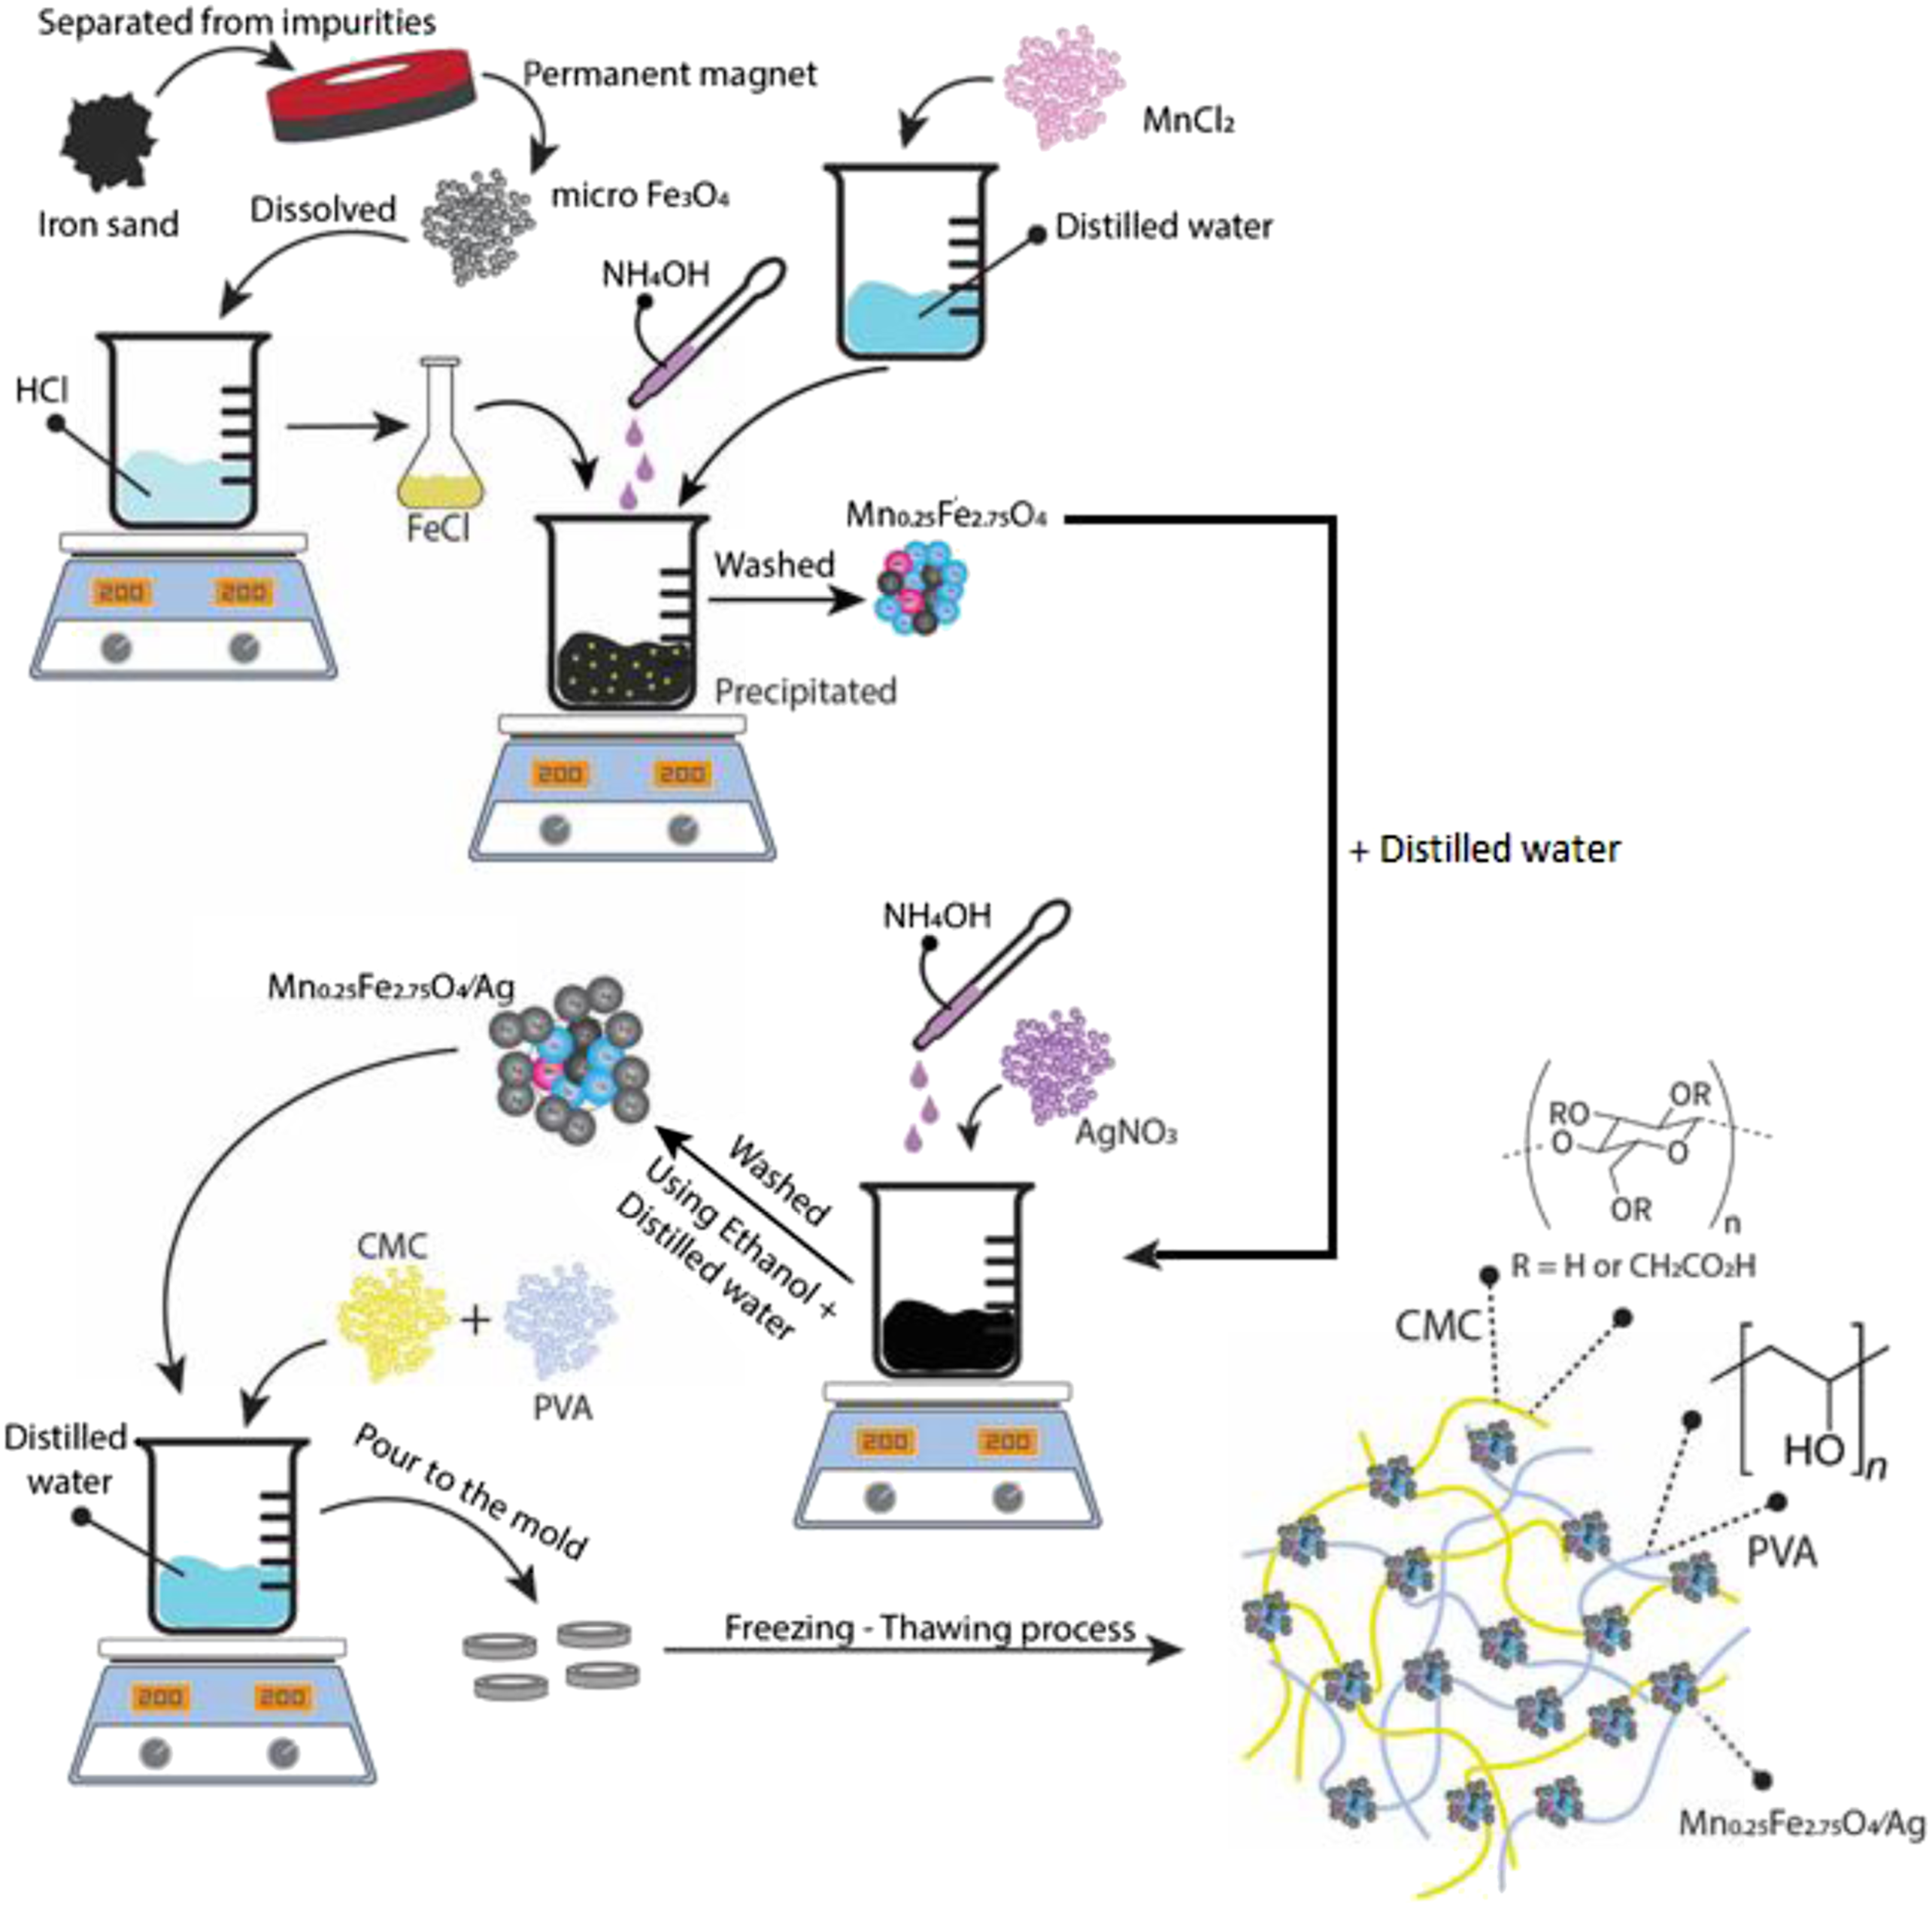
Characterization of antimicrobial activity
Antimicrobial characterization was carried out through the agar diffusion method. Powder and gel samples were dissolved in 5 mL DMSO. The microbes used were bacteria and fungi. There were three types of bacteria used in this characterization, namely, E. Coli, Bacillus Subtilis, and S. Aureus, while only one type of fungus was used, that was, Candida Albicans. The bacteria were grown in Nutrient Agar (NA) media (0.56 G NA dissolved in 20 mL distilled water per petri dish), while fungi was grown in Sabouraud Dextrose (SDA) media (1.3 g NA dissolved in 20 mL distilled water per petri dish per petri dish). Grown medias were sterilized using autoclave and UV light. Observation of inhibition zone wes carry out after 18 h incubation.
Characterization of specific absorption rate
SAR characterization was carried out by using an instrument, as shown in Figure 2. The sample was placed inside the coil. In the coil current flowed through the power supply, so produced a magnetic field inside the coil. Inside the coil, the samples were placed right in the middle of the coil to obtain an even magnetic field flow. These samples were tested by using different frequencies to investigate temperature changes. Changes in temperature in the samples were detected through a thermometer placed in the middle of the coil. SAR measurement instrument.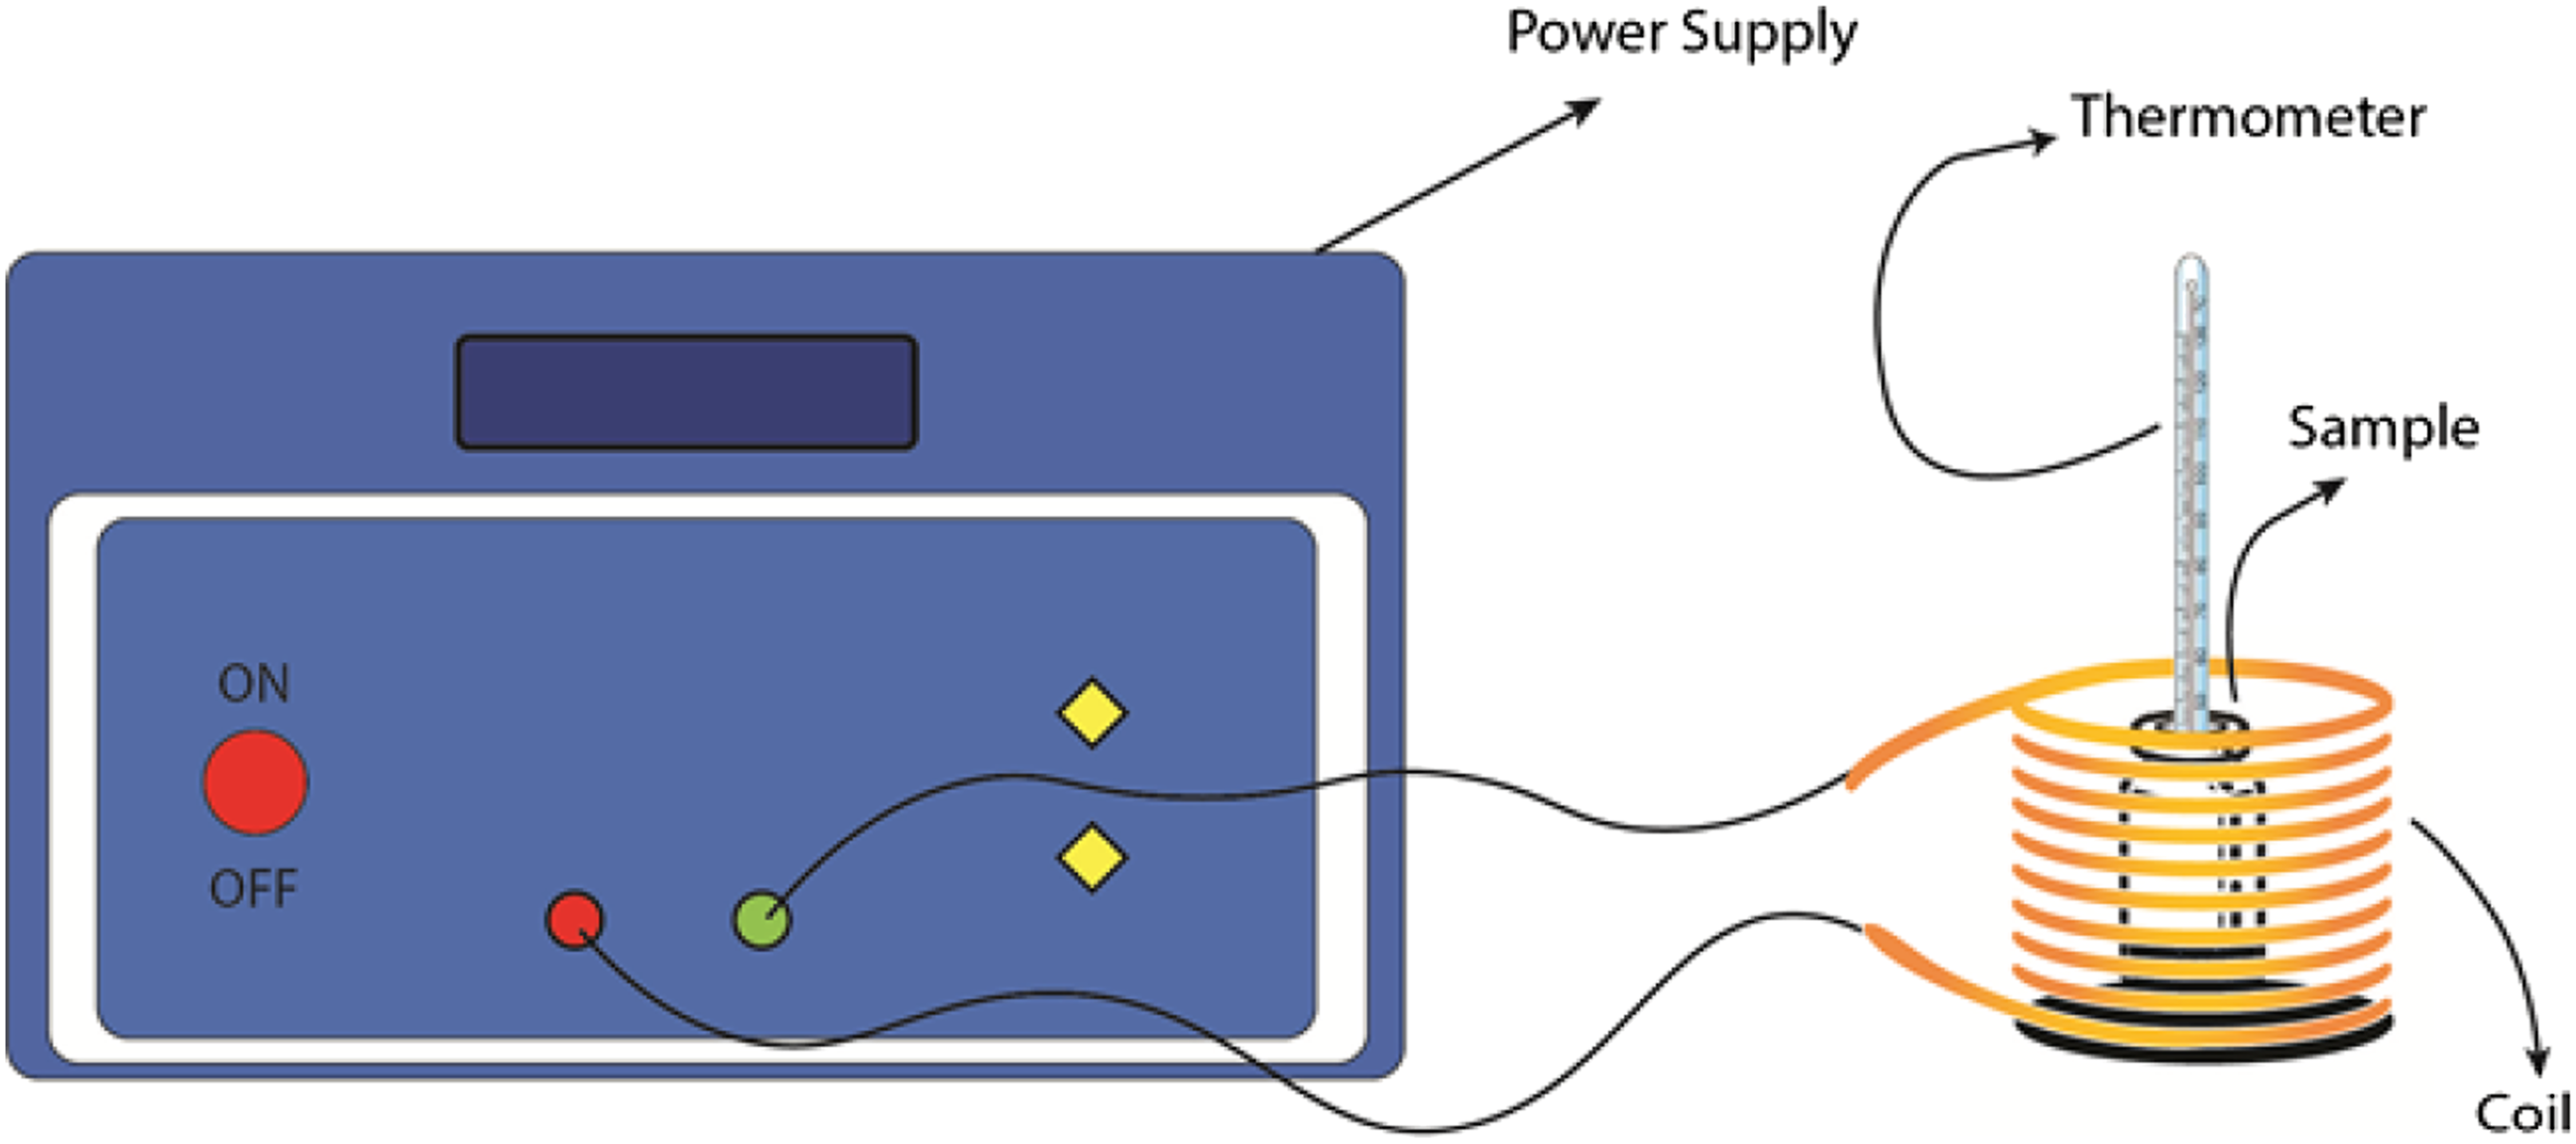
Results and discussion
X-ray diffraction pattern
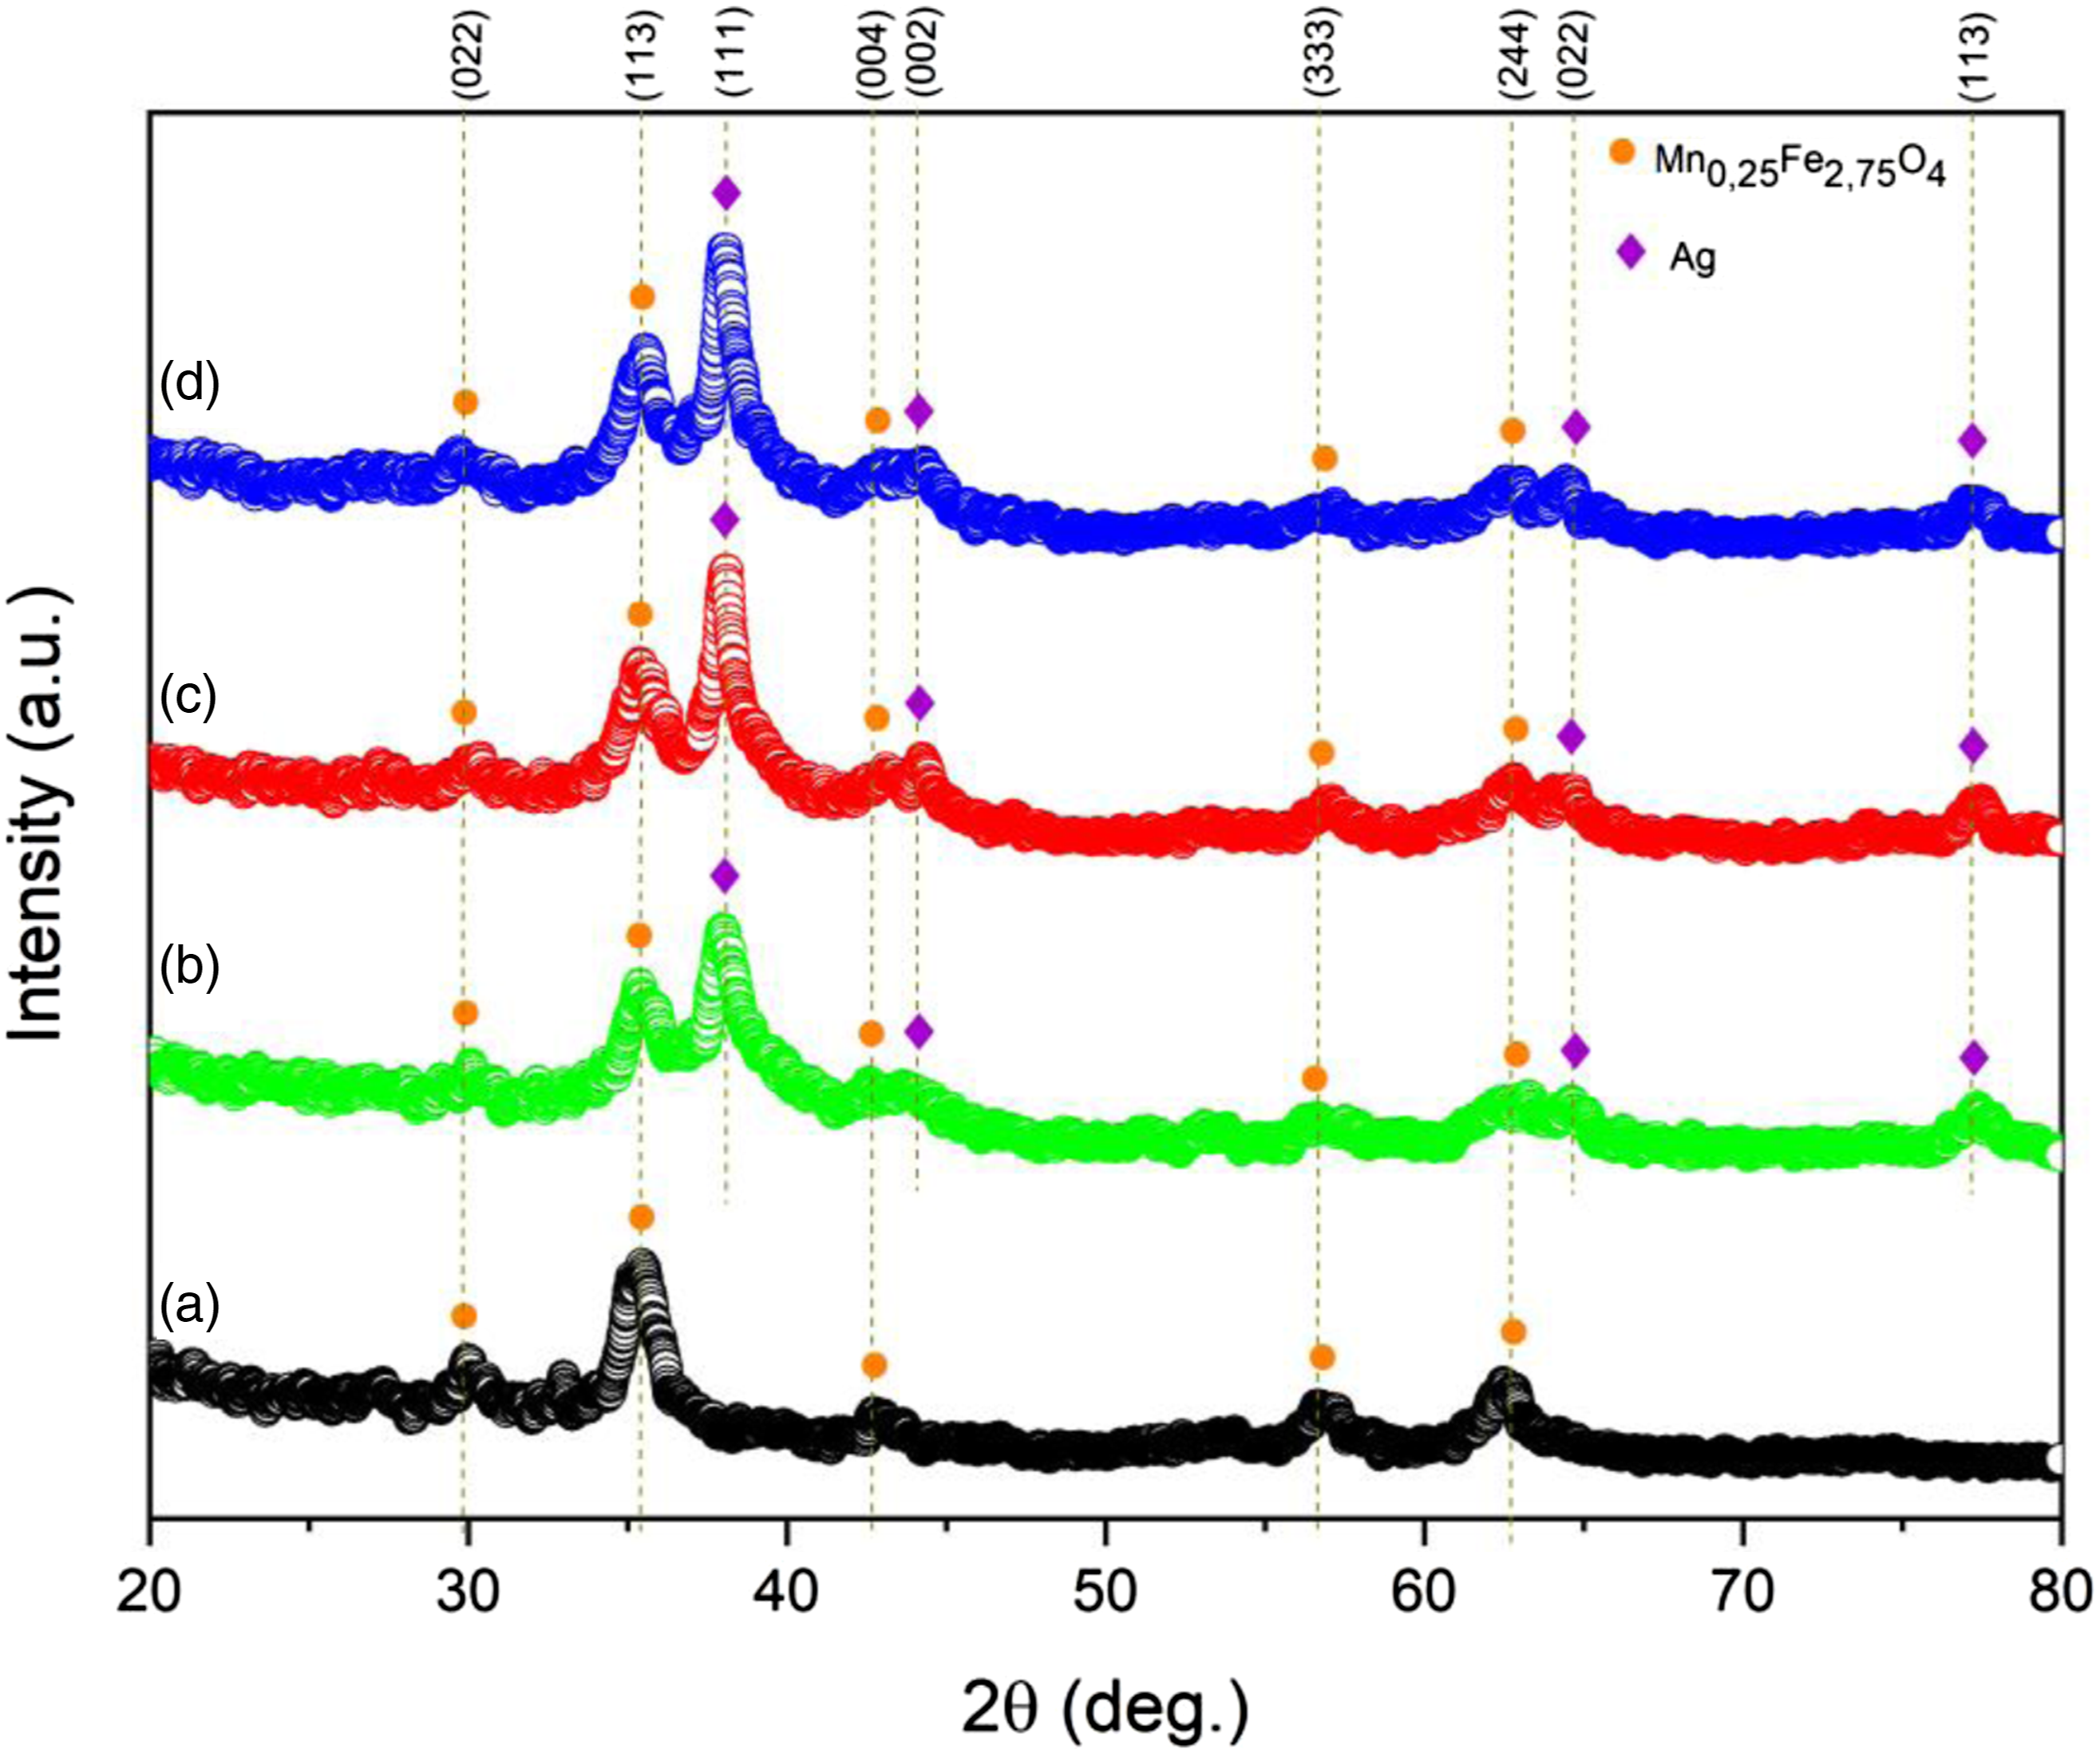
Figure 3 shows an X-ray diffraction pattern of (a) MAg0, (b) MAg1, (c) MAg2, and (d) MAg3 samples. Based on the XRD profile data, the peak of diffraction is dominated by the magnetite (Fe3O4) and the Ag phase. This diffraction pattern corresponds to research reports that have been done by previous researchers,31,32 The magnetite phase is indicated by diffraction peaks in the Bragg planes (220),
33
(311),33,34 (400),
33
(333)
35
and (422).
36
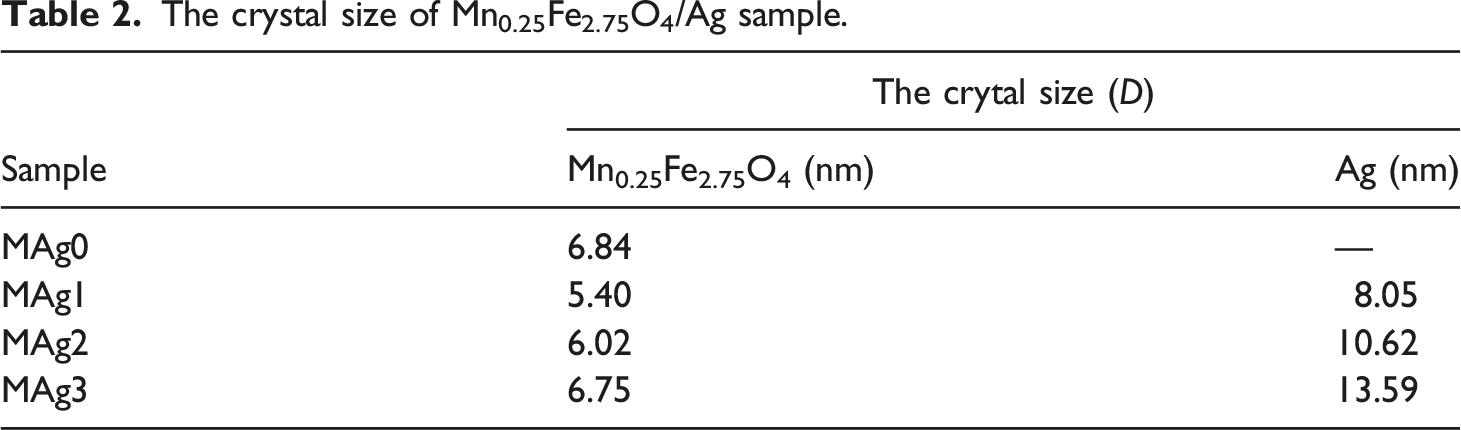
While the Ag phase is shown by the diffraction peak of Bragg planes (111), (002), (022), and (113).37–40 The patterns were refined using the Rietveld method. This refined used model data AMCSD 0000945 and AMCSD 0011135 for Fe3O4 and Ag phases, respectively. The refinement results in the weight percent of each phase of materials. The weight percent of Ag on MAg1, MAg2, and MAg3 is about 16.17, 17.81, and 19.82, respectively. This information shows that the Ag phase on composites was increased with increasing the composition of Ag on composites. The crystal size of the sample can be determined using the Scherrer equation.
41
X-ray diffraction patterns and fitting lines of samples (a) MAg0, (b) MAg1, (c) MAg2, and (d) MAg3 sample. The crystal size of Mn0.25Fe2.75O4/Ag sample.
Transmission electron microscopy image
Figure 4 shows the morphology of the MAg1 and MAg2 particles with a scale bar of 20 nm as well as a graph of the particle size distribution of the two samples. Based on Figure 4(a), the particle size of MAg1 samples for the Mn0.25Fe2.75O4 and Ag phases is 4.87 and 8.46 nm, respectively. Figure 4(b) shows the particle size of MAg2 samples for the Mn0.25Fe2.75O4 and Ag phases is 6.35 and 10.70 nm. While Figure 4(c) shows the particle size of Mag3 samples for the Mn0.25Fe2.75O4 and Ag phases is 6.76 and 13.05 nm, respectively. The results of the TEM data analysis were well confirmed by the XRD data as previously described. TEM image and particle size distribution for material (a) MAg1, (b) MAg2 and (c) MAg3.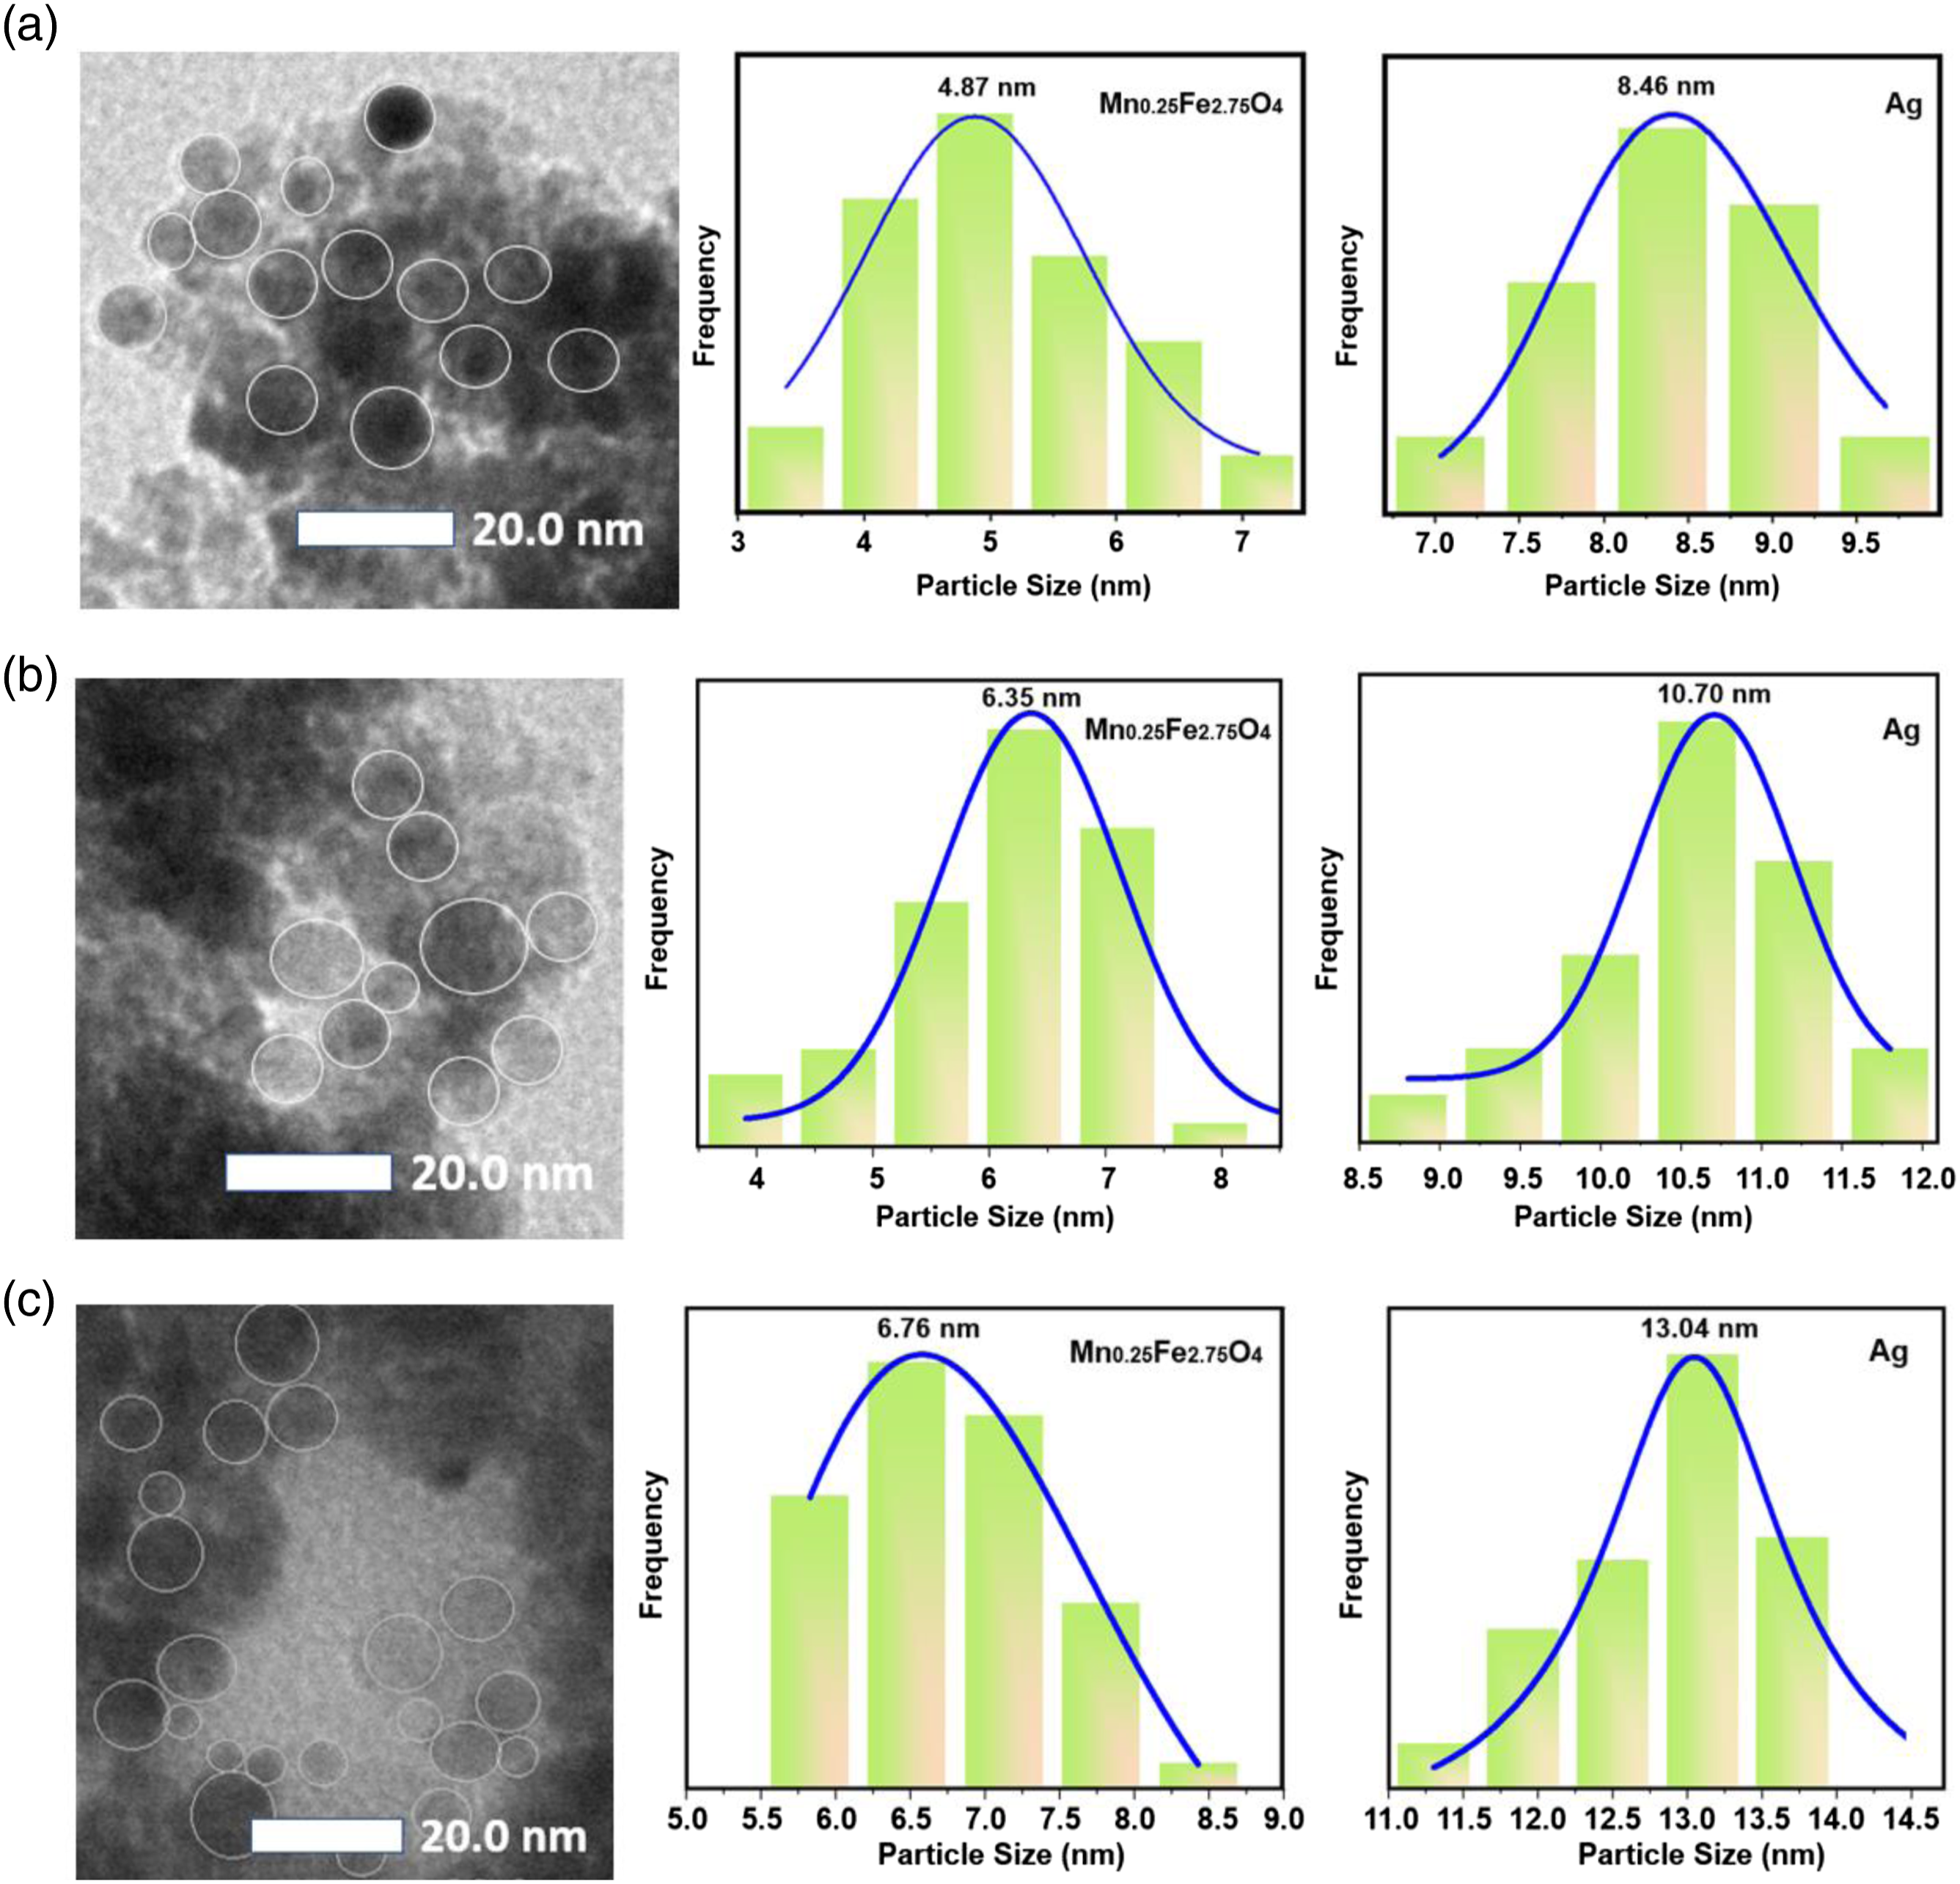
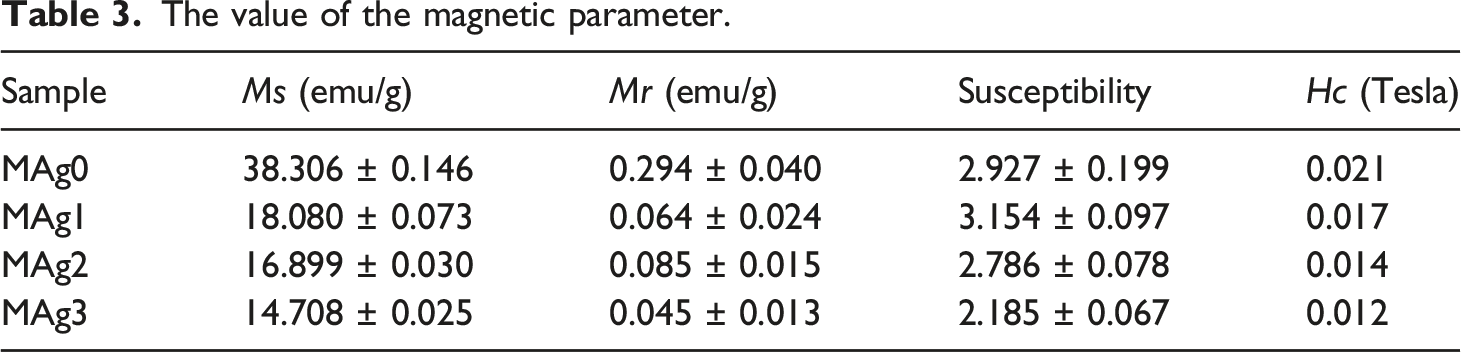
Hysterical curve
Figure 5 portrays a comparison of the hysteresis curve of the MAg0, MAg1, MAg2 and MAg3 samples. Based on Vibrating Sample Magnetometer (VSM) data analysis, it appears that there is a decrease in the value of saturation magnetization with increasing mass composition Ag. That is consistent with research conducted by Pachla et al.,
42
Shari et al.,
43
Zhan et al.,
44
and several other researchers. Figures 5(a) show the hysterical curves of each sample with a blue line, which is the result of fitting using Langevin modeling. Figures 5(b)–(d) and (f) show the width of hysteresis curve of MAg0, MAg1, MAg2, and MAg3 samples. Those figures showed that the value of coercivity (Hc) is close to zero, therefore it can conclude that all of the samples have superparamagnetic properties.45,46 This property is urgently needed for hyperthermia therapy materials because the material which having superparamagnetic properties easily control using an external magnetic field. Magnetic parameters can be well analyzed from the fitting results using the Langevin model. The results of magnetic parameter as presented in Table 3. (a) Comparison of hysteresis curves for MAg0, MAg1, MAg2, and MAg3 samples and it’s Langevin fitting lines and zoom out of hysteresis curve for (b) MAg0, (c) MAg1, (d) MAg2, and (e) MAg3. The value of the magnetic parameter.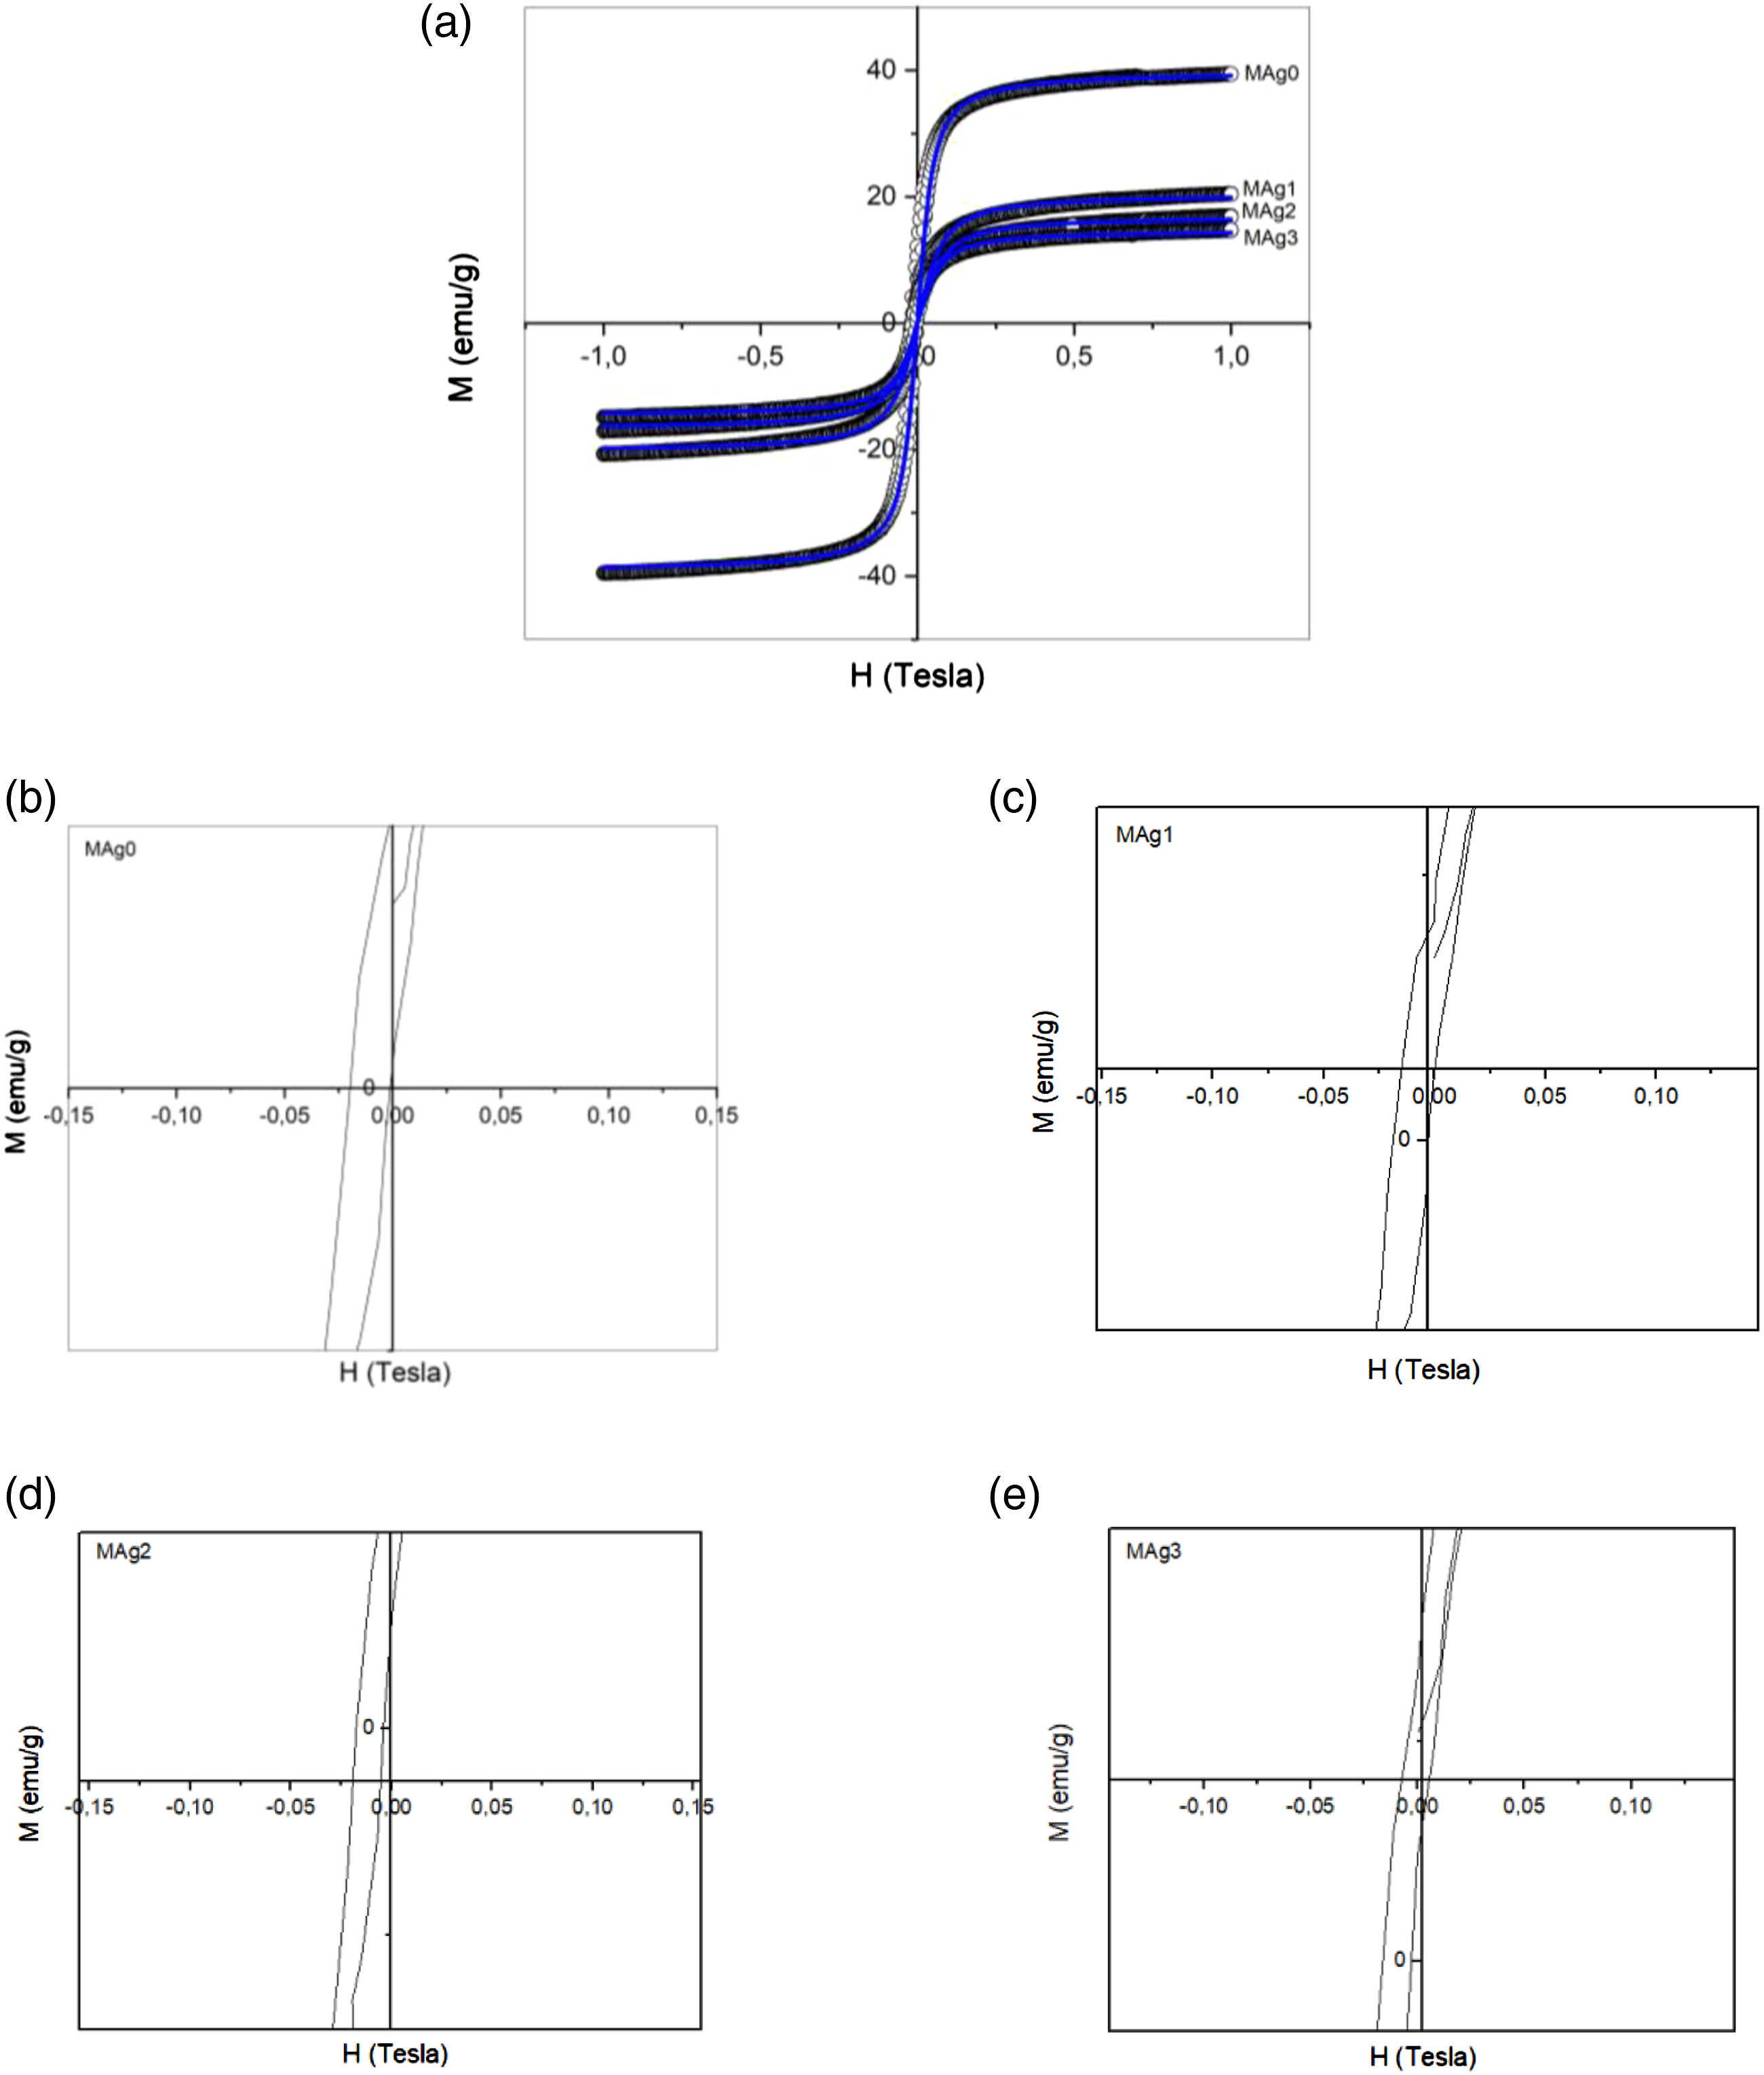
Antimicrobial activity
Figure 6 indicates the result of the antimicrobial activity test on all samples. The image during antimicrobial activity test as presented in Figure 6(b)–(e) show images of test results by using Candida Albicans, E. Coli, S. Aureus, and Bacillus Subtilis via the diffusion method.10,11 The results of the inhibition zone analysis in all samples showed that there was no significant microbial growth around the bacterial test point. The results of the inhibition zone analysis in all samples showed that there was no significant microbial growth around the bacterial test point. The antimicrobial activity revealed the inhibition effectiveness in all samples with different inhibition zone widths as presented in Figure 7(a). Based on data analysis of the antimicrobial activity for the MAg1 sample, the width of the inhibition zone was obtained in the test using the fungus Candida albicans, E. Coli, S. Aureus, and Bacillus Subtilis are 5.67, 5.00, 9.00, and 6.33 mm respectively. Meanwhile, MAg2 samples has zone widths for testing using the fungus Candida albicans, E. Coli, S. Aureus, and Bacillus subtilis bacteria are 5.67, 5.67, 6.67, and 6.67 mm, respectively. And for MAg3 samples has zone widths for testing using the fungus Candida albicans, E. Coli, S. Aureus, and Bacillus subtilis bacteria are 5.67, 6.33, 7.67, and 6.00 mm, respectively. The results of this inhibition are relatively higher than the results of previous report that using samples of Ag@Fe3O4@cellulose nanocomposites with a widening of the inhibition zone of about 2.8 and 2.4 mm.
19
The inhibition zone results in this paper also higher compared to report by Arias et al., that explained the inhibition zone of IONPs-Ag, IONPs-Ag-ceftriaxone and IONPs-Ag-cefotaxime nanosystems for Bacillus pumilus is under 2 mm.
47
Whereas, Mirahmadi-zare et al. reported the value of inhibition zone of Fe3O4 of about 6.4 mm by using E. Coli, Salmonella typhimurium, S. Aureus, and Bacillus cereus bacterial.
48
The Mirahmadi’s result is has a similar result to this work but slightly lower due to the absence of additional concentrations of Ag and doping of Mn in the Fe3O4 sample. Thus, the addition of magnetite composite materials Mn0.25Fe2.75O4 and Ag was quite effective for antimicrobials in the samples. Additionally, Ag composition also increases the positive effect on antimicrobial areas and the antibacterial properties. For instance, S. aureus bacterial can be improved the effect of inhibition zone by increasing of Ag concentration.
49
(a) Histogram of inhibitory zone width and test images using microbes, (b) Candida Albicans-CA, (c) E. Coli-EC, (d) S. Aureus-SA, (e) Bacillus Subtilis-SUB. Illustration of bacterial destruction by Mn0.25Fe2.75O4/Ag.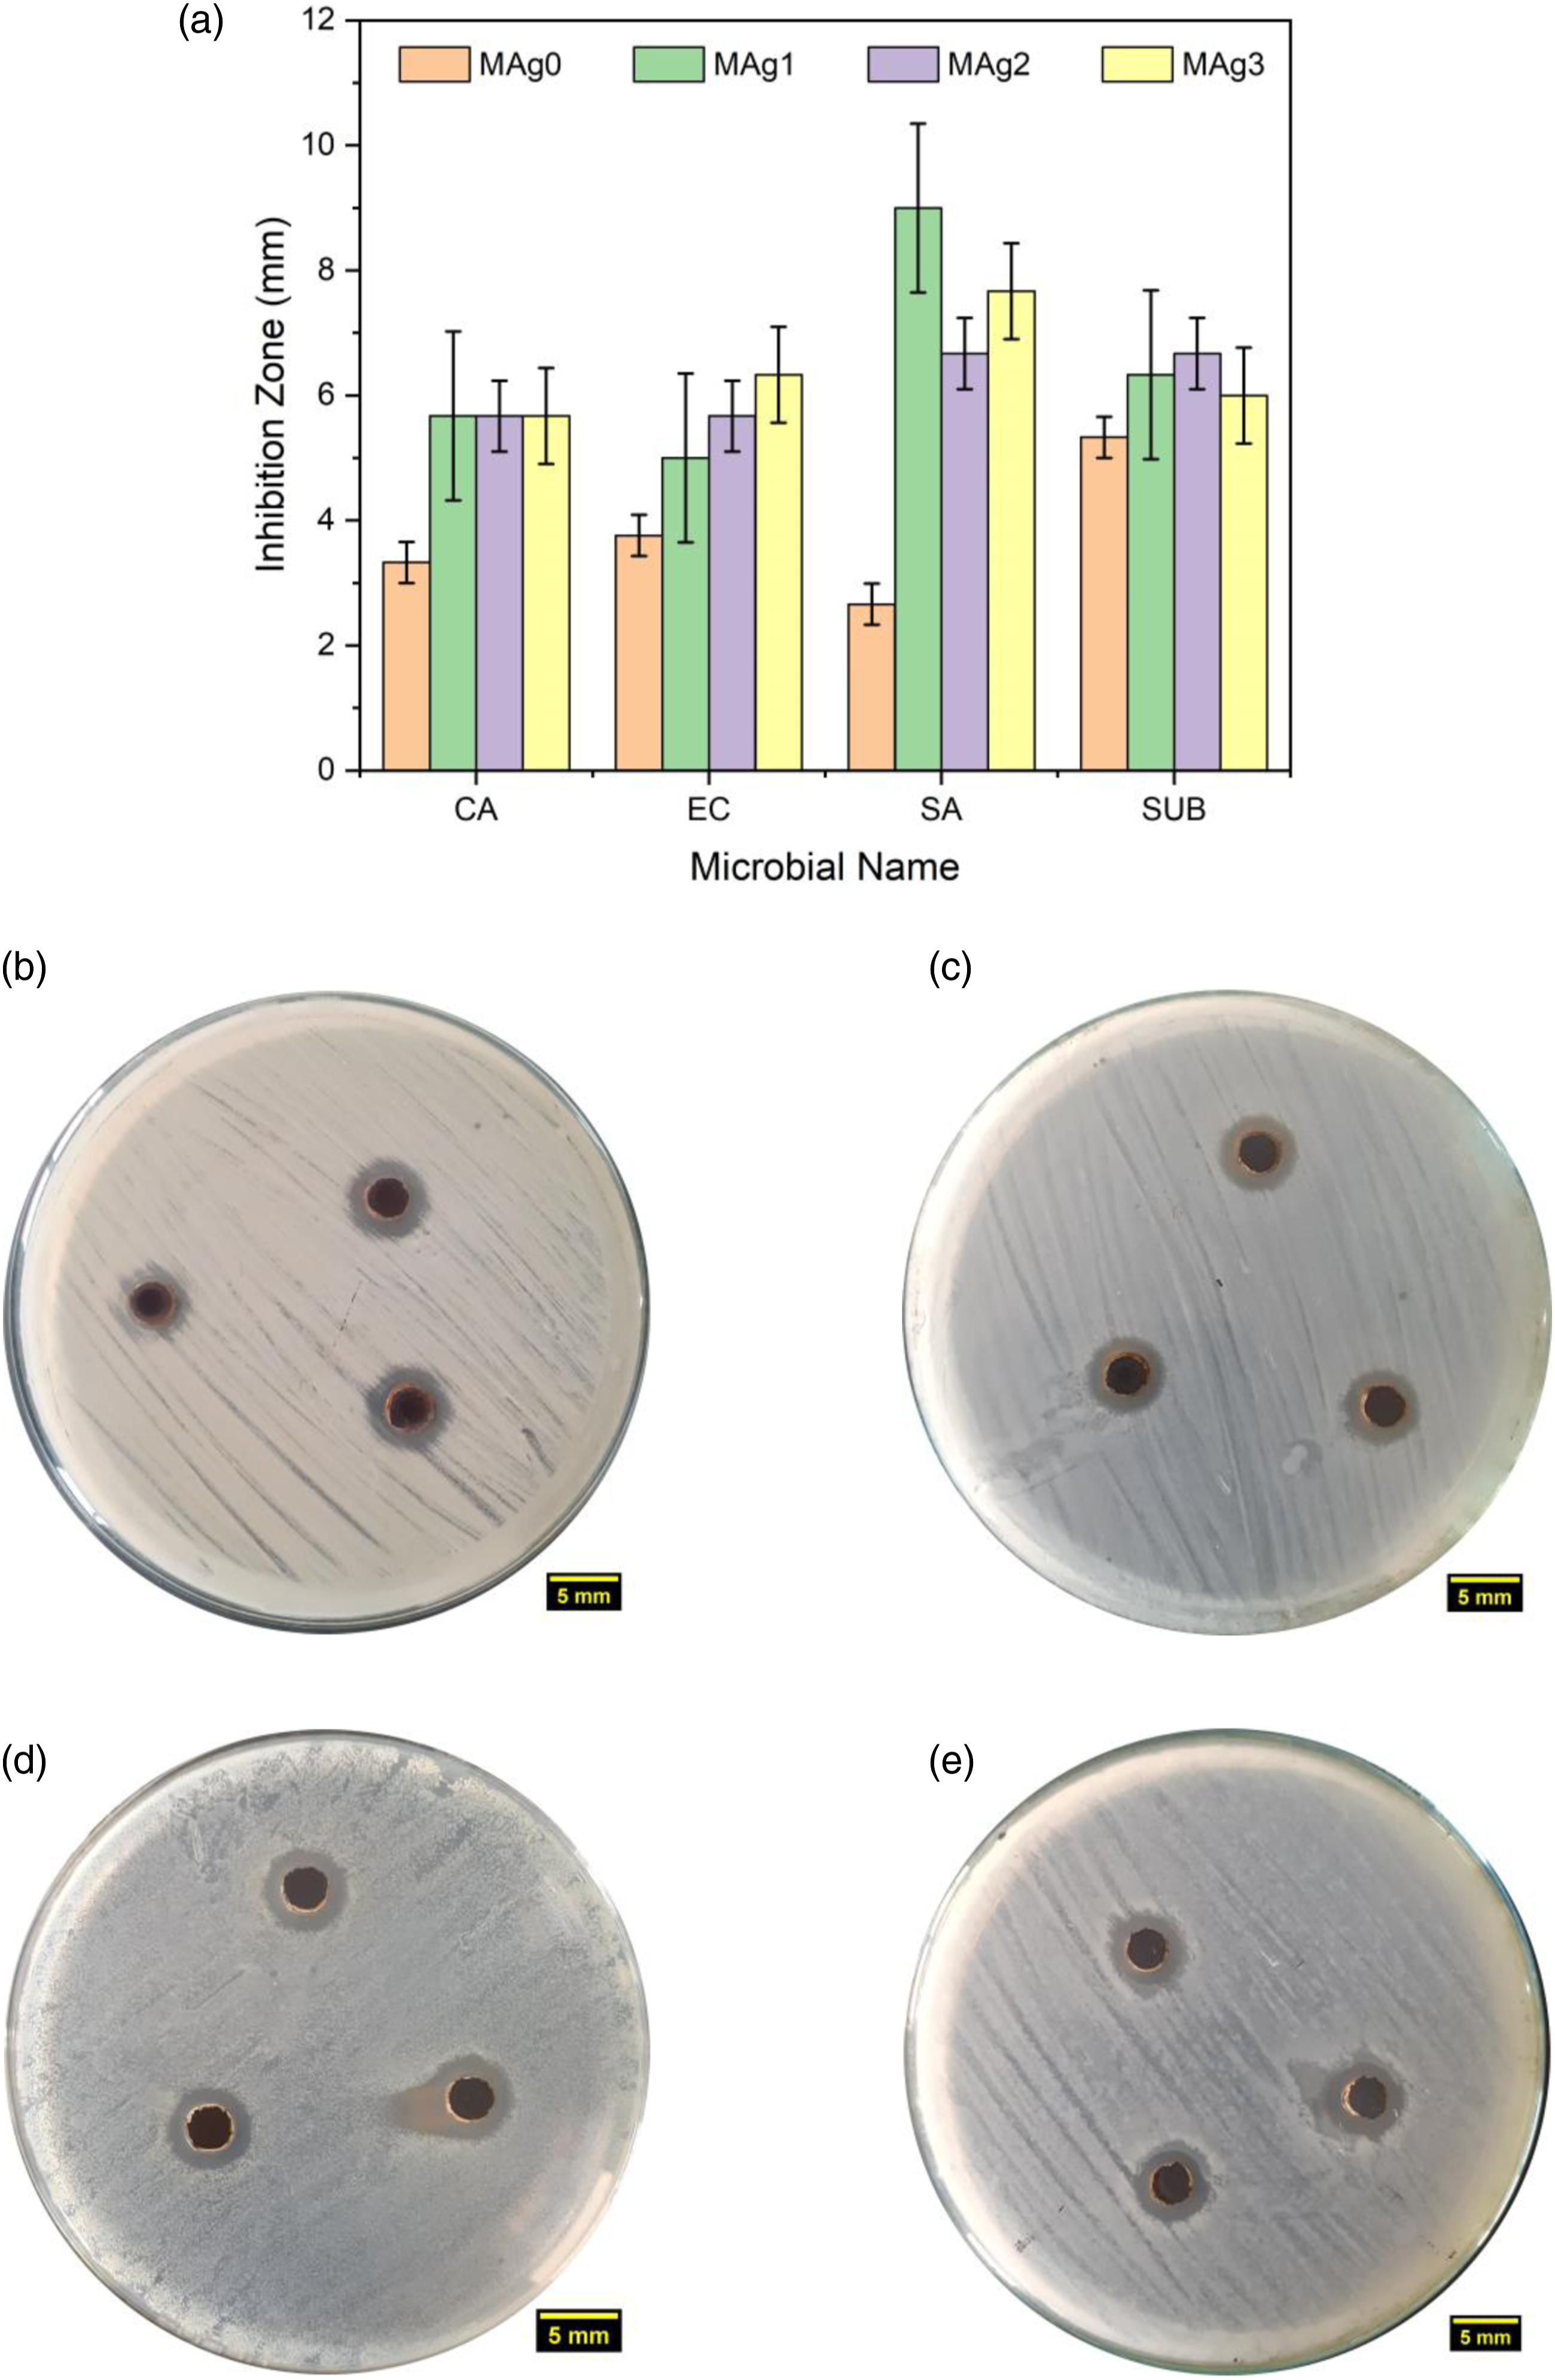
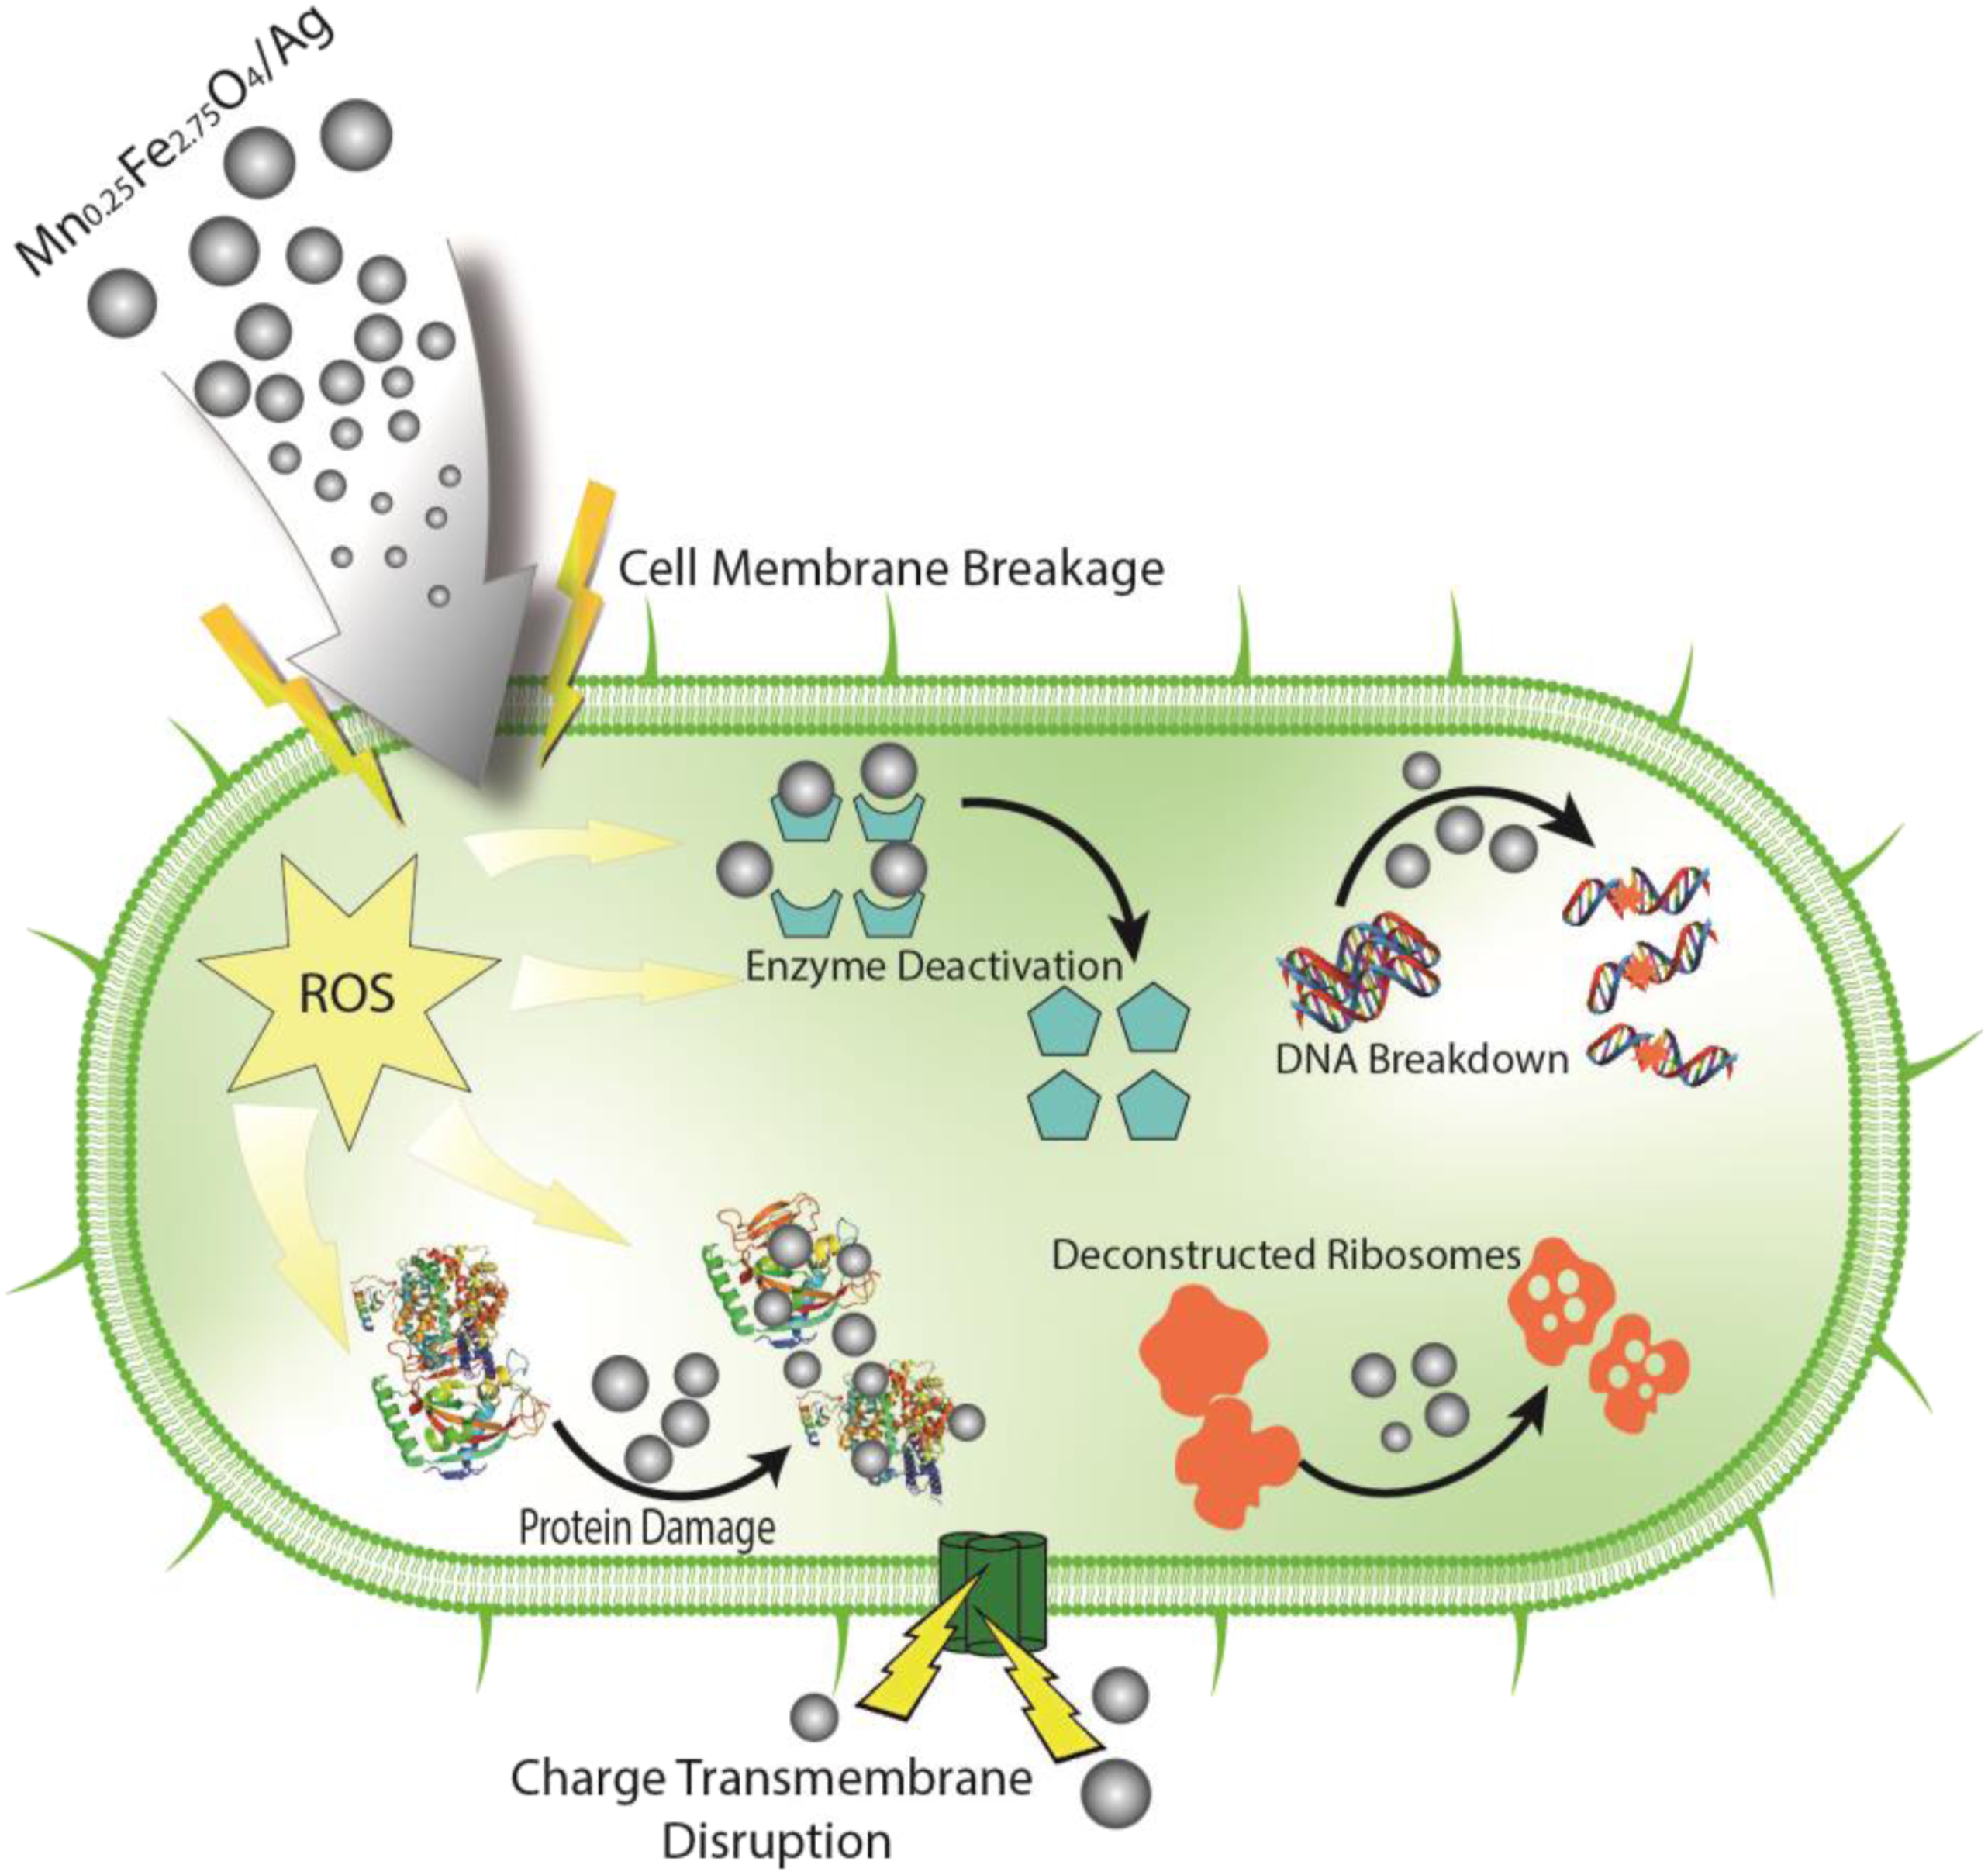
The mechanism of destruction of bacteria and fungi through Mn0.25Fe2.75O4/Ag nanoparticles media can be illustrated in Figures 7 and 8. Theoretically, the membrane of the microbe has a polymer that has an electronegative chemical. This membrane is the site of metal (Mn0.25Fe2.75O4/Ag) cation (positive ions) attraction. While the negative ions are carried on the surface of the microbe at biological pH. It’s caused by the protein which contains the carboxylic acid group. This difference of charge caused electrostatic field between the Mn0.25Fe2.75O4/Ag nanoparticles and microbial cell walls. This electrostatic field made the Mn0.25Fe2.75O4/Ag nanoparticles attached to the microbial cell walls and by the increasing the Mn0.25Fe2.75O4/Ag nanoparticles amount can break the microbial cell walls.
11
The Mn0.25Fe2.75O4/Ag nanoparticles then released reactive oxygen species (ROS) and attack the DNA and nucleus of pathogenic microbial.
50
Once the Mn0.25Fe2.75O4/Ag nanoparticles enter into the microbe, they generated of organic hydroperoxides, hydroxyl radicals (OH•), superoxide anion (O2−), and hydrogen peroxide (H2O2). That is called ROS. The ROS are pernicious to the microbe, causing damage to almost all of organic biomolecules. The damage was eventually causing microbial death.
51
Illustration of fungal destruction by Mn0.25Fe2.75O4/Ag.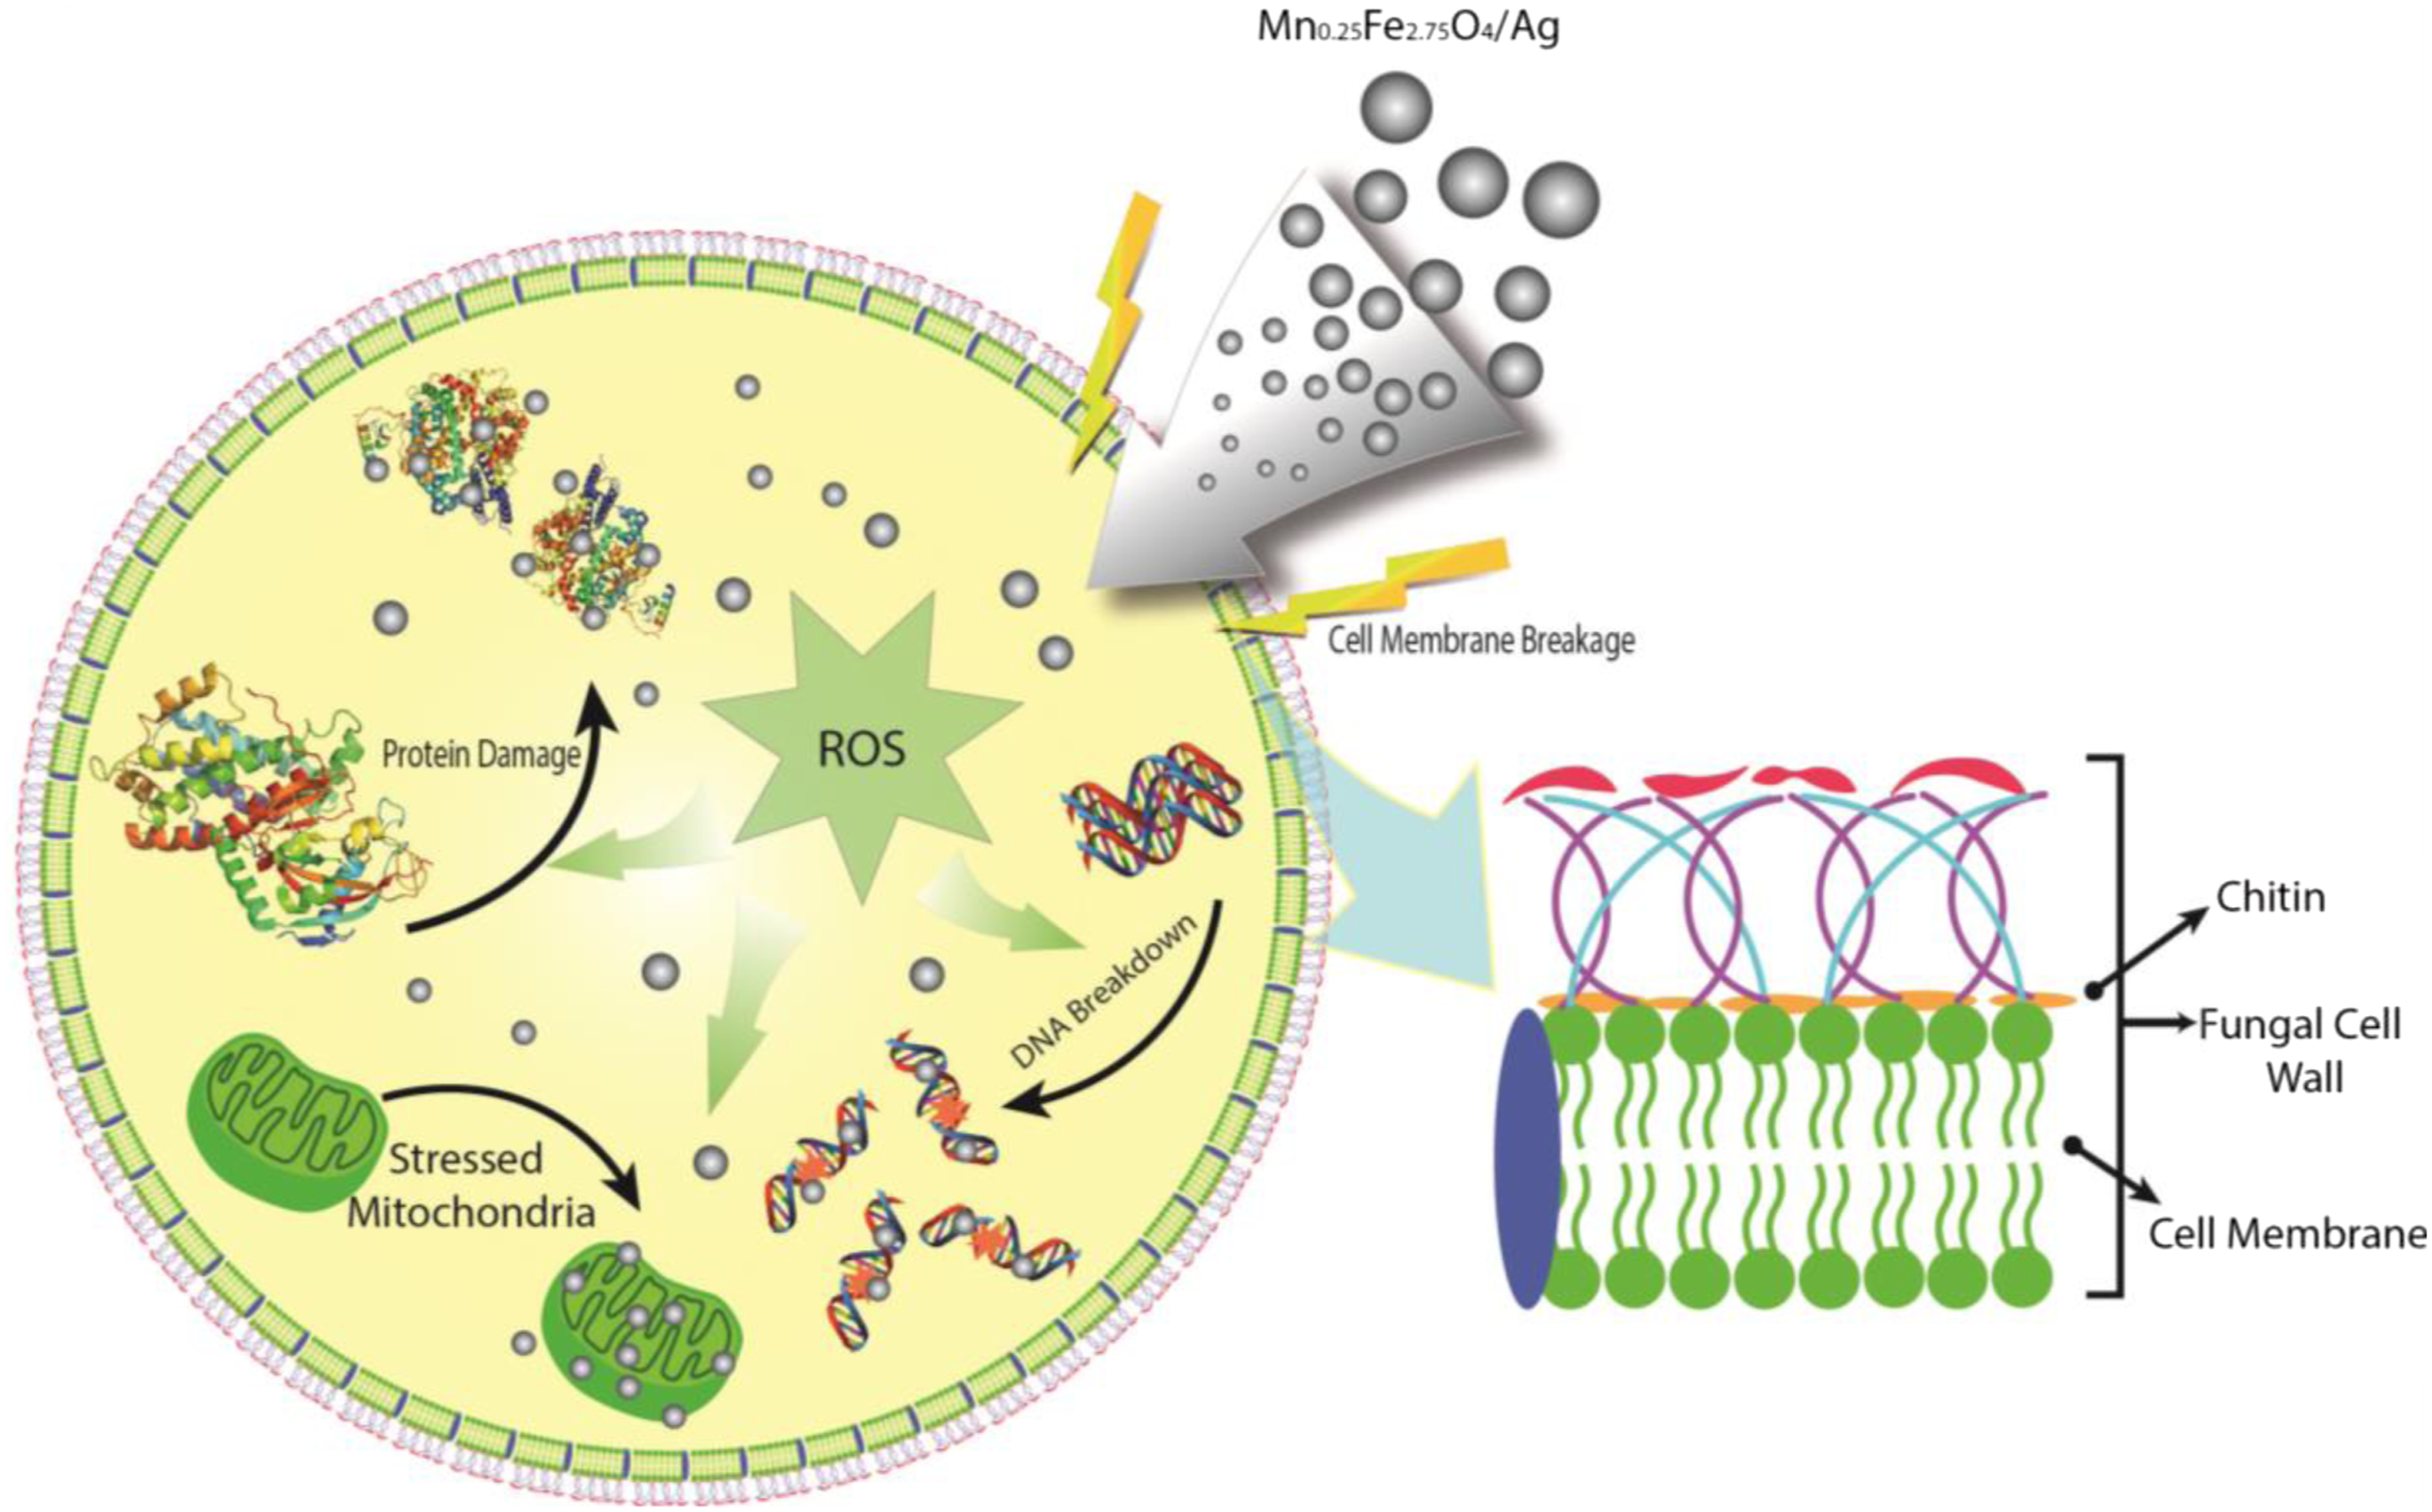
The XRD and TEM characterization showed that the particle size increase by the addition of silver mass. Moreover, the increase of this particle size affects the antimicrobial properties as well. Dong et al., reported that smaller the particle size of Ag nanoparticles used in the samples, the better the bactericidal effect for V. natriegens bactery. Dong et al., using the Ag nanoparticles with the size of 10, 30, 60, and 90 nm (with ± 5 nm deviation) and got the best result of minimum inhibitory concentration (MIC) and minimum bactericidal concentration (MBC) for the Ag nanoparticles size of 10 ± 5 nm. 52 This particle size has similar value with the particle size gained in this research which is around 10 nm, so it gives better antimicrobial properties to the sample compared to the bigger particle size. Since the antimicrobial activity occurs as a result of the electrostatic interaction between the microbial cell wall and the antimicrobial agent, it causes damage to the cell wall. This interaction depends on the surface area of the antimicrobial agent. The smaller the particle size, the larger the area, so that the antimicrobial agent can easily enter the microbial cell. Similar result obtained by Shaoheng Tang and Jie Zheng which state that particle size and shape of Ag nanoparticles should be tuned into a relatively small size (if possible less than 10 nm) and has the plate-like morphology to increase the ability to interact with bacterial cells and give high release rate of Ag+ ions. 53 The TEM image also gives the information of spherical morphology from the sample. This morphology makes the sample can bind to membrane surface and encourage damages to the membrane then kill the bacteria or fungi. 54 This result was justified by the earlier research conducted by Helmlinger et al., that successfully synthesized Ag nanoparticles with different shape and size (nanospheres, nanoplatelets, nanocubes, and nanorods). The antibacterial activity result against S. Aureus showed that nanoplatelets samples exhibited the highest toxicity, then followed by nanospheres, nanorods, and finally nanocubes form of the sample. 55 Therefore, the Mn0.25Fe2.75O4/Ag material has the potential to be an agent for antimicrobials activity because the size of the sample which relative small (around 10 nm) and has a spherical morphology.
SAR characterization
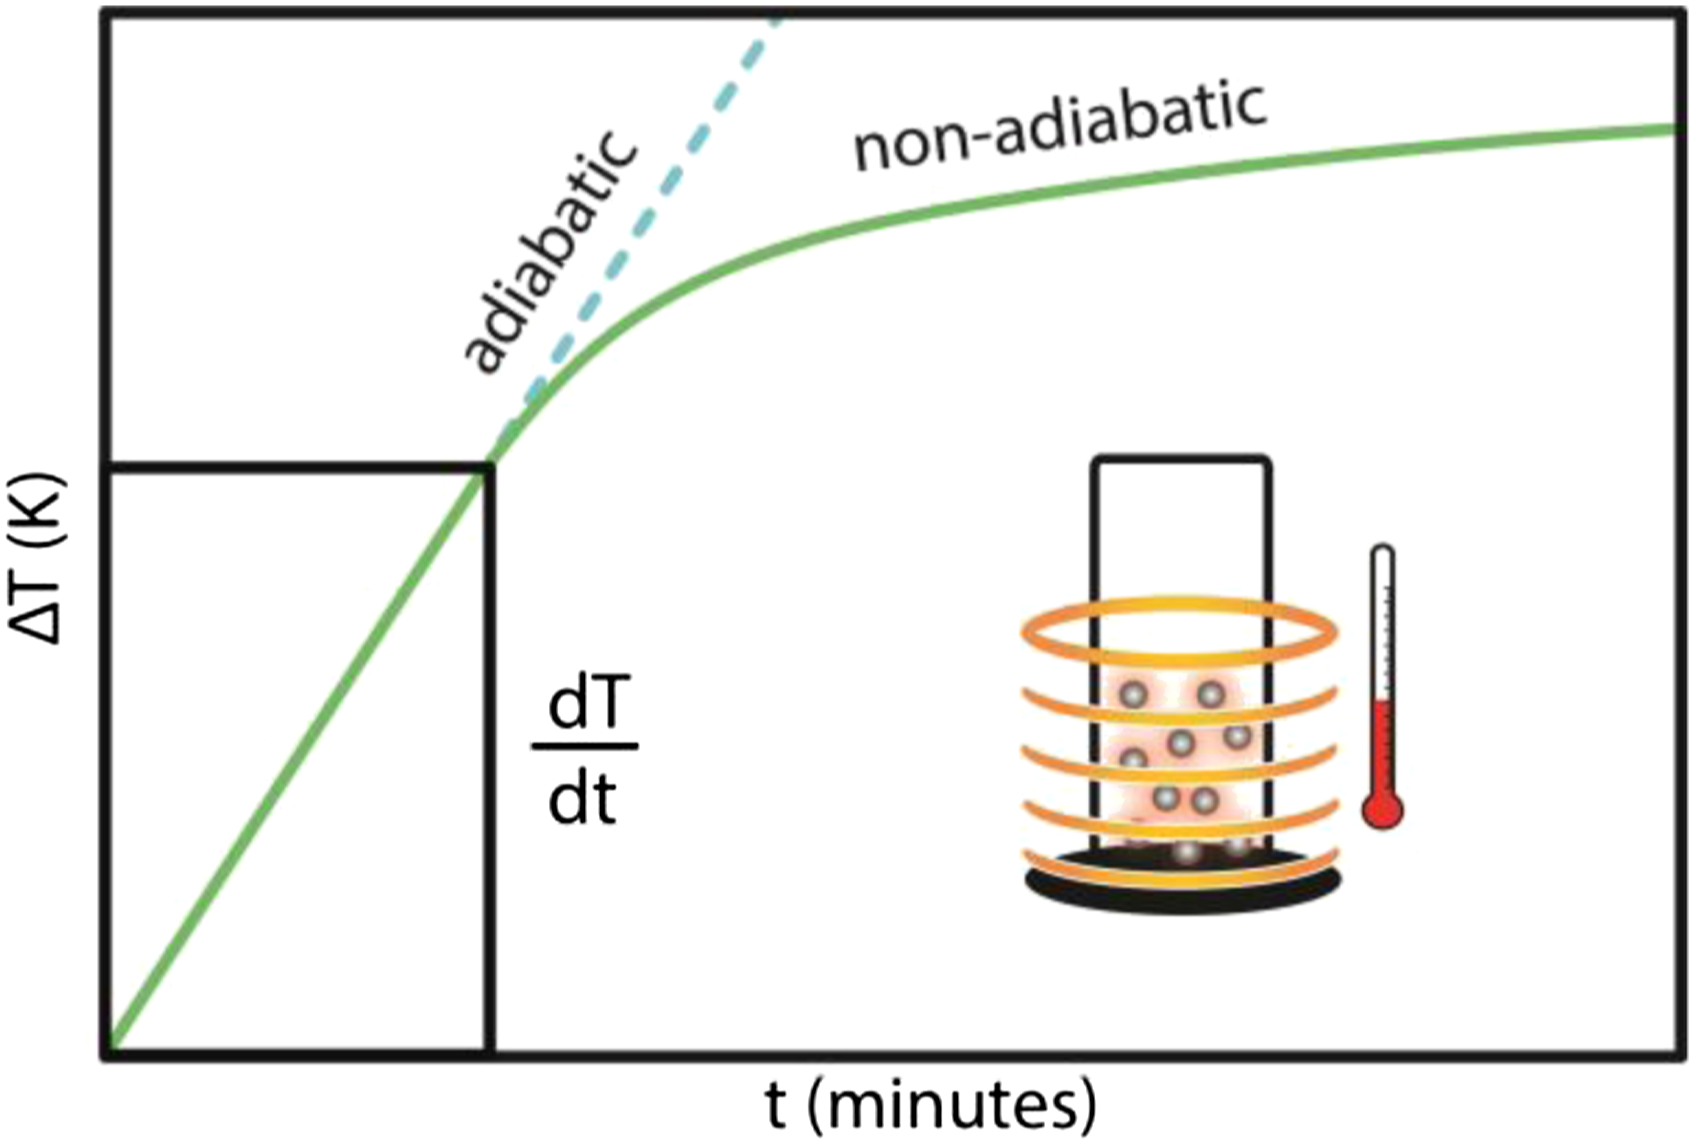
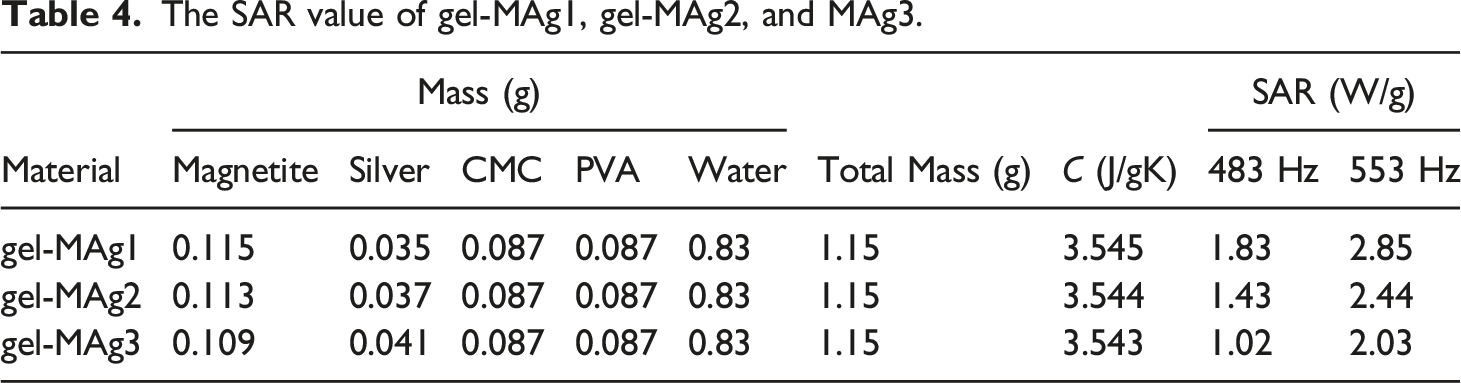
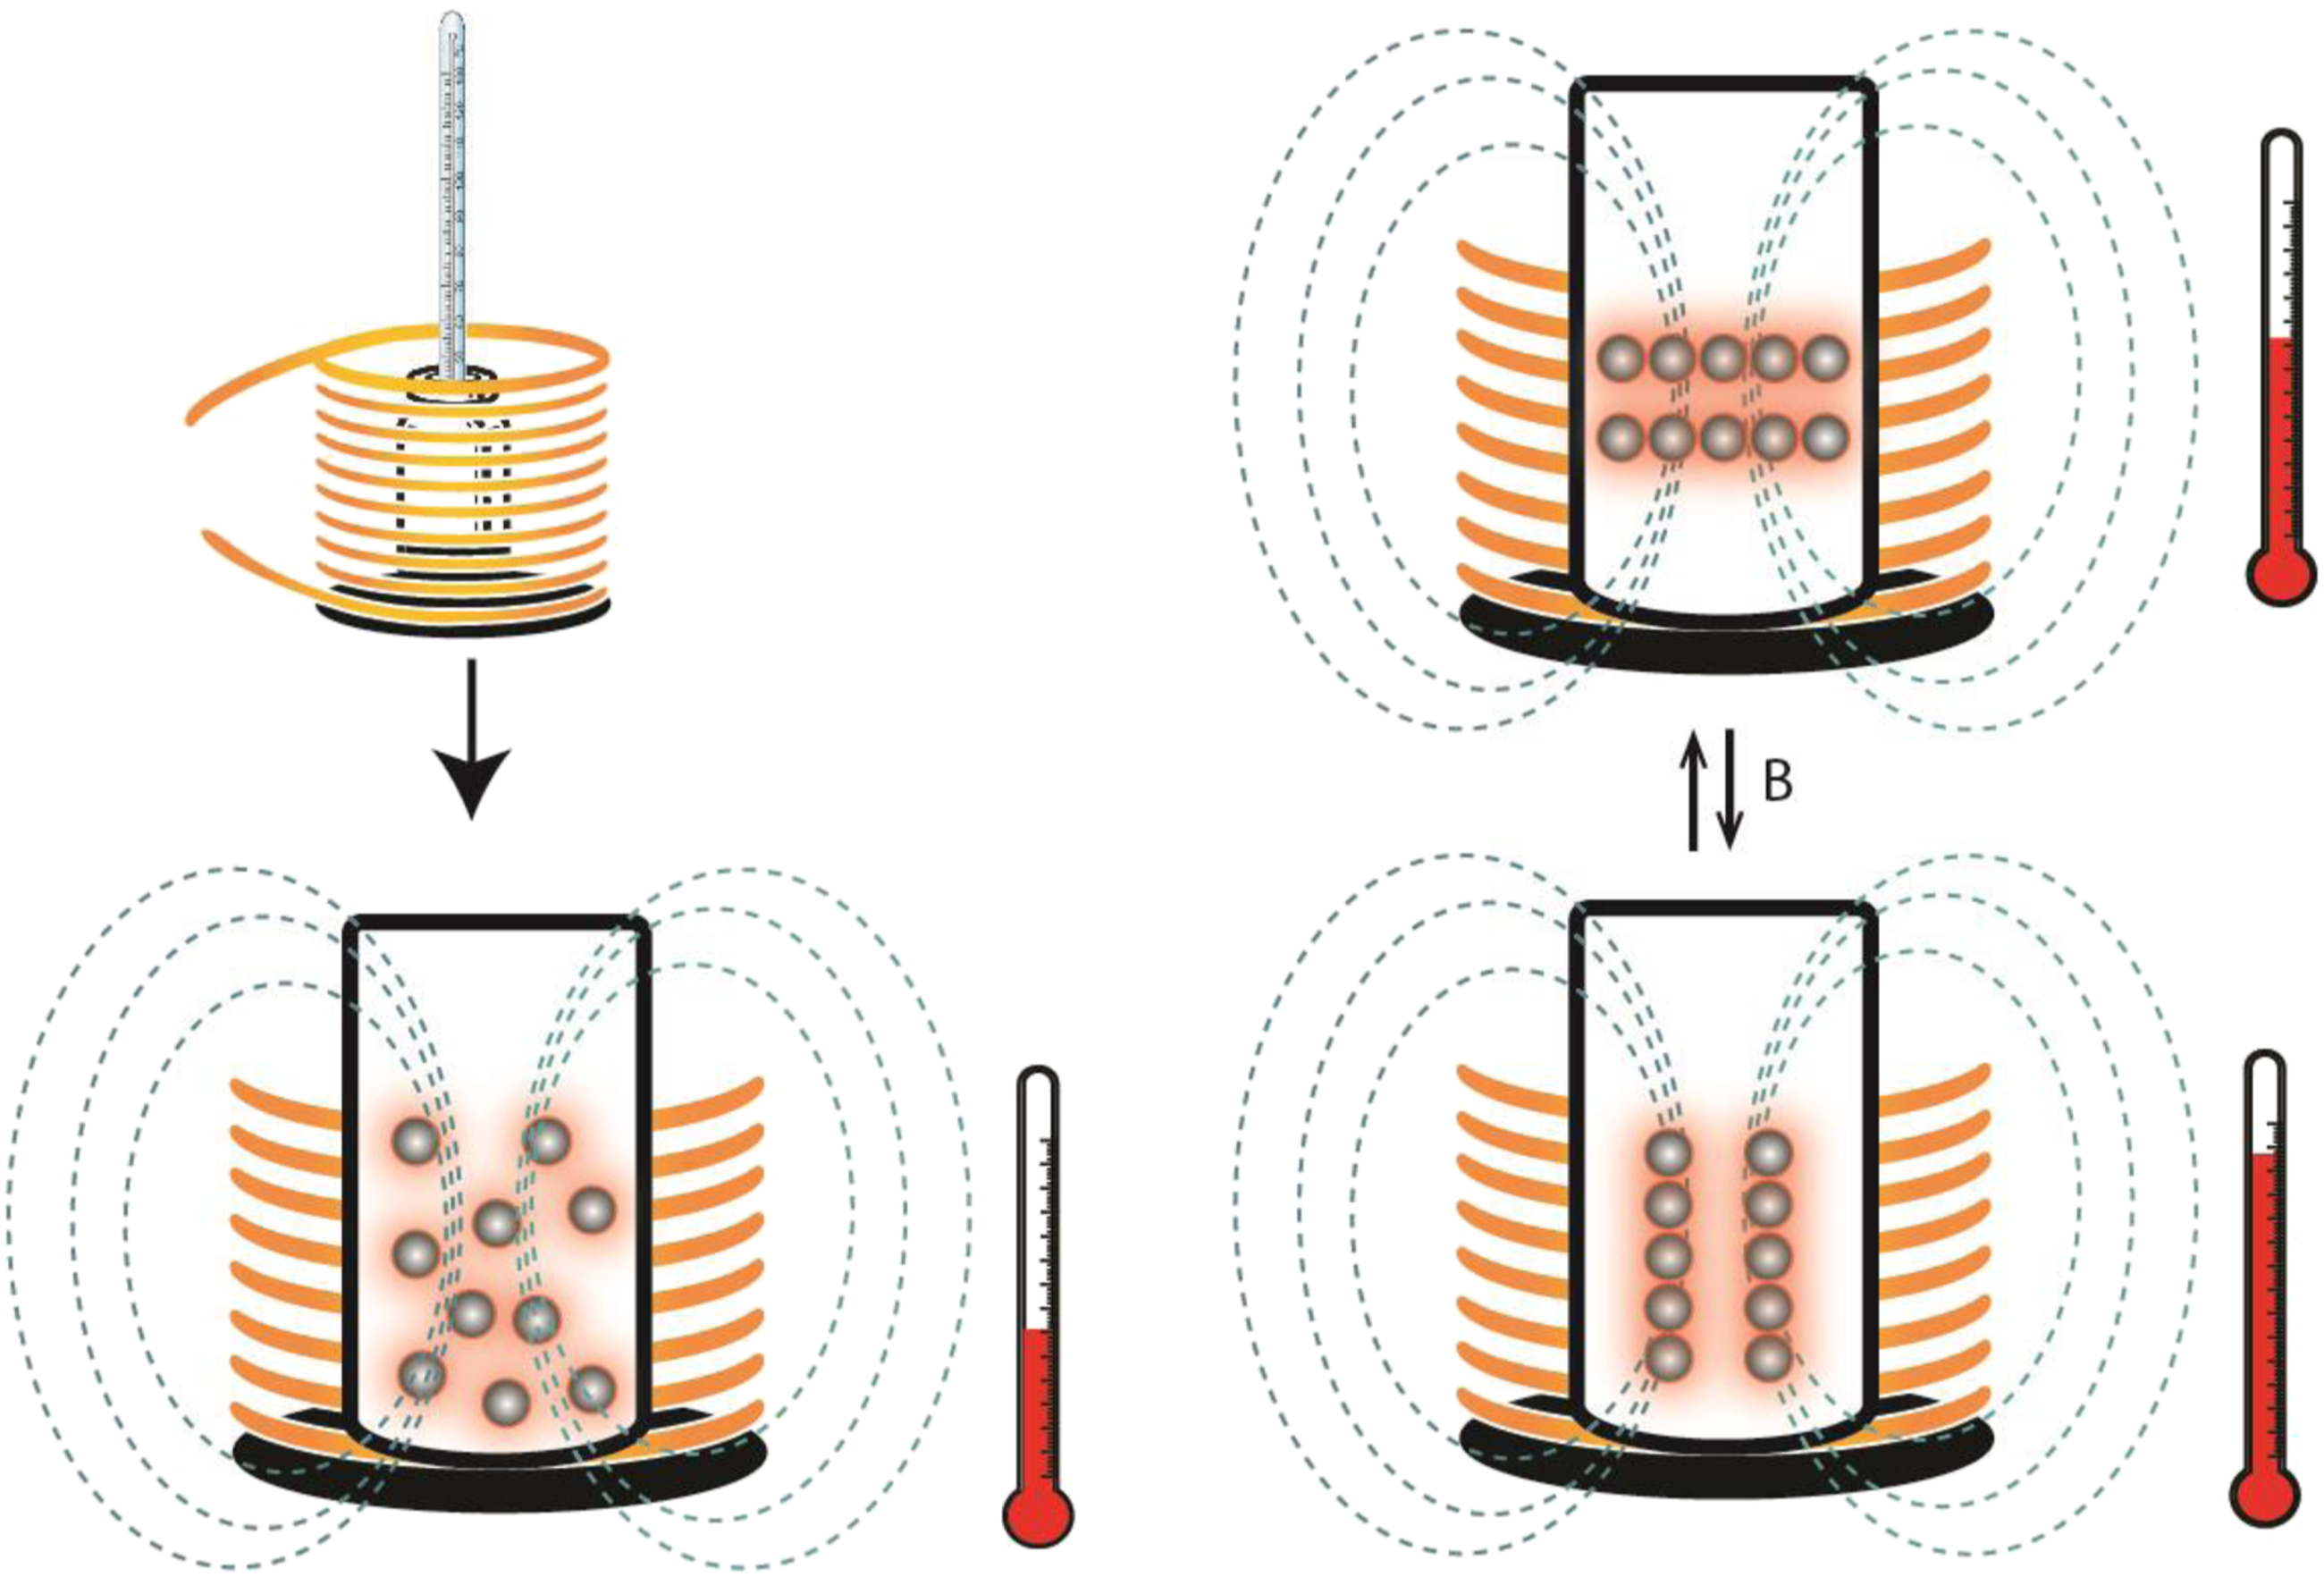
Figure 9 shows a test result using magnetothermal to characterize the SAR. The amount of SAR can affect the potential application of the material in hyperthermia therapy. The higher the SAR value of materials, so more potential those materials have in hyperthermia therapy. SAR values are determined using equation (2)56–58 (a) Comparison of the results of the magnetothermal test of gel-MAg1, gel-MAg2, and MAg3 at 483 Hz frequency, (b) comparison of magnetothermal test results of gel-MAg1, gel-MAg2, and MAg3 samples at 553 Hz frequency. Adiabatic and non-adiabatic processes due to hyperthermia heating. Schematic of the magnetic relaxation mechanisms (Néel-Brown relaxation). The SAR value of gel-MAg1, gel-MAg2, and MAg3.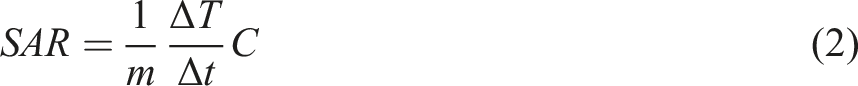

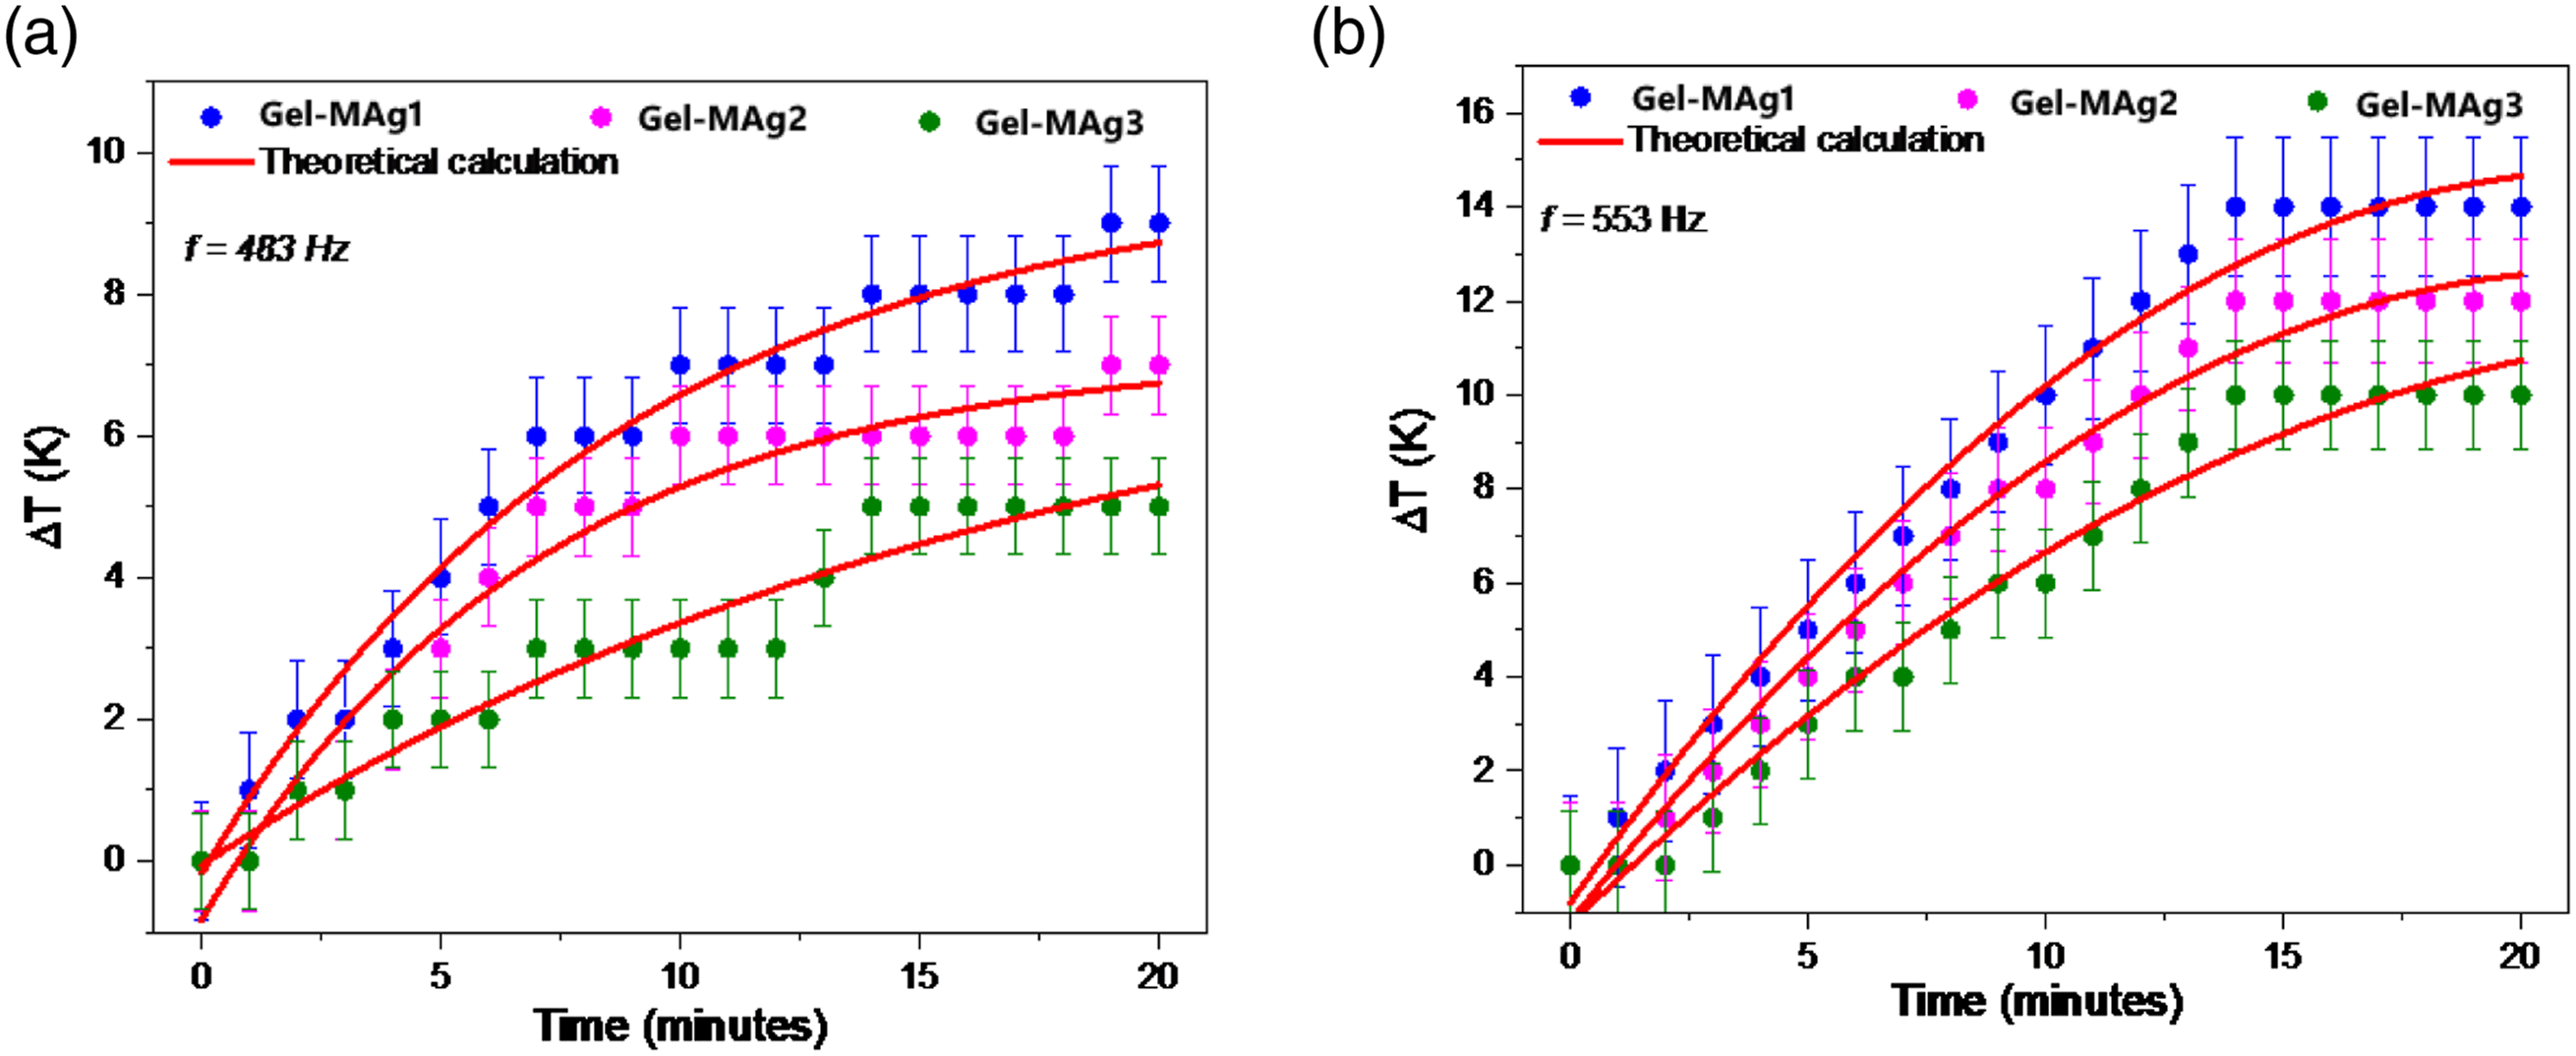
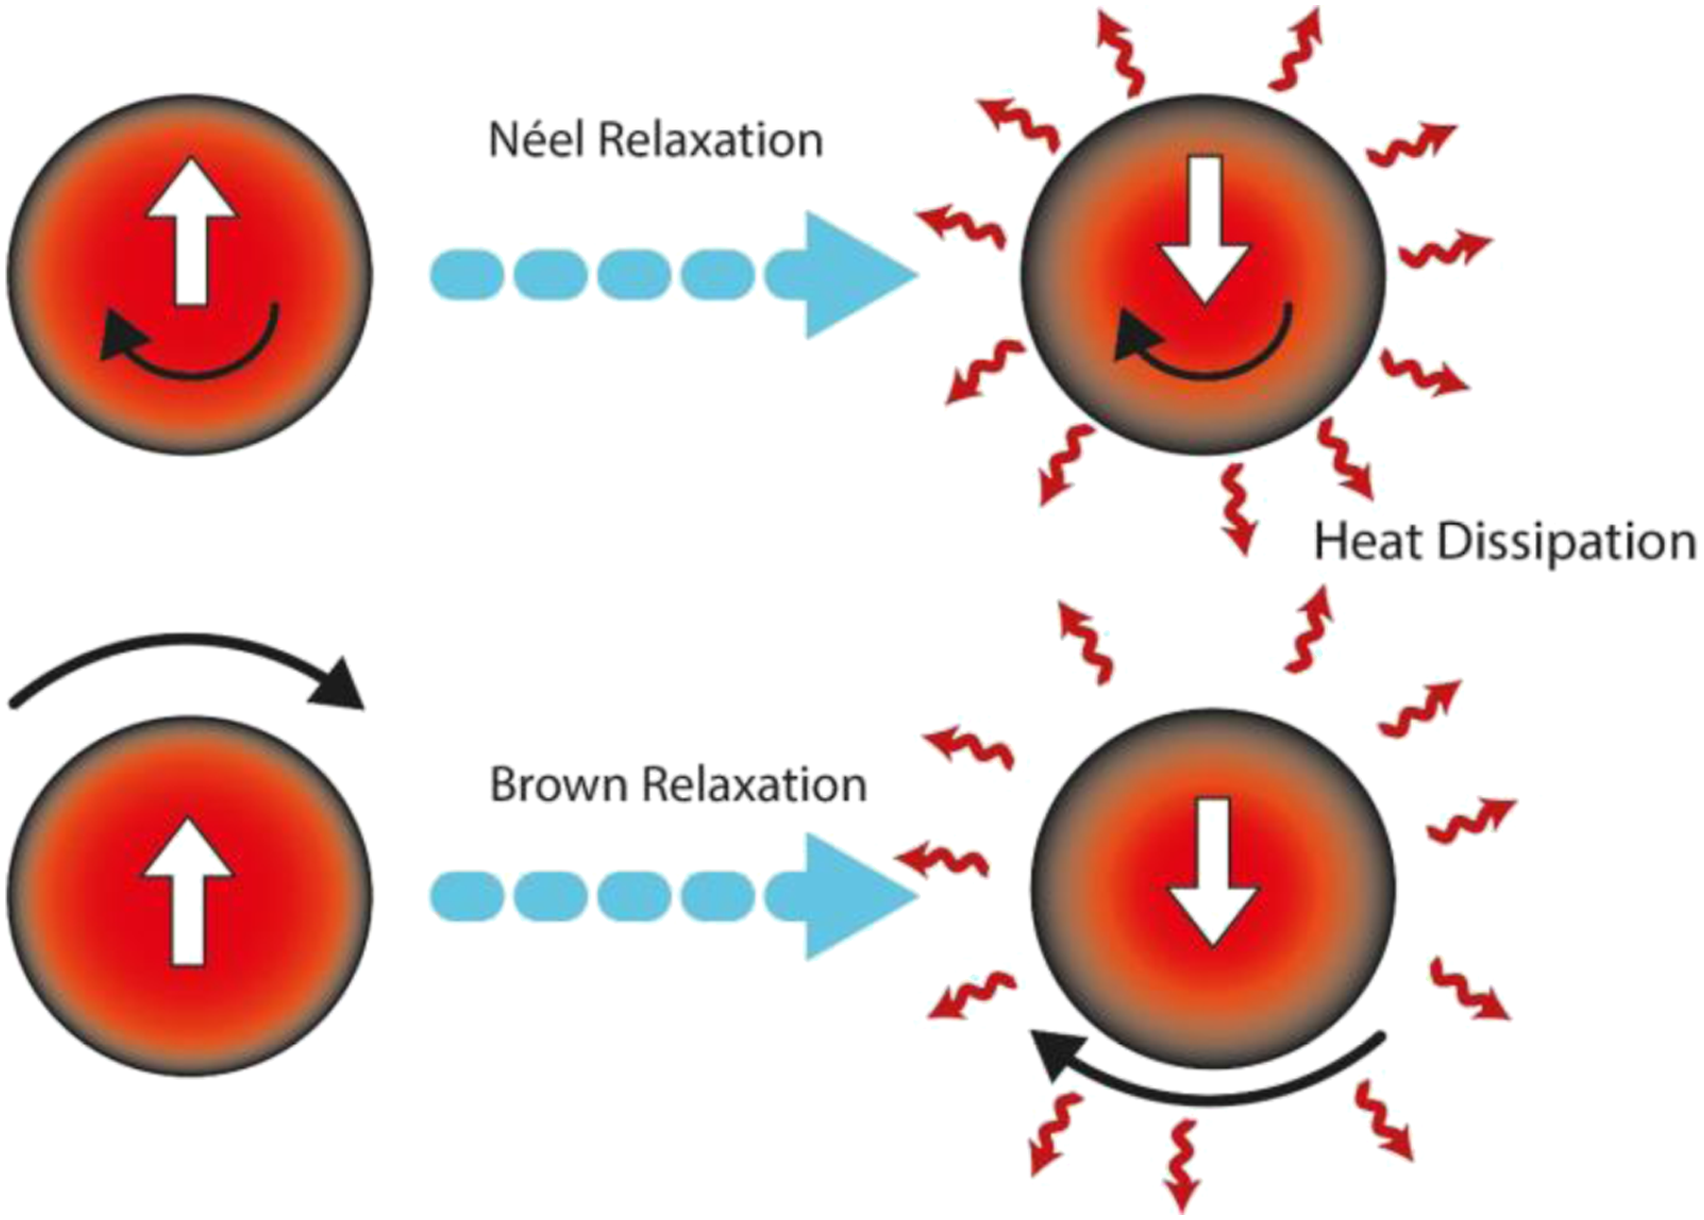
Thus, changes in the total magnetic moment of the sample will contribute optimally to the increase in sample temperature. This temperature affected by the heat dissipation from the nanoparticles caused by the delay in the relaxation movements of magnetic moment which are rotation inside the nanoparticle (Néel mechanism) 60 and by the rotation of the particle itself (Brown rotation) or triggered by hysteresis loss. In the larger particles size the hysteresis losses occurred due to the domain walls movement and caused the heat dissipation. 61 When the sample are under the AC magnetic field with shorter time in the reversal magnetic field compared to the relaxation time of the nanoparticles, then this relaxation mechanisms triggered and the Néel-Brown theory model can be used to illustrate the process as shown in Figure 11. The thermal that generated from this relaxation mechanisms or caused by the hysteresis losses is reliant on the size, structure, and magnetic properties of the nanoparticles. 59 Moreover, the SAR value is related to the amount of the heat absorbed by the tissues that targeted by the sample,62,63 so this also can be explained as the heat dissipation power per unit mass of the magnetic materials in the Mn0.25Fe2.75O4/Ag ferrogel that subjected to the AC magnetic field.
The decrease SAR value of MAg1 sample compared to MAg2 and MAg3 samples is also proportional to the decreasing saturation magnetization value for MAg1 samples compared to MAg2 and MAg3 samples (shown in Figure 12). These results indicate that the greater the saturation magnetization of the sample, the magnetic spin and orbital moment of the sample increases so that it has an impact on increasing the SAR value of the sample. That is also confirmed by research reports conducted by Kandasamy et al., which states that the SAR value is proportional to the increase in frequency from a given source.
58
In 2010, Hernández, et al., reported the SAR values of series of magnetic gel based on Fe3O4 embedded in alginate and PNIPAm.
64
The SAR values in this research were obtained between 100 and 300 W/g in this research using an AMF (260 kHz and 16 mT). While, Liu, et al., 2014 investigated the SAR value of MnFe2O4-loaded PBMA-g-C12 polymer nanospheres (MLPNs) with different loading concentrations of MnFe2O4 (MLPNs 1 for high concentrations dan MLPNs 2 for low concentrations).
65
This work shown that SAR value was decrease from MLPNs1 to MLPNs 2 about of from 7 to 4 W/g with also decrease of magnetization saturation value from 11 to 5 emu/g. Furthermore, Zamora-Mora, et al.
66
also reported the fabrication of magnetic gel based on chitosan/agarose (chi/aga) hydrogels (ratio 0.5/1.5) within mixed two different concentrations of magnetic nanoparticles 2% w/v (Chi/Aga-Fe2%) and 5% w/v (Chi/Aga-Fe5%). The samples were able to application of an AMF (418.5 kHz and 24 kA/m) to characterize SAR value. SAR value of Chi/Aga-Fe2% and Chi/Aga-Fe5% about of 30 and 32 W/g respectively.
66
This value shown that SAR was increase with increasing magnetic nanoparticle concentrations of magnetic gels. With a significant increase in SAR value and a good analysis of the effectiveness of antimicrobial samples, the CMC/PVA-Mn0.25Fe2.75O4/Ag ferrogel has the potential to be a therapeutic agent for hyperthermia and antimicrobials. The magnetothermal effect was increased and the increment occurred was greater in the same direction with the chains of sample than that in the direction normal to the chains (schematically shown in Figure 13). Relation of magnetization saturation and SAR value by the samples in (a) 438 Hz and (b) 553 Hz. Schematic of magnetothermal effect for the disorganized sample and the alignment magnetic sample (two directions).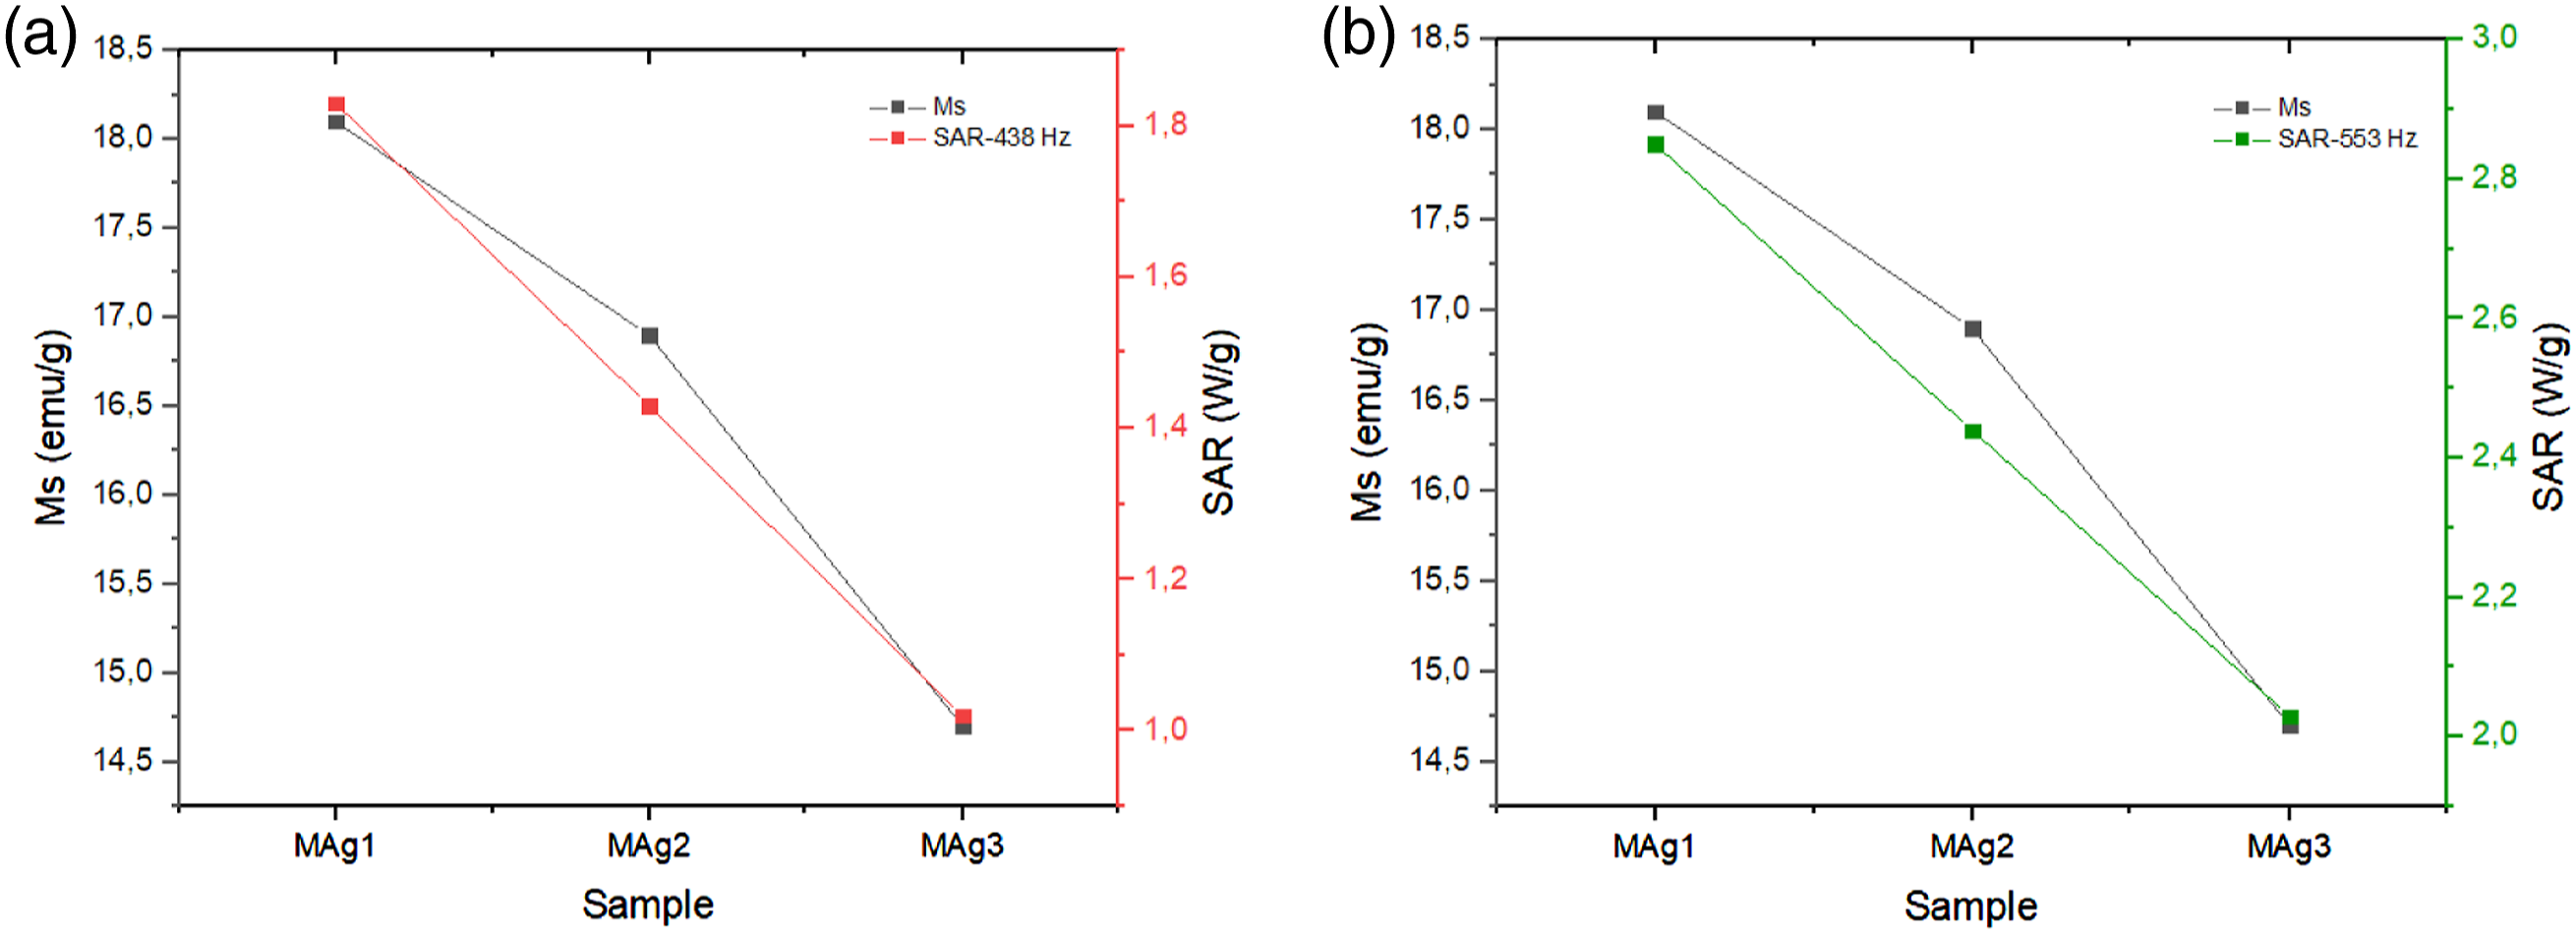
Conclusion
This study has successfully characterized the SAR value of CMC/PVA- Mn0.25Fe2.75O4/Ag ferrogel samples (gel-MAg). The SAR value of gel-MAg samples are greater with an increase in the frequency given but inversely proportional to the addition of Ag mass in the sample. Increasing the frequency will cause the addition of a strong electric current, which results in the increasing magnetic field changes in the coil. The increase in the external magnetic field will have an impact on the change of the magnetic spin moment and the magnetic moment of the sample orbitals. Additionally, increasing the SAR value of MAg1 samples compared to MAg2 and MAg3 samples is also proportional to the increasing saturation magnetization value for MAg1 samples compared to MAg2 and MAg3 samples. These results indicate that if the saturation magnetization of the sample is greater, the magnetic spin and orbital moment of the sample will augment. Thus, it impacts the increased SAR value of the sample. Furthermore, the addition of magnetite composite materials Mn0.25Fe2.75O4 and Ag was quite effective for antimicrobials in material samples. Meanwhile, the addition of Ag composition also increases the positive effect on antimicrobial areas. Therefore, materials Mn0.25Fe2.75O4 and Ag is effective to be an agent for antimicrobial.
Footnotes
Declaration of conflicting interests
The author(s) declared no potential conflicts of interest with respect to the research, authorship, and/or publication of this article.
Funding
The author(s) disclosed receipt of the following financial support for the research, authorship, and/or publication of this article: This study was funded by PNBP of Universitas Negeri Malang for the 2022 fiscal year through PUI CAMRY Schema with contract number of 19.5.1012/UN32.20.1/LT/2022 on behalf of SN.