
Abstract
This study introduces a novel nonwoven strip spinning method that adapts the principles of paper yarn technology, utilizing nonwoven fabric strips to produce random-oriented staple fibre (RO-SF) yarns. This method is chemically free and provides a sustainable alternative to traditional yarn production processes. Spunlace nonwoven fabrics, including 40 g/m² and 60 g/m², were processed with varying twist levels (20, 40, 60, 80, and 100 turns/20 cm) to evaluate key physical properties such as diameter, breaking strength, elongation, and yarn tenacity. Regression analysis revealed strong correlations (R² > 0.85) between yarn properties and twist level/strip width. Additionally, k-fold validation was employed to assess the accuracy of predictive models, enhancing the reliability of the results. Yarn diameters ranged from 0.50 to 1.9 mm for H40 and 0.59 to 2.33 mm for H60, with strip tex values ranging from 114 to 468 for H40 and 122 to 618 for H60. The breaking strength and elongation values were not suitable for high-strength textile applications, particularly for nonwoven strips below 2 mm. This research underscores the potential of nonwoven strip spinning as a versatile, eco-friendly yarn production method capable of processing a wide range of fibers, including non-spinnable materials, while offering a sustainable, chemical-free alternative to conventional spinning techniques.
Introduction
Approaching the 2030 sustainable development goals, there is a pressing need to significantly reduce waste and pollution to minimize environmental impact. A key target is achieving a 45% reduction in greenhouse gas emissions associated with fibre and raw material production by 2030. This ambitious goal calls for a rapid transition to sustainable practices and substantial investments in proven solutions. The industry is urged to bridge the innovation gap, prioritize sustainable value creation over resource-intensive extraction, and embrace concepts such as circularity, product durability, and the mitigation of overproduction and overconsumption, with a particular focus on reducing textile waste.
Numerous studies have focused on spinning techniques for various fibres, with open-ended (OE) spinning being the most widely adopted method.1–4 Frictional spinning has also been investigated as a potential alternative. 5 While advancements in fibre selection have significantly influenced spinning performance, there is a growing emphasis on the development of innovative spinning technologies that minimize environmental impact and eliminate the reliance on chemical treatments.6,7 Such advancements are critical to addressing the sustainability challenges posed by traditional processes, making environmentally friendly solutions a priority in textile manufacturing.
Strip spinning technique
Traditional paper yarn is made from a paper sheet held together by a natural binder. 8 Different from conventional yarn spinning, the production of traditional paper yarn involves cutting washi paper into fine strips and twisting them into yarn form.9,10 The manufacturing process of paper yarn emits no hazardous substances, and these yarn products can be biologically recycled, contributing to an eco-friendly lifecycle.11,12
Several studies have explored paper strip spinning techniques to produce unique yarn structures made from both natural and synthetic fibres. Chonsakorn, Piromthamsiri and Sirikasemlert 13 adapted traditional spinning methods to produce paper mulberry yarn, using hemp and cotton spinning techniques with strip lengths of 2, 4, and 6 mm. The 6 mm strips resulted in yarns with the highest count, strength, and elongation, but the coarse and fuzzy texture limited their use to home textiles. This highlights the difficulty in achieving fine, smooth yarns suitable for broader textile applications. Memon, Hu 11 investigated the production of paper yarn from plant-based sheets weighing 12 g/m2 and 18 g/m2, cutting them into 3 mm strips. This resulted in yarns with smooth surfaces, yielding 42.2 tex and 59 tex (diameters of 0.11 mm and 0.12 mm). Chummun and Rosunee 14 investigated the use of three different types of paper: 'Kite poster,' grease paper, and 'Kraft' paper—cut into strips of 0.5 cm, 1 cm, 1.5 cm, and 2 cm, which were then twisted and folded to form yarn. Their findings revealed that paper produced yarns with relatively higher tenacity and lower elongation. Bianzhi, Qian 15 studied hydrophobic paper yarn made from hemp pulp fibres, treated with polyamine epichlorohydrin (PAE) and alkenone dimer (AKD). Khan 9 examined paper yarns with counts ranging from 7 to 40 Ne, produced from 1 to 6 mm strips cut from paper sheets weighing 12-15 g/m2.
Nevertheless, the stiffness of paper poses challenges in twisting it into even twisting distribution, leading to irregular appearance of paper yarn. 10 Paper yarns faced significant challenges in physical properties: low elongation, poor flexibility, and insufficient strength, which often led to breakage during knitting. Their rough and stiff surface makes the yarn difficult to process on conventional textile machinery, further limiting its use in fine textile applications.
Development of spunlace nonwoven technology
Spunlace nonwoven technology, recognized for its eco-friendly processing, has been widely applied in the medical and hygiene industries. The spun-lacing system utilizes high-pressure water jets for fibre bonding, where water acts as a natural plasticizer, allowing fibres to entangle more easily with less force. This results in reduced fibre damage and higher production rates compared to needle punching. 16 No chemicals are required, and the water from the jets is recyclable through a water filtration system for repeated use. 17 Global consumption of spunlace nonwovens reached 1.6 million tons in 2021, valued at $7.8 billion.18,19 Despite cost and seasonal availability, cotton is still preferred for its superior properties in nonwovens, as its low wet modulus facilitates efficient interaction with water jets, while its cohesive forces enhance fibre entanglement during the production process. Additionally, the breathability, hypoallergenic properties, comfort, and strong wet strength of cotton spunlace nonwoven make it particularly valuable in medical textiles. 20 Spunlace nonwovens are typically produced in a weight range of 20 to 100 g/m2, with those used in commercial hygiene or medical nonwovens typically falling between 25 and 70 g/m2.21,22 Spunlace nonwoven below 20 g/m2 lack the necessary structural integrity, while those above 100 g/m2 are too dense for effective water jet penetration unless high energy is applied. 23
Nonwoven fabrics offer advantages in a variety of applications due to their versatility, cost-effectiveness, shorter production cycles and higher flexibility. 21 They are available in a wide range of fibre materials, with cotton fibre lengths ranging from 10 mm to 60 mm, which has led to growing interest in recycled nonwoven fabrics. 24 Natural and synthetic fibres have been significantly studied in spunlace nonwoven technology, including greige cotton, bamboo, wrighita tinctoria fibre 25 and hydrophilic/hydrophobic PET, 26 nylon, danufil fibre with 8-12 mm fibre length,27,28 recycled carbon fibre, 29 and PET lengths of 8, 11, and 15 mm produced in wet-laid nonwoven. 30 The finding revealed a diverse spectrum of materials suitable for fabrication through the utilisation of spunlace techniques, extending beyond the conventional scope of cotton.
Nonwoven strip spinning system for producing random-oriented staple fibre (RO-SF) yarn
A novel nonwoven spinning system is proposed as an alternative spinning method that merges the principles of nonwoven fabric manufacturing with paper yarn spinning technology. This system can convert staple fibres into yarn by integrating multiple advanced processes, using staple natural fibres to produce an environmentally friendly layered yarn structure named as random-oriented staple fibre (RO-SF) yarn.
Despite its potential, limited research has been conducted on using nonwoven fabrics as a substitute for paper in paper yarn spinning systems. This study serves as a preliminary investigation into the use of nonwoven fabrics to explore the properties of RO-SF yarn. The research focuses on the nonwoven structure and the fabrication of RO-SF yarn, providing an analysis of its structure and yarn properties. Moreover, regression method is employed to predict the yarn performance and establish fitting model based on assumptions of data precision.
Materials and methods
Material
This study focused on regular 100% virgin cotton spunlace weighing 40 g/m2 (thickness: 0.32 mm) and 60 g/m2 (thickness: 0.50 mm). The spunlace nonwovens utilized in the preparation of RO-SF yarn were purchased from Zhejiang ZhenBang Industrial Co., Ltd, , China. The nonwoven fabric was formed by cross lapping method.
Production process of random-oriented staple fibre yarn (RO-SF yarn)
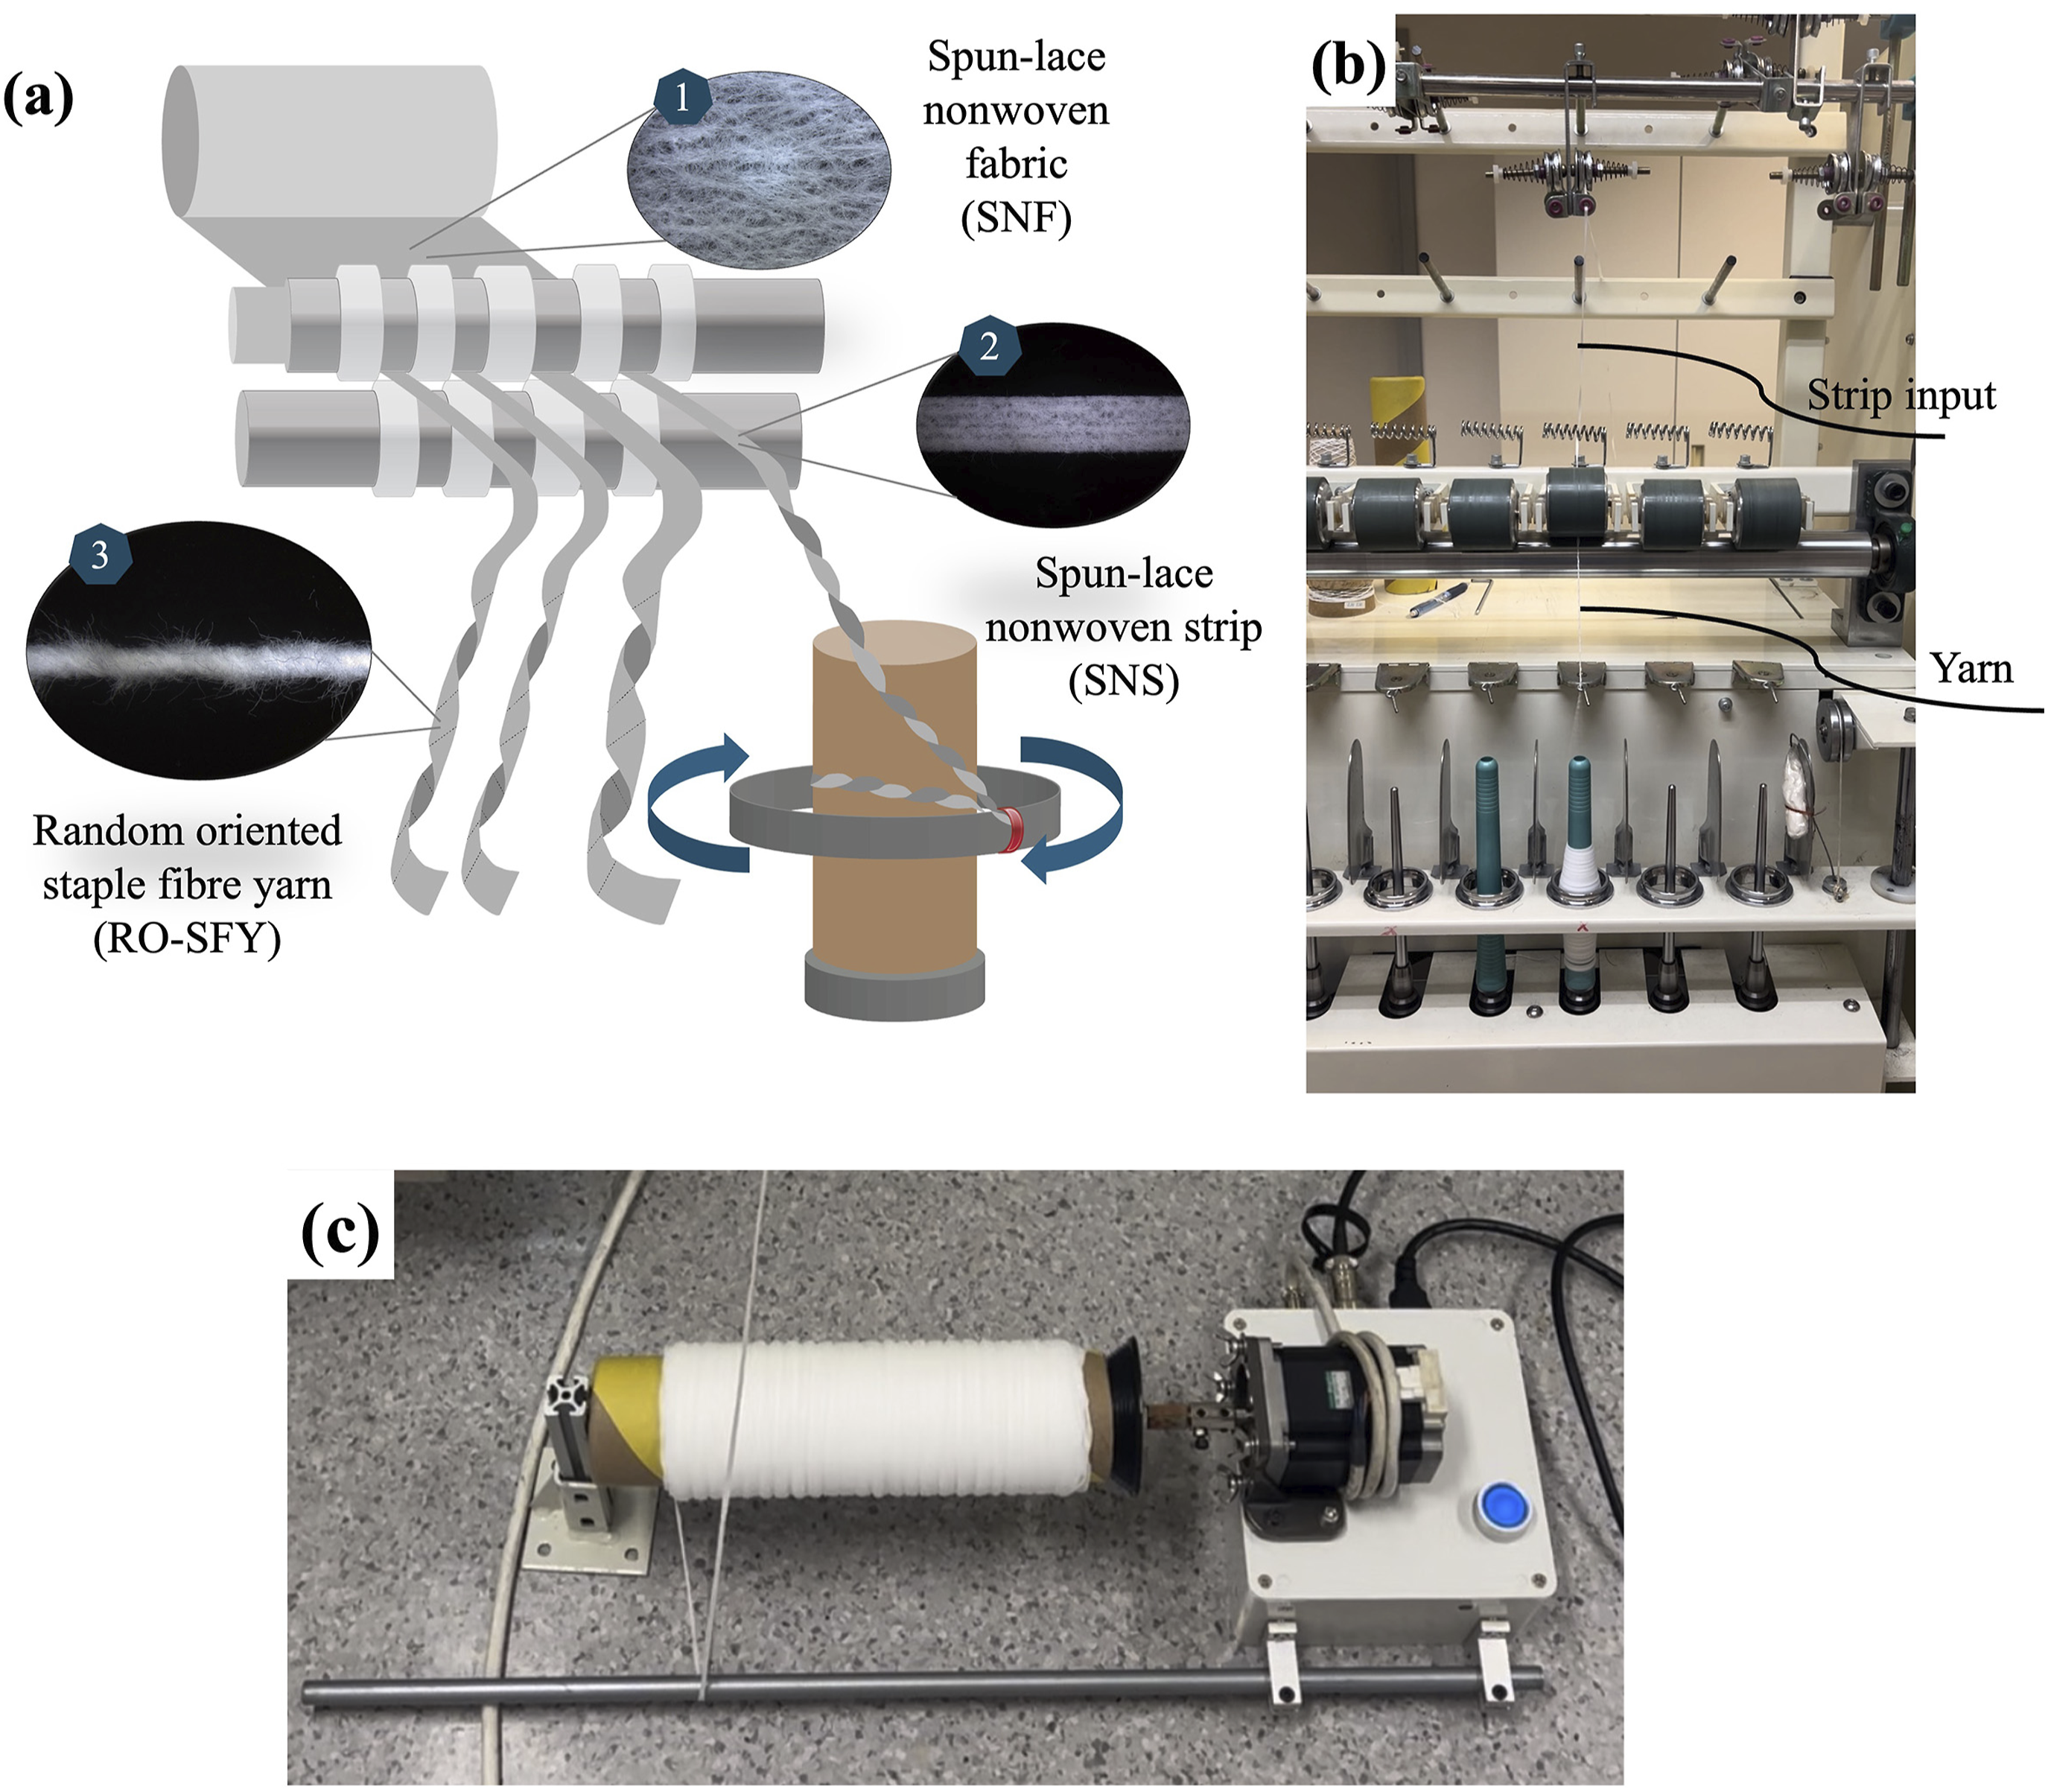
A novel nonwoven spinning system was designed for producing RO-SF yarn by combining hydroentangling technology (Figure 1) and yarn twisting system. Based on previous study of paper strip, commercial paper strip generally ranges in 1-15 mm. As considering various bonding method leading to the strength difference of nonwoven material and conventional paper, nonwoven strips width in 2 to 10 mm were prepared respectively by custom-made rotatory cutting machine to explore the twisting properties of RO-SF yarn. The process is depicted in Figure 2(a). 9 width groups of spunlace nonwoven strip were firstly twisted at five different levels: 20, 40, 60, 80, and 100 turns per 20 cm (t/20 cm) respectively by ring twisting machine (Figure 2(b)) for investigating the physical properties of yarn. While avoiding strip breakage or uneven tension, particularly for narrow strips, twisting parameters, including speed and tension, were carefully optimized to stabilize the process and improve the uniformity of the yarn. Moreover, a direct feeding system (Figure 2(c)) was designed and positioned in the front of the spinning equipment to facilitate the smooth feeding of nonwoven strips. Hydroentangling process. (a) Strip preparation by rotatory cutting machine, (b) Yarn twisting machine, (c) Direct feed equipment.
Methods
It is important to understand the breaking properties of the nonwoven fabric to select a suitable width range for the twisting process. The workflow includes the analysis of materials in three phases: (1) nonwoven fabric, (2) nonwoven strip, and (3) RO-SF yarn, as shown in Figure 3. Schematic illustration of RO-SF production process and experimental setup.
Material characterization
In the study, the surface morphology of nonwoven fabric, nonwoven strip, and RO-SF yarn was examined using a field emission scanning electron microscope (FE-SEM) (ZEISS sigma 500). The yarn diameter was measured using stereo microscopy (Leica M165 C), and the average yarn diameter was calculated.
Breaking properties
The breaking properties of the spunlace nonwoven fabric and nonwoven strip were tested using INSTRON 5566 universal testing machine according to the ASTM D5035 standard. The specimens were 25 ± 0.5 mm in width and 150 ± 0.5 mm in length. For nonwoven strip testing, strip specimens were prepared in 2-10 mm in width and 150 ± 0.5 mm in length. The changes in breaking strength across different widths were evaluated to assess the strength stability of different strip widths and the impact of strip parameters on subsequent twisting process. Subsequently, the breaking strength and breaking elongation of the RO-SF yarn were measured using INSTRON 5566 universal testing machine according to ASTM 2256 standard. Yarn tenacity (cN/Tex) was calculated by dividing the breaking load by the linear density, where the unit of linear density is Tex.
Testing condition
All samples were conditioned for 24 hours in a room maintained at 20°C ± 2°C and 65% ± 2% relative humidity before testing. To ensure sample consistency, we randomly selected samples and conducted 20 repetitions of the experiment to reduce variability caused by differences in raw materials. Finally, the average of all experimental results was taken to account for variability and enhance the reliability of the results.
Verification of statistical analysis for RO-SF yarn
Regression analysis was adopted for estimating the relationship between strip width (mm) and yarn twist (t/20 cm), and its correlation with yarn diameter (mm), yarn breaking strength (N), yarn breaking elongation (%) and yarn tenacity (cN/tex). Statistical analysis was performed by MATLAB software. The data process was established based on multiple linear regression analysis to seek the best function fit for the data by minimizing the sum of squared errors. This method can be used to estimate unknown data points. The equation (1) is presented as:

To assess the model’s accuracy, K-fold cross-validation was implemented with 5 folds for data training. Predictions were made for the test set, and performance metrics, including mean square error (MSE) and correlation coefficient (R2) were calculated for each fold. The MSE and R2 were averaged to provide an overall assessment of the model’s performance.
Result and discussion
Surface morphology of spunlace nonwoven fabric
Figure 4 illustrates the surface morphology of H40 and H60 nonwoven fabrics in the surface view and cross sectional view. Both H40 and H60 were produced using the same hydro-bonding method, resulting in similar fibre alignment, as expected. The surface displays a “condensed strand”-like structure (red dashed line), formed by high-pressure water jets generated through hydroentanglement.
31
H40 exhibits a thinner structure and obvious surface porosity compared to H60, as shown in Figures 4(a) and 4(b). Moreover, Figures 4(b) and 4(e) show most fibres are arranged vertically, which reflects the direction of fibre flow during the production process.
32
In the cross-sectional view, the bulkiness of the nonwoven fabric is evident, with web layering typical of the web-forming process used in nonwoven fabric production, as depicted in Figures 4(c) and 4(f). As the fabric weight increases, the thickness also increases, resulting in a more solid fibre alignment in the cross-section. Spun-lacing processing enables fibre bonding without the utilization of resin or adhesives. The process encompasses three stages of fabric alteration: initial web compression, fibre entanglements resulting from bending and reorientation, and partial recovery following the departure from the impact zone. This facilitates the maintenance of bulkiness and a fuzzy texture.
33
The surface morphology is primarily employed to illustrate the comparative fibre alignment in the RO-SF yarn produced using a spunlace non-woven fabric. (a, b) SEM surface view, and (c) SEM cross-sectional view of 40 g/m2 spunlace nonwoven fabric (H40), (d, e) SEM surface view, and (f) SEM cross-sectional view of 60 g/m2 spunlace nonwoven fabric (H60).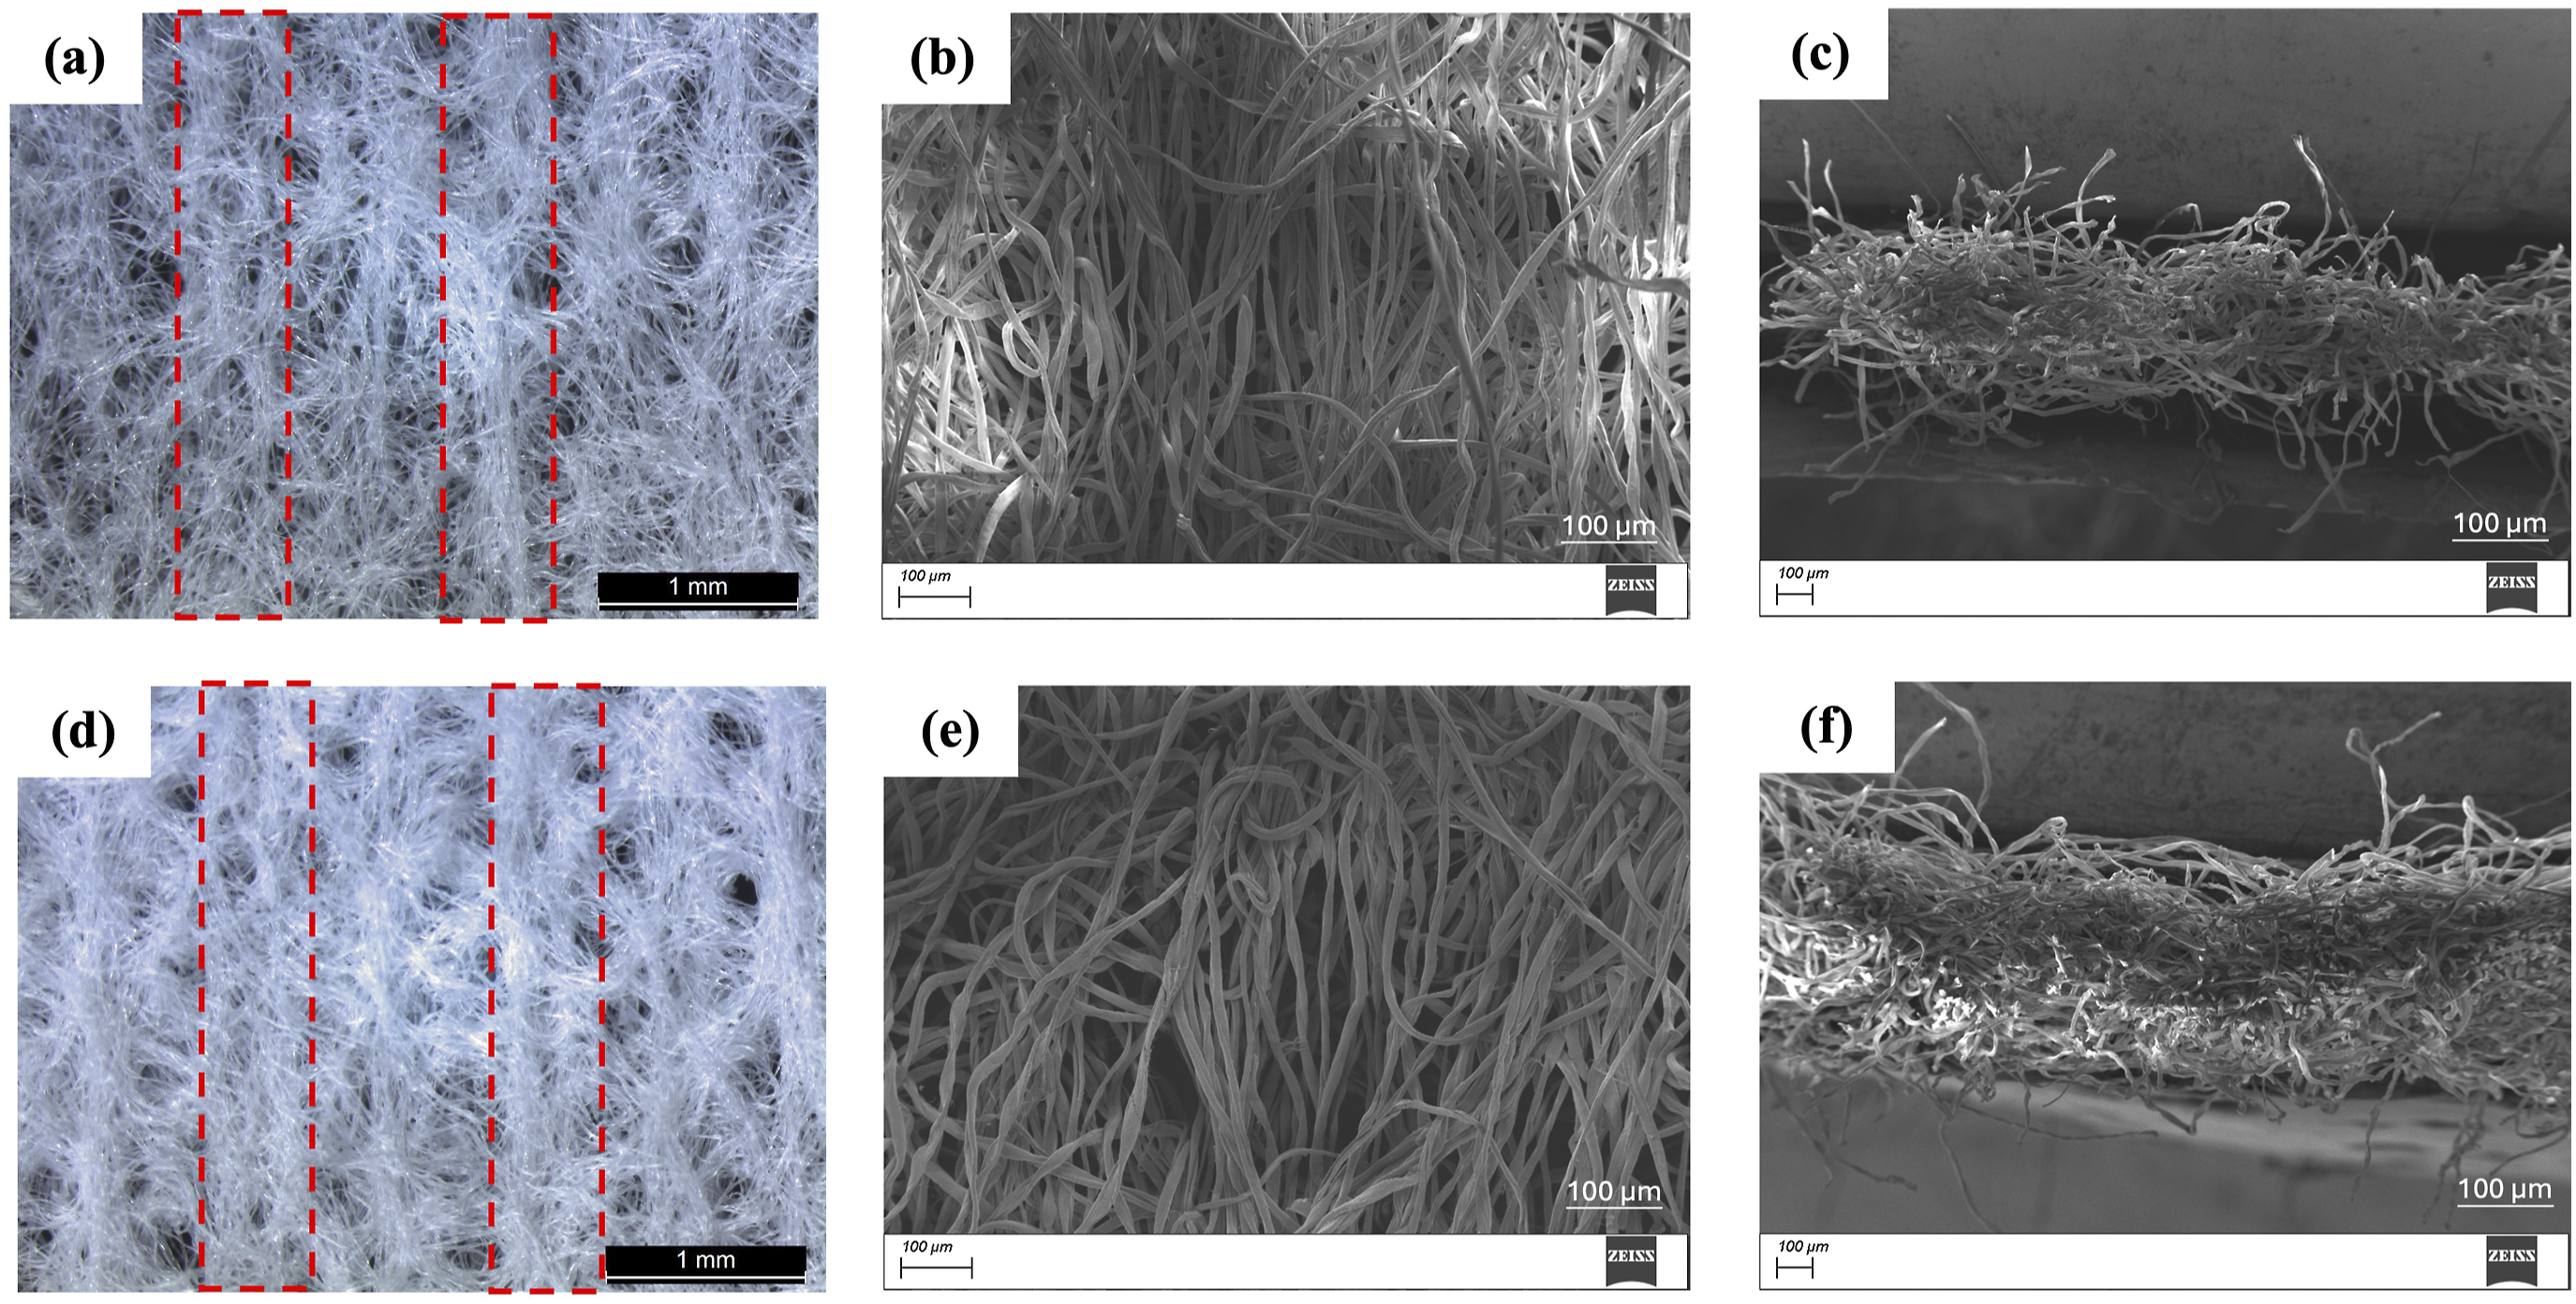
Breaking properties of spunlace nonwoven fabric
Breaking result of different spunlace nonwoven fabric.

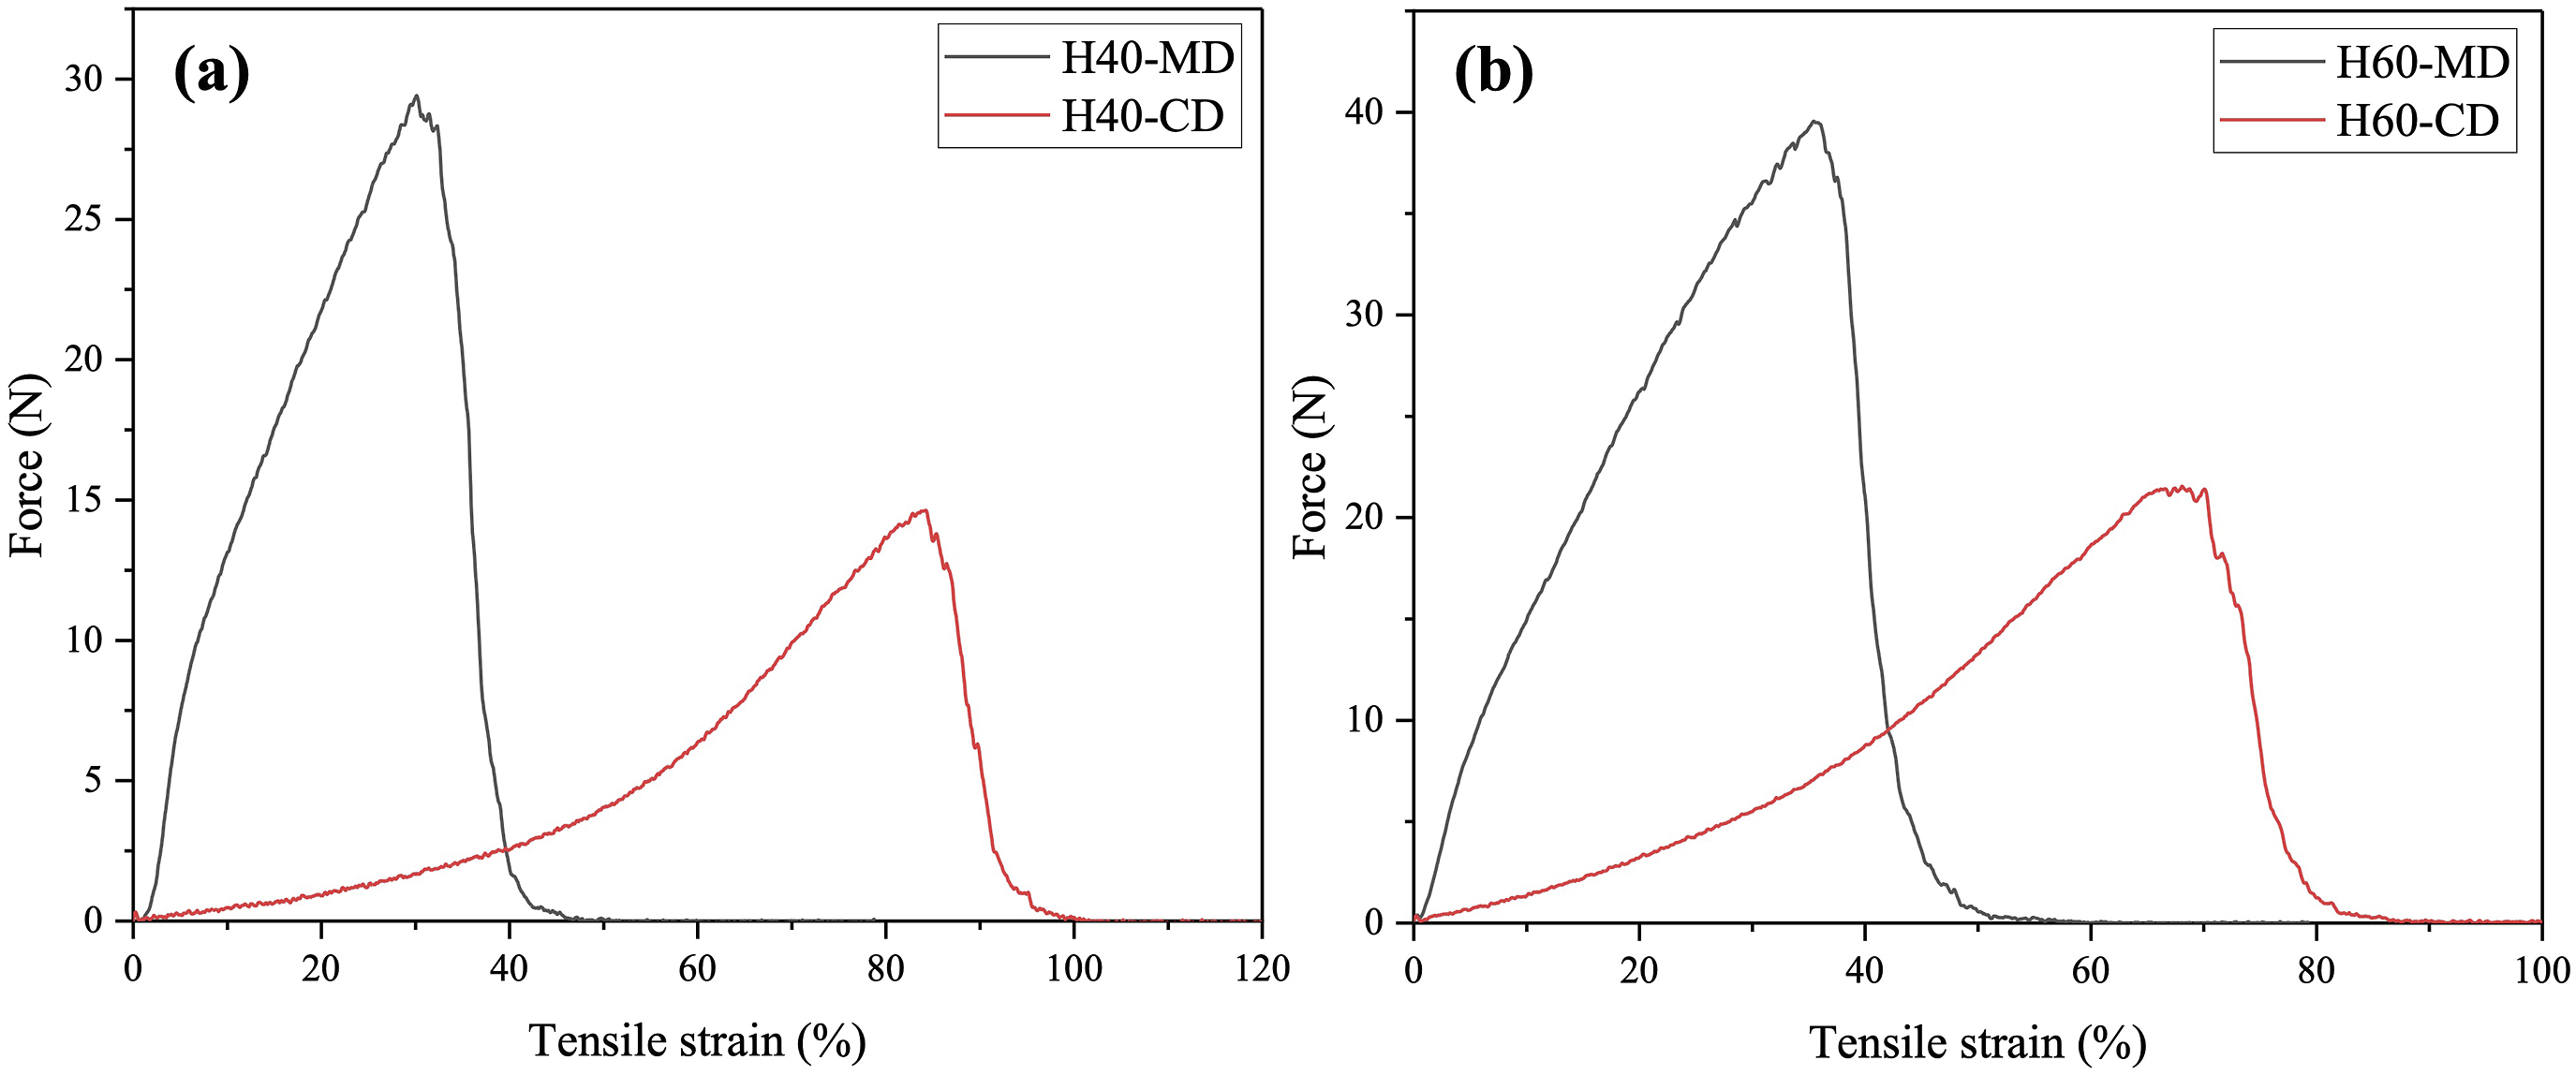
Force-strain curve of (a) H40 spunlace nonwoven fabric and (b) H60 spunlace nonwoven fabric.
The breaking elongation result shows MD direction significantly lower than that of CD direction, which consistent with previous research on spunlace nonwoven according to Zhang 35 and Degirmenci. 36 Friction between fibres and increasing mass per unit area were potentially contributed to the elongation result. The elongation results of nonwoven fabric align with previous research confirming that laying direction has impact on tensile strength and elongation. An increasing number of fibres oriented along the “condensed strand” led to greater inter-fibre friction, which resisted fibre sliding and resulted in a lower elongation value. 37 Moreover, there was a consistent downward trend in CD strength and elongation, where higher weight corresponded to higher strength but poorer elongation. Conversely, MD elongation was less apparent among different weight groups. The overall results demonstrated that H40-CD exhibited higher elongation, while H40-MD performed the lowest.
Surface morphology of spunlace nonwoven fabric under stretching
H40 and H60 spunlace nonwovens were prepared in a size of 2.5 cm (width) × 1 cm (length) and clamped in the stretching equipment (Figure 6) to observe the breaking behaviour of the nonwoven fabric under various levels of stretching. The pulling process in the machine direction (MD) and cross direction (CD) was observed under a microscope, using 1 cm as the original length. The results are presented in Figure 7. Fibre slippage occurs when the material is pulled longitudinally. The formation of these “condensed strands” (indicated by red dashed lines) of entangled fibres is partly attributed to an increase in MD strength up to a certain optimum point or limit. As the weight increases, more fibres aggregate in a cross-laid formation to form “condensed strands”, resulting in higher strength, particularly in the H60 sample, which is consistent with previous research findings.31,38,39 Fibres aggregate and cohere in the “condensed strands” along the MD, contributing to increased MD strength until these strands are fully extended to the breaking point. In the CD, cotton fibres align perpendicularly with the “condensed strands” and then straighten out, leading to a higher extension. Since the bonds between fibres are randomly distributed, predicting fibre behaviour can be challenging, and different batches may yield varying results.
40
(a) Stretching equipment; (b) Specimen size. The stretching process of spunlace nonwoven sample under an optical microscope.

Specification of nonwoven strip samples
The parameter of nonwoven strips.

The strength result performed linearly in both H40 and H60. H40 and H60 continue to steadily increase until reaching to maximum width. Bending stiffness refers to the ability of fibres to resist bending, which plays a critical role in hydroentangling technology. One advantage of hydroentanglement over needle-punching is that water reduces the bending stiffness of fibres, allowing them to bend and entangle more easily with less force. 16
In the context of strip strength, fibre entanglement contributes to the stability and load distribution across the strip. Wider strips contain a greater number of fibres, which collectively bear the load and distribute stress more effectively. Although all strips are cut from the same fabric and therefore have consistent levels of fibre entanglement, the increased fibre count in wider strips enhances their overall resistance to deformation, resulting in higher strength. The rebound of water pressure cause fibre twisting and entangling during the hydroentanglement process, resulting in higher intensive entangling behaviour results in higher tensile strength.
41
Figure 8 presents the practical view in stretching process of H40 nonwoven strip. The “condensed strands” are visible in 10 mm nonwoven strip while “condensed strands” are not obvious in 2 mm. As narrowing the width, the variation of strength difference between H40 and H60 is smaller. It may be contributed that “condensed strands” is possibly damage during the cutting process. The stretching process of nonwoven strip in the MD direction (a) H40-10 mm, (b) H40-2 mm.
Figure 9 illustrates a representative stress-strain curves depicting the mechanical behaviour of the three weight groups of nonwoven fabrics under uniaxial tensile loading at different widths. After a brief linear region, the curves exhibit significant non-linear behaviour and reach maximum load capacity at engineering strains of 25–30%. Two different post-peak behaviours are observed. The first peak is characterized by a gradual decrease in stress sustained by the fabric and second peak is potentially related to localized damage of fabric. When strain exceeds 100%, curves exhibit sudden drop to zero. The ability to maintain significant load capacity under large strains is undoubtedly the most relevant characteristic of this material, implying a very high energy absorption capability during deformation.
42
Stress-strain curve of nonwoven strip by 2 mass group in the MD direction (a) H40; (b) H60.
Surface morphology of RO-SF yarn
Figure 10 shows the SEM side view image and cross-sectional view image of RO-SF yarn produced from 3 mm H40 and H60 nonwoven strip at 300 twists per 20 cm (t/20 cm) respectively. RO-SF yarn produced from H40 group (Figure 10(c)) shows part of fibre was stretched in the parallel alignment while H60 group (Figure 10(d)) remains the random alignment. Previous research has addressed the transformation associated with twist and the tensional twist folding framework. The observed main transformations as a planar sheet experience five stages: (1) helicoid, (2) longitudinal buckling, (3) transverse buckling, (4) creased helicoid, and (5) loop.
43
Finally, a bamboo-like structure is formed. In the SEM side view, short fibre exposed in the folding branch (Figures 10(a) and 10(b)), with increasing yarn thickness (H60), branch is more obvious. Yet, fibres in branch section are randomly aligned. That might concern contributing to yarn hairiness. Side view image of RO-SF yarn produced from (a) 3 mm H40 nonwoven strip and (b) 3 mm H60 nonwoven strip at 60 twists per 20 cm (t/20 cm) taken by Leica M165 G; SEM side view image of RO-SF yarn produced from (c) 3 mm H40 nonwoven strip and (d) 3 mm H60 nonwoven strip at 60 twists per meter (t/20 cm).
During the twisting process, the yarn is expected to form a folded structure. Figure 11(a) presents the ideal cross-section of paper yarn based on previous research, where the yarn is theorized to consist of an inner layer, middle layers, and an outer layer when produced by twisting slit paper.
44
Figures 11(b) and 11(c) show the side and cross-sectional views of the RO-SF yarns made from the H40 and H60 groups, respectively. However, due to the fuzzy surface characteristics of the spunlace nonwoven material, the expected folded structure was not visible in either the H40 or H60 yarns. This may be attributed to the strip cutting process, which results in smoother edges (Figure 12), while the twisting process can cause fibres to be pulled out, leading to fuzziness in the cross-sectional view. (a) Ideal cross section of paper yarn (b) cross-sectional view image of RO-SF yarn produced from a 3 mm H40 nonwoven strip at 60 twists per 20 cm (t/20 cm); (c) cross-sectional view image of RO-SF yarn produced from a 3 mm H60 nonwoven strip at 60 twists per 20 cm(t/20 cm). (a) SEM edge view of H40 nonwoven strip and (b) H60 nonwoven strip.

In the cross section, the H40 group exhibited an invaginated core, while the H60 group had a solid core fully surrounded by fibres. The core structure in the RO-SF yarn also varied with increasing twisting level. As shown in Figure 13, at twisting levels of 40 t/20 cm (Figure 13a) and 60 t/20 cm (Figure 13b), a small gap remained in the core section because the strip layers did not fully compress. At the higher twisting level of 80 t/20 cm (Figure 13c), this gap was completely compressed with the increasing twisting force, similar to the RO-SF yarn made from H60-3 mm at 60 t/20 cm (Figure 11(c)). Comparing the cross-sections of the H40 and H60 yarns at 60 t/20 cm, it was observed that the nonwoven thickness significantly influenced the formation of the small gap in the core. The overall structure of the RO-SF yarn contributes to a fabric with enhanced softness and bulkiness, with the small gaps observed in the yarn playing a role in these properties. SEM cross-sectional view of RO-SF yarn produced from H40 nonwoven strips using a ring twisting machine at (a) 40 t/20 cm (b) 60 t/20 cm, and (c) 80 t/20 cm.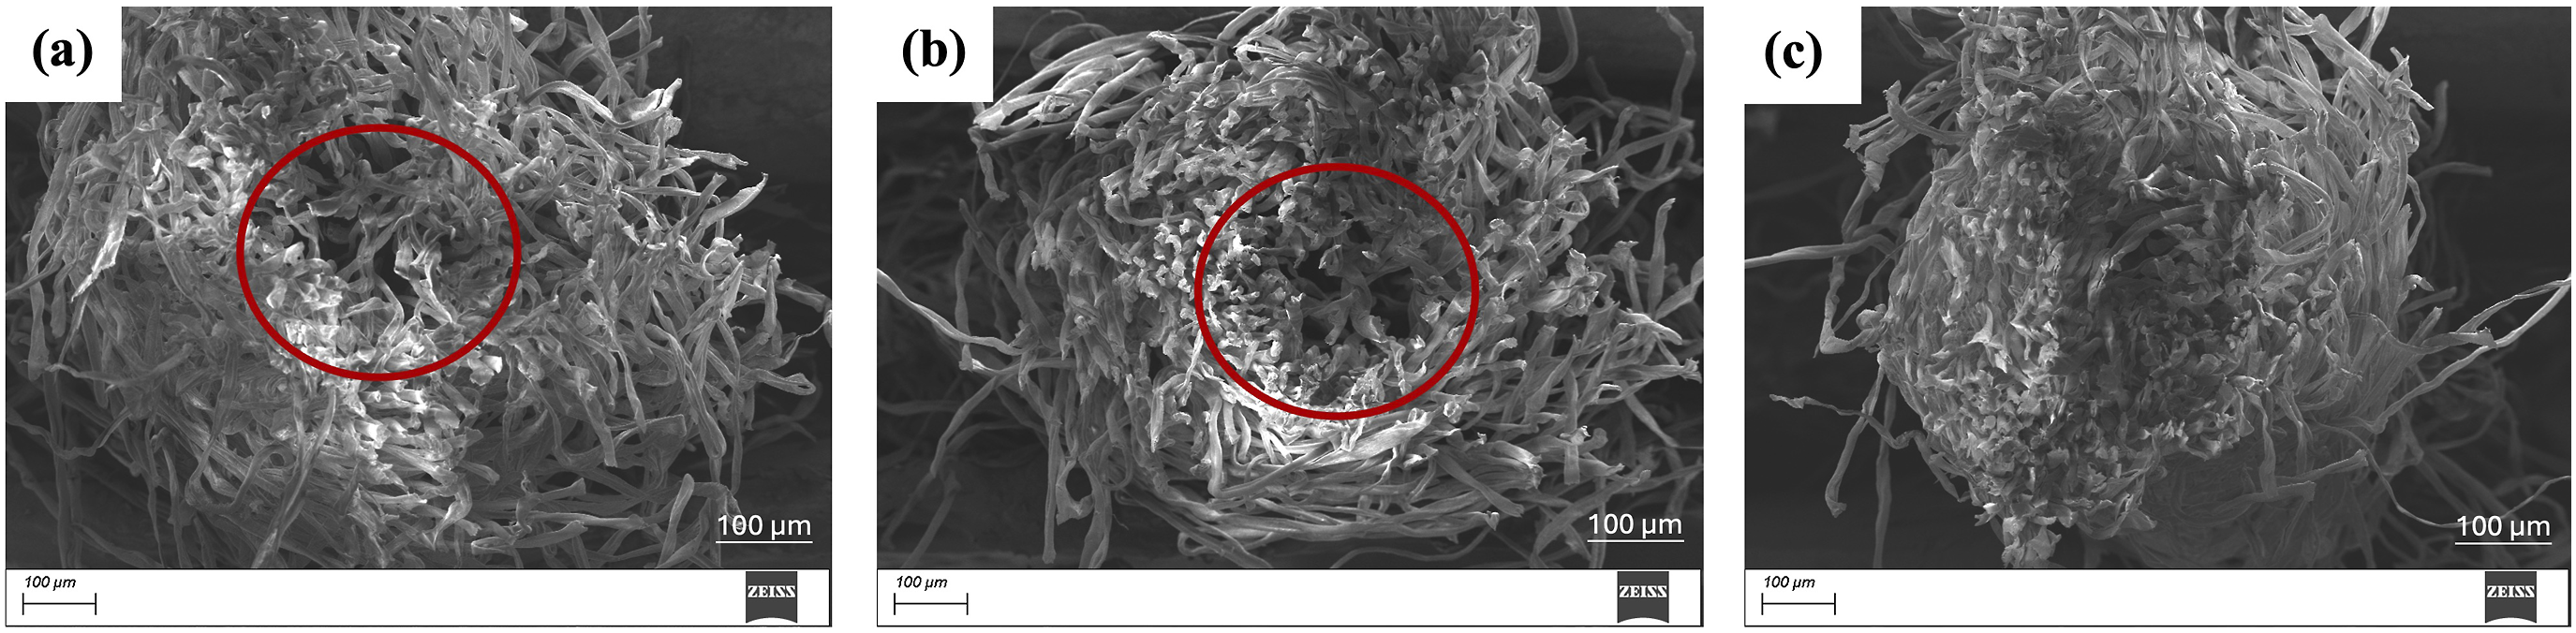
Physical properties of RO-SF yarn
Nonwoven strips produced from specific widths of nonwoven strip were twisted into RO-SF yarn by ring twisting machine and tested on yarn diameter (mm), breaking strength (N), breaking elongation(%) and yarn tenacity (cN/tex). While undergoing the twisting process, there was a noticeable reduction in yarn diameter until yarn breakage. Yarn was formed by folding layers. When the maximum layer capacity was exceeded, curling occurred during the relaxation stage (Figure 14). The selection of yarns in industry typically takes into consideration their performance characteristics, such as yarn linear density, strength, elongation, coefficient of variation (C.V.) of strength and elongation, irregularities and defects, twist coefficient, and fuzziness. Yarns undergo stretching, bending, and twisting deformation during knitting actions, showing importance of the mechanical properties of yarn for knitting. In comparing similar twisting techniques, research on the application of paper yarn structures has been predominantly focused on the multi-ply yarns used in knitting.45,46 An example of such a yarn is the Swedish paper yarn with a yarn linear density of 119 and a diameter of 0.35 mm, produced using a 3 mm strip and knitted with a gauge of 5.2.
47
It seems majority of paper yarn are applicable to produce high tex yarn. Due to the gaps in this technology, there are still no standard guidelines or statistical studies for producing RO-SF yarn. Therefore, multiple regression analysis was adopted with a total of 83 sets of input data to establish the linear correlation between the inputs (x1 and x2) and the output (y), as shown in Equation (1).
48
The average yarn diameter, tensile strength, breaking elongation, and yarn tenacity of nonwoven obtained from 9 sets of width levels and 5 sets of twisting levels as shown in Table 3. Stereo-microscopy view of H40- 5 mm strip in various twisting level. Summary of statistical results for RO-SF yarn properties.

Multiple linear regression analysis of RO-SF yarn properties
The equation fitting for yarn characteristic.

Cross validation of multiple linear regression by 5 folds for code H40.

Cross validation of multiple linear regression by 5 folds for code H60.

Prediction analysis of width and twisting level on yarn diameter of RO-SF yarn
The yarn diameter of RO-SF yarn was measured in cross-section. It was observed that the strip width (x₁) and twist level (x₂) exhibit positive and negative correlations, respectively, with yarn diameter, as shown in equations (2) and (6) in Table 4. The model’s coefficient of multiple determination (R2) for H40 and H60 were 0.974 (p-value: 0.0132) and 0.951 (p-value: 0.0351), respectively. The prediction model is statistically significant (p < .05). To further assess the model’s predictive accuracy, K-fold cross-validation was conducted. The cross-validation results for both H40 and H60 are shown in Tables 5 and 6 respectively. The cross-validation results indicate that the model is robust in predicting yarn diameter for both H40 and H60 data sets. For H40, the mean squared error (MSE) is 0.0041 with an average R2 of 0.9435, showing high predictive accuracy, with MSE values ranging from 0.0025 to 0.0057 and R2 from 0.8891 to 0.9857. For H60, the MSE is 0.0142 with an average R2 of 0.8889, indicating good but slightly lower predictive performance, with MSE ranging from 0.0032 to 0.0231 and R2 from 0.7825 to 0.9578. The model demonstrates a generally high level of predictive accuracy for yarn diameter in both H40 and H60, as indicated by R2 values close to 1 and low MSE values.
Figures 15(a) and 15(b) illustrate the predicted and experimental results related to twist level, strip width, and yarn diameter for the RO-SF yarn of H40 and H60. The surface plot represents the predicted results, while the dots represent the experimental results. The two groups exhibit comparable overall trends. A reduction in twist level and an increase in strip width result in a decrease in yarn diameter. Conversely, an increase in twist level and a decrease in strip width lead to an increase in yarn diameter. The predicted values are in close alignment with the experimental results, except for a discernible discrepancy at H60 – 20 t/20 cm. This discrepancy may be attributed to incomplete yarn formation at 20 twists, as evidenced by the semi-twist state observed in Figure 14. This may have resulted in a more pronounced diameter variation during the testing phase. Regarding the H40 data set, the experimental yarn diameter ranges from 0.50 mm to 1.9 mm, while the predicted values range from 0.56 mm to 1.85 mm. For H60, the experimental yarn diameter ranges from 0.59 mm to 2.33 mm, with predicted values ranging from 0.69 mm to 2.12 mm. The results demonstrate that the RO-SF yarn utilized in the experiments is categorized as a coarse spinning yarn. Predicted and experimental yarn diameters of RO-SF yarn. (a) H40 and (b) H60.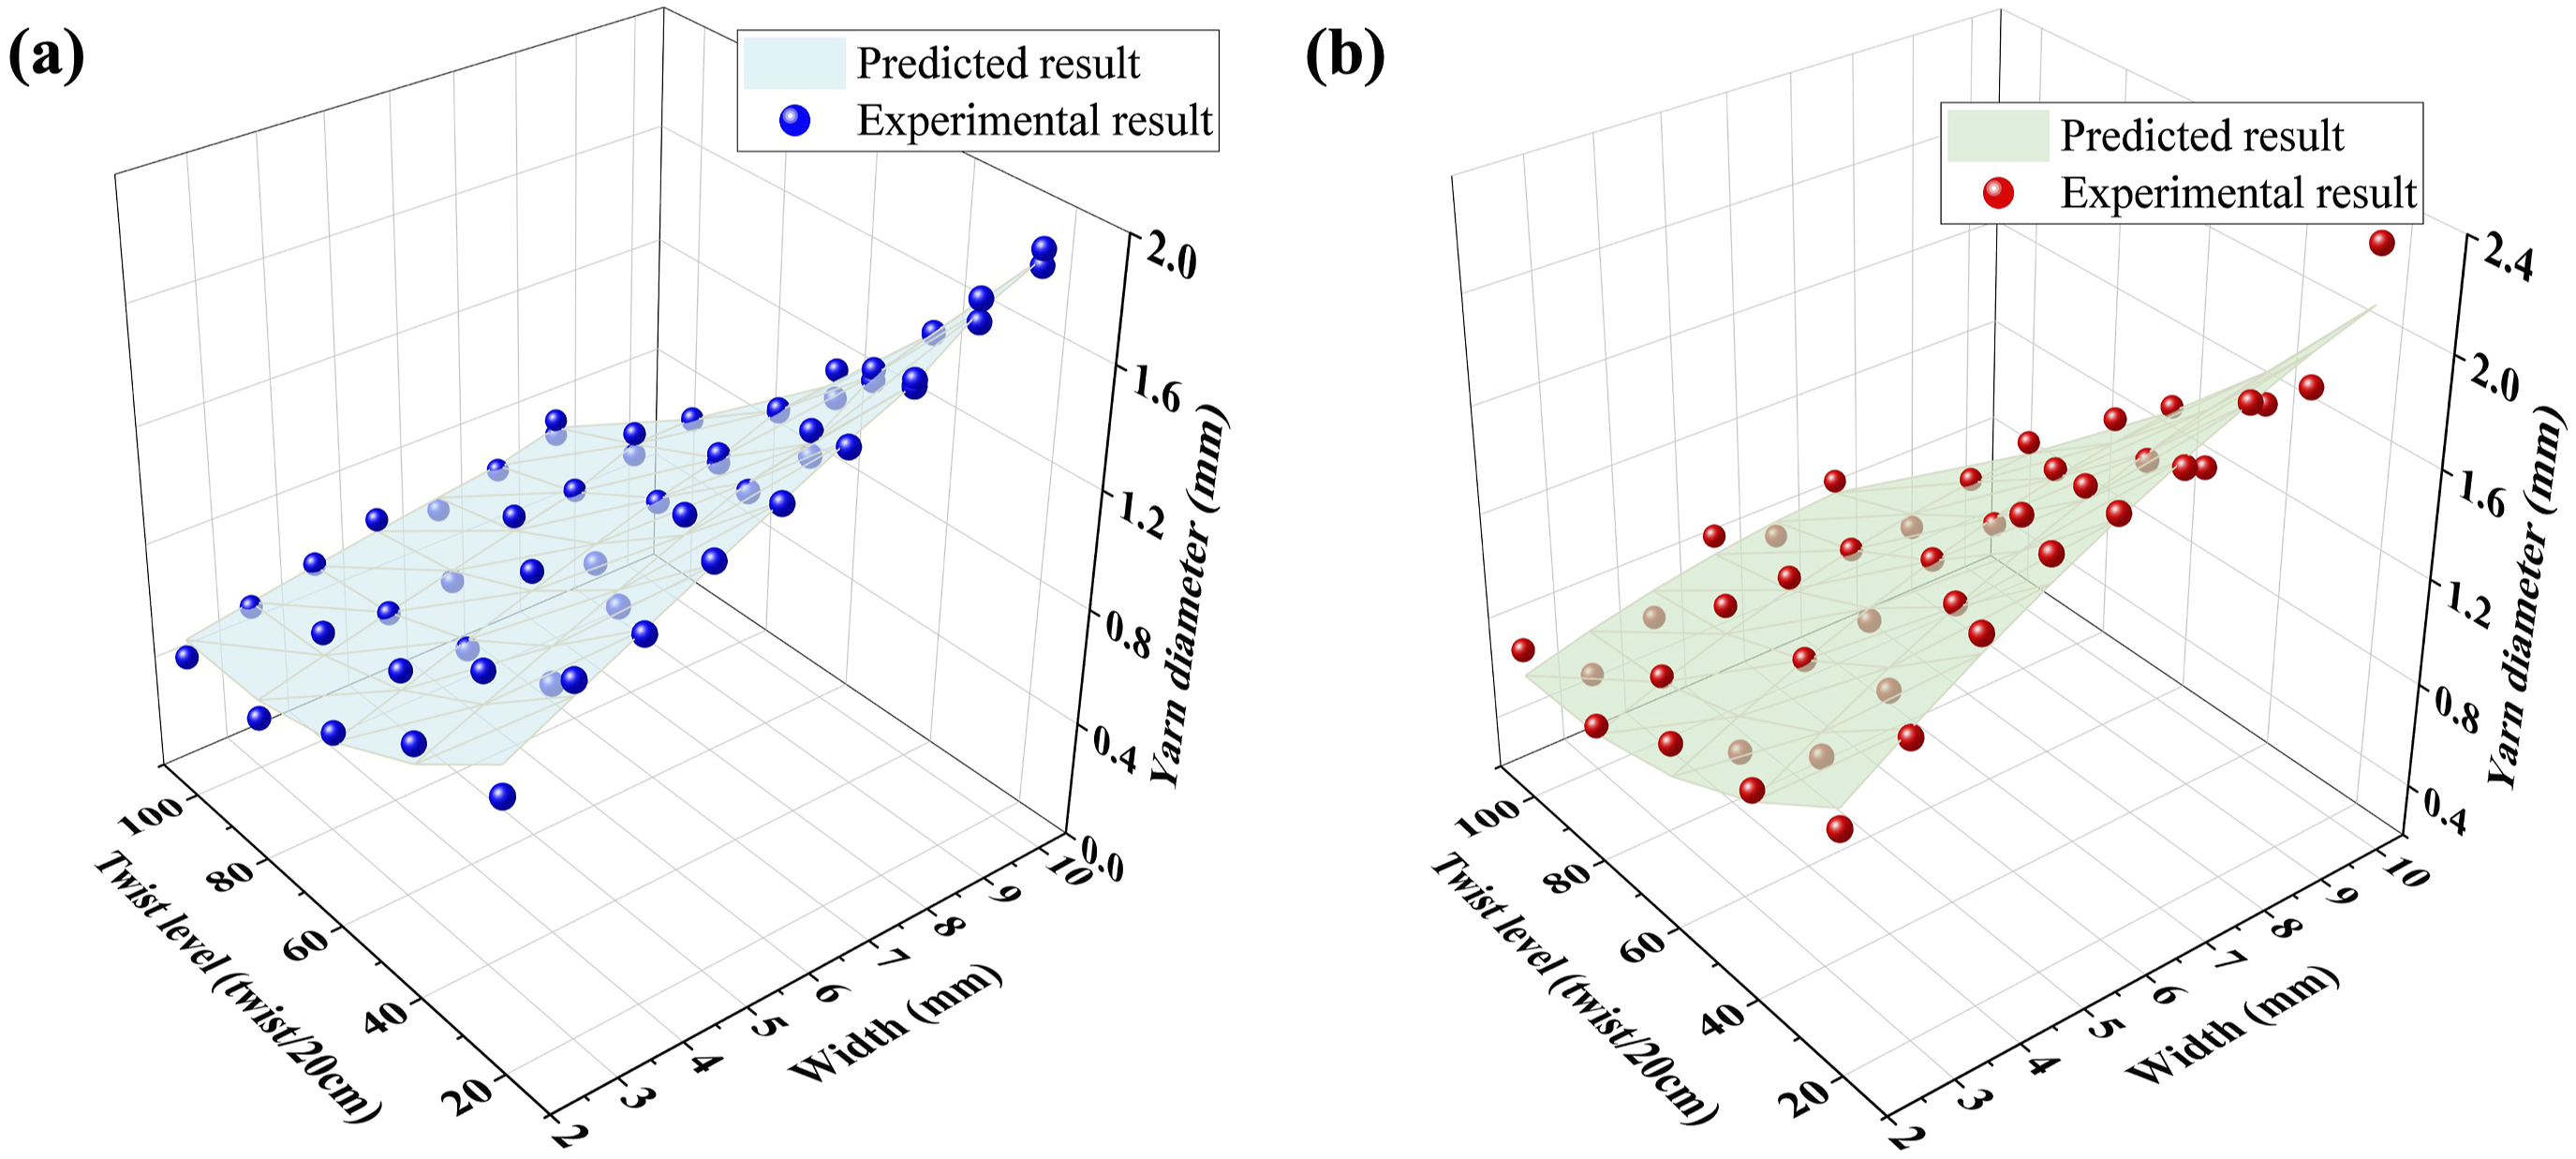
Prediction analysis of width and twisting level on breaking strength and breaking elongation of RO-SF yarn
It was observed that strip width (x₁) and twist level (x₂) exhibit negative and positive correlations, respectively, with tensile strength, as shown in equations (3) and (7) in Table 4. The regression results demonstrated a strong correlation between the experimental and predicted values, with R2 values of 0.978 (p-value: 0.0106) for H40 and 0.992 (p-value: 0.0024) for H60. These results indicate that the predictive model is statistically significant (p < .05). Details of the cross-validation results, shown in Tables 5 and 6, yielded an average MSE of 4.1736 and an average R2 of 0.9597 across the five validation sets for H40, and an average MSE of 1.5114 and an average R2 of 0.9866 across the five validation sets for H60. The prediction model for breaking strength showed the highest predictive power among all tested groups, particularly for the H40 and H60 groups. As twist level and strip width increase, both strip strength and yarn strength also increase, as expected.
Figures 16(a) and 16(b) illustrate the significant relationship between strip twist, width, and yarn strength for H40 and H60, respectively. For H40, the experimental values ranged from 3.18 N to 41.5 N, while the predicted values ranged from 1.94 N to 42 N. For H60, the experimental values ranged from 2.48 N to 41.68 N, and the predicted values ranged from 2.06 N to 40.27 N. It was also observed that the strip group in H60 showed slightly lower values compared to H40, particularly at the minimum group (2 mm). As the strip width narrows, the “condensed strands” may damage due to the cutting process. Furthermore, weak points may emerge at the edges of the strip, which can lead to premature breakage once force is applied. The overall trend aligns with expectations. An increase in twist level and width leads to higher breaking strength. Predicted and experimental breaking strength of RO-SF yarn. (a) H40 and (b) H60.
The regression results for breaking elongation demonstrated an inverse relationship with breaking strength, as anticipated. It was observed that strip width (x₁) and twist level (x₂) exhibit a negative correlation with breaking elongation, as indicated by equations (4) and (8) in Table 4. The multiple determination R2 for H40 and H60 were 0.859 (p-value: 0.1566) and 0.934 (p-value: 0.0539), respectively. These values suggest that the predictive model for breaking elongation has relatively low predictive power compared to other models, as shown in Table 4. The cross-validation results for the H60 group indicate that the predictive model demonstrates relatively strong performance, with an average mean squared error (MSE) of 2.7634 and an average coefficient of determination (R2) of 0.8555. The individual MSE values show some variability, ranging from 0.9298 to 5.6821, indicating that the model’s performance is not consistent across all validation sets. Folds 3 and 4, which had MSEs of 1.5475 and 0.9298, and R2 values of 0.8983 and 0.8911, respectively, demonstrate that the model performs well under certain conditions, providing accurate predictions with lower error. On the other hand, the higher MSE of 5.6821 in fold 1 suggests that some validation sets may include outliers or data points that cause the model’s predictions to deviate more significantly from the actual values. Overall, while the model shows good potential for predicting breaking elongation, its performance is not entirely consistent, implying that other factors not fully captured by the model may influence the results.
Figures 17(a) and 17(b) present a comparison between the predicted results (surface plot) and the experimental results (dot plot) for the RO-SF yarns from the H40 and H60 groups. The experimental values for H40 exhibited a range of 11% to 28%, while the predicted values demonstrated a range of 12% to 26%. In the case of H60, the experimental values ranged from 15% to 35%, while the predicted values ranged from 14% to 33%. As anticipated, the 10 mm width strip with 20 twists/20 cm exhibited the highest breaking elongation in the H40 group. This outcome was consistent with the hypothesis that a higher strip width and lower twist contribute to greater breaking elongation. In the case of the H60 group, the 10 mm width strips with 20, 40, and 60 twists yielded results for breaking elongation that were almost identical, with values of 32%, 35%, and 30%, respectively. However, the prediction model did not demonstrate statistical significance. This indicates that twist level has a negligible impact on breaking elongation, whereas strip width appears to exert a more pronounced effect. The breaking elongation of the RO-SF yarns exhibited relatively minor variation in the experimental results, with no discernible trend. This could be attributed to irregularities during the cutting or twisting process, where nonwoven strips may have been unexpectedly pulled or subjected to inconsistent forces, leading to the observed fluctuations in the results. Predicted and experimental breaking elongation of RO-SF yarn. (a) H40 and (b) H60.
Prediction analysis of width and twisting level on yarn tenacity of RO-SF yarn
Yarn tenacity is important parameter in determining the linear strength of yarn by measuring the breaking force of the component by linear density of the fibre and yarn which express in cN/tex.
49
Yarn tenacity was calculated by the following equation (10):
The regression analysis revealed that both strip width (x₁) and twist level (x₂) exhibit positive correlations with yarn tenacity, as indicated by equations (5) and (9) in Table 4. The coefficient of determination (R2) for the H40 and H60 groups were 0.917 (p-value: 0.07) and 0.932 (p-value: 0.0563), respectively. While the p-values slightly exceed the 0.05 threshold, they suggest a marginally significant relationship, indicating a trend towards significance. K-fold cross-validation was conducted. The result is summarized in Table 6, demonstrate the model’s performance across multiple validation sets for both the H40 and H60 groups. For H40, the average MSE was 0.6442, with an average R2 of 0.8746. The MSE values ranged from 0.1809 to 0.9918, while R2 values ranged from 0.7590 to 0.9387. These results indicate that the model offers good predictive accuracy, with slight variability across the datasets, which is common in cross-validation. For H60, the average MSE was 0.1921, with an average R2 of 0.8990. The MSE values ranged from 0.0369 to 0.3276, with R2 values spanning from 0.7942 to 0.9737. This demonstrates that the model performed particularly well for the H60 dataset, with higher consistency in predictions and stronger overall accuracy.
Figures 18(a) and 18(b) illustrate the comparison between predicted and experimental results for yarn tenacity in both the H40 and H60 groups. For H40, the experimental values ranged from 2.50 cN/tex to 10.47 cN/tex, while the predicted values ranged from 1.83 cN/tex to 11.11 cN/tex. In H60, the experimental values ranged from 1.97 cN/tex to 7.67 cN/tex, with predicted values ranging from 1.86 cN/tex to 7.49 cN/tex. The yarn tenacity generally increased with both the twist level and strip width, with more stable results observed at increasing width, reflecting the relationship between yarn tenacity and strip density. Increased twist levels result in more stable tensile strength, leading to higher frictional forces and greater yarn tenacity. Predicted and experimental yarn tenacity of RO-SF yarn. (a) H40 and (b) H60.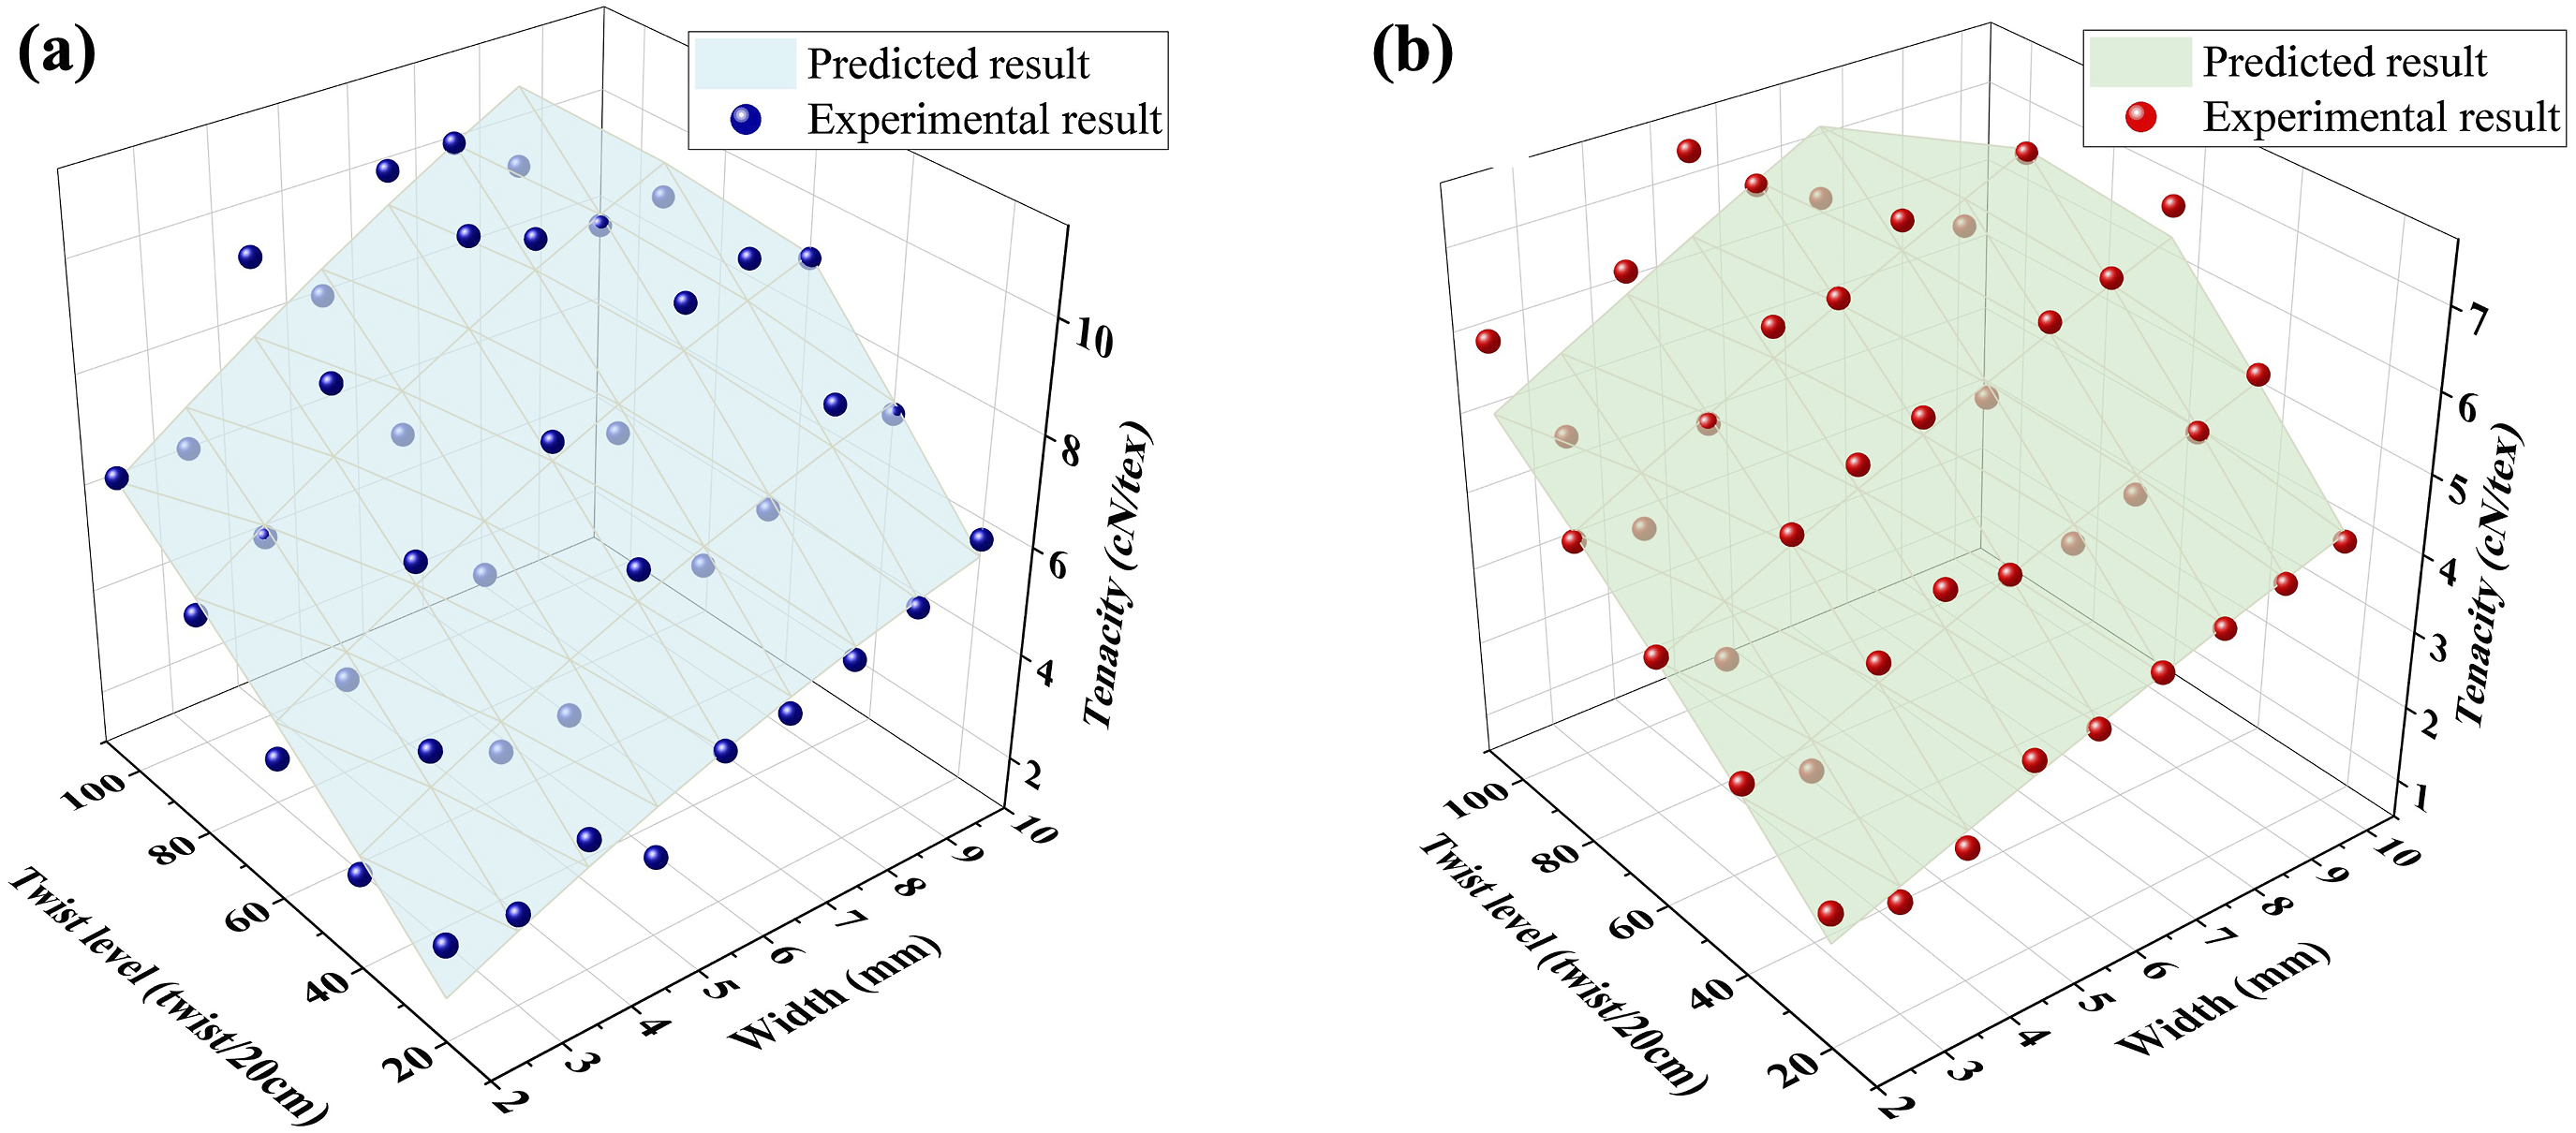
Conclusion
This study preliminarily investigated the breaking behaviour of nonwoven fabric and develops an experimental RO-SF yarn using a ring twisting technique. Multiple linear regression analysis was applied to establish the relationships between the experimental nonwoven strip, twisting level and yarn properties, demonstrating good predictive accuracy across most datasets, with average R2 values close to 0.9 and low mean squared error (MSE) values.
The proposed RO-SF yarn offers promising potential to produce coarse staple yarns (114 tex to 618 tex), particularly due to its simplified processing. The innovative twisting method fully utilizes the material without requiring pre-finishing or chemical treatments, effectively reducing the complexity and cost of traditional spinning processes while promoting a more sustainable and waste-efficient production approach.
The breaking strength of RO-SF yarn requires further study to enhance its performance, as it directly affects the weave-ability and knittability. It may not be suitable for applications requiring high breaking strength, such as warp yarns. Future research could focus on optimizing fibre types, fibre ratios, and nonwoven processing methods, as well as refining twisting parameters to improve the properties of RO-SF yarns such as yarn evenness and yarn hairiness. Potential applications extend beyond garment production to include technical textiles, composites, and other industries that demand robust and versatile materials. Nonwoven yarn spinning system offers potential for processing materials traditionally considered non-spinnable, such as dandelion fibres and alginate fibres. This approach can potentially explore converting various fibres into nonwoven fabrics, addressing challenges associated with the short length of natural or recycled fibres in conventional spinning and dyeing processes. This direction holds significant promise for advancing sustainable practices in the textile industry and beyond.
Footnotes
Declaration of conflicting interests
The author(s) declared no potential conflicts of interest with respect to the research, authorship, and/or publication of this article.
Funding
The author(s) disclosed receipt of the following financial support for the research, authorship, and/or publication of this article: This work was financially supported by Innovation and Technology Fund (Project No. ITP/060/21TP and ITP/002/23TP), the Hong Kong General Research Fund (Project No. 15607920) and the National Natural Science Foundation of China 32071906.