
Abstract
This article aims to investigate the dynamic behavior of high-performance multi-axial warp-knitted flexible composite materials under low-velocity impact tests through experiments and numerical simulations. In this paper, high-performance multi-axial warp-knitted flexible composites were prepared. Three different preparation processes, 175°C-5 min, 185°C-10 min, and 195°C-15 min, were designed for the multi-axial warp-knitted flexible composites. Studied the impact response of different preparation processes, initial impact energy, and punch shapes and diameters on materials. The results showed that the flexible composites prepared by various processes exhibit the same impact response curves in the impact resistance process, while the damage morphology and failure modes of the samples are different. Different initial impact energies caused multiple failure modes in the samples. The material showed penetration damage at high energy impacts and permanent depression damage at low energies. For different punch shapes, the impact resistance of materials to hemispherical punches is better than that of cylindrical punches. Numerical simulations were carried out using the finite element software ABAQUS. The custom material subroutine (VUMAT) based on the Hashin damage criterion model was implemented in the finite element program. The experimental and numerical simulation results agree regarding impact response characteristics. This paper analyzes the composite damage shapes, crack extensions caused by low-velocity impact tests and finite element simulation on multi-axial warp-knitted flexible composites. It provides a valuable reference for failure and structural optimization of multi-axial warp-knitted flexible composites for architectural applications.
Keywords
Introduction
In recent years, flexible composites have attracted wide attention for their unique properties, such as large deformation, lightweight, and fatigue resistance.1–3 They are widely used in high-performance industries such as construction, stratospheric airships, ships, cushioning airbags, modular pontoon bridges, tent skeletons, etc.4,5 Flexible composites have low stiffness at low stresses and exhibit foldable properties.6–8 Applying prestress on flexible composites with restricted boundary conditions will acquire specific stiffness and demonstrate high strength under high external stresses.9–12 This feature makes them easy to transport and store, extending their range of applications compared to rigid textile composites. Flexible composites are vulnerable to material failure under debris from wind forces in the external environment.13–15 They were prompting the composite material to cause internal damage not visible to the naked eye or directly caused by the local material penetration damage, damage at the crack extension, thus triggering greater safety hazards.10,16 In addition, flexible composites in the application process to specific areas and other substantial transfer behaviour will be handled, which is more likely to produce some impact events.7,8,17,18 Therefore, to ensure the service life and safety of flexible composites, it is significant to investigate the damage mechanisms and failure modes of flexible composites under external forcing states for their application areas.9,17,18
Many factors affect the impact resistance of composites, such as the selection of matrix and reinforcement, the preparation process of composites, thickness and impactor shape. Regarding fiber structure, multi-axial warp-knitted fabrics have better mechanical properties than biaxial warp-knitted and even better than woven fabrics. Compared with other organizational structures, multi-axial warp-knitted structures have anisotropy and excellent impact resistance. Dogan 19 investigated the low-velocity impact response of thermoset (TS) and thermoplastic (TP) composites. The results showed that the perforation threshold of TP samples was higher than that of TS samples at the same impact energy. Yan et al. 20 prepared nylon/high resilient bonded polyester (HRPET) nonwoven composites with different needling parameters. The results showed that the needling depth affects the interlayer cohesion and impact force transfer.
Chen et al. 21 explored thermoplastic composites for low-velocity impact tests. The test results showed that the impact damage was different for different laminates at the same impact energy, with significant differences in the impact resistance of the three AS4/PEEK laminates. Yang et al. 22 investigated a lightweight inflatable composite called LWSFICs. The tests showed the damage characteristics of the composites under low-velocity impact, and the materials achieved up to 90% energy absorption capacity, which decreased with the increase of thickness. Zhao et al.23,24 Production of biaxial warp knitted fabrics using high-strength yarns. The results show that the initial impact energy has a small effect on the impact response of biaxial warp-knitted flexible composites; the impact resistance of the elastic composite samples increases with the increase of high-strength polyester thread density and insertion density. The damage patterns of the flexible composites were completely different under different impactor shapes. Lopresto et al. 25 investigated the low-velocity impact behaviour of composites at room temperature and extreme temperature conditions. The results proved that when the temperature decreases, higher energy is required to penetrate the same laminate due to brittle damage of the composite; on the contrary, the absorbed energy decreases with decreasing temperature, which implies that the internal damage is more easily propagated.
Zhang et al. 26 investigated the effect of different blend structures of carbon and glass fiber warp-knitted interlaminates and intra-laminates on the low-velocity impact performance of composite laminates. The results showed that the intra-ply hybridized laminate with C: G = 1:1 has a better impact resistance. The effect of impactor shape on the low-velocity impact performance of three-dimensional woven composites was studied experimentally and numerically by Behzad et al. 27 The results showed that a blunt instrument produces a larger damage area and threshold load. The low-velocity impact (LVI) response of three different polypropylene (PP) composites was studied experimentally and numerically by Bandaru et al. 28 The results showed that the energy absorption capacity of the hybrid composites is significantly improved over Kevlar/PP and basalt/PP composites. The experimental and numerical simulation results perfectly agree regarding impact response characteristics. Kurşun et al. 29 described the dynamic behavior of biaxial glass fiber reinforced, laminated composites under low-velocity impact test by finite element simulation.
The current research on fabric flexible composites for impact dynamics mainly focuses on flexible composites whose reinforcements are woven fabrics and nonwovens,16,30–34 and there are fewer studies on flexible composites with multi-axial warp-knitted fabrics as reinforcements. The research on multi-axial warp-knitted flexible composites in kinetic low-velocity impact is insufficient to fully reveal their damage patterns under impact forcing and the complex mechanism of complete failure. Therefore, in this paper, the low-velocity impact response of multi-axial warp-knitted flexible composites under different forcing conditions is investigated in depth. The low-velocity impact response of flexible composites is described and illustrated by different failure models implemented through a user-defined material subroutine. On this basis, the multi-axial warp-knitted structural material reinforced flexible resin composites prepared in this paper provide a certain theoretical basis and reference for knitted structures in the field of flexible composites for industrial use.
Experimental procedure
Samples
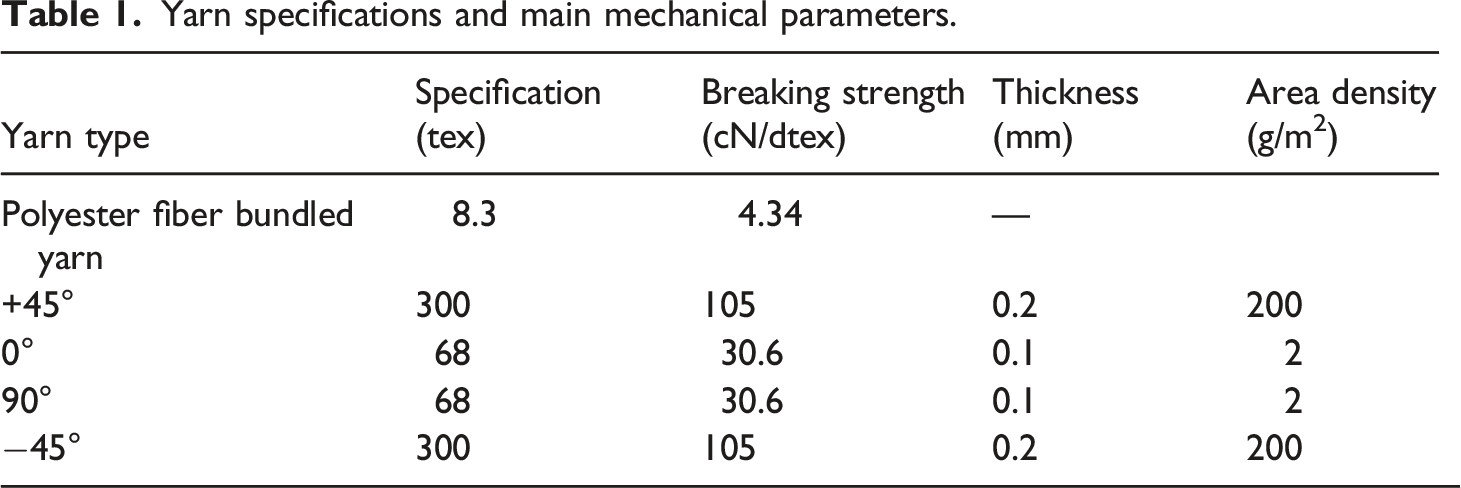
As shown in Figure 1, the 0.1 mm TPU melting point is 120°C, provided by Shenzhen Huimei Plastic & Rubber New Manufacturing Co. High-performance glass fiber multi-axial warp-knitted by Changzhou Xinchuang Carbon Valley Co., Ltd, using high-velocity glass fiber multi-axial warp-knitted machine GEM2-A-S3-L2, machine number E6, machine weaving 101 inches. GB1: polyester fiber as a bundle yarn, cushioning digital 1-0/1-0// full penetration, and then the second layer of +45° direction arrangement of glass fibers, the third layer of 0°direction of glass fibers, the fourth layer 90°direction fibers, fifth layer −45 direction glass fibers. The grammage per square meter of the multi-axial warp-knitted fiberglass fabric is 410 g/m2, and the reinforcement thickness is 0.4 mm. Flatbed vulcanizing machine with China Hebei Xingtai Zhengheng Machinery offers. The detailed parameters are shown in Table 1. Calculations and measurements yielded a fibre volume fraction of 90%, and the flexible composite used a layer of glass fibre fabric as the reinforcement material. Preparation process of multi-axial warp-knitted flexible composites. Yarn specifications and main mechanical parameters.
Material preparation process parameters.

The hot-pressing temperature enhances the degree of penetration of the fabric by increasing the fluidity of the TPU melt, and the hot-pressing time improves the TPU melt’s penetration time to enhance the composites’ mechanical properties. Too high a temperature will destroy the performance of glass fiber, hot-pressing time is too long will lead to the yarn by the TPU being fixed too tight and not easy to slide, weaken the deformation ability of the composite material in the process course of an impact will make the composite material produce brittle damage, Similarly, the hot-pressing temperature is too low, the hot-pressing time is too short, the degree of penetration of the TPU is low, the liquidity of the formation of composite materials is poorer adhesion.
Damage models and equations
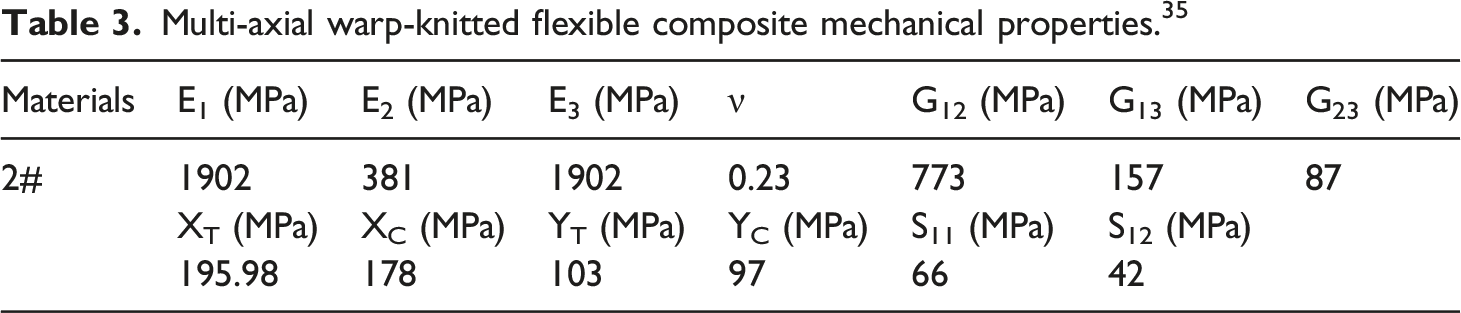
As shown in Figure 2, finite element simulation and analysis are carried out using ABAQUS software, and a macroscopic model of multi-axial warp-knitted flexible composite is established and developed. The low-velocity impact loading process is simulated on the established model using the functional operations in the finite element software. Table 3 shows the parameters related to material mechanics, setting the contact type as general contact and face-to-face contact and the analysis step as “Dynamic, explicit” with a time length of 0.02. Setting the composite boundary condition as fixed around and the number of C3D8R meshing as 32,856, the user subroutine for model damage criterion was written. Simulating the damage process of flexible composites through the written subroutine and comparing the simulation results with the test reveals the damage mechanism and multi-axial warp-knitted flexible composites under low-velocity impacts more comprehensively. Finite element model of the low-velocity impact of multi-axial warp-knitted flexible composites. (a) is hemisphere model, (b) is cylindrical model. Multi-axial warp-knitted flexible composite mechanical properties.
35

During the low-velocity impact on flexible composites, there are multiple failure modes, which include matrix compression failure, fiber pullout failure, and fiber-matrix co-fracture. The strain-based three-dimensional Hashin damage failure criterion in this paper, fiber stretching, compression, matrix stretching, and compression are all material failure forms. The specific equations are as follows
27
:


ε represents the strain in the three directions, the elastic modulus is defined by E1, E2 and E3, the Poisson’s ratio of the material ν = 0.23, and Gij (i, j = 1, 2, 3, i ≠ j) represents the shear modulus in the three directions. In Table 3, XT and YT represent the tensile strength in the X and Y directions, respectively, and XC and YC represent the compressive strength. When the material meets the initial damage criterion, it is determined that the unit begins to experience damage, the material loses its load-carrying capacity, and Stiffness degradation occurs.
Low-velocity impact test
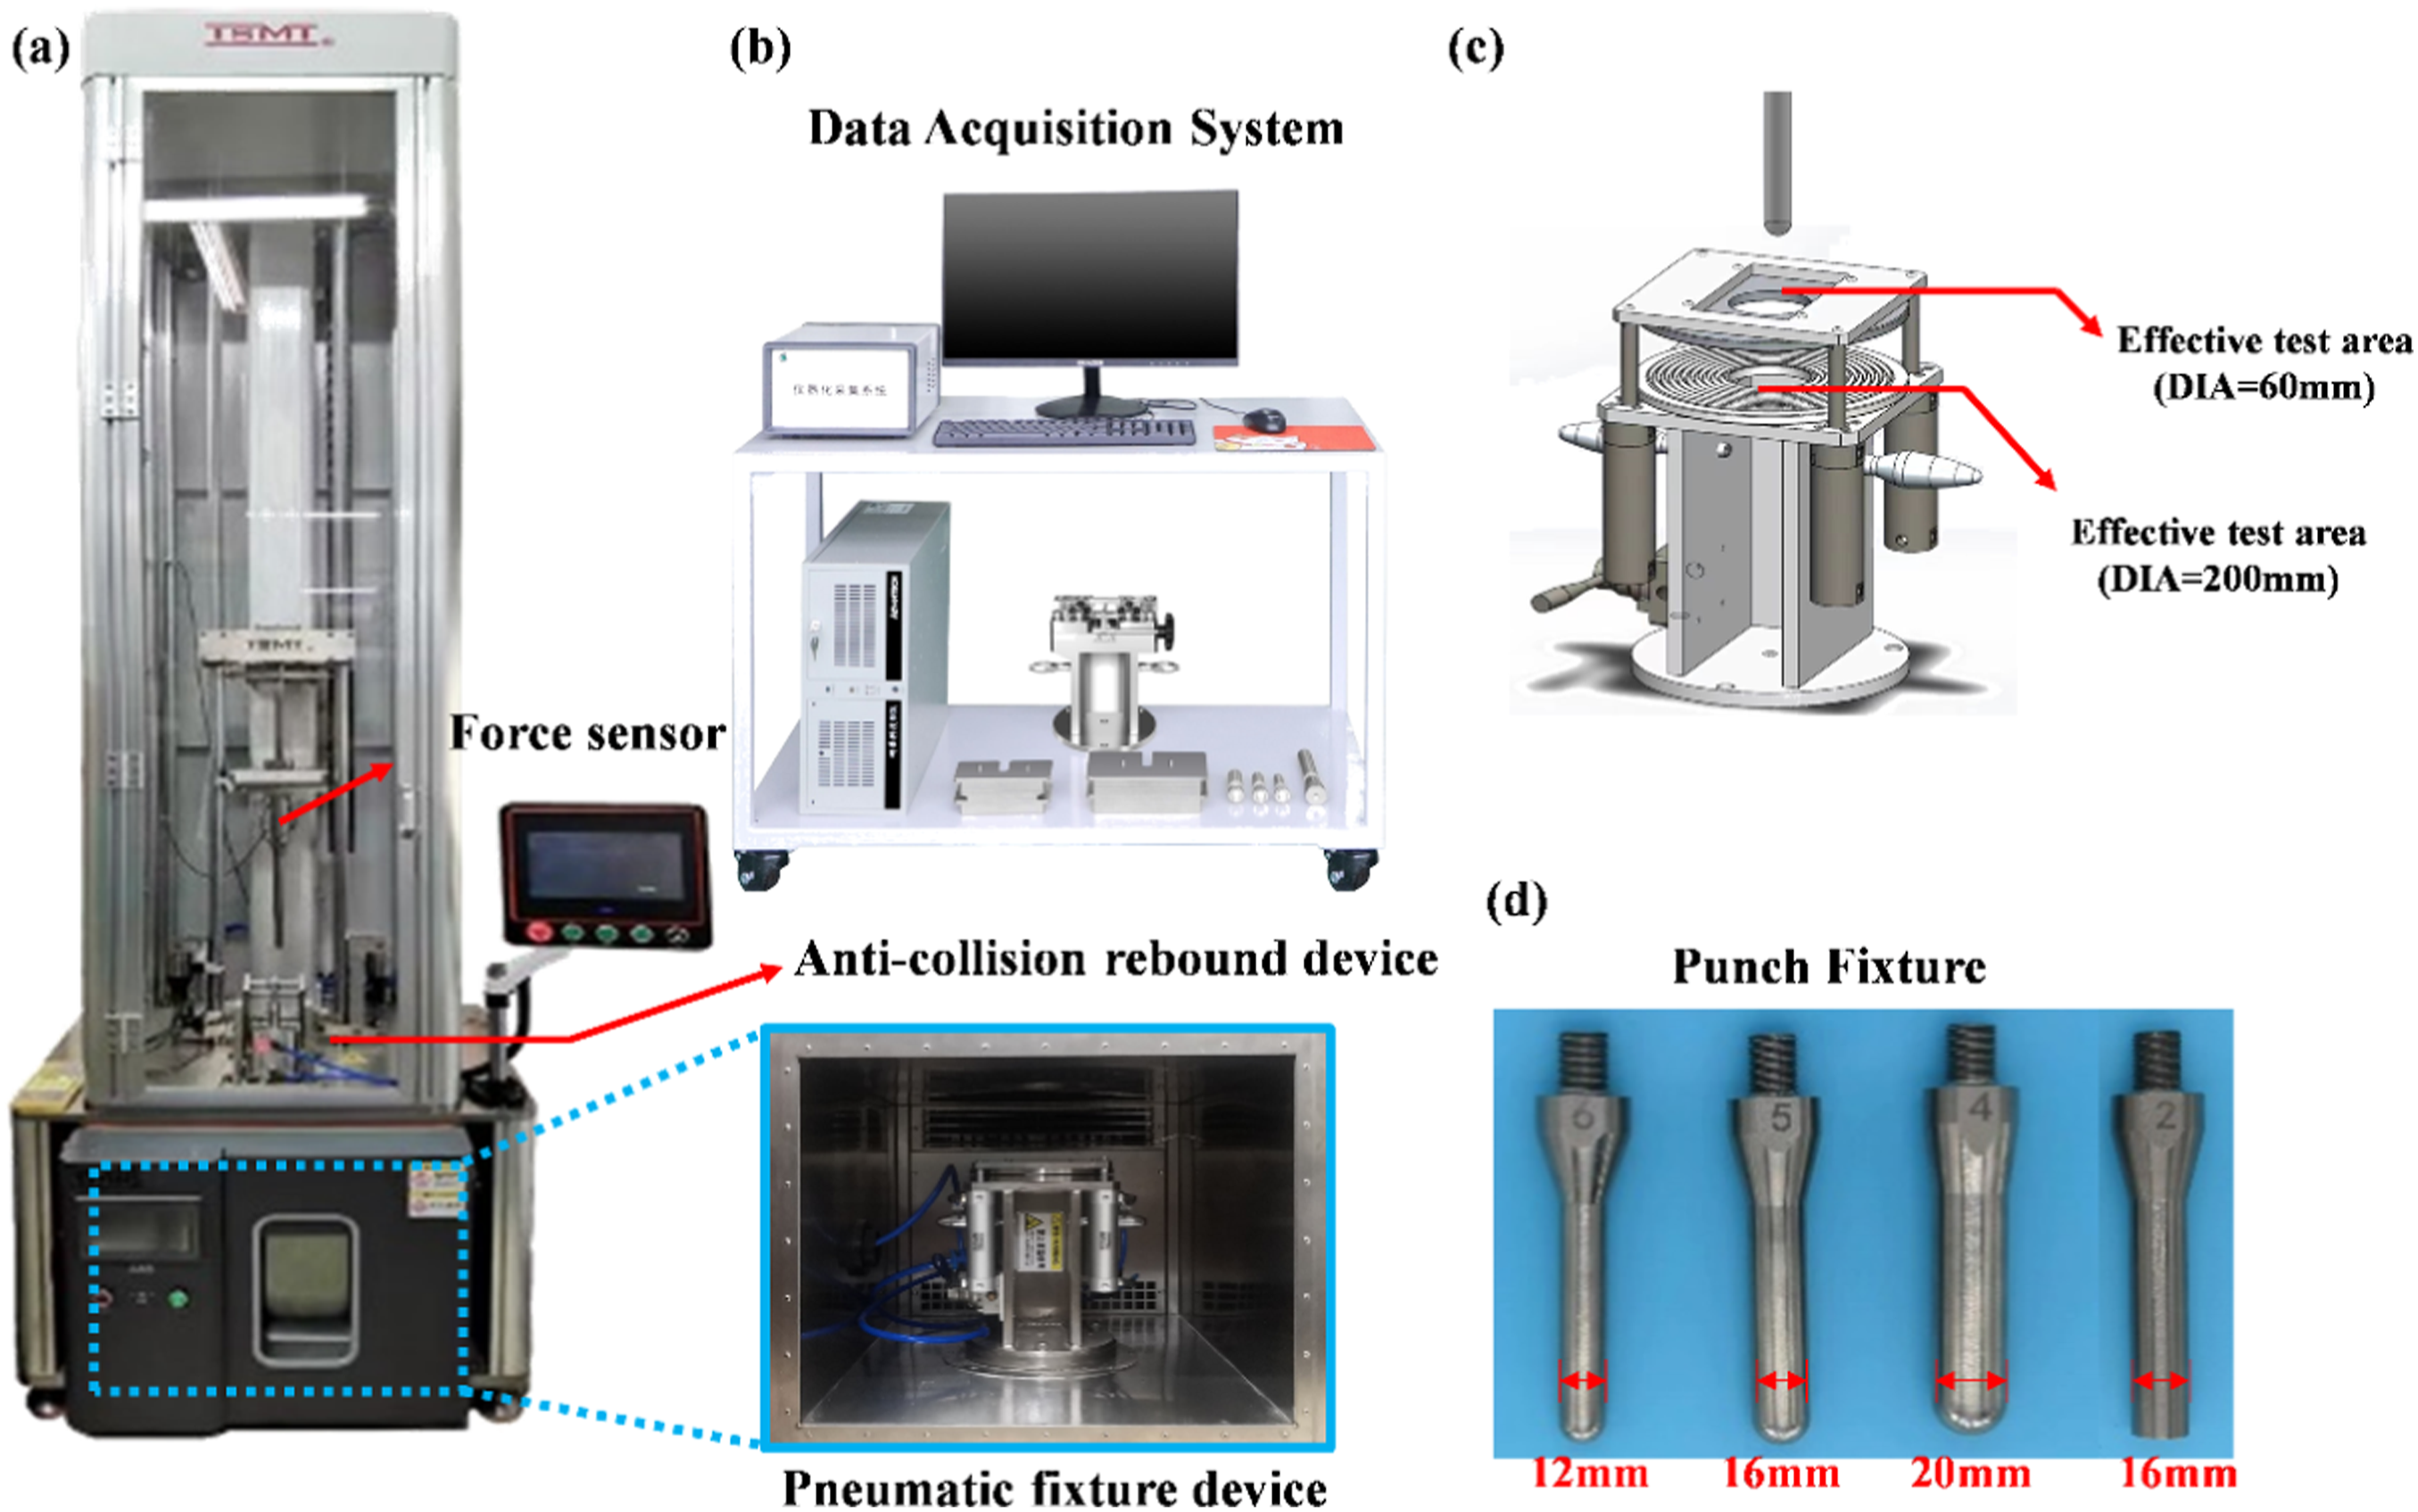
The prepared multi-axial warp-knitted flexible composites were subjected to low-velocity impact testing according to the standard ASTM D7136. As shown in Figure 3(a), the low-velocity impact equipment contains a velocity-measuring device, a pneumatic fixture device, and Figure 3(b) data acquisition system device. The data collector was installed at the connection of the punch to record the signal data during the impact. As shown in Figure 3(c), the fixture is a pneumatic fixture-type base with a bottom diameter of 200 mm and an upper window diameter of 60 mm to carry the sample. Figure 3(d) middle contains steel material hemispherical punch diameter of 12 mm, 16 mm, 20 mm and 16 mm cylindrical punch. The lower window was made serrated to prevent the sample from slipping off. The total weight of the impact pendant was 7.014 kg, and the impact energy was determined as 30 J, 40 J and 50 J by changing the height. A rebound device was installed on the experimental bench to avoid the secondary impact on the sample. Before each experiment on the computer, position the hammerhead and input the set impact energy, and the hammerhead will automatically rise to the corresponding height. Afterwards, the impact button is activated, and the sample undergoes low-velocity impact damage. The sample size is 100 mm × 100 mm, and each sample test would be repeated 3 times. According to the actual operation of the test to calculate the velocity v (t), displacement u (t), absorbed energy E (t) formula is as follows.
36
(a) Low-velocity impact device (b) data acquisition device (c) pneumatic fixture dimensions (d) sample dimensions.


Characterization of impact damage
After the low-velocity impact test, the damage areas of the samples were characterized after the impact. Firstly, the impact damage area, the damage size and the morphology of the samples were observed using an ultra-deep-field 3D microscope, model DVM6A, Leica Microsystems GmbH. Secondly, a non-destructive ultrasonic inspection scan (Hiwave S300) was used to perform an A-scan and C-scan on the damaged samples, and the signal frequency of the localized damage of the samples was collected to calculate the damage area and observe the damage morphology. Finally, the damage patterns and morphology of the material matrix and fibers were observed under a scanning electron microscope (SEM, HITACHISU1510).
Results and discussion
Influence of low-velocity impact properties at different preparation processes and different impact energies
As shown in Figure 4, it contains F-T (force-time) curves, F-D (force-displacement) curves, and E-T (energy-time) curves for samples 1#, 2#, and 3#. By comparing Figure 4(a), when the initial impact energy is 30 J and 40 J, the F-T curve shows an unfolding phenomenon, and when the impact energy is 50 J, the curve shows an increasing and then decreasing trend. In contrast, the multi-axial warp-knitted flexible composites have sufficient time to transfer the stress when impacted by lower initial energy, and the peak force time at 30 J impact is 10 ms; at impact energy of 40 J, the impact force reaches the peak at 8 ms; and at impact energy of 50 J, the impact force reaches the peak at 6 ms to resist the instantaneous drop of the impact force. Sample 1# was punctured at 6.5 ms, Sample 2# at 6 ms and Sample 3# at 7 ms. The difference in time is a short interval, and the sample damage curve trend is the same. The peak force value is around 3000 N. Figure 4(b) F-D curves show both crescent shape and instantaneous failure at peak force. The samples, impacted at 30 J and 40 J energy, showed high impact resistance during forcing. The peak force increased but did not penetrate the sample. The curve-enforcing process had a meandering trend; the displacement could not return to the origin, and the sample produced an irreversible, permanent depression. By comparing the damage pattern of the sample with the initial energy of 30, it was found that the peak impact force of the initial impact energy of 40 J was greater, and the degree of sample depression became larger. When the impact energy was 50 J, the samples were punctured, and the F-D curves showed an increasing and decreasing pattern. Figure 4(c) In the E-T curve, the energy absorbed by sample 1# is lower than that of samples 2# and 3#, and the energy absorbed by samples 2# and 3# is the same value, the impact energy of 50 J after the sample is completely broken through the samples, the samples no longer absorb energy. In the impact E-T curve, it is found that the slope of the curve increases with the increase of impact energy and the impact energy has a negative growth relationship with the impact time. Some impact energy is dissipated due to material damage and plastic deformation, and the remaining energy is returned to the impactor. As the impact energy increases, the damage pattern of the composite changes from depression to penetration. Response curves of samples 1#, 2#, 3# under different energy shocks. (a) is for sample 1#, (b) is for sample 2#, and (c) is for sample 3#.
At different impact energies, the peak resistance impact force of the sample varies considerably. Low impact energy, small peak force, high impact energy, large peak load. Low-velocity impact gravitational potential energy in contact with the sample is converted into kinetic potential energy. The increase in impact energy is followed by an increase in impact velocity, which reduces the stress transfer time of the flexible composite, and the concentrated damage occurring at the impact is more severe. In addition, the low-velocity impact, as a kinetic energy impact, has the same impact force curve trend in a short period. The differences in peak impact force resistance as well as deformation displacement are small, but the damage patterns of the samples are dissimilar. The combination of matrix and reinforcement during sample preparation is crucial. Figure 5 showed that if the interface bonding strength is weak, the force resistance is poor, the matrix and reinforcement interface easily occur between the separation of the sample 1# fibers appeared to be a drawn phenomenon; if the interface bonding strength is too strong, then the flexibility of the composite toughness becomes small, the composite material brittleness becomes large, the sample #3 # matrix fracture and crack extension. If the hot-pressing temperature and time are moderate, Sample 2# matrix and reinforcement jointly resist the impact of external force. Damage morphology of samples 1#, 2#, 3# under impact energy 50 J.
Influence of different diameters of hemispherical punches on low-velocity impact performance
The effect of hemispherical punches of different diameters on the impact resistance of sample 2# was investigated. The diameter of hemispherical punch 4 is 20 mm, the diameter of hemispherical punch 5 is 16 mm, and the diameter of hemispherical punch 6 is 12 mm, respectively. All other things being equal, the maximum peak impact force, the peak displacement, the residual energy, and the percentage of impact consumed energy of the different diameters of the punches are compared. Comparing with Figure 6(a), it can be seen that the peak force of the three different diameters of punches increases linearly with the increase of energy. Under the same initial energy impact, they were divided into two cases: when the sample did not occur penetrating damage, hemisphere five peak force > hemisphere four peak force > hemisphere six peak force. When the sample had penetrating damage, hemisphere four peak force > hemisphere five peak force > hemisphere six peak force. Figure 6(b) displacement peak difference is obvious, also divided into two cases, impact energy 30 J and 40 J, the smaller the diameter of the displacement peak is larger, the impact energy of 50 J, hemisphere five displacement peak value is the largest, the sample in the hemisphere five and hemisphere six under the impact of the penetrating damage, hemisphere four produces a permanent depression. With the energy increase in hemispheres four and 5, the displacement peak gradually increased, and hemisphere 6 decreased. Figure 6(c) shows that the material absorbs higher energy and has better toughness under different diameter punches. The energy absorption rate of hemisphere four punch is around 60%, hemisphere five energy absorption rate is 55%–63%, and hemisphere six energy absorption rate is 50%–70%. Fm, Dm, and Er plots under the impact of hemispherical punches with different diameters.
The ultrasonic C-scan was used to derive the area of damage to the sample and the shape of the damage, and the size of the deformation at the impact of the sample was characterized using an ultra-depth-of-field 3D microscope. As shown in Figure 7, the ultrasonic C-scan showed that punch 4 did not penetrate the sample, but produced a significant depression, and the ultrasonic C-scan could not detect the depression part, which showed a black area. Hemispherical punch because the contact surface for the raised shape, in the impact process, the surface contact force is not uniform, fiber fracture occurred crack expansion, the sample damage gap irregular, but the overall shape is nearly round. The super depth of field microscope observed that the sample damage area and punch diameter greatly influence. It can be seen that the sample damage pattern is related to the shape of the punch, and the larger the diameter is compared, the larger the area of the sample subjected to damage. The two observations yielded essentially the exact extent of damage, as detailed in Table 4. Comparison of damage area of sample 2# (the upper image shows the ultrasound C-scan results, and the lower image shows the measurement results of the ultra depth of field three-dimensional microscope). Sample damaged area.

The damaged samples were examined using ultrasonic A-scan, and based on the images presented, it was determined that the samples could not be detected as signals in the damaged portion of the samples because the samples underwent fracture damage and the waveform graphs did not oscillate. Figure 8(a) shows that sample 2 # −50 J-4 exhibits a clear circular shape under the impact of hemisphere 4, and due to the deep depression, the probe cannot detect the black area. Therefore, A1 and A2 in the Fig indicate no damage here, and the damage occurred at A3. Figure 8(b) shows sample 2#-50 J-5. The wave peaks in the A1 area mean no damage occurred here; according to the observation of the damage of sample 2#, some wave peaks appeared in the A2 area, and the part of the sample near the point of penetration damage also showed depression damage, but no penetration damage; the signal in A3 area showed smooth waveforms and no waveforms, and the sample had penetration damage. At the same time, it can be observed that the sample around the damage point suffers from internal damage caused by the stress transfer. Figure 8(c) showed that sample 2 # −50 J-6 broke due to the punch 6 diameter being too small, the small damage site and the probe detection could touch the broken fiber. Still, the stress transfer expansion area is larger in Fig, which presents a white area for the naked eye that can not be seen in the damage; the damage site is not detected waveform. Waveforms of impact damage on samples with different hemispherical and cylindrical punch diameters. (a) is under 50J-4, (b) is under 50J-5, (c) 0s under 50J-6, and (d) is under 50J-2.
Effect of different punch shapes on the low-velocity impact performance
Sample 2# is taken as an example to investigate the effect of cylindrical shape and hemispherical punch on the impact resistance of multi-axial warp-knitted flexible composites. The two punches are named cylindrical punch 2 and hemispherical punch 5. The projected area is the same as the diameter. As shown in Figure 9(a), among the F-T curves, the failure time of the sample impacted by the cylindrical punch is 5.2 ms, and the failure time of the sample caused by the hemispherical punch is 7 ms. The contact area gradually increases because the hemispherical impact focuses on a certain place. There is a part of the time stress transfer, and the contact area of the cylindrical punch is unchanged from the beginning to the end. After the instantaneous failure, part of the curve showed oscillating fluctuations, which is the resistance formed by the friction between the part of the yarn and the punch. The cylindrical punch is faster to make the sample undergo a short failure time, and the hemispherical punch has a larger peak impact force. In Figure 9(b), it can be concluded that both hemispherical punch and cylindrical punch in the F-D curve are instantaneous failures, and the sample is penetrated. The hemispherical punch produces slightly larger displacement values than the cylindrical punch. In Figure 9(c), the E-T curve among the slopes is the same because of the different shapes; the hemispherical punch consumes more energy during the impact process. Impact response curves for different punch shapes.
Figure 8(d) shows that in sample 2#-50 J-2, under the impact of the cylindrical punch, the sample damage shape is round, with the punch contact area coinciding with a high degree. No waveform signal is detected in the damaged area of A3, and undamaged signal waveforms are detected in A1 and A2. From Figure 10, sample 2 #-50 J-2 can be seen in the delamination area of the fabric and the substrate TPU; it is observed that the sample damage incision is relatively flat because the cylindrical punch contact with the sample surface is flat, the substrate and the reinforcement in the generation of damage, the force is more uniform. It can all be seen that the TPU shed. Sample 2# - 50 J-5 a fine view of the damage map can be observed, the impact load to the middle of a center point of gradual diffusion type damage. Because the punch is hemispherical, the punch contact sample area gradually increases, and there is enough time to transfer stress. Still, the impact point is more severe damage, spreading to the periphery. TPU shedding, fiber delamination fracture damage. Sample 2# damage SEM plot under two punches.
Finite element simulation of different punch shapes
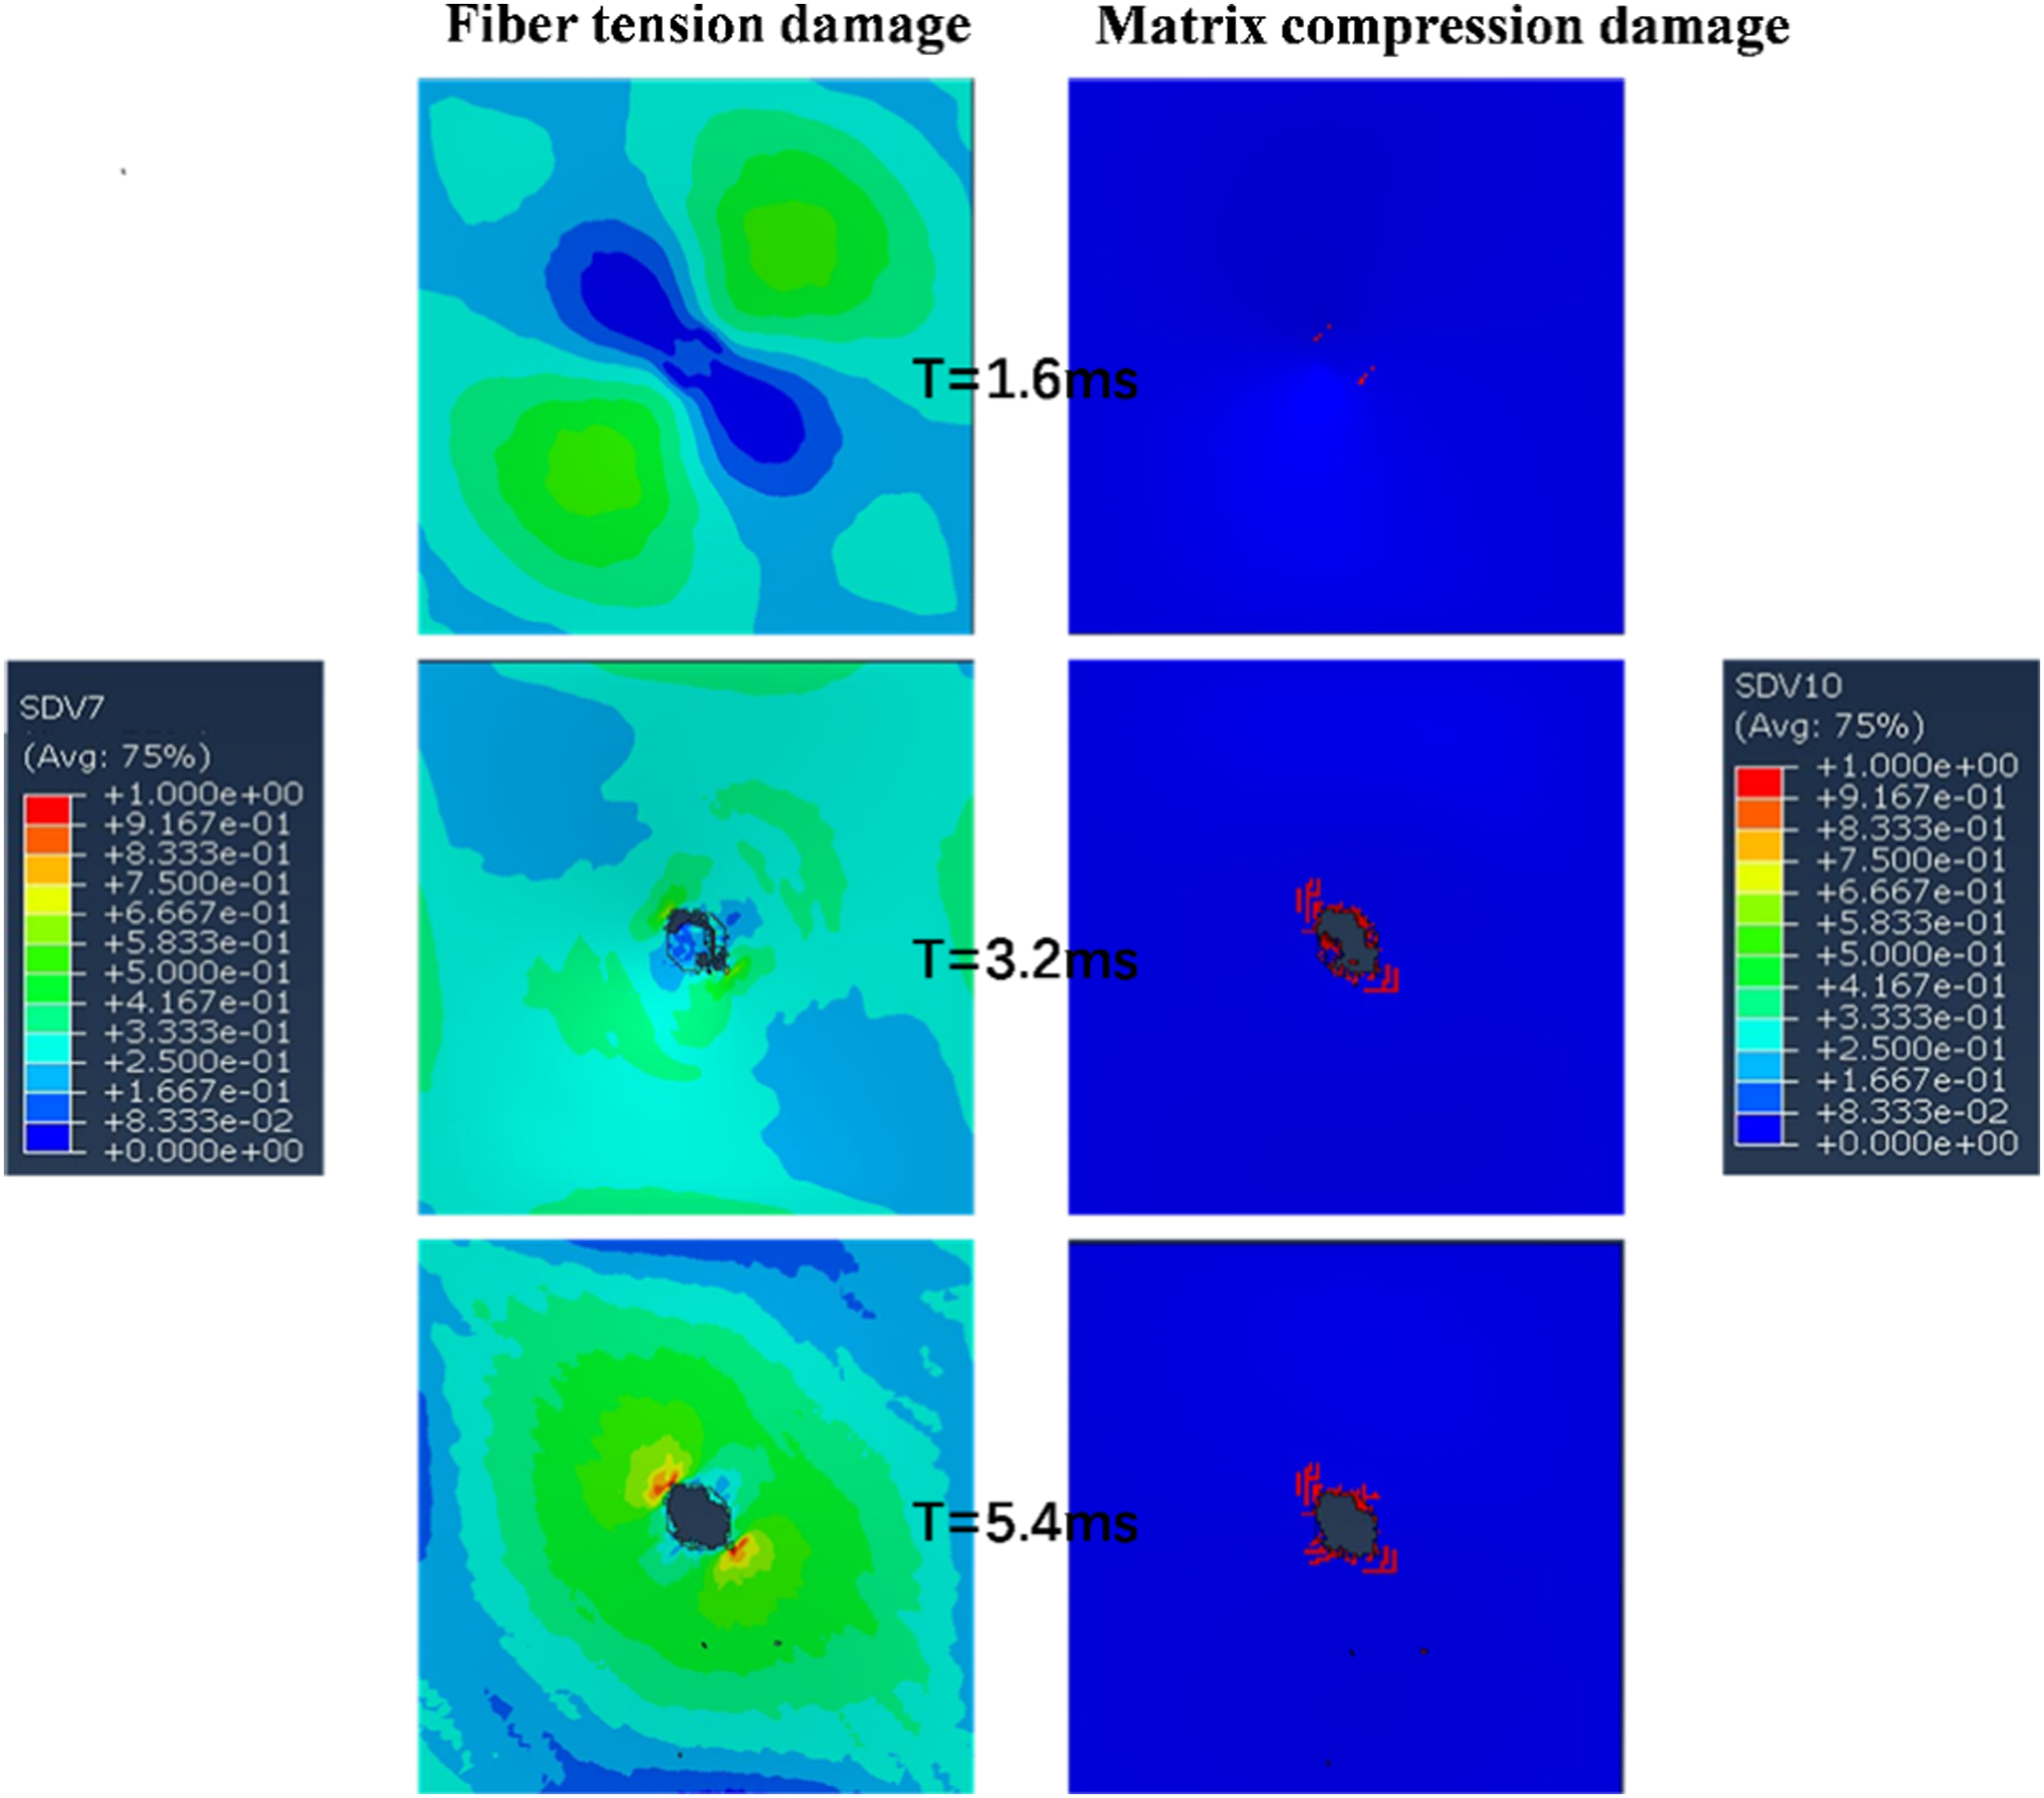
According to the establishment of the finite element model, the experimental simulation of the low-velocity impact of different punch shapes was carried out. These include hemispherical and cylindrical punches, and the two types of punches were impacted with different initial energies to reveal the damage mechanism and damage patterns of these materials. It has been found that once damage begins to occur in a composite material, the evolution of the damage is influenced by the energy expended in the impact process. Material stiffness degradation according to subroutine settings. After damage occurs, the damage variable evolves irreversibly from 0 to 1, and the stiffness of the material damage cell degrades until the material fails and the partition is deleted. Figures 11 and 12 show the deformation and damage of flexible composite fibers and matrix under hemispherical and cylindrical punches, respectively. The damage starts from the point of impact; as time passes with the punch in contact with the material, the damage develops, the damaged area becomes progressively larger, and the transition from compression to tension results in shear stresses through the thickness of the specimen and sample penetration occurs. Damage destruction of cylindrical punches: tensile and compressive. Hemispherical punch damage destruction: tension and compression.
The stress distribution of the flexible composites when impacted with different punches is obtained through finite element simulation. As shown in Figure 13(a), the cylindrical impact head has a large contact area with the surface of the flexible composite, and the contact surface is flat. The stress propagates rapidly in the flexible composite, and the surface of the sample contacted by the punch has the same area as the punch. With the increase of the impact time, the stress is transmitted outward from the contact point boundary in a concentric circle manner, and the ring boundary of the cylindrical punch becomes the largest place to resist the impact force. The impact velocity decreases, and the stress transfer velocity slows down; at this time, the stress transfer showed a larger circle, away from the punch area, the stress is smaller, and the actual test to make a comparison found that the sample damage pattern has been related to the shape of the punch. Comparison with the hemispherical punch samples reveals that the stress transfer is more uniform, and the crack extension area of the samples is smaller. Hemispherical punch due to the punch and material contact area gradually increasing to the contact point as the center of the circle, the impact stress here for the maximum. With the increase in the contact area, the stress is gradually transferred to other areas, flexible composite elasticity is greater, and the sample is not broken through the large deformation of the depression until the sample penetration. At this time, the stress is transferred to the entire sample. Still, with the reduction in the velocity of the impact resistance, the transfer of the stress is slow in the samples occurring in the penetration of the damage, as shown in Figure 13(b) samples of the peak of the impact resistance of the force here. A comparison of the actual samples with the damage revealed that the morphology of the damage was highly compatible. Comparison of stress distribution and damage pattern of different punches.
From Figure 14(a) and (b), it can be seen that the simulation curves are all from the origin because the finite element simulation (FEM) ignores a particular value of the load force generated by the pneumatic fixture on the sample during the actual test operation. The load on the test impact response curve is greater than 0 and the time values are larger than the actual test data because the finite element simulation ignores the air resistance. Figure 14(c) Hemisphere five absorbed energy simulation data is greater than the actual test operation data, mainly because the hemispherical punch contact area is increased with time. In the impact process are fiber extraction, fiber tensile fracture, fiber and matrix co-failure and other modes, and friction between the fiber and the punch. The finite element simulation ignores this phenomenon, so the curve shows that the material absorbs higher energy. Figure 14(d) illustrates that the flat contact area between the cylindrical punch and the material results in less impact from the friction between the fibers and the punch. By comparing two sets of data, it was found that the energy absorption of the experimental material was still higher than that of the finite element simulation curve. This difference can be attributed to the neglect of air resistance and the friction factors between the punch and the material in the simulation calculation process. Sample 2# test and finite element simulation fitting curve.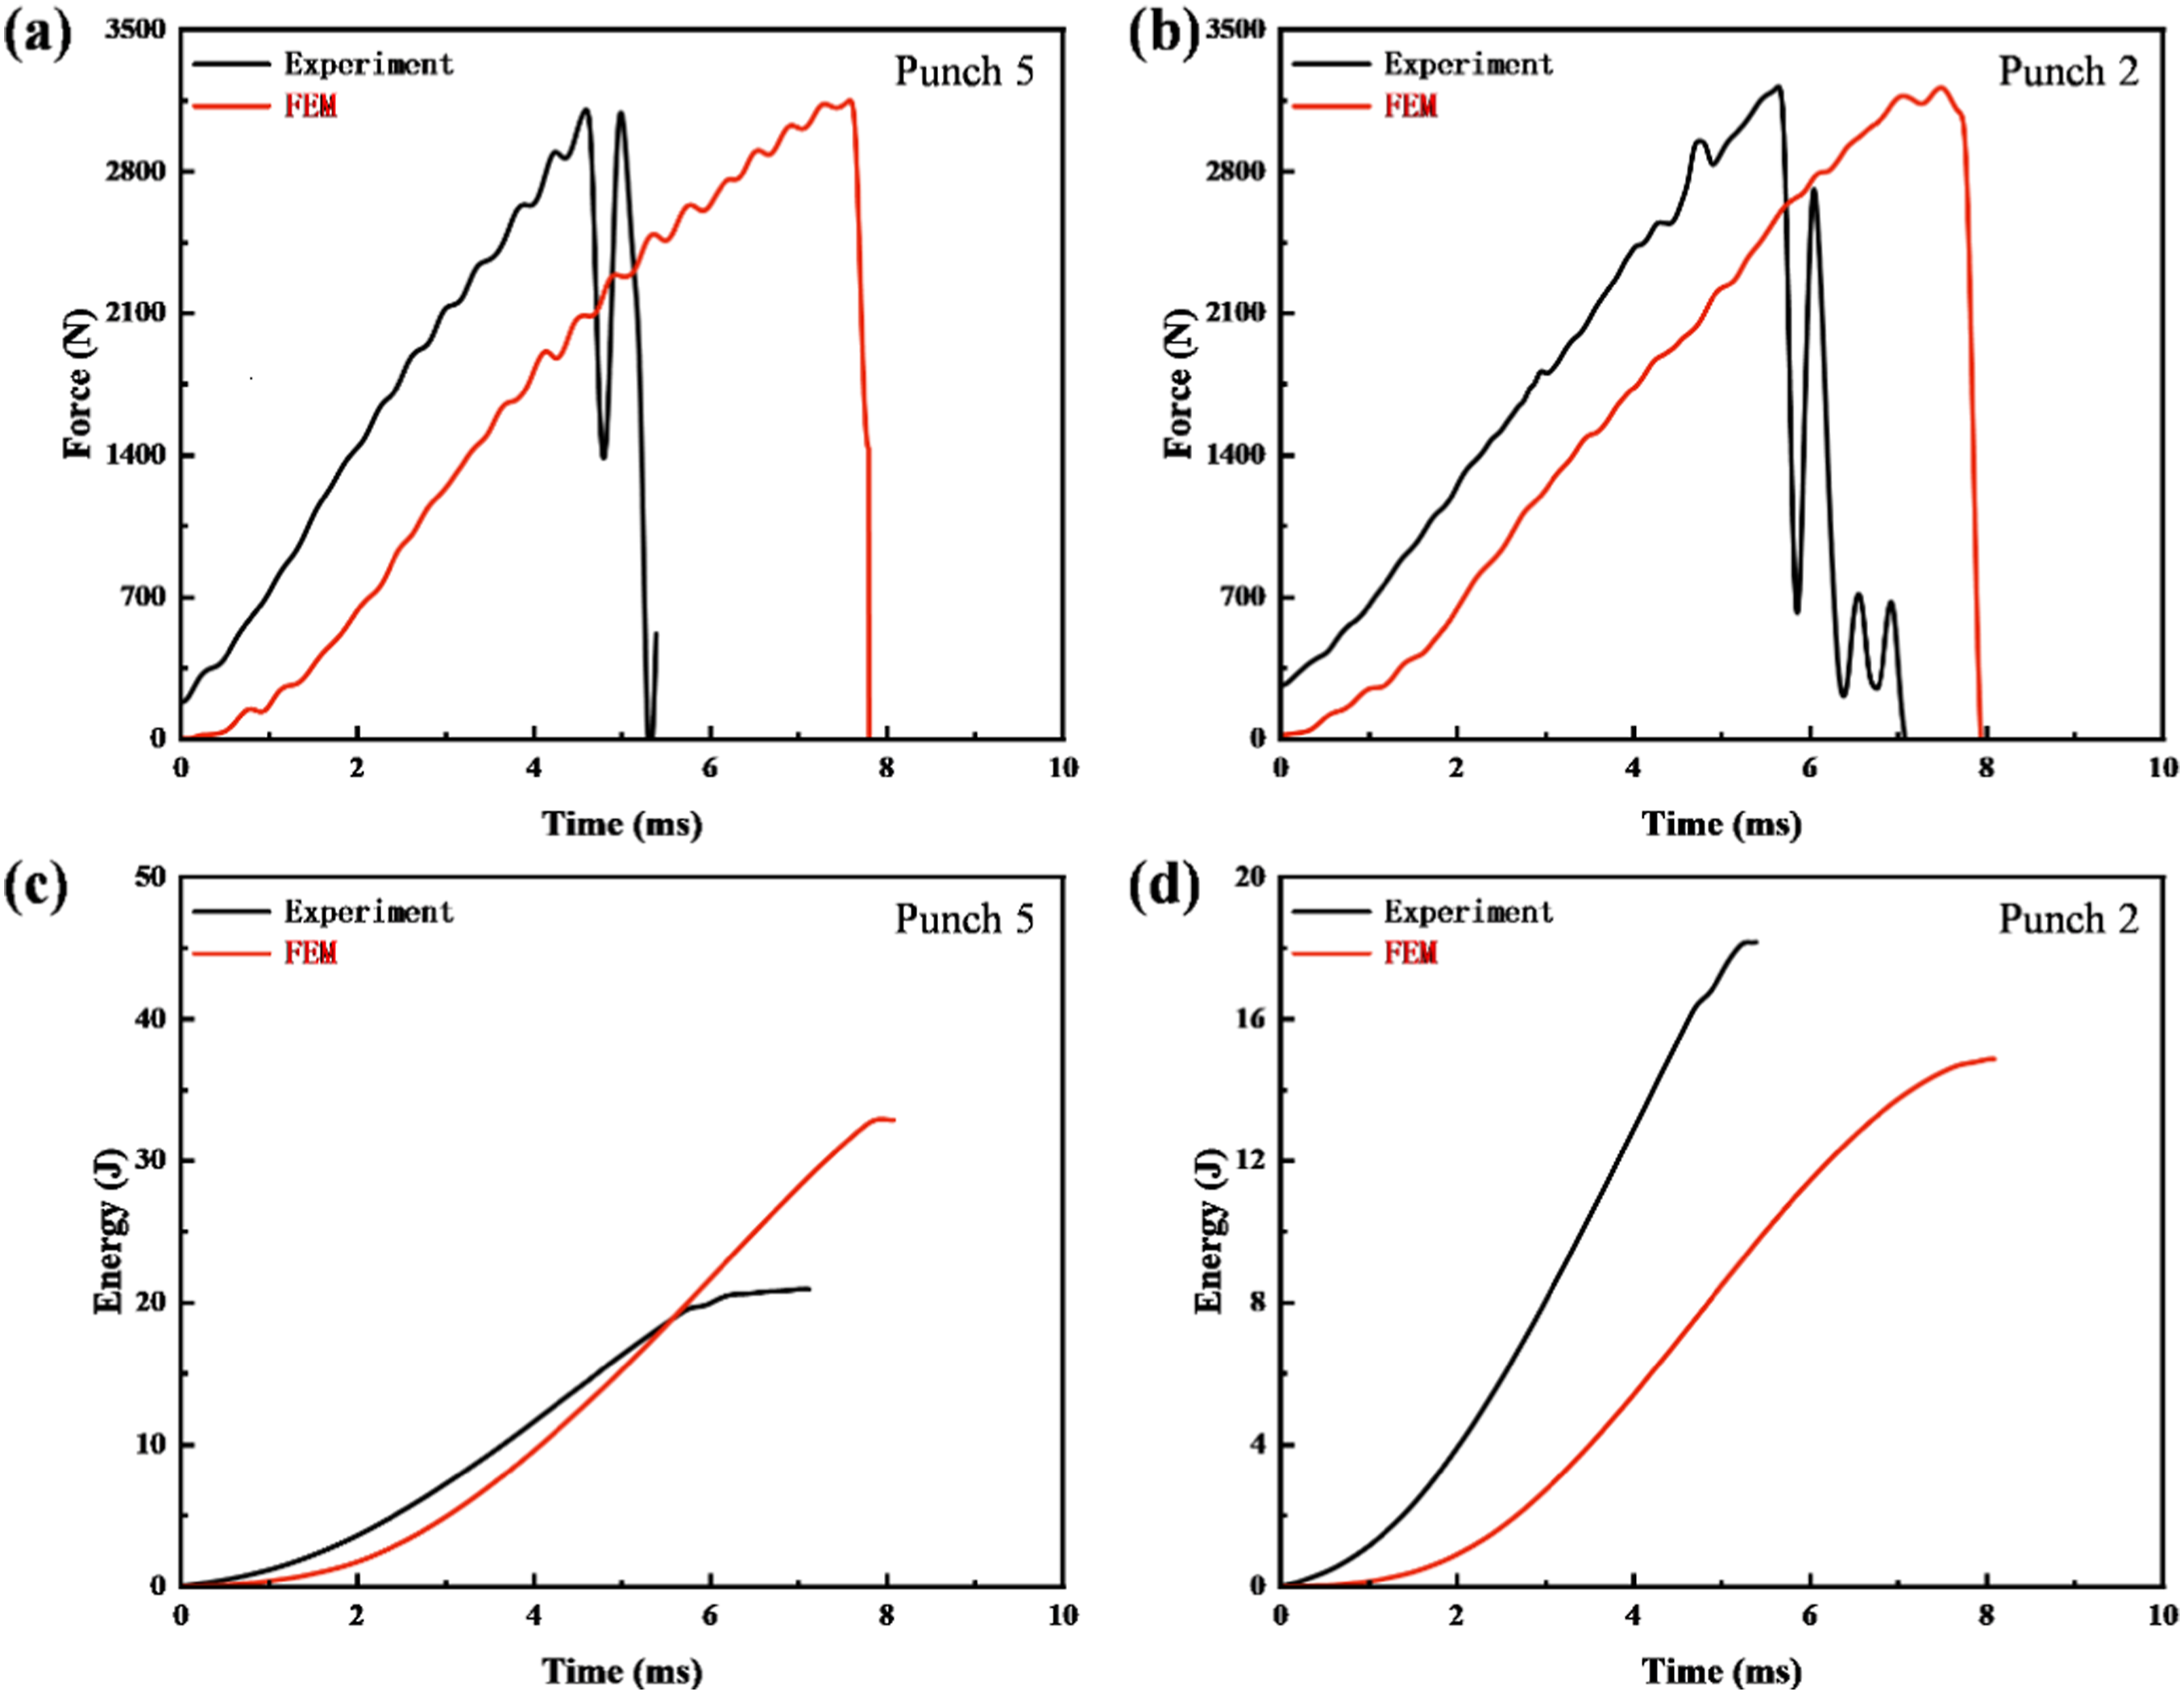
Conclusions
In this paper, low-velocity impacts of multi-axial warp-knitted flexible composites under different loading conditions exhibit different response mechanisms. We analyzed the sample impact damage process and damage morphology. Through experiments and simulations, we have come to the following conclusions. (1) Different preparation processes of flexible composites have little effect on impact resistance. Dynamic forced impact is a transient process, and the response curves of samples are not much different. As the impact energy increases, impact energies of 30 J and 40 J cause permanent indentations and depressions in the sample, and the peak impact force increases. When the sample is subjected to an impact energy of 50 J, the sample shows complete penetration damage. (2) Different diameters of hemispherical punch on the multi-axial warp-knitted flexible composite have a greater impact; the larger the diameter, the better the impact resistance. The higher the peak impact force, the smaller the diameter, the material and easy to produce penetrating damage. (3) Under the cylindrical impact head’s action, the specimen’s damage pattern is a regular circle, and the contact boundary between the punch and the sample is the most serious damage area. Under the action of the hemispherical impact head, the damage pattern of the sample to the end of the test is nearly circular, with the most severe damage at the impact point.
This article’s low-velocity impact test data only represents the laboratory temperature obtained at standard atmospheric pressure. There are still shortcomings, and in the future, low-velocity impact performance tests will be conducted on materials under extreme environmental temperatures to explore their resistance to low-velocity impacts further.
Footnotes
Declaration of conflicting interests
The author(s) declared no potential conflicts of interest with respect to the research, authorship, and/or publication of this article.
Funding
The author(s) disclosed receipt of the following financial support for the research, authorship, and/or publication of this article: The authors acknowledge the financial support from the National Natural Science Foundation of China (52373058, 11972172) and a Project Funded by the Priority Academic Program Development of Jiangsu Higher Education Institutions (PAP).