
Abstract
The diagnosis of neuromuscular diseases is complicated by overlapping symptoms from other conditions. Textile-based surface electromyography (sEMG) of skeletal muscles, offer promising potential in diagnosis, treatment, and rehabilitation of various neuromuscular disorders. However, it is important to consider the impact of load and pressure on EMG signals, as this can significantly affect the signal’s accuracy. This study seeks to investigate the influence of load and pressure on EMG signals and establish a processing framework for these signals in the diagnosis of neuromuscular diseases. The sEMG data were collected from healthy subjects using a textile electrode developed from polyester multi-filament conductive hybrid thread (CleverTex). The textrode was embroidered directly on an elastic bandage (Velcro® strap) placed on volunteer’s muscles while different activities were performed with varying loads and pressure. The collected data were pre-processed using standard techniques of the discrete wavelet transform to remove noise and artifacts. The performance of the proposed denoising algorithm was evaluated using the signal-to-noise ratio (SNR), percentage root mean square difference (PRD), and root mean square error (RMSE). Various signal processing approaches (filters) were considered and the results were compared with the proposed EMG noise reduction algorithms. Based on the experimental results, the fourth level of decomposition for the sym5 wavelets with the Rigrsure threshold method achieved the highest signal-to-noise ratio (SNR) values of 16.69 and 21.91, for soft and hard thresholding functions, respectively. The SNR values of 22.11, 21.54, and 2.78 at three different pressure levels 5 mmHg, 10 mmHg, and 20 mmHg, respectively, indicate the superior performance of wavelet multiresolution filter in de-noising applications. The results of this study suggest that our methodology is effective, precise, and reliable for analysing sEMG data and provide insights into both physiological and pathological neuromuscular conditions.
Keywords
Introduction
Biomedical electrical signals are complex time domain data measured from a biological system. Surface Electromyography (sEMG) is a technique that measures the electrical activity of muscles controlled by the nervous system. Typically, muscular activity can be categorized into two states: contraction and relaxation. EMG signals are widely used in various fields, such as sports science, rehabilitation, and medical diagnoses. However, EMG signals are often contaminated with noise and artifacts due to various factors, such as the effect of load, pressure, and the anatomical and physiological properties of muscles. Therefore, researchers have made extensive efforts to develop better algorithms, improve existing methodologies, and detection techniques to reduce noise and increase the accuracy of EMG signal registration. 1 To properly analyze EMG signals, numerous researchers have employed a variety of advanced methodologies, such as Least Mean Square (LMS) filtering, 2 wavelet transform, Wigner-Ville distribution, independent component analysis, empirical mode decomposition, and higher-order statistics.3–5 Electromyography as a diagnostic method assesses the health of the muscles and nerves that regulate them. Such nerve cells, also called motor neurons, send electrical impulses to the muscles that cause them to contract and relax. EMGs convert these impulses into graphs or numerical data that aid with the diagnosis. 6 When a patient exhibits signs of muscle or nerve disease, a doctor will often prescribe an EMG diagnostic test. These signs might be tingling, numbness, or unexplained weakness of the limb. The findings of an EMG can assist a clinician in the diagnosis of conditions affecting muscles, nerves, or the relationship between the muscles and the nerves. 7
EMG has a variety of uses regardless of medical diagnoses. As a kind of human-computer interaction, it is also used as a gesture recognition technology that enables physical human actions to be input to a computer. 8 Additionally, there are initiatives to employ EMG as a signal for controlling electronic mobile devices,5,9 prostheses, 10 and even flight control systems. 11 One of the many moving things that can be controlled by an EMG-based interface is an electric wheelchair. 12 This may be especially beneficial for anyone who has difficulty using the joystick. There are plans to employ surface EMG readings as a gaming controller. 13 EMG is also a method to determine how a patient is affected by a technological gadget. Engineers creating rehabilitation equipment employ this use of EMG.14–16 Another interesting application of EMG is the recognition of unvoiced or silent speech by observing the activity of muscles associated with the speech apparatus. 17
Characteristics of EMG signals
Muscle activation is not the only source of electromyography signals. Biological, environmental, electrical, and digital sounds, electrical heart rate, electrical contact between skin and electrodes (potentially conceivable) changes based on patient movements, low-frequency offsets caused by analog system input impedance, 50/60 Hz power line noise, and higher spectrum components are a few of them. Identification is based on frequency noise created by the digital output of the electronic device, noise in analog electrical circuits, and sampling period in the high frequency spectrum domain. The signal is rounded and distorted since recorded data is represented digitally due to the specific digital signal processing techniques utilized (spectral leakage, group delay, nonlinear phase characteristics, etc.). 18 EMGs come in a variety of forms. In this work, we focus only on skin-surface sensors-based surface electromyography (sEMG). The major advantage of sEMG is that it is less painful than intramuscular EMG, and this has led to its greater clinical usefulness. 19 The place these sensors are placed and the way the skin is prepared must adhere to specific requirements.20,21 By processing these signals, it may be possible to aid in the diagnosis, treatment, and rehabilitation of various neuromuscular disorders. It is crucial to thoroughly examine the impact of load and pressure on EMG signals, as this can significantly affect their accuracy.
Discrete wavelet transformation
The discrete wavelet transformation involves applying both a high-pass filter (HPF) and a low-pass filter (LPF), with a down-sampler used after each filter to make the transformation efficient. The LPF produces an average signal, while the HPF produces a detail signal, which distinguishes a signal from an approximation signal. The discrete wavelet transforms act as filters in both analysis and synthesis, which is called dyadic discretization. Building filter banks is analogous to discretizing a scale parameter. Each wavelet filter bank under these circumstances functions as a bandpass filter, allowing just a specific range of frequencies. In the process of dyadic discretization, the scale parameter of the wavelet is taken as powers of two, meaning that a translation by a factor of two will stretch the frequency by a factor of two, shift the frequency component by a factor of two, and change the frequency by a factor of two. Each filter bank in this instance has to be different from the others. Each wavelet covers a different frequency range and each step reduces the bandwidth by a factor of two, as shown in Figure 1. A wavelet filter bank.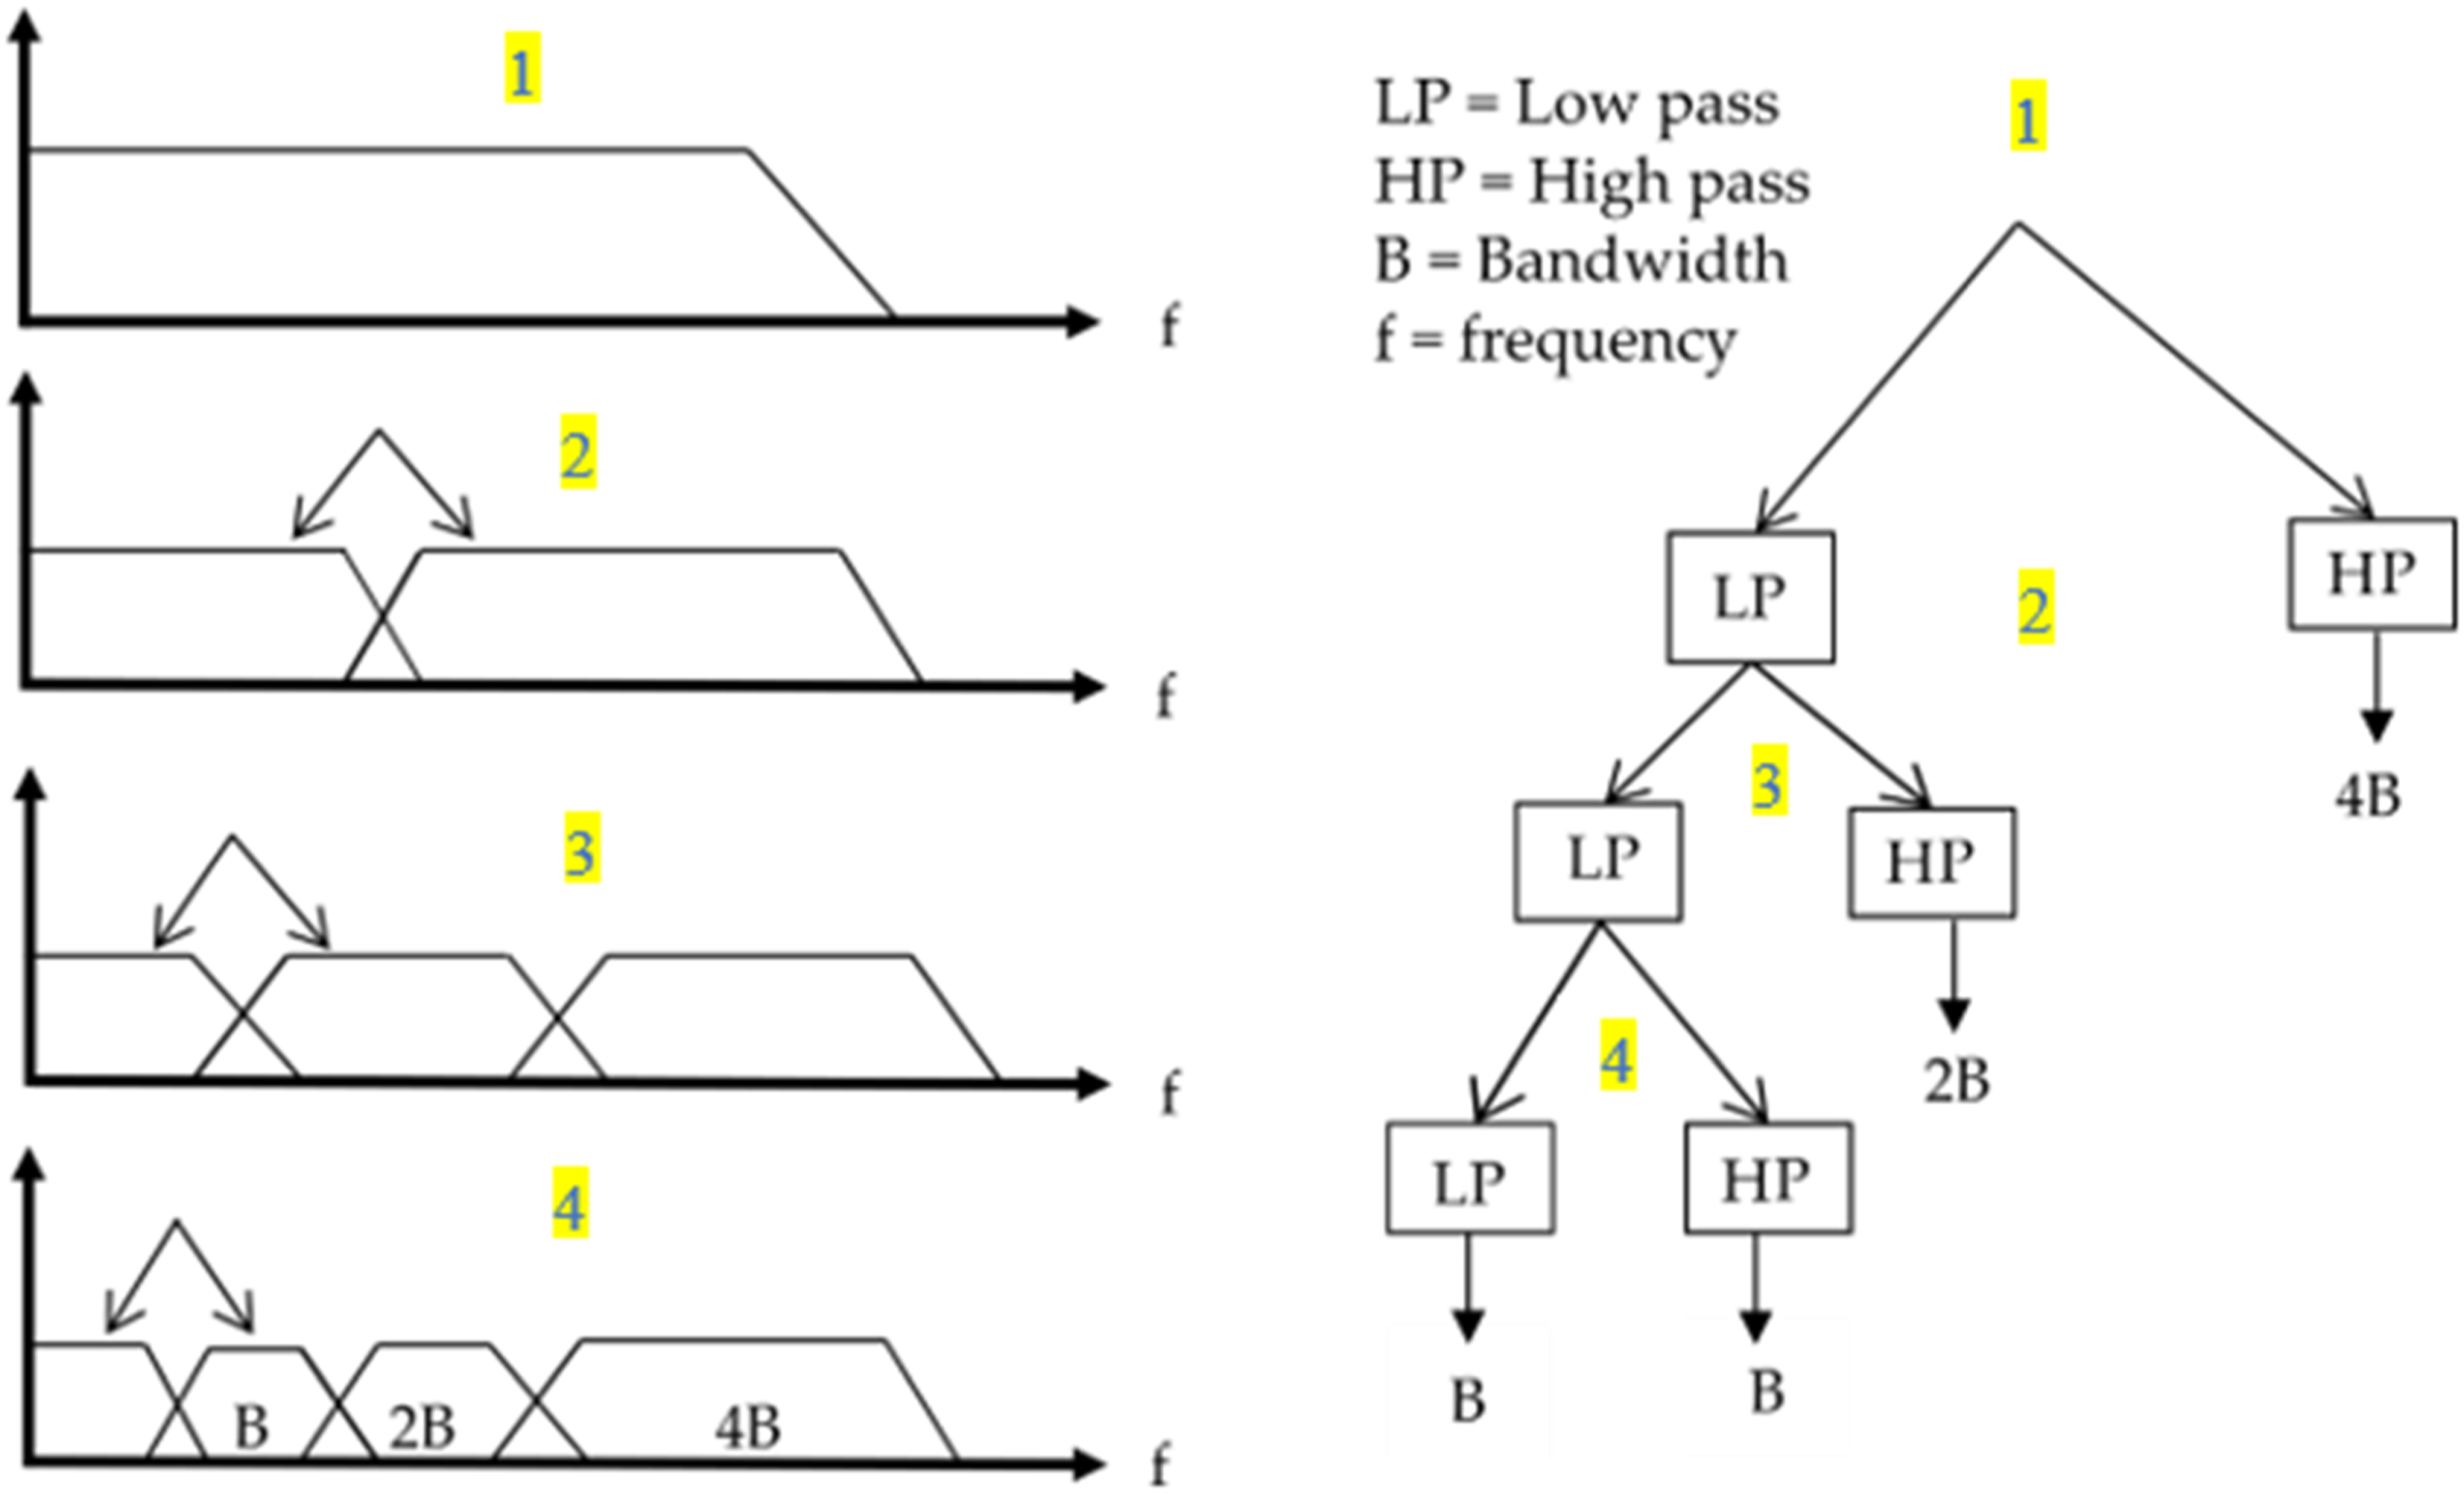
Using successive low-pass and high-pass filtering processes in the frequency domain, the DWT breaks down the signal into its rough approximation and its detailed information. The input signal is split into two half-band frequencies by each filter, with one half band going to the low-pass filter, represented by H1, and the other half band going to the high-pass filter, represented by H0. The lower halves of the frequencies are extracted by the low-pass filter and are referred to as approximation information, whereas the upper half is extracted by the high-pass filter and is referred to as detail information.
The expression for a one-level decomposition is given by the following equations, Implementation of four-level wavelet decomposition, A - approximation coefficients, and D - detail coefficients.


Materials and methods
The developed electrodes were composed of embroidered Polyamide-silver Hybrid Conductive Thread, with support fabric and bobbin yarn. The support fabric is an elastic textile band. The polyester multifilament conductive hybrid thread (CleverTex) was utilized to create the embroidered textile electrodes. To prepare the embroidery region, the polyester multifilament conductive hybrid thread served as the needle thread, while 100% polyester Madeira thread was employed as the bobbin thread. An elastic Nylon + Polyester (black color) based 8 mm bandage, measuring 2.95 × 27.5 inches, and manufactured by BXT group limited, was affixed to the adhesive paper to ensure proper fixation under the embroidery machine. This bandage featured self-adhesive fastener straps, providing comfort and breathability through its mesh design. The design of the embroidered electrodes was accomplished using the Ink/Stitch software, an embroidery plugin for Inkscape. The sEMG data were collected from healthy subjects using a textile electrode developed from polyester multifilament conductive hybrid thread (CleverTex) embroidered directly on an elastic bandage embedded with Velcro. 23 The bandage was placed on the targeted muscle while performing different activities under varying loads and pressures as explained in our previously published work. 23 The durability of the developed embroidered electrode was evaluated via washability, stretchability performance, and compared with the functional electrode. 23 In this work, our main target is to assess the performance of the proposed denoising approach with the addition of random noise to the data.
The proposed wavelet-based sEMG signal processing methods consist of three essential steps. The first is the decomposition of the signal. This is done by choosing a wavelet and computing the signal decomposition at level
To ensure accurate measurements, it is crucial to place a reference electrode in the body area where the muscle contraction activity is low during sEMG recording. sEMG data recording should be conducted in a patient-friendly environment to enhance the patient’s focus on the individual steps of the experiment. As part of this investigation, different sets of sEMG signal samples were collected from the bicep muscles. The block diagram in Figure 3 illustrates how the denoising was performed on the sEMG data using DWT and thresholding approaches. EMG signal denoising procedure.
Database
The experimental research conducted follows ethical standards for scientific research. The study was approved by Jimma University’s Ethics Committee and Jimma Institute of Technology Institutional Review Board, Jimma University. Before agreeing to participate in the study, participants received information about its purpose and training on the recording procedure. Three recording sessions were conducted with two healthy men and one healthy woman aged between 20 and 41 years, with BMIs ranging from 19.6 to 27.4 kg/m2. The skin-electrode contact was placed on the skin and allowed to stabilize for 5 min before data from the biceps muscle were recorded.
24
The participant was seated to collect the baseline sEMG data. To capture the signals of muscular contraction coming from the bicep muscles, the elbow was flexed (flexion) until it reached 90° and then stretched (extension) to 0°. A flexion and extension cycle lasted around 10 s and each participant completed a minimum of 5 cycles. To avoid systematic errors, three volunteers were subjected to four levels of the load effect (0, 2, 4, 6 kg) and four levels of the pressure effect (0, 5, 10, 20 mmHg) in a random sequence. In the load experiment, the participants were asked to lift different weights ranging from 0 to 6 kg in their palm or hand, while the sEMG was recorded as shown in Figure 4. While studying the effect of pressure on sEMG, the blood pressure monitoring cuff was secured upon the muscle of interest, where textile electrode was placed, and inflated to desired pressure values. Schematic representation of the experimental EMG recording setup.
23

Adding random noise
There are several reasons why sEMG signal contamination occurs. Every pollutant has distinctive characteristics that affect how it impacts the EMG signal. Three of the main pollutants that usually cause problems with signal processing are baseline noise, interference noise, and artifacts. Other pollutants such as amplifier saturation, ACD clipping, and quantization may be avoided by using the right tools. 25 Baseline noise (BL), also known as inherent noise, represents the signal detected by the equipment when the muscle is not contracted. 26 It comprises thermal noise, or noise from the amplification system, and is frequently represented as white Gaussian noise (WGN). This indicates that its power is consistent over the whole frequency range. The most problematic and common source of background noise is power line interference (PLI), which is also the subject of most research. The difference in electrode impedances and the displacement current in the cables or in the patient’s body might result in PLI. PLI has a frequency that is centered at 50 Hz (Europe) or 60 Hz (North America), because it comes from power lines. 27
Artifacts, unlike other pollutants, do not always manifest themselves as continuous waveforms (such as abrupt peaks). It may be thought of as alterations in the way the EMG signal is measured. Body movement during recording is the most common source of interference, which can change the impedance of the skin-electrode interface and even induce oscillations due to cable movement, which are referred to as motion artifacts (MAs). 28 MAs that result from changes in the impedance of the skin-electrode interface typically have frequencies between 0 and 20 Hz, but MAs that result from cable motion can have frequencies as high as 50 Hz. 29 Therefore, adding randomly produced noise to sEMG signal is the best technique to examine how it affects the signal.
Signal decomposition
To find the best wavelet family for denoising sEMG signals, this study looked at different wavelet families: Daubechies, Symlets, and Coiflets. The signal was decomposed using the MATLAB Wavelet Toolbox by sequentially applying high-pass and low-pass filters.
30
We used different types of wavelets such as Db (5 and 10), Sym (5 and 6), Coif (3 and 5), whose mother wavelets are, Daubechies, Symlet and Coiflet, respectively. Here, the integer in db5 or db10, such as 5 or 10, respectively, denotes the vanishing points of the wavelet basis function. A vanishing point
Detailed coefficients for short-scale, high-frequency signal components and approximation coefficients for large-scale, low-frequency components are the outcomes of this approach. A comparative study carried out on non-stationary EEG biosignals using different types of wavelet filters suggest. 31 a decomposition level of 5 is sufficient to achieve a MSE of ∼0.01. Similarly, a previous work. 32 on EMG suggests a 4th level decomposition is sufficient for wavelets such as, db2, coif1, sym5, bior2.2, bior4.4, and rbior2.2 for analyzing motor unit potentials (MUPs). Further, a wavelet based denoising study on sEMG for myoelectric control, proposed a decomposition level of 4 for noise ridden signal. 33 Hence, in this study we have fixed the maximum level of decomposition at 4 for all the wavelets being considered.
Thresholding methods and function applied to detailed coefficients
Selecting the correct set of wavelet coefficients for each of the detail signal obtained from the 4 levels of decomposition is essential for efficient reconstruction of the denoised signal. ‘Thresholding methods’ assess the variance of the noise present in the wavelet transformed detail signals at different level.34–37 In this study, four distinct threshold selection methods were used to see how well they performed at signal denoising.38,39 1. Rigrsure: Rigorous SURE minimizes the Stein’s unbiased risk estimate (SURE) to determine the threshold (λ) to be applied at different levels. 2. Sqtwolog: a fixed threshold method which uses factor proportional to 3. Heursure: it’s a mixture of the first two methods, wherein, the minimum of the two methods is used as its threshold. 4. Minimaxi: is also a fixed threshold method which uses a mean-square error based approach. All these methods are available in the MATLAB software toolbox.
Once the threshold value is determined by any of the above 4 methods, the value is passed as an input to the threshold function, which can be either, Hard (HT) or Soft thresholding (ST) type. In hard thresholding, the signals within,
Signal reconstruction
The final step involves executing one-dimensional wavelet reconstruction using specific wavelets or reconstruction filters h and g. Figure 5 shows a signal reconstruction using inverse discrete wavelet coefficients. Model of signal reconstruction using IDWT, here, ‘i’ stands for ‘inverse wavelet transformation’.
Performance estimation
After the denoising process, the performance can be measured by comparing the denoised signal with the original signal. The effectiveness of denoising algorithms has been measured using a variety of techniques. A common metric for determining how much noise is present in a signal is through SNR. The performance of denoising algorithms is also assessed using the root mean square error (RMSE) and the percentage root-mean-square difference (PRD).38,40,41 The SNR, RMSE, and PRD can be formulated as follows,


Results
The proposed technique figures out the best (most appropriate) wavelet algorithm parameters to denoise sEMG signals, which in turn assist the diagnosis of neuromuscular diseases by physicians. To evaluate the effectiveness of the proposed method in noise reduction using the most popular wavelet families, random noise was added to the examined EMG signals. The noise was efficiently removed using DWT at all four levels of decomposition. We employed several wavelet thresholding functions such as hard and soft thresholding with various thresholding methods/rules (Rigrsure, Sqtwolog, Heursure, and Minimaxi), to eliminate the noise from the sEMG signals acquired at different levels of load and pressure. To demonstrate the efficiency of the designed algorithm, other filtering techniques were also considered for comparison Figures 6–10. Wavelet coefficients of input signal (Sym5, Rigrsure rule with hard thresholding): A4 - approximation coefficient, D4 - detailed de-noised coefficient of the fourth level, D3 - detailed de-noised coefficient of third level, D2 - detailed denoised coefficient of the second level, D1 - detailed denoised coefficient of the first level. De-noising of the EMG signal using Db10 wavelets at the 4th level with Rigrsure rule and hard thresholding. De-noising of the sEMG signal using Sym5 wavelets at the 4th level with Rigrsure rule and hard thresholding. Spectrograms of sEMG signals: original/input sEMG signal (left), noisy sEMG signal (middle), and de-noised sEMG signal using sym5, rigrsure method, hard threshold function (right). The presented algorithm is tested using three types of wavelet families, namely, Daubechies, Symlets, and Coiflets at two different orders. Figure 6 shows the wavelet coefficients of the sEMG signal, whereas, Figures 7 and 8 show the effect of the Db10 and Sym5 wavelets on denoising at the fourth level decomposition respectively. Figure 9 shows a spectrogram of the denoised sEMG, which contain the information on the frequency content of a signal and its changes over time. After applying the sym5 wavelet function at the fourth level using Rigrsure method and hard thresholding, the EMG signal improved psycho-visually in the resulted denoised sEMG spectrogram. Figure 10 shows the performance of the noise elimination based on SNR for different types of wavelets (Db5, Db10, Sym5, Sym6, Coif3, Coif5) with two different thresholding functions (soft and hard) for sEMG signals under different loads (0 kg, 2 kg, 4 kg, 6 kg). The pressure and the threshold method were 5 mm Hg and Rigrsure, respectively. The SNR values represent the ratio of signal power to noise power, where the higher values indicate better performance in terms of noise reduction. For all loads and thresholding functions, the Sym5 wavelet showed the highest SNR value. Similarly, for pressures of 10 and 20 mmHg, the average values of the signal-to-noise ratio (SNR) for each combination of wavelet type were evaluated (see supplemental information Figure (S)I1 and Figure (S)I2). SNR results obtained with a denoised sEMG signal of different wavelet functions at the 4th level of decomposition with the Rigrsure threshold selection rule and pressure was kept at 5 mmHg.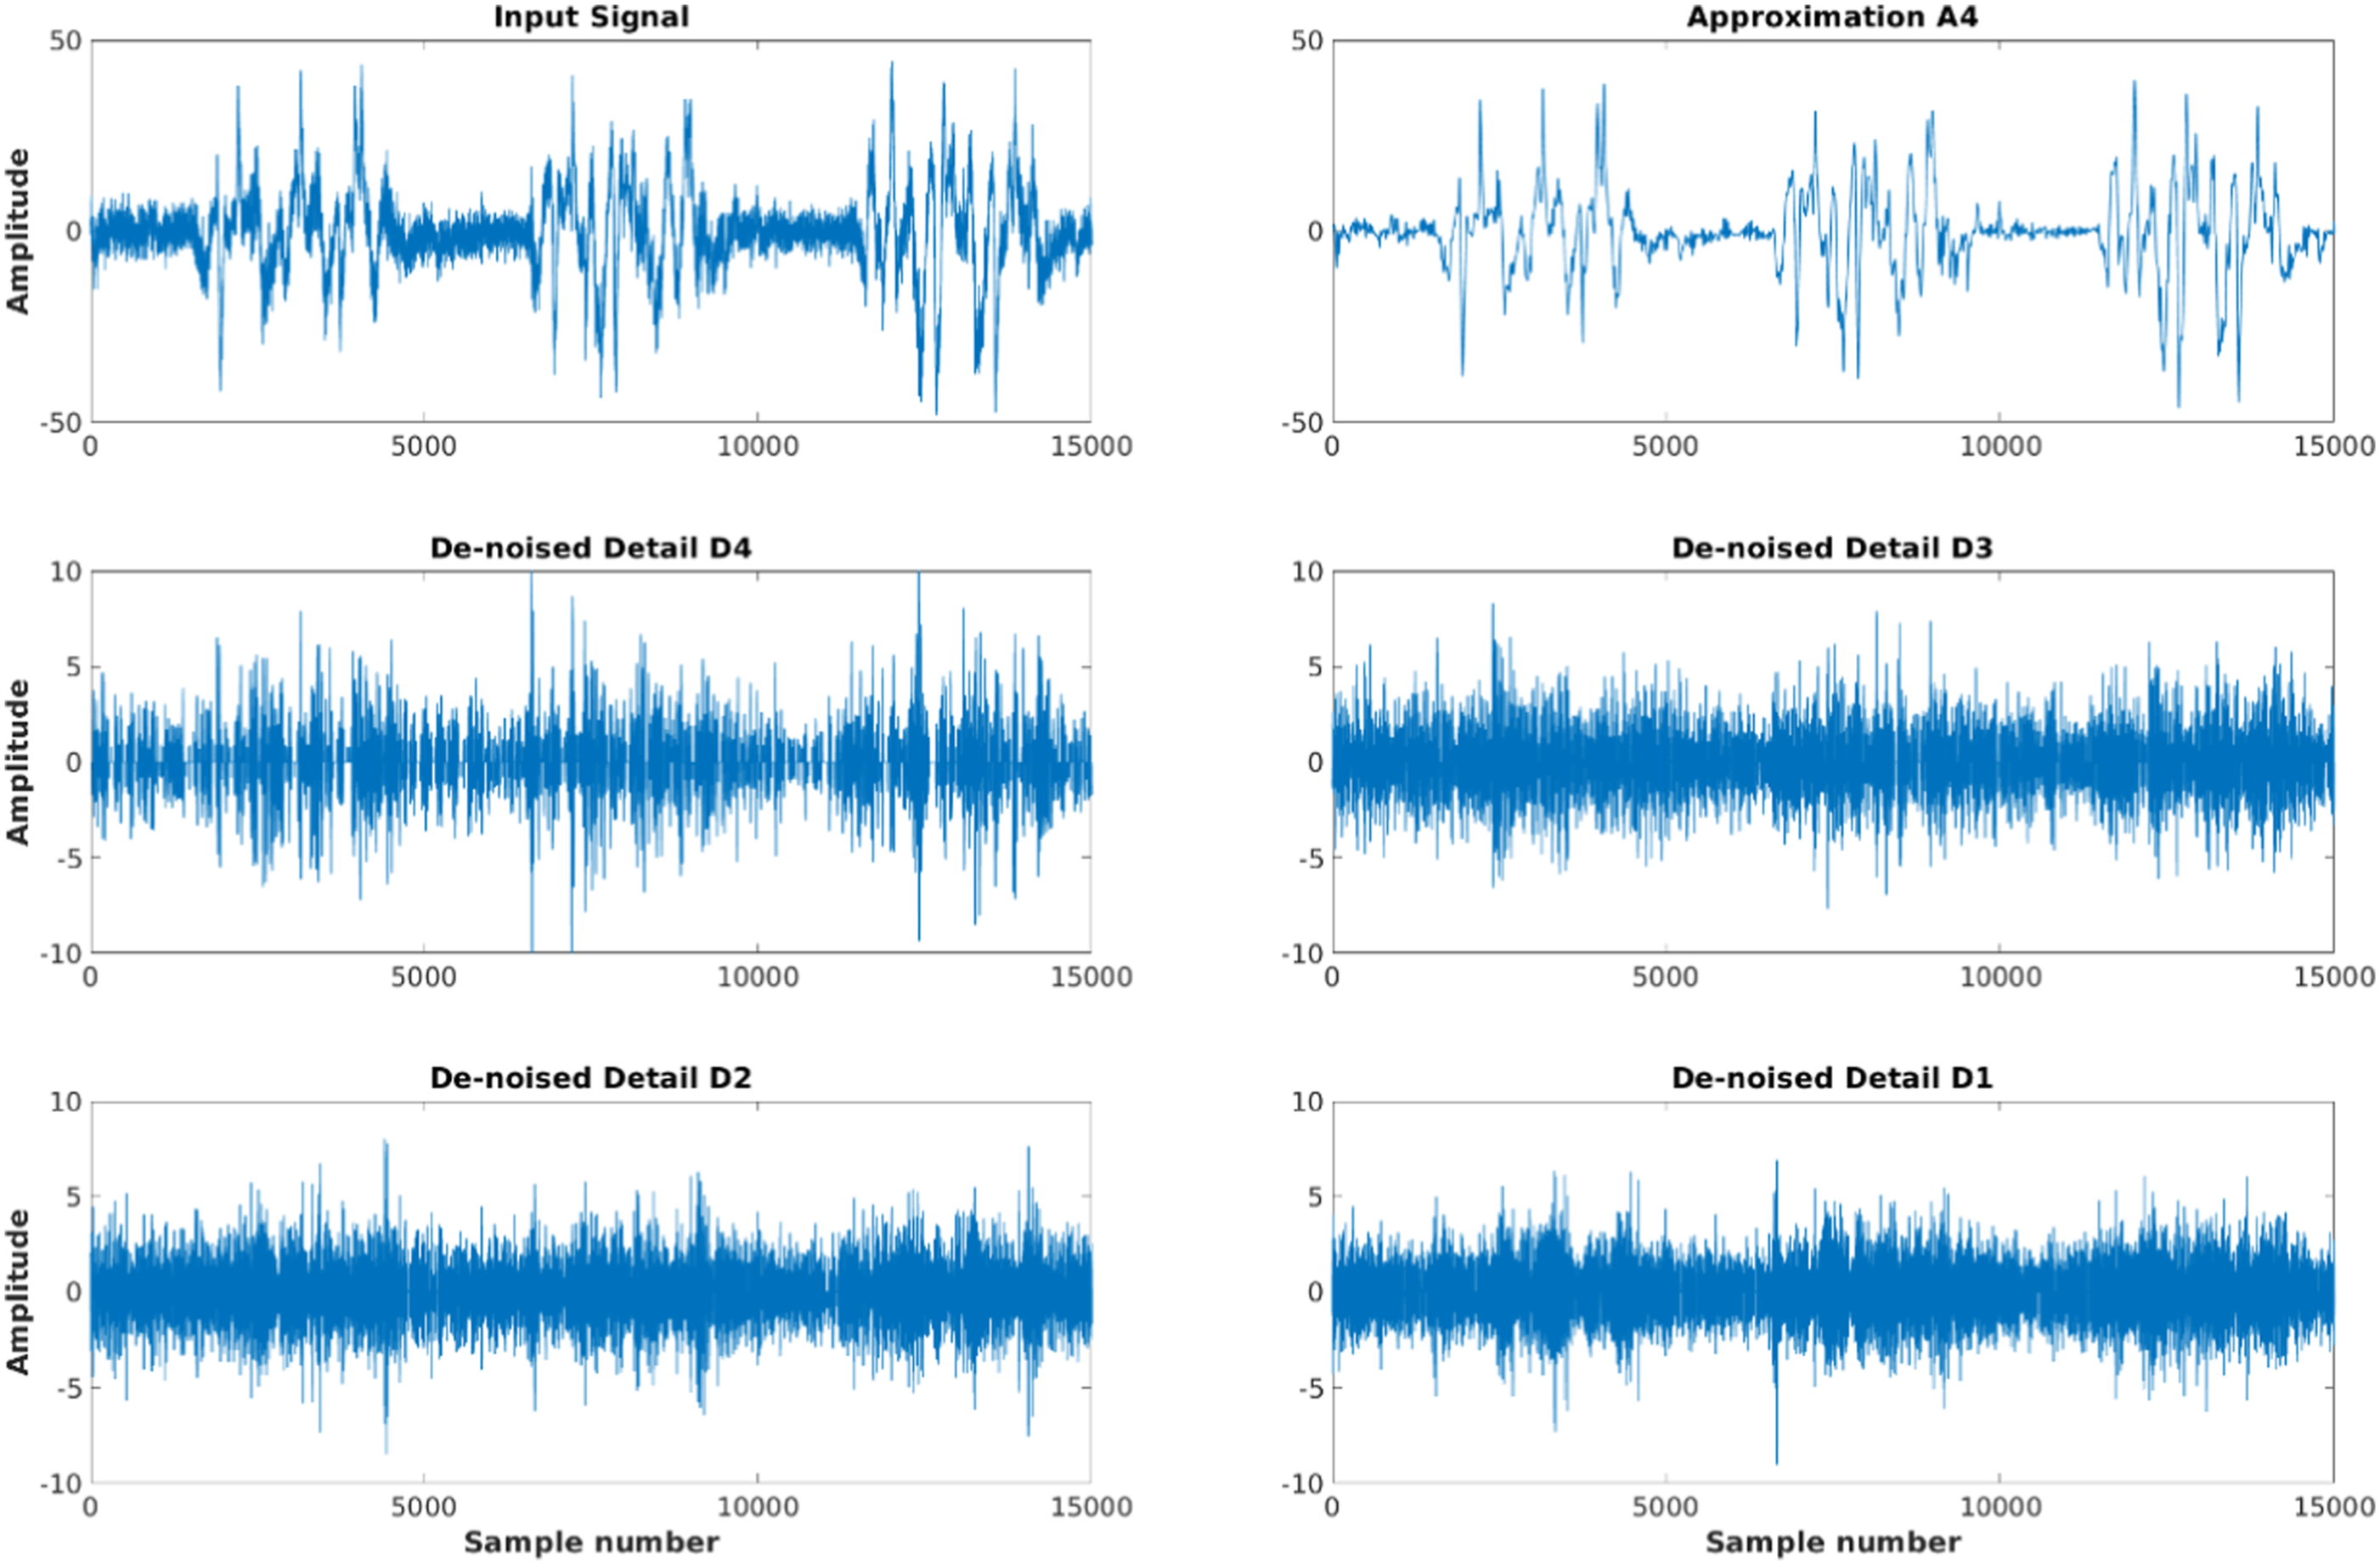


SNR, RMSE and PRD values obtained using the sym5 wavelet function at the 4th level decomposition with the soft thresholding function.

SNR, RMSE, and PRD values of the four threshold selection rules for denoising some sEMG signals using the sym5 wavelet function in fourth-level decomposition with hard thresholding method.

SNR values of filters used in sEMG signal preprocessing with a load of 2 kg and different pressure values.


SNR values of different types of filters used in sEMG signal preprocessing with a load of 2 kg.
Discussion
While textile electrodes offer various advantages, there are several challenges that need to be addressed for their effective use in biomonitoring applications. Ongoing efforts to tackle these challenges, are focused towards evaluation of signal quality in different scenarios before integrating textile electrodes into garments. In this study we compared compared the efficiency of three different wavelet families using four different thresholding methods (selection rules) and two threshold functions (soft or hard), with other filters (like Butterworth, Equiripple, IIR, and FIR). The Wavelet based denoising of signals requires proper choice of basis wavelet function (db, sym, coif, etc), thresholding method (Bayes, SURE (rigorous-SURE, heuristic-SURE), BlockJS, minimax, FDR, Universal etc.) and thresholding functions (hard, soft). Several functional properties of a wavelet determine its suitability for denoising application. Some of these are, the orthogonality of basis function, symmetry, number of vanishing points, support for translating into digital filters, differentiability (regularity) etc. All three wavelets used in this study (db, sym coif) have their unique scaling function and their wavelets are orthogonal to its scaling functions. This suggests that the reconstruction (synthesis step) of denoised signal after decomposition and thresholding (analysis step) will have minimal artifacts. The symmetric shape of a wavelet determines its phase property when designed as a digital filter. In other words, the phase of the output signal will vary, depending on the frequency of the input signal. Linear phase variation is desirable, compared to a non-linear phase change with increasing frequency. Db uses an asymmetric basis and exhibit non-linear phase characteristic compared to nearly symmetric, sym and coif wavelets which exhibit nearly linear phase change. The vanishing points are denoted by the numerical following the wavelet name, for example, db5 has 5 vanishing points. The more the vanishing points the smoother/regular the wavelet shape would appear but with more oscillations. Additionally, the vanishing point of a wavelet determines the number of points of the digital filter (or its impulse response) required for hardware realization.
42
In our analysis, the differences observed among the performance parameters for different wavelets, that is db or sym or coif, were not significant compared to the effect of different thresholding method (Rigrsure, Heursure, Sqtwolog, Minimax) or the threshold function (hard, soft). The Rigrsure based thresholding method with the hard thresholding function outperformed all the other combinations. The superior performance of hard over soft threshold functions have also been previously reported for a wavelet based denoising study conducted on neural signals.
43
The thresholding methods used for the determination of the thresholding value is also critical for effective denoising. The Rigrsure, calculates the “Stein’s unbiased risk estimate” for each level (detail: D1, D2, D3), and determines the threshold value,
Conclusions
The proposed technique for denoising sEMG signals using wavelet algorithms has shown promising results in eliminating the noise from the signals. The efficiency of DWT was compared with other filtering techniques for preprocessing sEMG signals with varying levels of pressure and load. The performance of different wavelet families, thresholding functions, and threshold selection rules is evaluated in terms of various metrics such as SNR, RMSE, and PRD. The Wavelet multiresolution filter consistently outperformed the other filters in terms of SNR values, while the Butterworth filter consistently showed lowest SNR values. The studies demonstrate the effectiveness of wavelet thresholding techniques in removing the noise from sEMG signals and suggest the correct choice of wavelet family and thresholding method, for better denoising applications. Moreover, additional evaluations on larger sEMG data obtained with higher loads and pressures would be required to further validate our findings.
Supplemental Material
Supplemental Material - Discrete wavelet transform based processing of embroidered textile-electrode EMG signal acquired with load and pressure effect
Supplemental Material for Discrete wavelet transform based processing of embroidered textile-electrode EMG signal acquired with load and pressure effect by Bulcha Belay Etana, Ahmed Ali Ali Dawud, Benny Malengier, Sitek Wojciech, Wendimu Fanta Gemechu, Janarthanan Krishnamoorthy and Lievavan Langenhove in Journal of Industrial Textiles
Footnotes
Declaration of conflicting interests
The author(s) declared no potential conflicts of interest with respect to the research, authorship, and/or publication of this article.
Funding
The author(s) disclosed receipt of the following financial support for the research, authorship, and/or publication of this article: This work was supported by the NASCERE program, funded by the Ethiopian Government. The authors would like to extend their gratitude for this support.
Informed consent statement
Informed consent was obtained from all subjects involved in the study.
Institutional review board statement
The study was conducted in accordance with approved by the Institutional Review Board (or Ethics Committee) of Jimma University MSC/JiT/16/2014, 24 February 2022).”
Supplemental Material
Supplemental material for this article is available online.
References
Supplementary Material
Please find the following supplemental material available below.
For Open Access articles published under a Creative Commons License, all supplemental material carries the same license as the article it is associated with.
For non-Open Access articles published, all supplemental material carries a non-exclusive license, and permission requests for re-use of supplemental material or any part of supplemental material shall be sent directly to the copyright owner as specified in the copyright notice associated with the article.