
Abstract
Conductive fibrous assemblies and yarns play a crucial role in wearable electronic textiles (e-textiles), through their use in flexible sensors and interconnects. This study investigated the influence of yarn twist and geometrical parameters on the electrical properties of silver-coated nylon multifilament yarns, ranging from 1-ply to 4-ply, with twist levels of 30 twists per meter (TPM) and up to 600 TPM. Increase in twist level resulted in decreasing yarn linear resistance, with a plateau at 300 TPM, along with limiting values for yarn specific volume (1.6-1.9 cc/g), and fibre orientation angle (12-18°). The increase in yarn conductivity with higher twist was explained by greater contact between the fibrous assembly, that bridges electrically conductive pathways in the yarn structure. Twisted yarns (2-ply) were fabricated into electrode structures via embroidery, and a progressive increase in contact impedance was observed, followed by a stabilization and plateau within the range of measured impedance from 210 to 300 TPM. This observation was attributed to the decrease in the yarn specific volume, and subsequently the longitudinal diameter with increasing twist level, which decreased the contact area between the skin and electrode interface. The electrodes fabricated from varying yarn twist levels were used for electrocardiogram (ECG) measurement, and demonstrated comparable signal quality to standard gel electrodes. This experimental and theoretical work forms the basis in defining relationships between established yarn twist mechanics and geometrical properties with electrical properties. This can guide materials and design parameter selection of suitable conductive yarns for e-textiles used in biopotential monitoring applications.
Introduction
Electronic textiles (e-textiles) are conductive fiber-based materials with integrated electronic functionality that may be capable of providing passive sensing, actuating sensors, communications, and data processing. 1 In general, their form factor is advantageous for on-body applications, given their flexibility, breathability, and ability to conform to the skin, which make them ideal for sensor networks in multimodal health monitoring applications. E-textile materials comprise fibres, filaments, and yarns in woven, knitted, or non-woven structures. The hierarchical structure of textiles, encompassing fiber and yarn to fabric levels, plays a crucial role in designing textile electrodes.2,3 Conductive functionality of e-textiles can be integrated at any level of the textile structural hierarchy, through methods such as the addition of metals (twisted wires), conducting particle dispersions, metallic coatings of polymeric yarns and fabrics through plating methods, dip coating, chemical polymerization, physical vapour deposition, or printing/patterning layers onto a fabric substrate.4–9
This work focuses on metal-coated polymeric filaments and yarns used for e-textile applications. Coating techniques commonly used to metallize polymeric filaments and yarns include vacuum deposition, electroplating, electroless plating, or ion plating10,11 of conductive metals such as silver, copper/nickel, or gold. These methods yield yarns with good conductivity for e-textile applications (10−6 to 0.5 S/cm), 12 with uniform coatings, and good mechanical properties.11,13 Ag-coated nylon yarn is one of the most used conductive yarns for e-textile applications, owing to its wide commercial availability.13–15 Studies have employed commercially sourced silver-nylon yarns and fabrics in knit, woven, and embroidered fabric structures for on-body sensing applications such as heart rate monitoring.16–22
Yarn assemblies comprise continuous filaments spun into yarns, and used in textile structures or as individual threads, which can be arranged or formed through twisting (helical arrangement of fibers around yarn axis) in static lengths or continuous feeding.23,24 Twist may impact yarn strength properties, by improving fiber contact and coherency within bundles, with some applications requiring specific yarn twist levels. Staple fibre yarn properties tend to increase with twist through spinning, while continuous filament yarns may exhibit decrease in strength with greater twist level. 25 Higher twist level is also used to improve fabric hand feel, appearance, and the resistance of fibre bundles to abrasion and pilling, namely when yarns are constructed into fabrics.25,26 Established theories and studies relating yarn parameters including specific volume, packing densities, geometry, and yarn twist from different fiber types have been developed in the last century, which contribute to the understanding of and ability to predict yarn mechanical properties, packing geometry, and subsequent behavior in textile structures.25–27
Hearle et al. found that with increasing twist factor (equation (1a)), yarn diameter decreases, yarn specific volume (equation (1b), and Figure 1(a)) decreases, and approaches a limiting value.
28
Similarly, work by Du and Ko,
29
defined limits for fiber packing in linear fibrous assemblies applied to textile preforms based on fiber volume fraction, fiber orientation (surface helix angle), and the twist (equations (2a) and (b), Figure 1(b)). From equations (2a) and (b), parameters related to yarn jamming, which is the tightest structure the yarn can take, are defined from the maximum fiber orientation angle, and corresponding fiber volume fraction. - Twist factor (tex
1/2
turns/cm) is calculated as: - Yarn specific volume, vy (cm
3
/g), is calculated as: - The orientation (helix) angle of the fibers in the outer layer of a yarn bundle is calculated as: - Fiber volume fraction, vf, is calculated as:


Developments in e-textile materials have included hybrid conductive fibers and yarns, fabricated from twisting metal wires, metal coatings of synthetic fibers/filaments, conductive fillers, and polymers. It is highly beneficial to combine their additional electrical functional properties with the basic textile structural processing parameters for incorporation into hierarchical structures. The conductivity of e-textile yarns ranges from the order of Ω/m to several kΩ/m. 30 In addition, other requirements include a higher yarn filament number, and a compacted yarn structure to provide more conductive fibers for a given diameter. 3 The coated layer of the fibre or yarn should also be a good electrical conductor with adequate thickness, offering a large surface-area-to-volume ratio to decrease resistive effects of the non-conductive core. 3 The mechanism of electrical conductivity of e-textile yarns is determined by the contact points between conductive fibers in a yarn assembly, which allows for electric current flow. Current flow across contact regions is dependent on the actual contact area between two conductive surfaces held together (i.e. fibers in a yarn bundle), which in turn determines the contact resistance. 31 The orientation of yarns that contain conductive and non-conductive fibrous components is determined by the probability of conductive fibers present, adjacent or connected to each other in yarn longitudinal and cross sections. 32
With a large body of work carried out to understand the impact of twist on mechanical behaviour of staple and continuous filament yarns, recent studies related to twist in e-textile materials investigating this relationship. Spun carbon nanotube (CNT) fibers, twist-strength properties have been explored,25,33,34 with an optimum tensile strength reported for a twist angle of 30°. 25 Research in twisted or coiled conductive polymers, carbon-based, or metallic-elastomeric fibres or yarns have been presented for applications such as low-resistance elastic interconnects, strain sensors, supercapacitors, actuators for soft robots and artificial muscles, and energy harvesting devices.35–41
With the advanced application areas and progress presented from twisted fiber materials, few studies have explored the fundamental relationship between yarn twist on electrical properties of conductive yarns with respect to changes to yarn geometry. The understanding of this fundamental relationship is necessary for the prediction and design of functional e-textiles used for sensing applications. Some studies have reported that higher yarn twist results in yarn electrical conductivity increase, due to greater contact between fibers in the yarn, higher packing density, which promote the formation of electrically conductive pathways, in part due to slight contraction in yarn length.42,43 Other studies have reported increased resistance observed with higher twist levels, explained by the increase in wire length or fiber breakage.42–44 At higher twist levels and increased axial tension in fibers, breakage between contact points may occur by tension and torsion, resulting in reduced conductance due to fragmented and discontinuous fibers and yarns.42,43,45
A novel attempt has been made in this study to systematically investigate the relationship between the yarn twist level and corresponding linear resistance of conductive silver-coated nylon filament yarns, along with considerations into established relationships to yarn geometrical parameters. Based on the findings from yarn twist relationship to linear resistance, twisted yarns were selected for fabrication into lock-stitched embroidered electrodes. The skin contact impedance and electrocardiogram (ECG) measurements were performed using embroidered electrodes to identify and compare performance properties at the fabric level. The methods and findings of this work can be applied to other conductive yarns to predict and identify appropriate twist and linear resistance levels for materials selection in e-textile applications.
Experimental materials and procedures
Preparation of twisted yarns
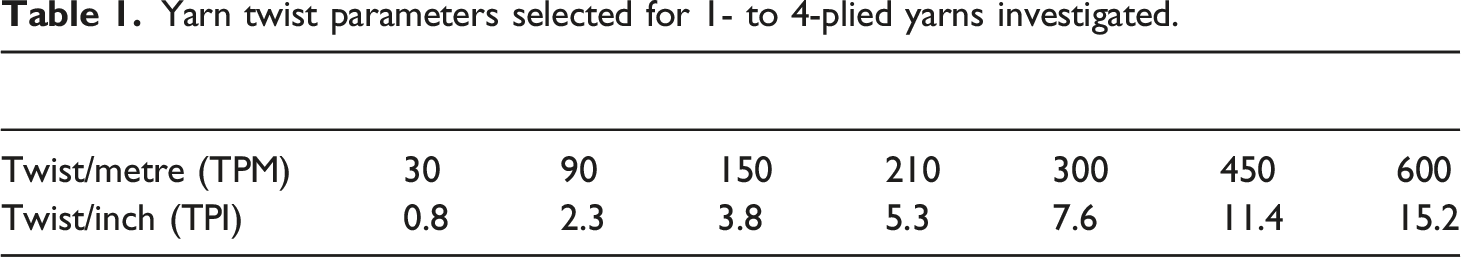
Yarn twist parameters selected for 1- to 4-plied yarns investigated.

Selected optical images of twisted yarns. 1-ply (a) 30 TPM, (b) 300 TPM, (c) 600 TPM; 2-ply (d) 30 TPM, (e) 300 TPM, (f) 600 TPM; 3-ply (g) 30 TPM, (h) 300 TPM, (i) 600 TPM; 4-ply (j) 30 TPM, (k) 300 TPM, (l) 600 TPM.
Yarn linear resistance measurement
The linear resistance across the longitudinal section of each twisted yarn group was measured using a two-probe multimeter (Tektronix DM2040, USA), with a copper clip attachment used for each point of measurement (Supporting Information, Figure A1). The resistance at 1 cm increments to a total of 10 cm were measured (n = 3) from each 20 cm twisted yarn length, accounting for differences in twist level at the 5 cm ends of the yarns. A two-tailed paired t-test (p-value less than 0.05) was performed to assess significant differences between measurement trials performed. A one-tailed paired t-test (p-value less than 0.05) was carried out to compare differences between linear resistances of yarn twist levels in each ply group.
Imaging, cross-sectional and longitudinal section measurements
The longitudinal sections of yarns were captured by optical microscopy (Leica, Germany), and yarn cross-sectional images were taken using both optical (Nikon, Japan) and scanning electron (Zeiss, Germany) microscopes to determine fiber diameters in the yarns. Measurements were made using ImageJ software (National Institutes of Health and Laboratory for Optical and Computational Instrumentation, USA). A challenge in obtaining the true circular cross section of a yarn is the fact that it may be subject to compression in the cast medium (Figure 3(a)). However, considering that during linear resistance measurements of yarn, the probe clip also compresses the yarn, the longitudinal section of the yarn was therefore considered as apparent diameters in calculations. An alternative method for obtaining more circular yarn cross-sections consisted of wrapping yarns around two metal wires, casting in epoxy (Epofix resin and hardener, Struers, Denmark), and curing for 48 h (Figure 3(c)). The cast samples were cut with a saw to expose the suspended yarn cross section, and polished to obtain a flat and clear surface (Figure 3(d)). Figure 3(b) and (d) show the fiber and yarn cross-section images of the 1-ply untwisted silver-nylon yarn, used for diameter estimations. Cross-sectional images of compressed yarns. (a) SEM micrograph of compressed 2-ply yarn, (b) SEM micrograph of fiber cross section (approx. 19.5 ± 0.8 µm). (c) Yarns wrapped between metal wires, cast in epoxy for subsequent cutting and surface preparation. (d) Optical image of 1-ply cross section (approx. 0.218 ± 0.005 mm.
E-textile electrode fabrication
Two-ply yarns from 30 TPM to 600 TPM, and all plied yarns at 300 TPM were embroidered into square electrodes having dimensions of 1 cm × 1 cm for electrical impedance spectroscopy (EIS), and electrocardiogram testing. The two-ply yarn group was selected based on the observed twist balance of the yarn bundles after the twisting process. A 2-m length yarn was prepared for the twisted yarn groups. The electrodes were stitched onto two layers of woven fabric (244 GSM cotton, and 44 GSM silver-nylon). The silver-nylon woven fabric layer is used as an interconnect from the electrode to wiring attached to the ECG measurement system, enabling the electrical connection to be maintained. A zig-zag lockstitch of 5 mm width, and 0.8 mm spacing was patterned into three columns (two-layers were stitched), using one continuous conductive yarn for each electrode (Figure 4(a) and (b)). (a) Embroidered electrode from 2-ply twisted yarn. (b) Schematic of electrode layers. (c) Schematic of EIS experimental set-up on planar forearm.
Electrical impedance spectroscopy measurement
Electrical impedance spectroscopy (EIS) using a three-electrode setup was performed on the left palmar forearm of a 30-year-old female subject. The embroidered electrode was the working electrode (WE), while standard Ag/AgCl gel electrodes (UniGel, USA) served as counter and reference electrodes (CE, RE, respectively). Electrode positions followed the setup used by Euler et al., 46 with a 10 cm distance between the WE and CE, and 1 cm distance between the WE and RE (Figure 4(c)). Light pressure (approx. 0.5 kPa) was applied to the electrodes with an arm wrap. The EIS scans were made using an electrochemical workstation (BioLogic VMP300, France), in potentiostatic mode, in which a sinusoidal voltage of 1 V was applied, using a frequency scan from 10 kHz to 0.1 Hz, 10 points per decade, and three measurements per reading. The data was analyzed by comparing impedance measurements at frequency points of interest, in the range of 0.5-1500 Hz -most biopotential signals are within this range.
Electrocardiogram measurement
Electrocardiogram signal was measured using a clinical 1-lead ECG system (Thought Technology Ltd., Canada), with a sampling rate of 2048 samples/sec., comprising a data acquisition and processing software (Biograph Infiniti). Signals were collected simultaneously from two channels to compare the performance of the embroidered textile electrodes with the standard Ag/AgCl gel electrodes. The sets of electrodes were attached side-by-side on the chest, following the manufacturer’s guideline (Figure 5). The simultaneous recordings do not produce identical ECG signals and can pick up slightly different phase and amplitude differences due to relative positioning to the heart centre; however, the inter-beat intervals (and heart rate measurement) should be identical. The textile electrodes were attached to the skin using a snap clip connector compatible with ECG snap leads, and secured with medical tape (3M, USA). Six-minute test sessions with three trials for each electrode set were performed in a stationary seated position. Schematic illustration of ECG electrode configuration, system setup and monitoring process.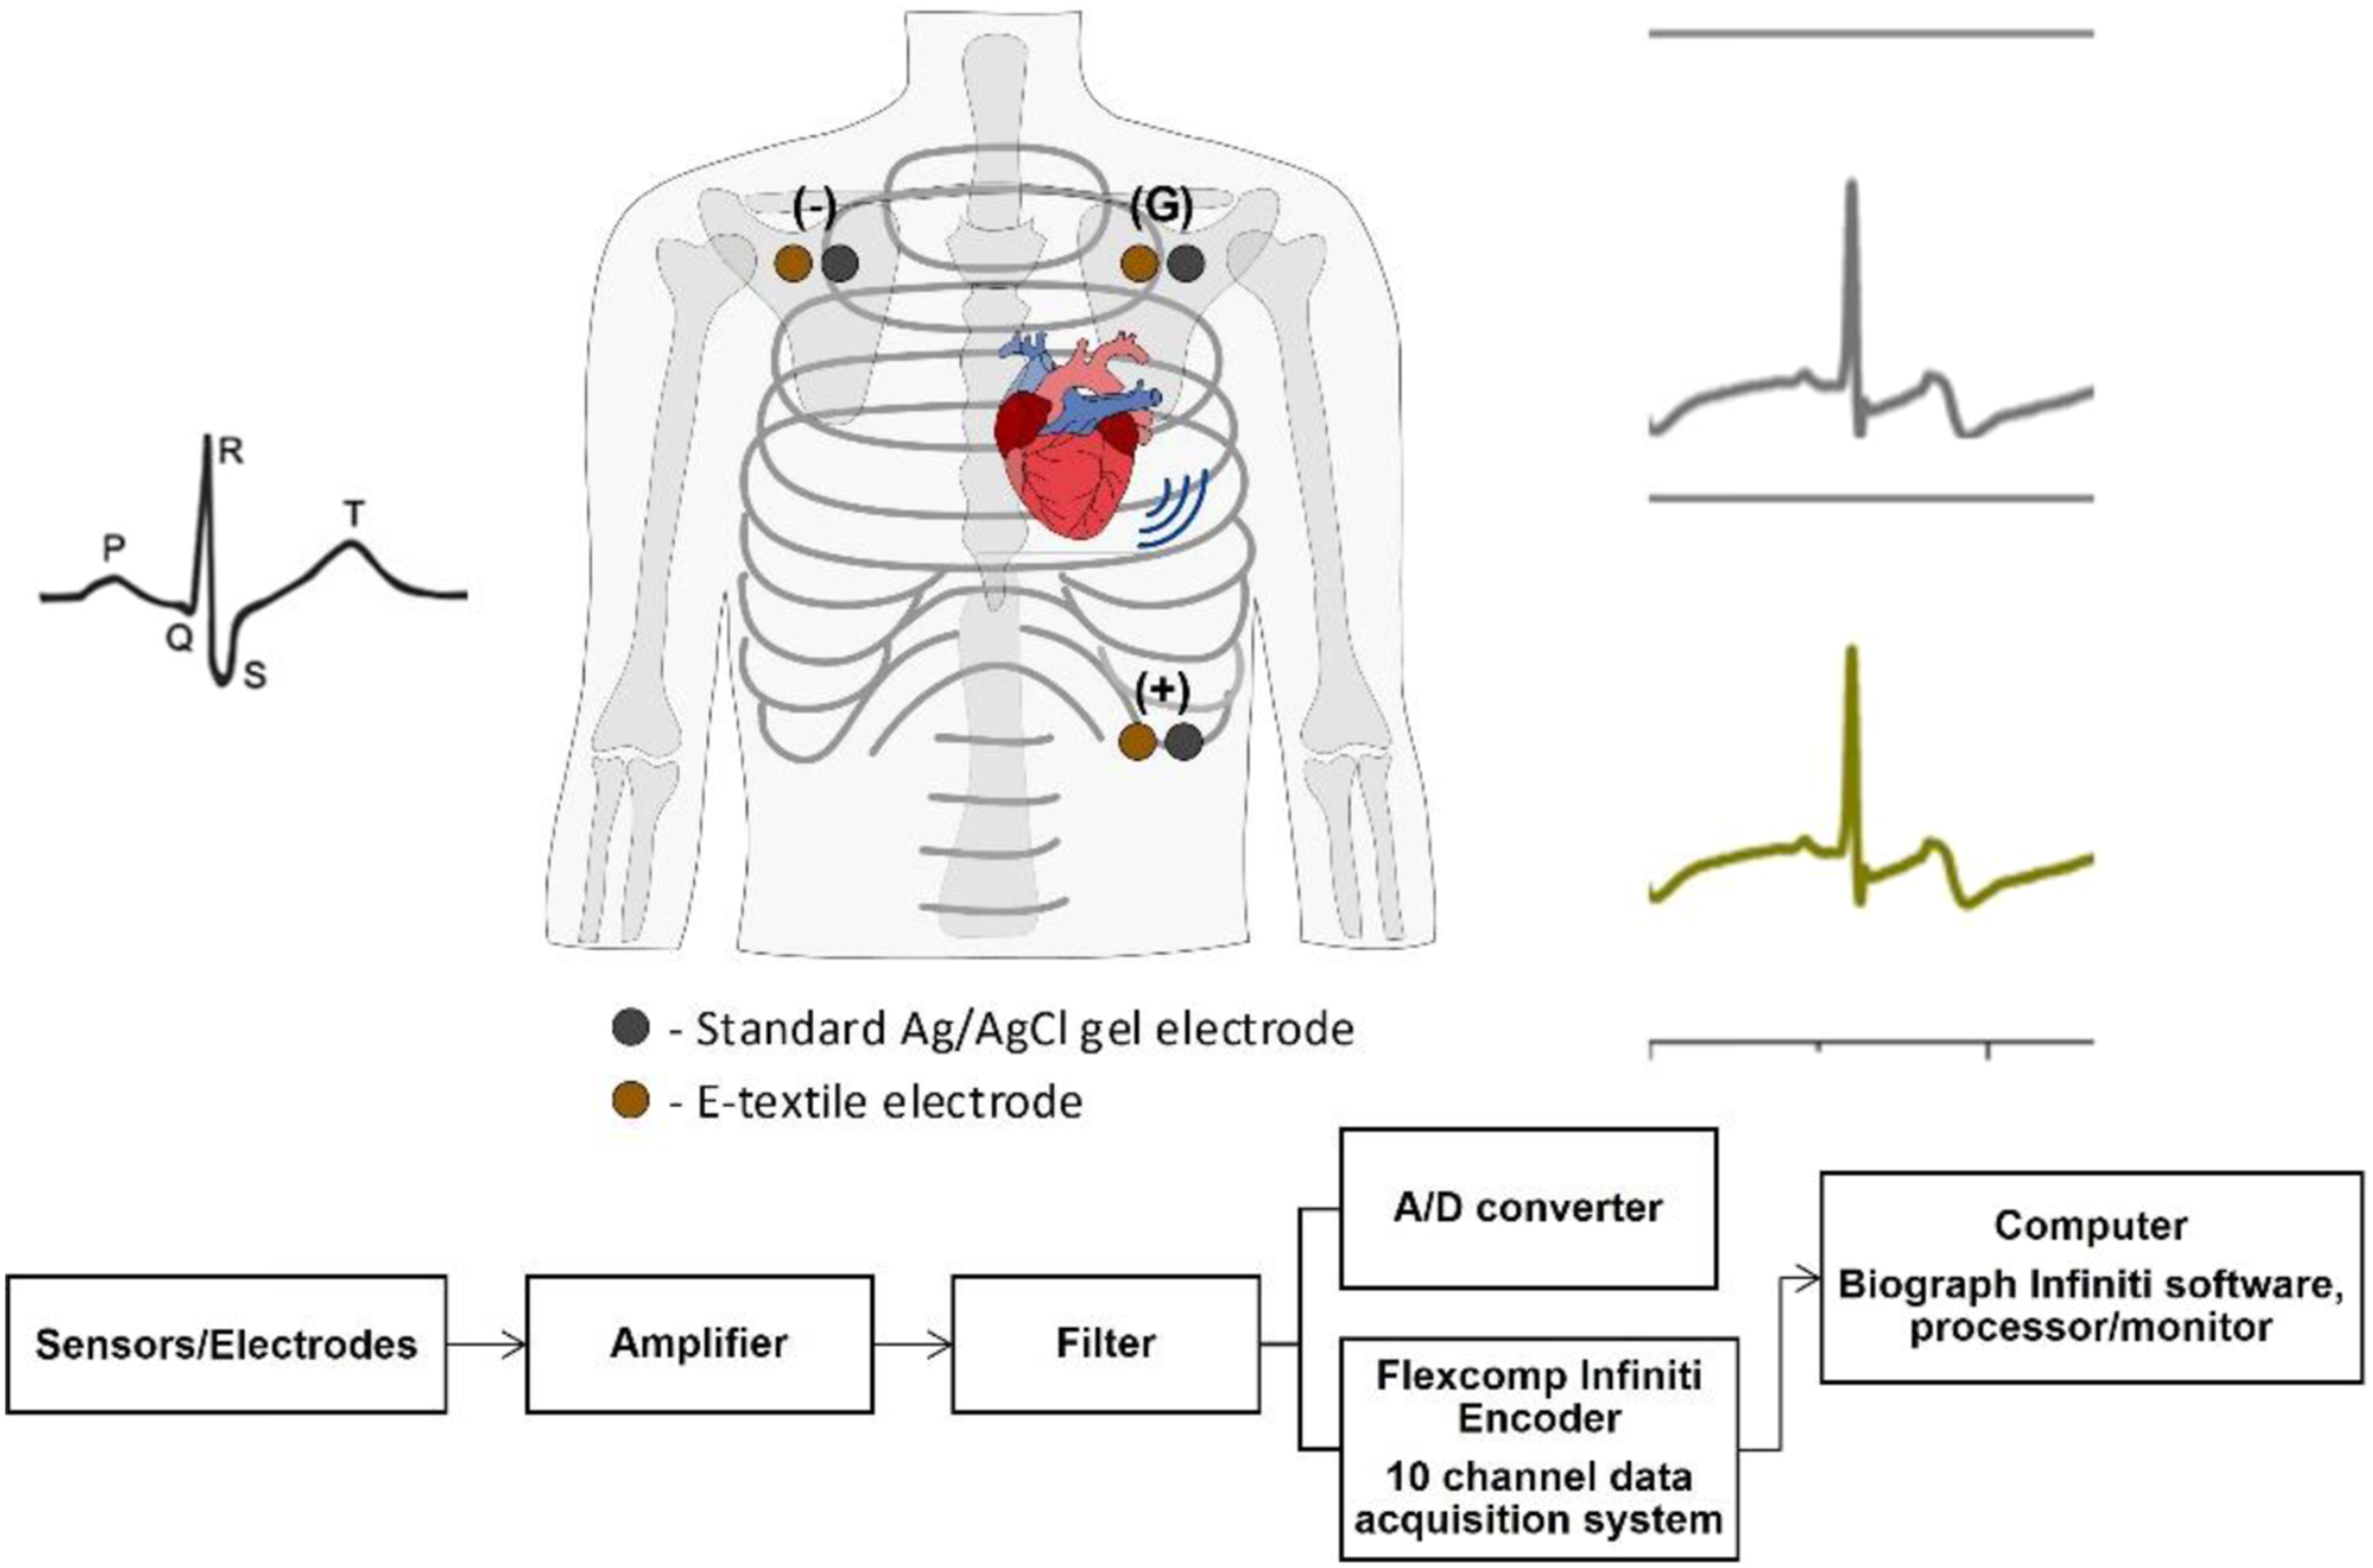
Methods in the time and frequency domain were used to compare ECG signal quality of the different electrode materials. For time domain comparison, a visual comparison of the raw signal, and the R-R peak (or inter-beat-interval IBI) intervals were compared. The average waveforms were calculated by template matching, from which the Pearson’s correlation coefficient (PCC) was calculated between each e-textile electrode material set and the corresponding standard reference electrode. The template matching method compares similarities in the ECG waveform morphology. A modified model from Orphanidou 47 was employed, using the entire PQRST waveform, 48 and was carried out in MATLAB (R2021b, The Mathworks Inc., RRID:SCR_001622). PCC results were compared to the metrics for template matching quality indices specified by Orphanidou, with a PCC of greater than or equal to 0.66 deemed as acceptable. In the frequency domain, the power spectral density plots were compared in terms of occupied bandwidth (total, lower, and upper bounds, in Hz), which represents the data region containing 99% of the power spectral density estimate. 49
Results and discussion
Effect of yarn twist on electrical properties
The linear resistance of yarns (1, 2, 3, & 4-ply) were measured at the different twist levels selected (30 to 600 TPM), and the results are shown in Figure 6(a) and (b). It was observed that the linear resistance decreases and reaches a plateau at approximately 300 TPM for all the plies that were investigated. With a higher twist level, there is greater inter-filament/fiber coherence and contact between the conductive strands in the yarn, and a slight contraction in the yarn length. These features are thought to be the main contributors to the decrease in yarn linear resistance. In addition, the apparent yarn diameters measured across the longitudinal sections follow this relationship and observed trend (Figure 6(c)). When comparing the average linear resistances between trials for each yarn twist and ply group, and repeated diameter measurements, p-values from the two-tailed t-test were greater than 0.05. This indicates repeatable measurements between all trials (Supporting Information, Tables A.1, A2). The one-tailed t-test results between linear resistance results for twisted compared to untwisted yarns in each ply group were p < 0.05 (Supporting Information, Table A.3), indicating differences between the linear resistance with respect to change in yarn twist. These results agree with the expected impact of linear resistance at increased twist levels. Effect of twist level on plied yarn linear resistance and yarn diameter. (a) and (b) Linear resistance as a function of TPM; (c) Yarn diameter (longitudinal section) as a function of TPM.
Calculated theoretical yarn diameter, and average longitudinal cross-section diameter.

*Longitudinal section diameter taken as an average from the seven twist levels (measured results for each twist level reported in supplementary data).
Theoretical yarn diameter is calculated as: 
Based on the initial observations of the electrical conductance on e-textile yarn twist, further investigation was carried out to examine contributing geometrical properties of the twisted yarns. This involved examining relationships established by Hearle et al., 28 and theoretical limits for fiber packing in yarn bundles defined by Du and Ko. 29
Figure 7(a) shows the calculated yarn specific volume for the 1- to 4-ply yarns plotted as a function of twist factor. As with the relationship demonstrated from work by Hearle et al. (Figure 1(a)), the specific volume of the twisted silver-coated nylon yarns decreases with increasing twist factor, with a rapid decrease at lower twist levels. The specific volume eventually approaches a limiting value between 1.6 and 2.0 cm3/g, which is closer to a twist level of 300 TPM as depicted in Figure 7(a).
28
Figure 8(b) shows the influence of fiber orientation angle in the outer layer of the yarn bundle on fiber volume fraction in the yarn. The fiber volume fraction approaches a limiting value, occurring between 6° and 8° for the 1-ply yarn, and between 12° and 18° for the 2-,3-, and 4-ply yarns. Yarn packing fraction with respect to yarn twist is also observed to reach a plateau (Figure 7(c)). These values correspond to the yarn jamming condition, which represents the tightest structure the twisted yarns reach when the filaments in the yarn are in contact with their adjacent filaments. The calculation results shown in Figure 6a–(b) follow the observed twist level of up to 300 TPM. The yarn linear resistance is found to reach a plateau or limiting minimum value. These results show the significance of the study and can be referred to when deciding the optimum twist level for a given conductive yarn. It is important to not to go beyond the optimum twist level to avoid conductivity loss caused by over tension, torsion, and abrasion between the strands. Effect of twist and fibre orientation angle on the geometrical properties. (a) Calculated yarn specific volume with twist factor. (b) Calculated fiber volume fraction with orientation angle. (c) Yarn packing fraction with respect to twist (TPM). Left: Observable changes in fibre packing and orientation in yarn bundles visible from optical images shown. Right: General relationship between yarn twist level and electrical conductance properties.

Studies investigating the impact of yarn twist on resistance.
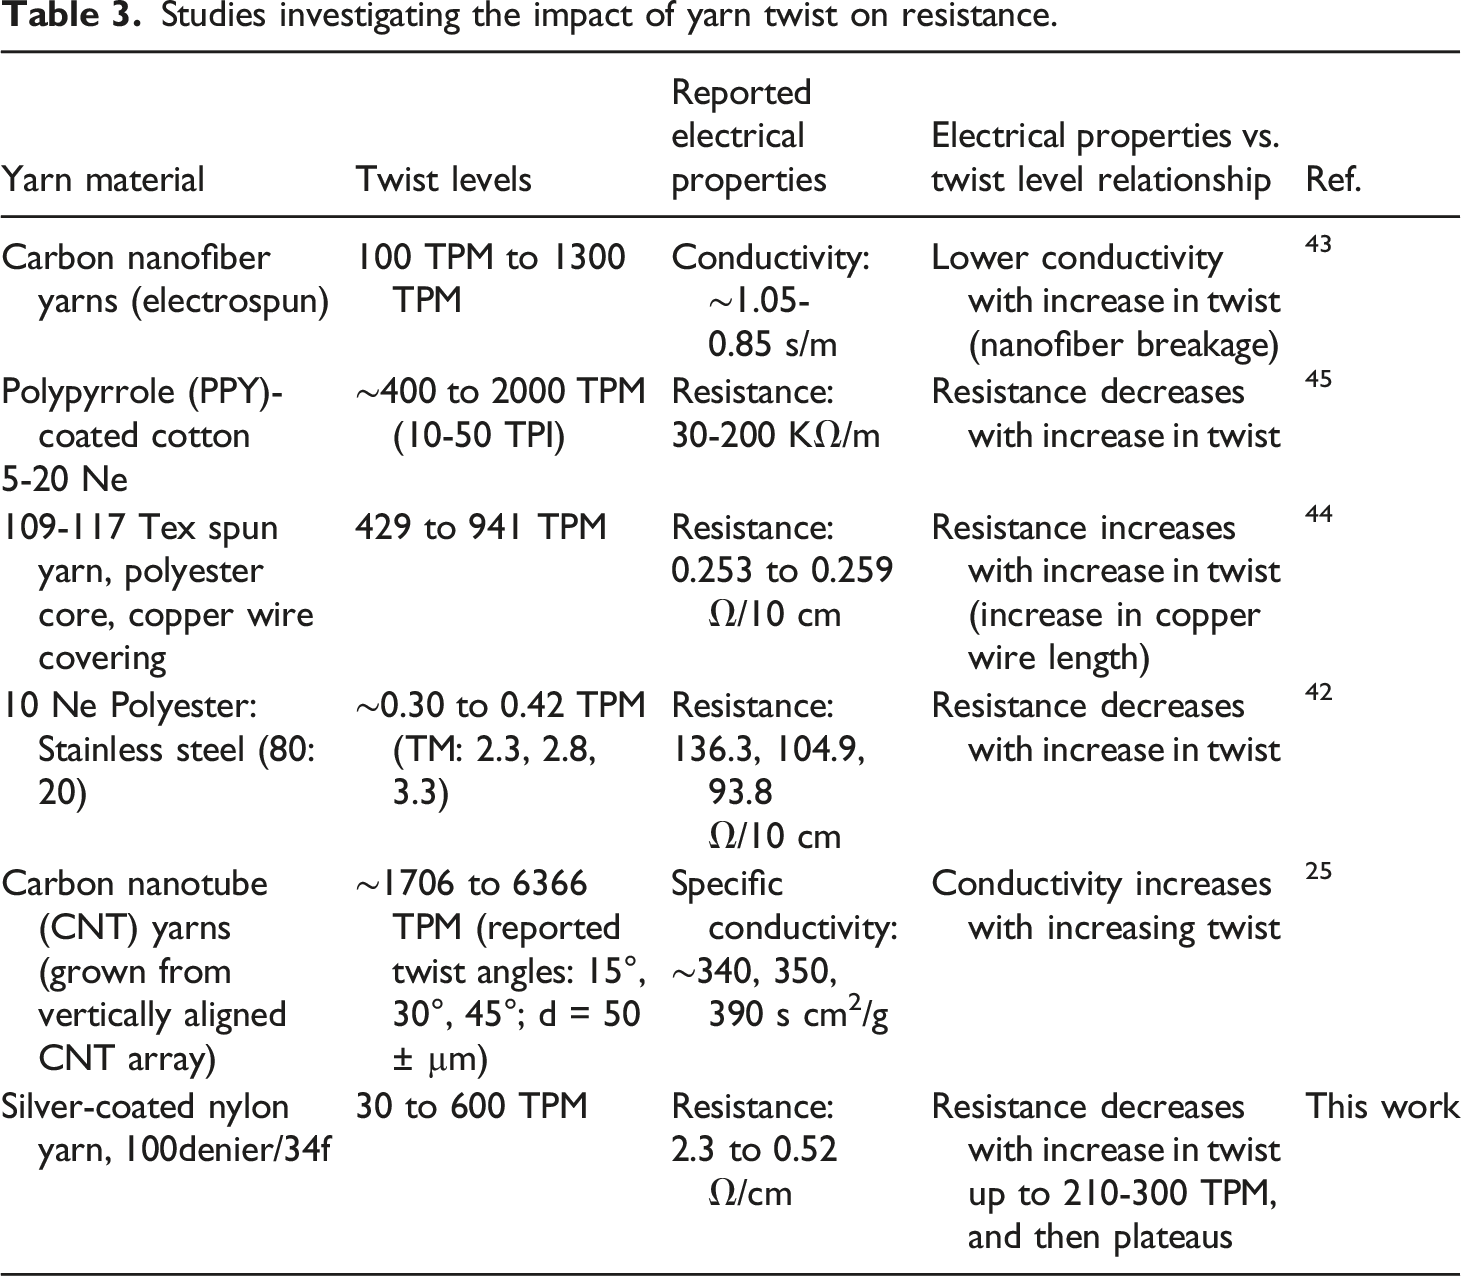
This work has expanded the general understanding of electrical conduction in conductive yarns through examining changes in the geometrical parameters of the twisted silver-nylon yarn structures. From the experimental and theoretical results measured and calculated, it is deduced that the electrical conductance of the investigated yarn is impacted by conductive fiber packing and orientation in a given yarn bundle (Figure 8). This subsequently influences the contact resistance and conductive pathways formed in the structure. When conductive fibres are held together in a yarn, contact resistance is determined by the actual contact area, which is smaller than the apparent surface area, owing to the roughness of contacting surface. 31 Therefore, with greater yarn twist, yarn packing and fiber orientation are affected, contracting and packing closer together to a threshold point. This thereby results in a decrease and plateau in linear resistance.
Application of twisted yarns in embroidered e-textile electrodes
The skin-electrode contact impedances of the embroidered fabric electrodes made from the twisted two-ply yarns were measured and compared. The Bode plots of the yarns are shown in Figure 9a–(b). Since biopotential signals generally fall in the frequency range of 0.5-1500 Hz, impedance values at selected frequency points in the scanned range are presented in Table 4 and plotted in Figure 9c–(d). A similar trend to the twisted yarn linear resistance results is observed, with the measured impedance increasing from the initial 30 TPM, followed by a general plateau in impedance values after 210-300 TPM. The lower impedance at lower twist levels can be explained by the influence of a larger longitudinal diameter, and higher yarn specific volume, which thereby increases the apparent contact area of the electrode and skin at the fabric level. This can also be explained by the fact that the fibers in the yarn cover a higher surface area at lower twist levels and make more contact with the skin. With increasing twist levels, the yarn specific volume decreases, and as the structure compacts, the longitudinal diameter also decreases, and reaches a plateau (Figure 6(c)). Therefore, fabric structures embroidered from the 2 m yarn length at higher twist levels are expected to have a lower exposed surface area and apparent contact area between electrode and skin. This subsequently corresponds to the higher contact impedance observed. EIS results. (a) and (b) Contact impedance results from twisted 2-ply embroidered electrodes. (c) and (d) Contact impedance results at selected frequencies. Measured impedance values at selected frequencies.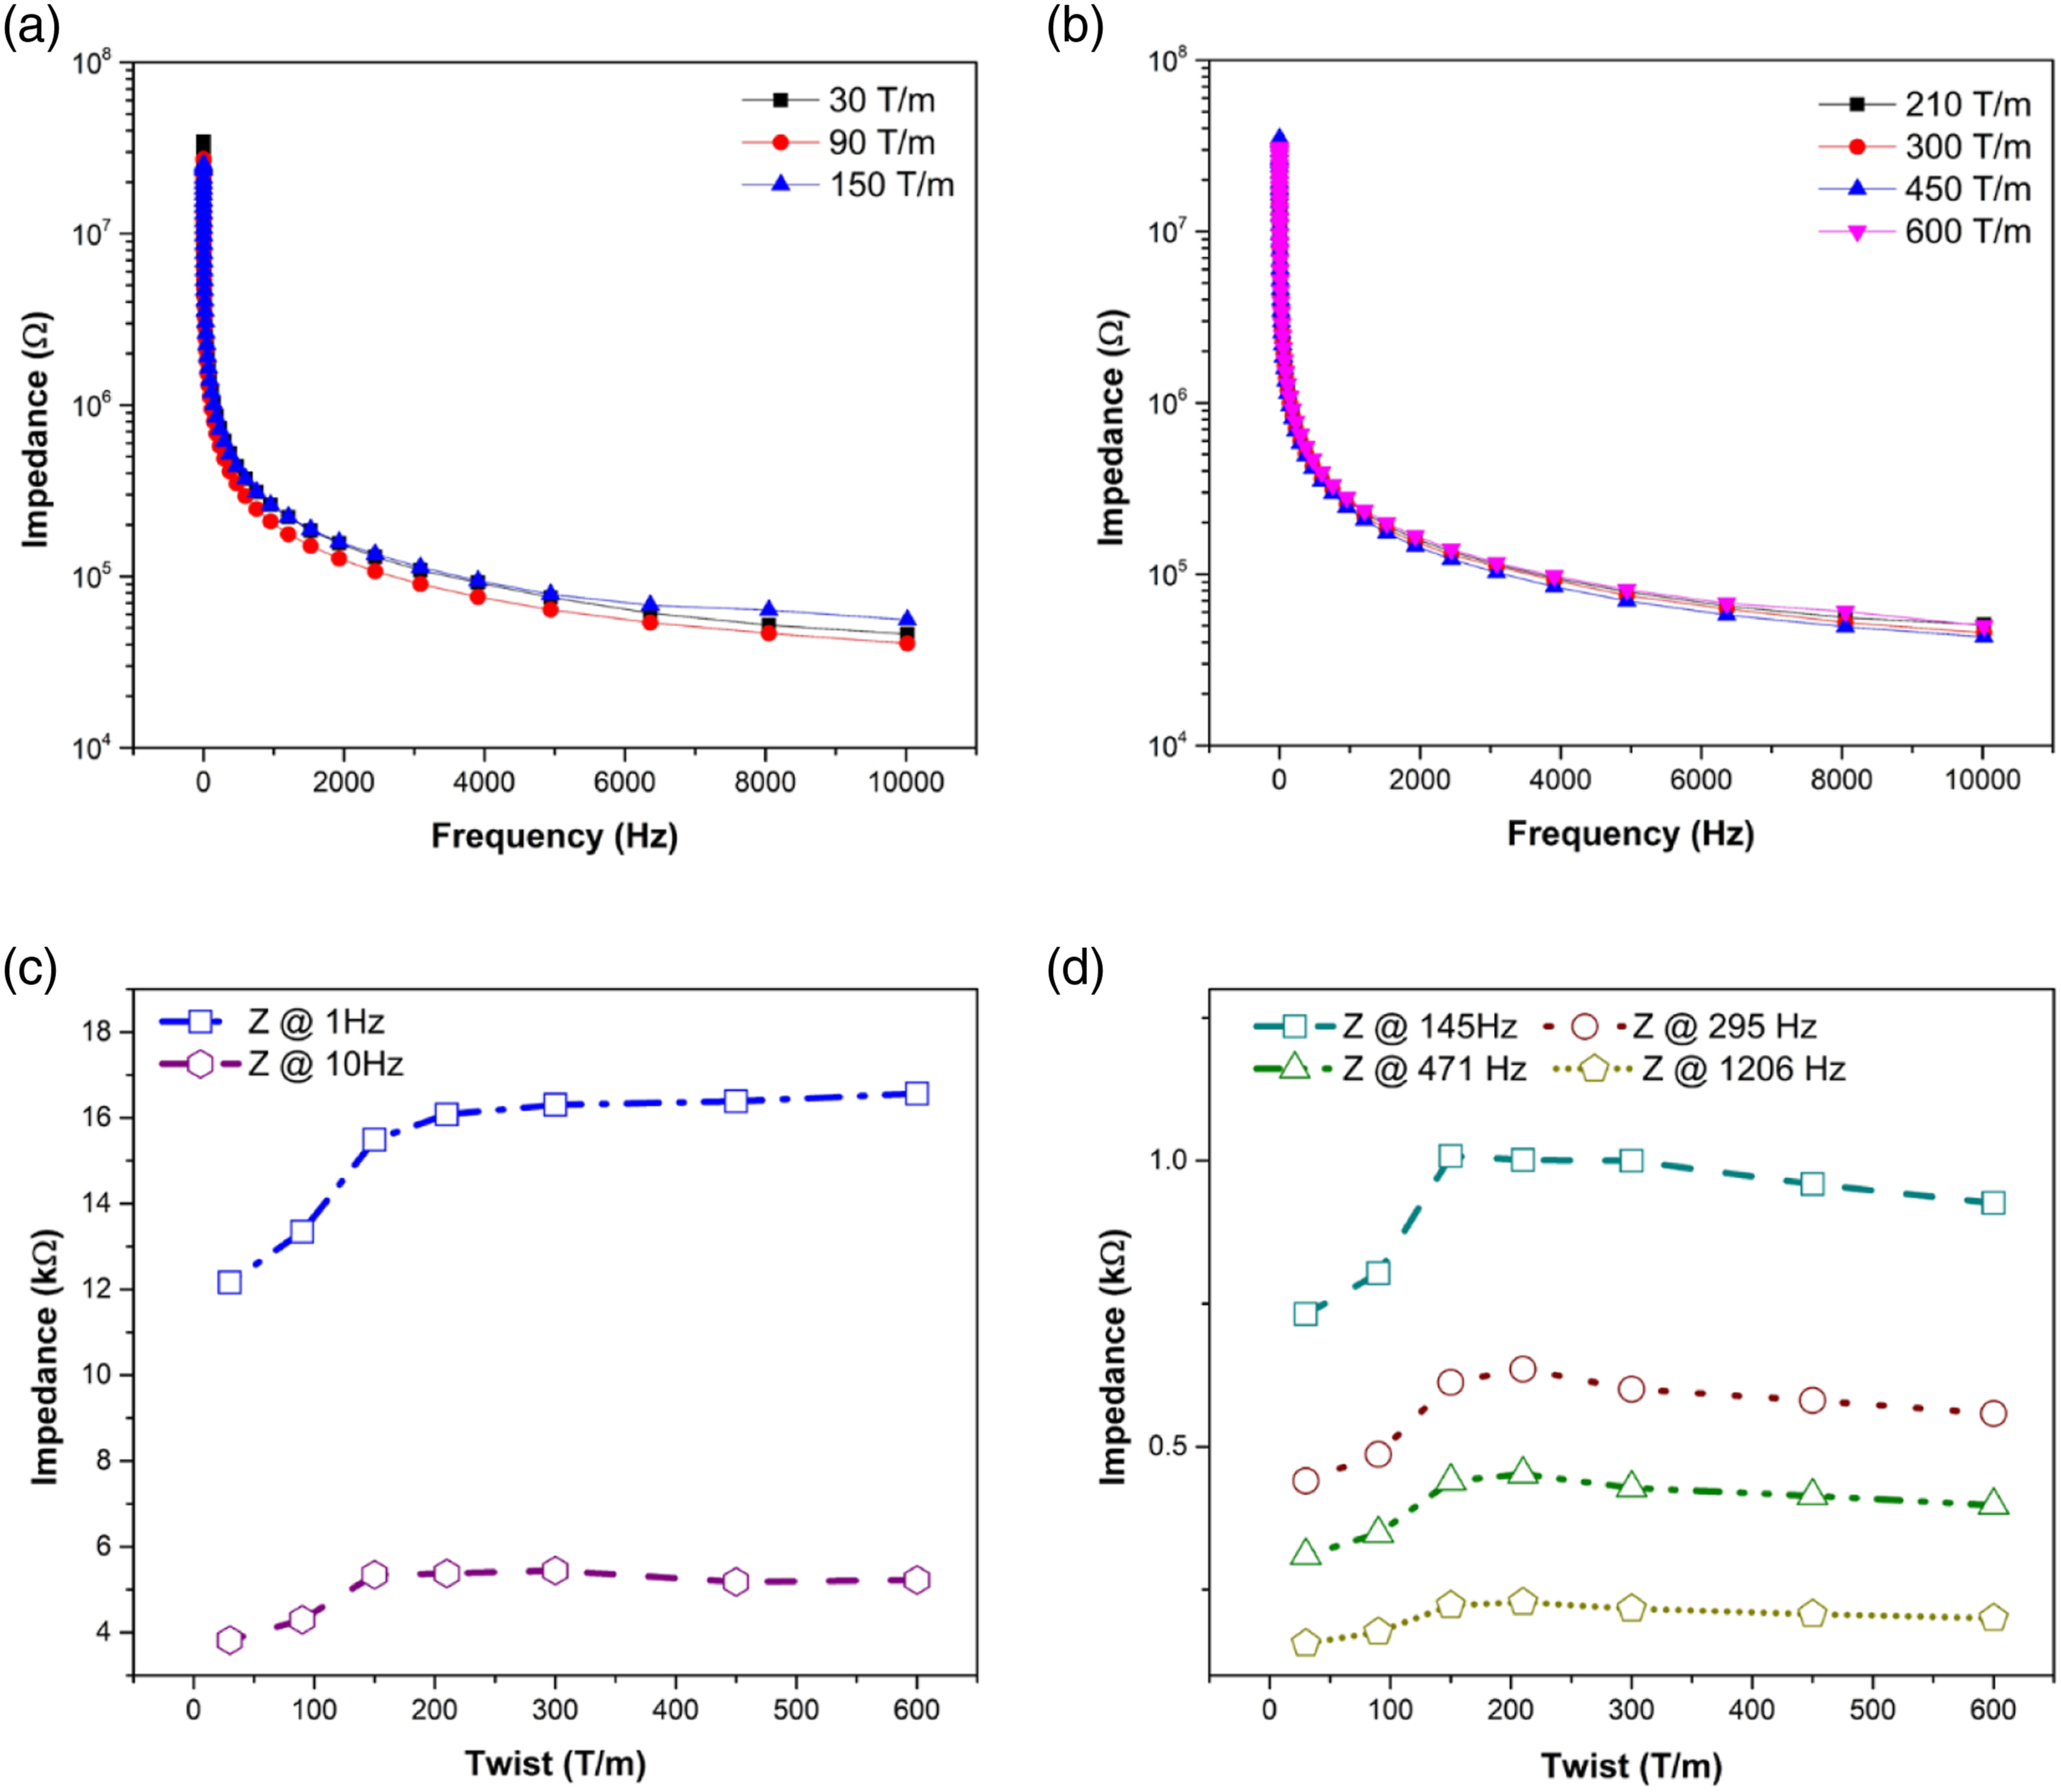

Results for ECG recordings of the 30 TPM, 300 TPM, and 600 TPM, 2-ply twisted embroidered electrodes are displayed in Figure 10(a)-(c). The ECG recordings show identical signal quality between the two sets of electrodes from visual observation. Each textile electrode set compared with standard gel electrodes show identical inter-beat interval readings. The R-peak amplitudes of the ECG signals recorded by the textile electrodes are slightly higher than the standard gel electrodes. Differences are thought to be due to the closer proximity and placement of the textile electrodes to the heart axis, compared to the standard gel electrodes in the simultaneous recording configuration. However, this does not impact the basic signal quality features (heartbeat and heart rate variability). The average ECG waveform for the e-textile electrodes were obtained and compared with the respective standard reference (gel) electrode with results, with plotted results shown in Figure 10(d)-(e). The Pearson’s correlation coefficient (PCC) comparing the simultaneous Ag/AgCl standard gel electrode and e-textile electrode signals were calculated for each set of tests and specified in the figures. The electrodes embroidered from 30 TPM to 600 TPM yarns had slightly higher correlation results (0.98), than the electrode set embroidered from the 300 TPM yarn (0.97). Overall, results for the e-textile electrodes were calculated to have average PCC values (0.97-0.98) exceeding the acceptable range defined by Orphanidou, (PCC >/= 0.66).
47
ECG signal comparison between standard gel electrodes and e-textile electrodes fabricated from (a) 30 TPM, (b) 300 TPM, and (c)600 TPM twisted 2-ply yarns. Average ECG waveform comparing simultaneous recordings for standard gel electrodes with e-textile electrodes fabricated from twisted 2-ply yarns, (d) 30 TPM, (e) 300 TPM (f) 600 TPM. Power spectral density plots for standard gel electrodes compared to e-textile electrodes fabricated from twisted 2-ply yarns, (g) 30 TPM, (h) 300 TPM, (i) 600 TPM.
Example results for occupied bandwidth calculations for e-textile and gel electrode ECG signals.
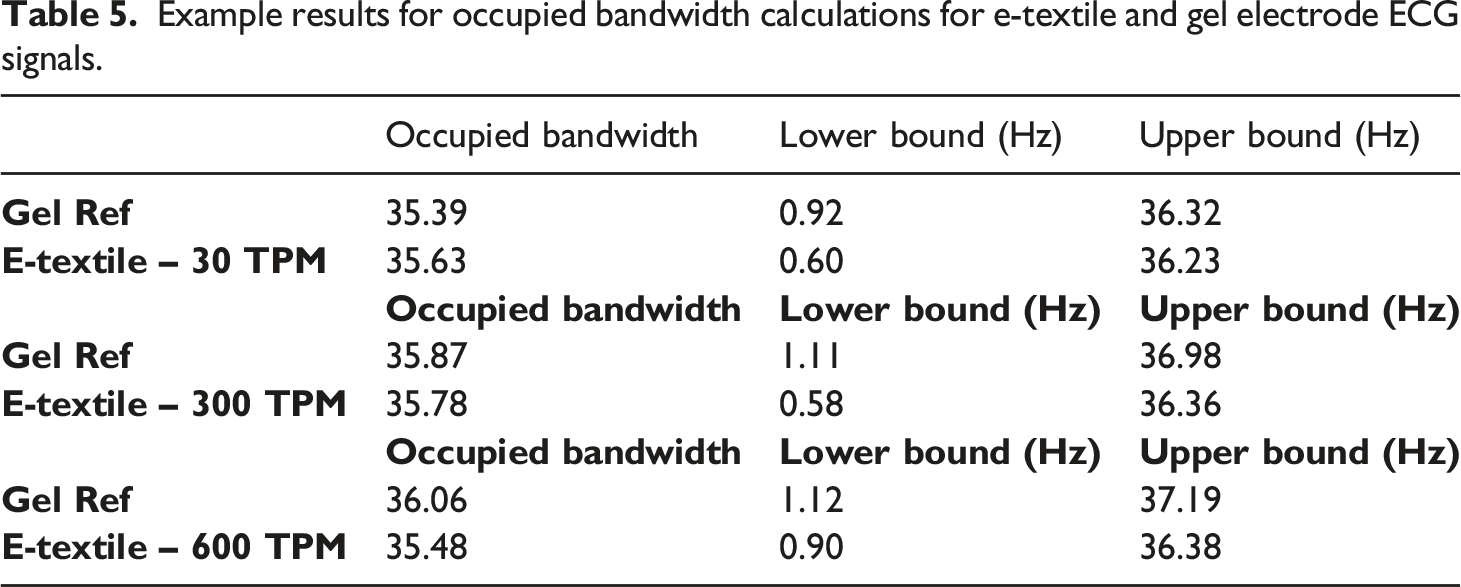
Combined comparison of the ECG signal results with the electrical resistance and contact impedance measurements, demonstrated that the lowest (30 TPM) and highest yarn twist levels (600 TPM) may provide good quality ECG signal through distinct features influencing the textile structure. For an electrode fabricated from a yarn with low twist, signal quality and stability are influenced by the increased contact between the skin-electrode interface, due to the larger apparent contact surface from the higher yarn diameter. For electrodes fabricated from a yarn with high twist, signal quality is likely to be more influenced by the yarn conductance (or lower resistance) from the more compact and twisted structure. This may also reduce signal noise pickup. Further investigation is necessary to explore differences in the long-term stability and performance of electrodes fabricated from yarns of different twist levels.
Conclusions
A novel attempt was made to investigate the impact of fiber/yarn geometrical parameters on the electrical properties of silver-coated nylon yarns, and preliminary work into fabric level skin-electrode signal properties. Based on the experimental observations, the yarn twist level is inversely proportional to electrical resistance. It was found that increasing the yarn twist level up to 300 TPM, linear resistance decreased and reached a limiting value for the four yarn ply groups investigated (1 to 4). In addition, yarn geometrical properties including yarn specific volume, and yarn packing fraction reached limiting (plateau) values at 300 TPM, and the fibre orientation angle of 12-18°. Embroidered electrodes fabricated from 2-ply yarns at twist levels from 30 to 600 TPM demonstrated increased contact impedance from the initial 30 TPM, followed by a general plateau in the range of impedance values after 210-300 TPM. Similar to observations at the yarn level, this trend was attributed to the decrease in the yarn specific volume and diameter at increasing twist levels due to the compacting of the structure, and fibre/filament coherence. Embroidered electrodes used to collect high quality electrocardiogram (ECG) signals, showed comparable quality to standard Ag/AgCl gel electrodes. It was found that yarn properties at low and high twist levels uniquely contributed to electrode performance in the fabric form factor. Signal quality of electrodes fabricated from yarns with relatively higher twist were found to be more influenced by yarn conductance (or lower resistance), from the more compacted and twisted structure, which was also thought to reduce signal noise pickup.
The limiting twist value for any given conductive yarn can be determined by the experimental methods reported in this work, and objectively confirmed by measuring geometrical parameters such as fiber orientation angle, and fiber/yarn packing fraction up to the yarn jamming point. Detailed understanding of fiber, yarn, and fabric geometrical properties for e-textiles allows for the prediction of material and electrical properties, which can thereby guide raw materials selection. Other e-textile yarn materials/assemblies and fabric structures could be explored through textile structural platforms such as woven, knitted, and braided fabrics, for the development of smart wearable apparel systems for biopotential signal monitoring.
Footnotes
Declaration of conflicting interests
The author(s) declared no potential conflicts of interest with respect to the research, authorship, and/or publication of this article.
Funding
The author(s) disclosed receipt of the following financial support for the research, authorship, and/or publication of this article: This work was supported by the Natural Sciences and Engineering Research Council of Canada (NSERC) Discovery and Alliance Grants, the Canada Foundation for Innovation (CFI), and the University of British Columbia Four Year Doctoral Fellowship (4YF).