
Abstract
Three-dimensionally (3D) knitted technology textiles are expanding into industrial and technical applications of textile composites given their geometric, structural, and functional performance. However, there are many challenges in developing computational tools that allow for physics-based predictions while keeping the related computing cost low. The strong interactions between geometrical and physical elements permit determining the behavior of this type of engineering material. In the aim of understanding the specific mechanical behaviors of knitted textiles, a yarn-level simulation model framework was created to predict the nonlinear orthotropic mechanical behavior of monofilament jersey-knitted textiles. The relative contributions of many computational parameters on the global mechanical behavior of knitted fabrics are investigated, specifically, inter-yarn interactions and the boundary conditions effect. The models are saved in a format that can be read directly by Finite Element Analysis FEA software. Yarns are numerically discretized as nonlinear 3D beam components, while input parameters, such as mechanical characteristics of yarns and geometric dimensions of loops in fabrics are established experimentally. Good agreement was relieved by comparing experimental data to simulation results in a wale-wise direction tensile load.
Introduction
The mechanical behavior of textile material is increasingly studied due to its large range of applications. Currently, textile materials are the subject of increasing interest beyond the traditional textile industries. Textile composite materials, as an example, can be found in areas such as automotive, aerospace, and marine engineering industries, and also in medical applications and civil engineering.1–4 While there is a strong need for accurate computational modeling of knitted textile mechanical behavior, engineering design still poses a challenge in using these fabrics.
Peirce 5 proposed one of the first models, by introducing a connection between yarn length and the number of courses/wales per inch. This model assumed that the trajectory of the yarn sweeps a circular cross-section over circular arcs connected by straight lines. From this model, it is possible to derive the relationship between yarn length and the number of courses or wales per inch. A few adjustments to the model were proved by Leaf and Glaskin. 6 Munden 7 has proposed an approach based on minimum energy configuration rather than accurate geometrical structure. The shape of the loop is fairly independent of the yarn’s physical properties and stitch length, but it is defined by the total length of the yarn in a loop. 8 In the generation of the loop shape and fabric dimensions, Hepworth and Leaf 9 took into account forces acting between yarns.
The research took a different path by modeling and visualizing realistic knitted fabrics, with the correct topology of knitted fabrics included in the relaxation process, producing a 2D and 3D visualization of the resulting fabric.10-15
The knitting process was then simulated to better understand yarn deformation mechanisms, inter-yarn forces in plain-knitted fabrics, and the knitted structure relaxation to minimum energy configurations.16-17
The mechanical properties and characteristics of the yarn are determined by many factors such as the composition of the material, the length of the fibers, and the number of constituent filaments. The twist and untwisted yarn state impact the stiffness of knitted materials made of multi-filament yarns. 18 In order to decrease the number of parameters linked to twist and untwisted yarn effects (yarn bending moment contribution), our study was narrowed to a jersey-knitted fabric of monofilament yarns.
Knitted fabric models, unlike woven textile simulations, must accurately simulate substantial yarn bending to capture in-plane textile stretching. Solid hexahedral elements with isotropic material properties were previously used to create Finite Elements (FE) models of knit monofilament; 19 although orthotropic material properties and sliding frictional contacts provide a better representation of yarn response, they still struggle to capture the detailed bending behaviors of knitted yarns while maintaining computational stability. On the other hand, the use of solid elements causes yarns to have an artificially high bending resistance. 20 Poincloux et al. 21 used an empirical model based on yarn bending energy, total length conservation, and topological restrictions on the constitutive stitches, to simulate the mechanical behavior of knitted fabrics.
Using unit cell definition and periodic boundary conditions, FEA under different loading situations lead to identical experiment results. 22 Vassiliadis’ work 22 is expended to a multi-scale modeling by O. Weeger et al.23-24 to a multi-scale modeling based on yarns numerically discretized using an isogeometric collocation approach.
However, the periodicity assumption and inherent scale effects on the direct simulation generate a noticeable deviation from the real behavior and need a large processing cost, making such techniques computationally hard.
In this work, 3D beam element B31type (3 for 3D beam, one for first-order interpolation linear bulk viscosity) is used to create a method for accurately studying tensile responses of knitted monofilament yarns. The cell geometries of a given stitch pattern are combined to create a single geometric model. Additionally, the size and shape of the stitch cells can be controlled via scaling reel parameters, which allows us to explore the influence of stitch structural changes on the macroscopic mechanical properties of the fabric. The model is then converted into a format that can be used within a FE analysis framework.
Our method is based on regular structures of the stitches. The model does not focus into the yarn’s stretching and twisting consideration. These assumptions allow us to focus on the yarn’s bending strength. The fabric’s mechanical response was measured using tensile test experiments under wale loading configuration, while image processing was used to keep track of its geometry. Additionally, yarn-level strain is examined and addressed in terms of in-plane and out-of-plane deformation. Taking into account yarn-to-yarn interactions, such as yarn sliding and rotations, appeared to be the driving mechanism for the observed global mechanical behavior.
Geometrical modeling approach of knitted loops
The centerlines of the yarn in our model are defined with a circular beam cross-section around the centerline spline and are built up in units as most models.19-21,25 The smallest component of the model is called an elementary representative cell (ERC), and it consists of one spline, representing the half of a stitch leg and head (see Figure 1). The design geometry technique was used to represent each part of the stitch similar to.
26
The relaxation of the yarns from residual stresses is accompanied by the decrease of existing deformations generated by the knitting process. The yarns slide over each other during relaxation until the minimal elastic energy structure, on which we build our geometrical model, is reached. The approach used in this work can be subdivided into two steps. The first one is the creation of 3D ERC (elementary representative cell), which allows us to perform local cost-effective optimizations rather than a costly global optimization across the entire fabric. The second one is the transformations made to the 3D ERC to produce the overall fabric. (a) 2D geometric parameters that define the path of the yarn in the model, (b) Control points configuration in the ERC.
Elementary representative cell (ERC)
The building-up of the ERC starts from a 2D geometry by the creation of a half stitch. The geometrical parameters were estimated using the assumption of an ideal elastic yarn. Seven geometrical input parameters must be entered (Figure 1(a)). The main parameters used in most geometrical models are the wale spacing/loop height (H), course spacing/loop width (L), and yarn diameter (D), while the other four parameters were established to improve the geometrical shape precision of the stitch head (l1, R1) and the leg (l2, R2). These scaling parameters are used to control the size and shape of stitch cells.
Initial positions of the splines control points.

With θ1 is the angle of inclination of the segment parallel to the x-axis passing through P3 and the segment that passes between P3 and P4, for θ2 is the angle between the segment parallel to the x-axis passing through P6 and the segment passing through P5 and P6
To convert 2D geometry to 3D, we used an approach based on creating and controlling the thickness of the spline. The curves and segments of the spline were meshed with a refined mesh using a meshing tool (Figure 2). By using an out-of-plane translation, this discretization will make it easy to manipulate this form by applying the function Z=p. Y2 with p a control parameter adapting the fabric thickness requested. (a) 3D geometrical drawing of ERC; (b), c, (d) In-plan projections of ERC in XY, ZY, and XZ, respectively.
Transformation of the elementary representative cell
The architecture of the jersey-knit depicted in Figure 3(a) is used to computationally create stitch geometries of knitted fabrics discretize with 10 elements in ERC. Consequently, a series of stitches are formed as a chain. Depending on the type of application, transformations are added to this chain; three particular structures have been built to inspect specific properties. The basic structure is a flat knit fabric, starting from the chain in Figure 3(b). Others are cloned and superimposed with an offset that allows the yarn to pass through the curvature of the stitches below without overlapping. These chains are super imposed at an averaged distance T along the Y-axis, which can be measured from the knitted cloth. All the determinate geometrical parameters can be generated automatically via the C++ framework (Figure 3(c)). (a) 3D geometrical drawing of ERC, (b) 3D structure of ERC, (c) input simulation parameters into the framework interface.
Yarn-to-yarn interactions
In this work, the yarn material was assumed to be anisotropic polyamide. A commercially available FEA (Abaqus) code was used. The interactions between yarns, including sliding and rotation, represent the complex characteristics of the deformation of knitted material. To study these interactions, it was necessary to account for the contact-friction behavior of the materials.
Relative normal and tangential movement of the yarn interfaces results from contact and friction; they play a part in their nonlinear behavior as well. To approach these interfacial interactions more accurately, a default contact property model in Abaqus/Explicit was used named “hard contact.” Dani Liu et al. have analyzed the difference between a tie and hard contact in the normal direction. 27 As a result, they have concluded that hard contact was a better option. Separated surfaces come into contact when the clearance between them reduces to zero; then, any contact pressure can be transmitted between them. 28
For the tangential contact, a basic Coulomb friction model was utilized. The assumption is that the two orthogonal components of shear stress are the same in all directions (isotropic friction). These components act in the local tangent directions of the contact elements and represent the combination of the two shear stress components into an “equivalent shear stress.” The model also relates the maximum allowable frictional shear stress across an interface to the contact pressure between the contacting bodies. Within these conditions, two contacting surfaces can carry shear stresses up to a certain magnitude across their interface before they start sliding relative to one another. This state is known as sticking. The Coulomb friction model defines this critical shear stress as a fraction of the contact pressure between the surfaces. The stick/slip calculations determine when a point transitions from sticking to slipping and vice versa, and the fraction is known as the coefficient of friction
29
(Figure 4). Stick regions for the basic Coulomb friction model.
29
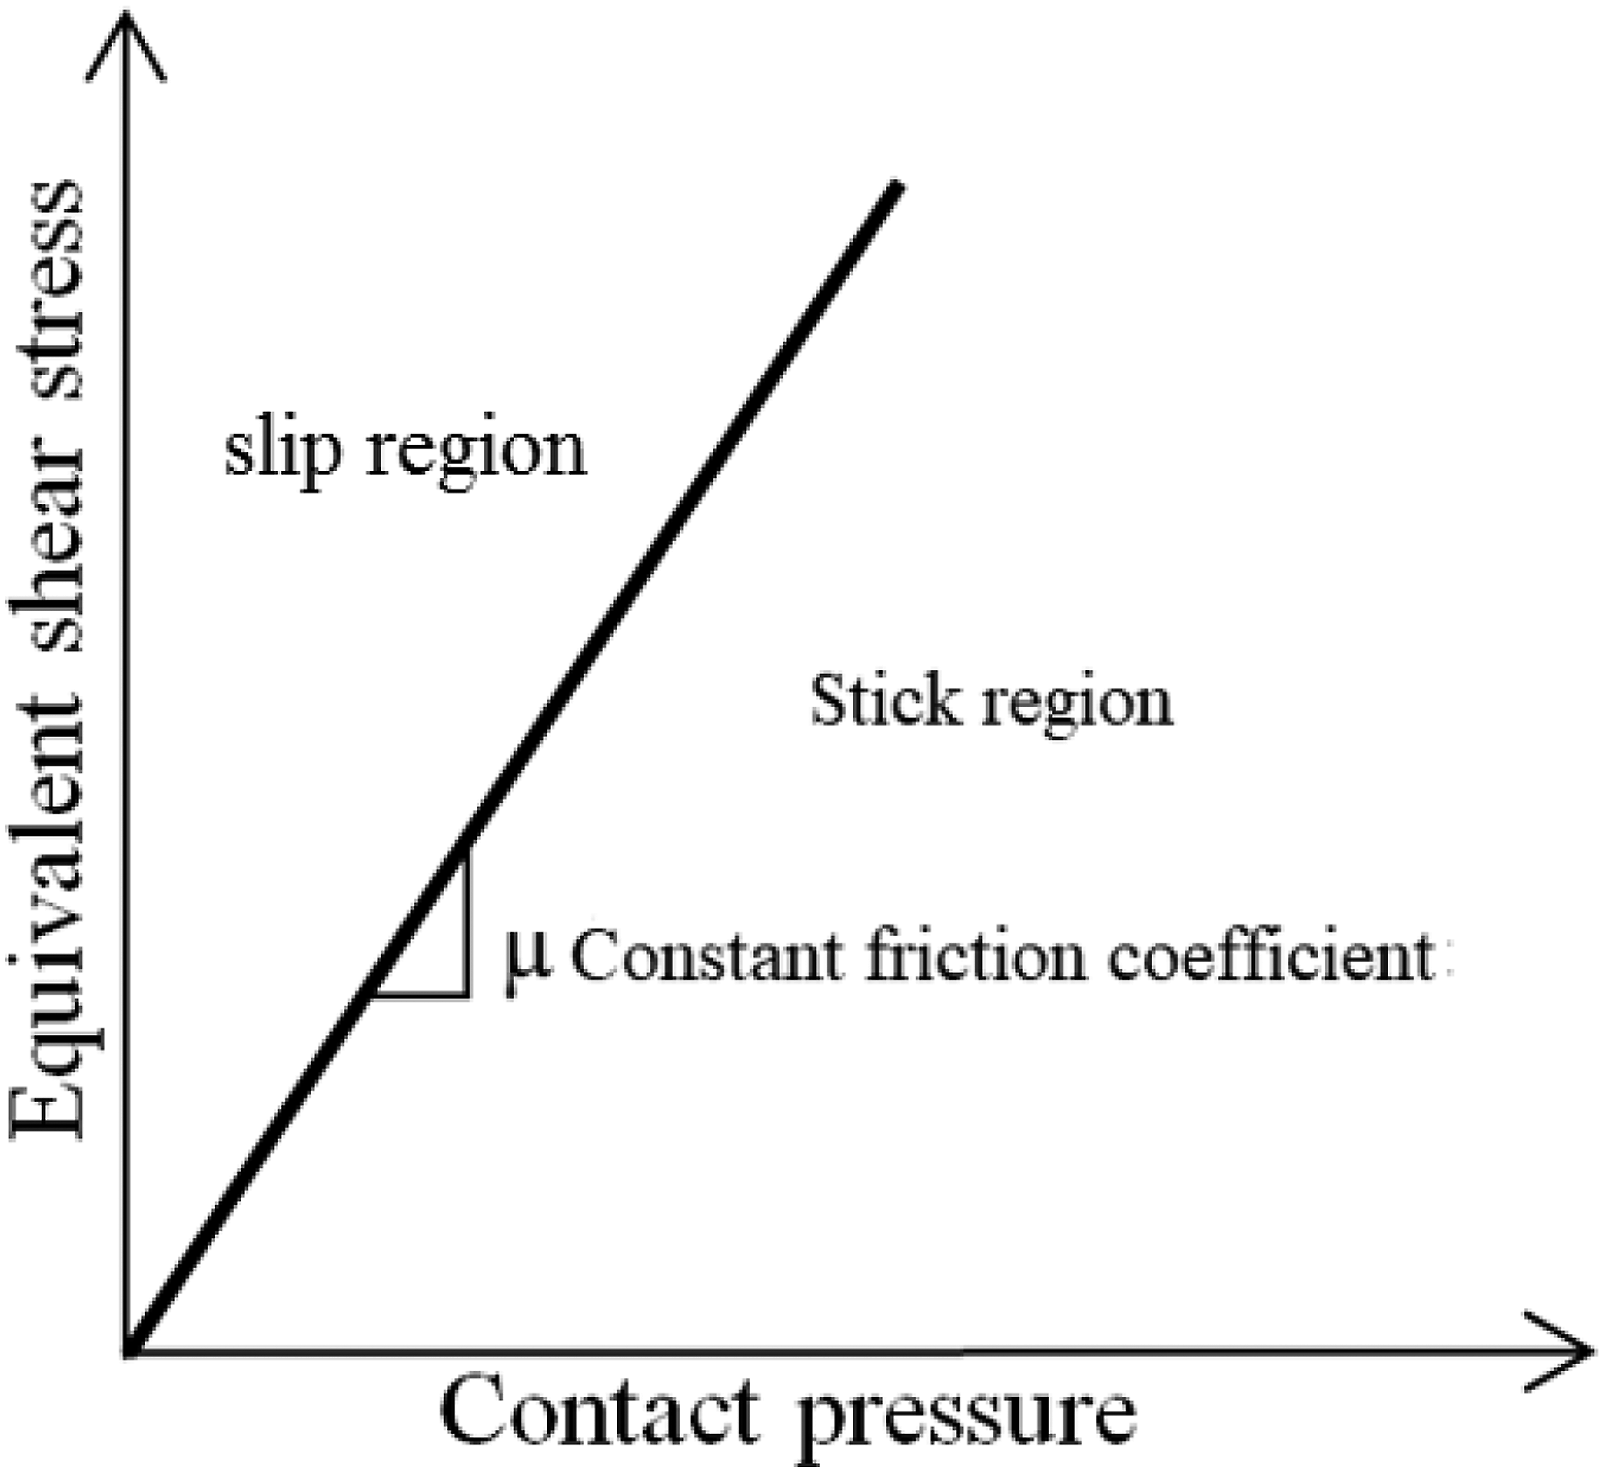
To enhance computing efficiency, these constraints are numerically realized using a penalty approach, which associate virtual work terms as follows
30


Boundary conditions
In the case of large deformations in the wale load direction, due to interaction between yarns on the left and right boundary edges (Figure 5), they tend to slide. This sliding causes incorrect load transfer within the domain and numerical convergence difficulties; Dani Liu et al.
27
applied tie constraint to the top and bottom rows of yarns in the course tension to avoid this problem. As a result, additional strength is recorded due to the prevention of natural contraction and rotation in the transverse direction perpendicular to the applied tensile load either in the course or wale direction. The use of periodic boundary conditions or stiffer material along the edge prevents the creation of realistic constraint behavior.22-24,27,31 Adjusted knitted structure.
To avoid this situation, an adjusted structure has been used (Figure 5), by connecting the fabric edges with similar ERC geometry with multi-filament yarn bending rigidity properties. The method in Ref.
32
was used to determine the approximate physical values of moment of inertia I11, I22, moment of inertia for cross-bending I12, and torsional constant J.
R yarn radius, G is shear modulus in the case of straight fiber, tan(Q)=2πRt, t is twist per yarn unit length. The bending moment used in the simulation are EI11, EI22= 5*10−6Nmm.
The bending behavior of this multi-filament yarn can be modeled by inserting these proprieties as a generalized shape section in Abaqus software.
The prescribed velocity in the wale direction increases linearly from 0 to 5 mm/s , then held constant for the remainder of the simulation.on. Force is recorded by coupling the nodes along the top boundary of the fabric in the wale load direction.
Knitting materials and testing methods
Knitted samples
Knitted jersey fabric samples were made using a manual rectilinear machine type RIMACH, set up with gauge number five (number of needles in an English inch equivalent to 2.54 cm). The fabricated specimens have three regions; the upper and bottom, called border and interior regions, as illustrated in Figure 6(a). The border region materials are three multi-filament acrylic yarns with a diameter of 0.7 mm. The borders protect the specimen from damage during loading. For the interior regions, a polyamide monofilament yarn (fishing line) with a diameter of 0.12 mm was chosen. This choice allowed us to study yarn-to-yarn interactions without the additional complication of intra-fiber contacts. In an environment of 24°C and 63% humidity, the knitted fabrics were kept for 48 h to achieve their relaxed state. (a), (b) Knitted fabric specimen, (c) microscope image of loop geometry.
Before the tensile loading, different regions of the fabric are pictured using a digital microscope to measure the geometrical parameters.
Tensile test
The yarn samples were subjected to quasi-static tensile tests on polyamide monofilament yarn (fishing line), as shown in Figure 7(a). A load force sensor with a 5 kN capacity and a loading rate of 5 mm/min was used. We tested five yarn samples, and then plotted the average.
33
Experimental set-up for tensile testing of yarn (a) and knitted fabric (b).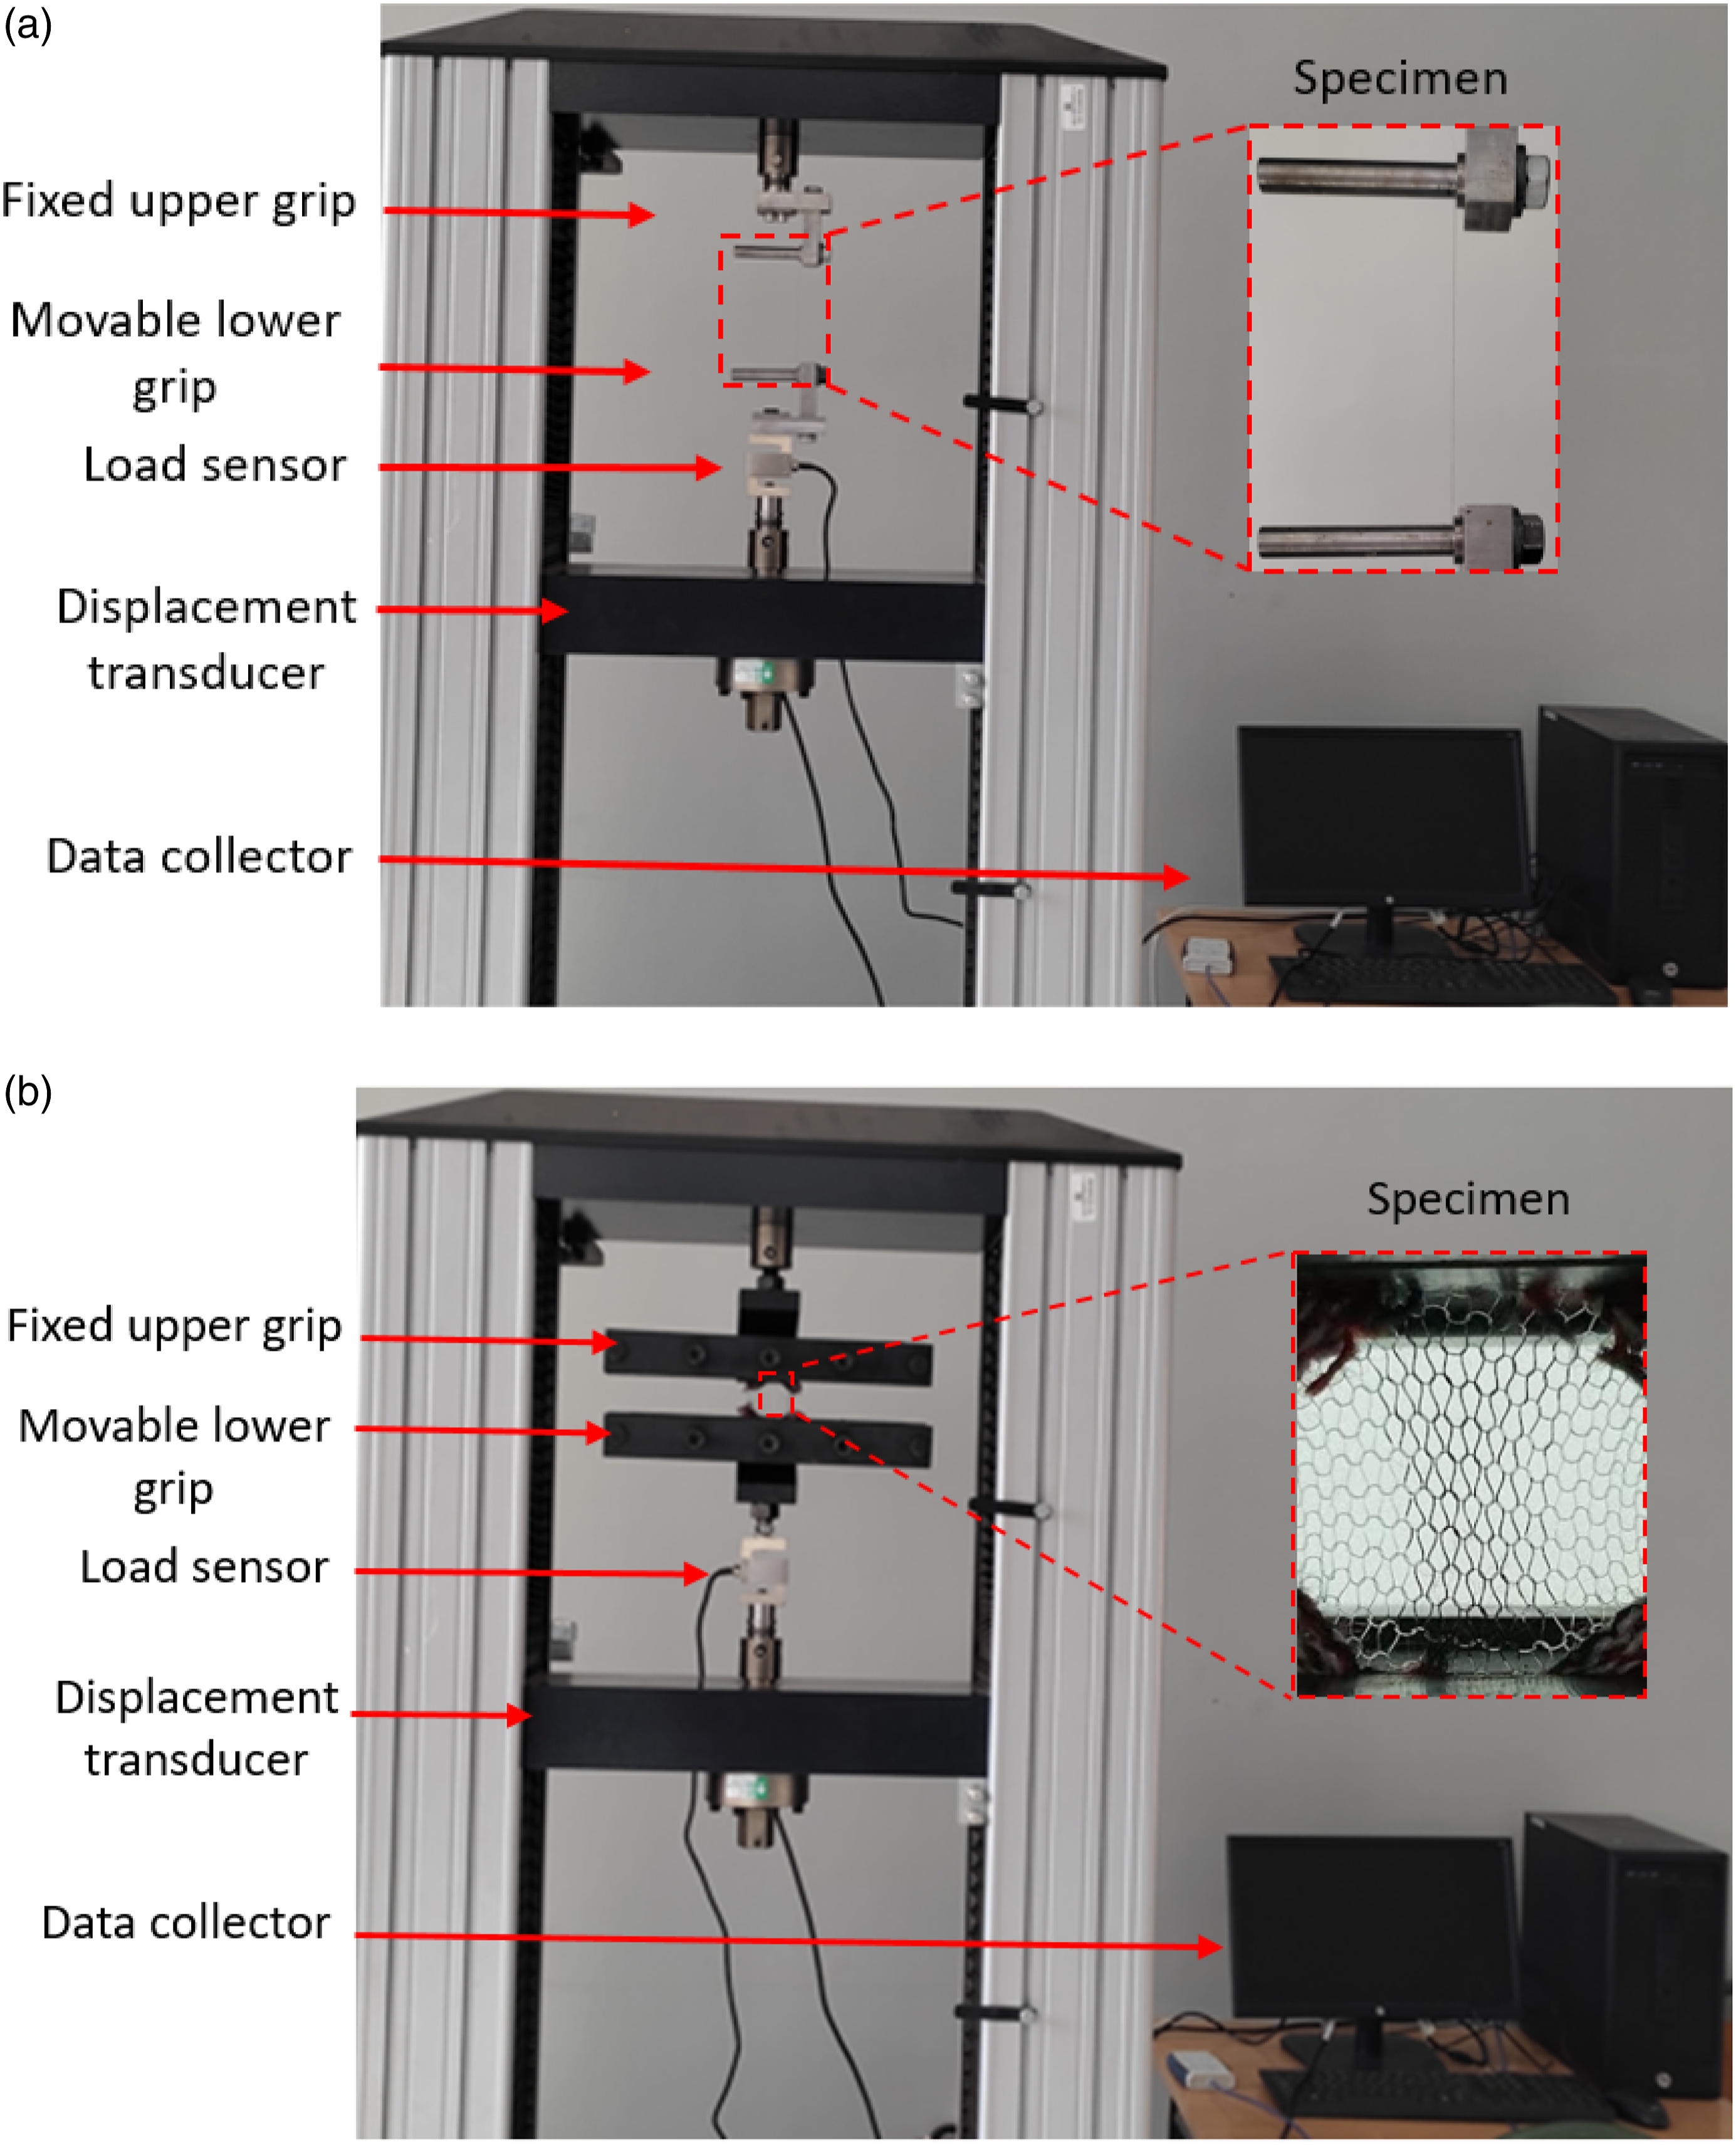
Next, we prepared 35x75 mm samples with nine columns and 15 rows of 0.12 mm yarn diameter for experimental testing Figure 7(b). We performed uniaxial tensile tests on the fabric samples using a universal testing machine; see Figure 7. Samples are tightened between the jaws and transverse displacement is applied at a 5 mm/min rate. 34 Since knitted fabrics are susceptible to fabrication uncertainties and variations, we tested five samples and plotted the range values of those measurements.
Results and discussion
Experimental investigation of mechanical behavior
Yarns static tensile test
The stress–strain curve Figure 8 shows that polyamide yarn follows a slight S-shaped curve. This profile may be seen in many melt-spun fibers, and comparable curves have previously been observed in nylon 6-6 fibers.35,
36
The same domains may be found here: (1) From 0 to 5% strain, the curve depicts the amorphous areas aligning, while the crystalline domain remains unloaded. As a result of the crystallization produced by mechanical stress, amorphous areas are reduced and the crystallinity ratio increases considerably. (2) From 5 to 10% strain, the characteristic shape of the end of the amorphous domain orientation appears. In this part, the crystallinity ratio increases more slowly. The end of the amorphous domain orientation takes on its distinctive form. (3) From 15 to 32% strain, C–C bonds form crystals, and orientated areas are stretched, activating enthalpy processes. The loading affects the chains from crystalline areas, which eventually break. Stress-Strain cruve of polyamide monofilament yarn tensile test.
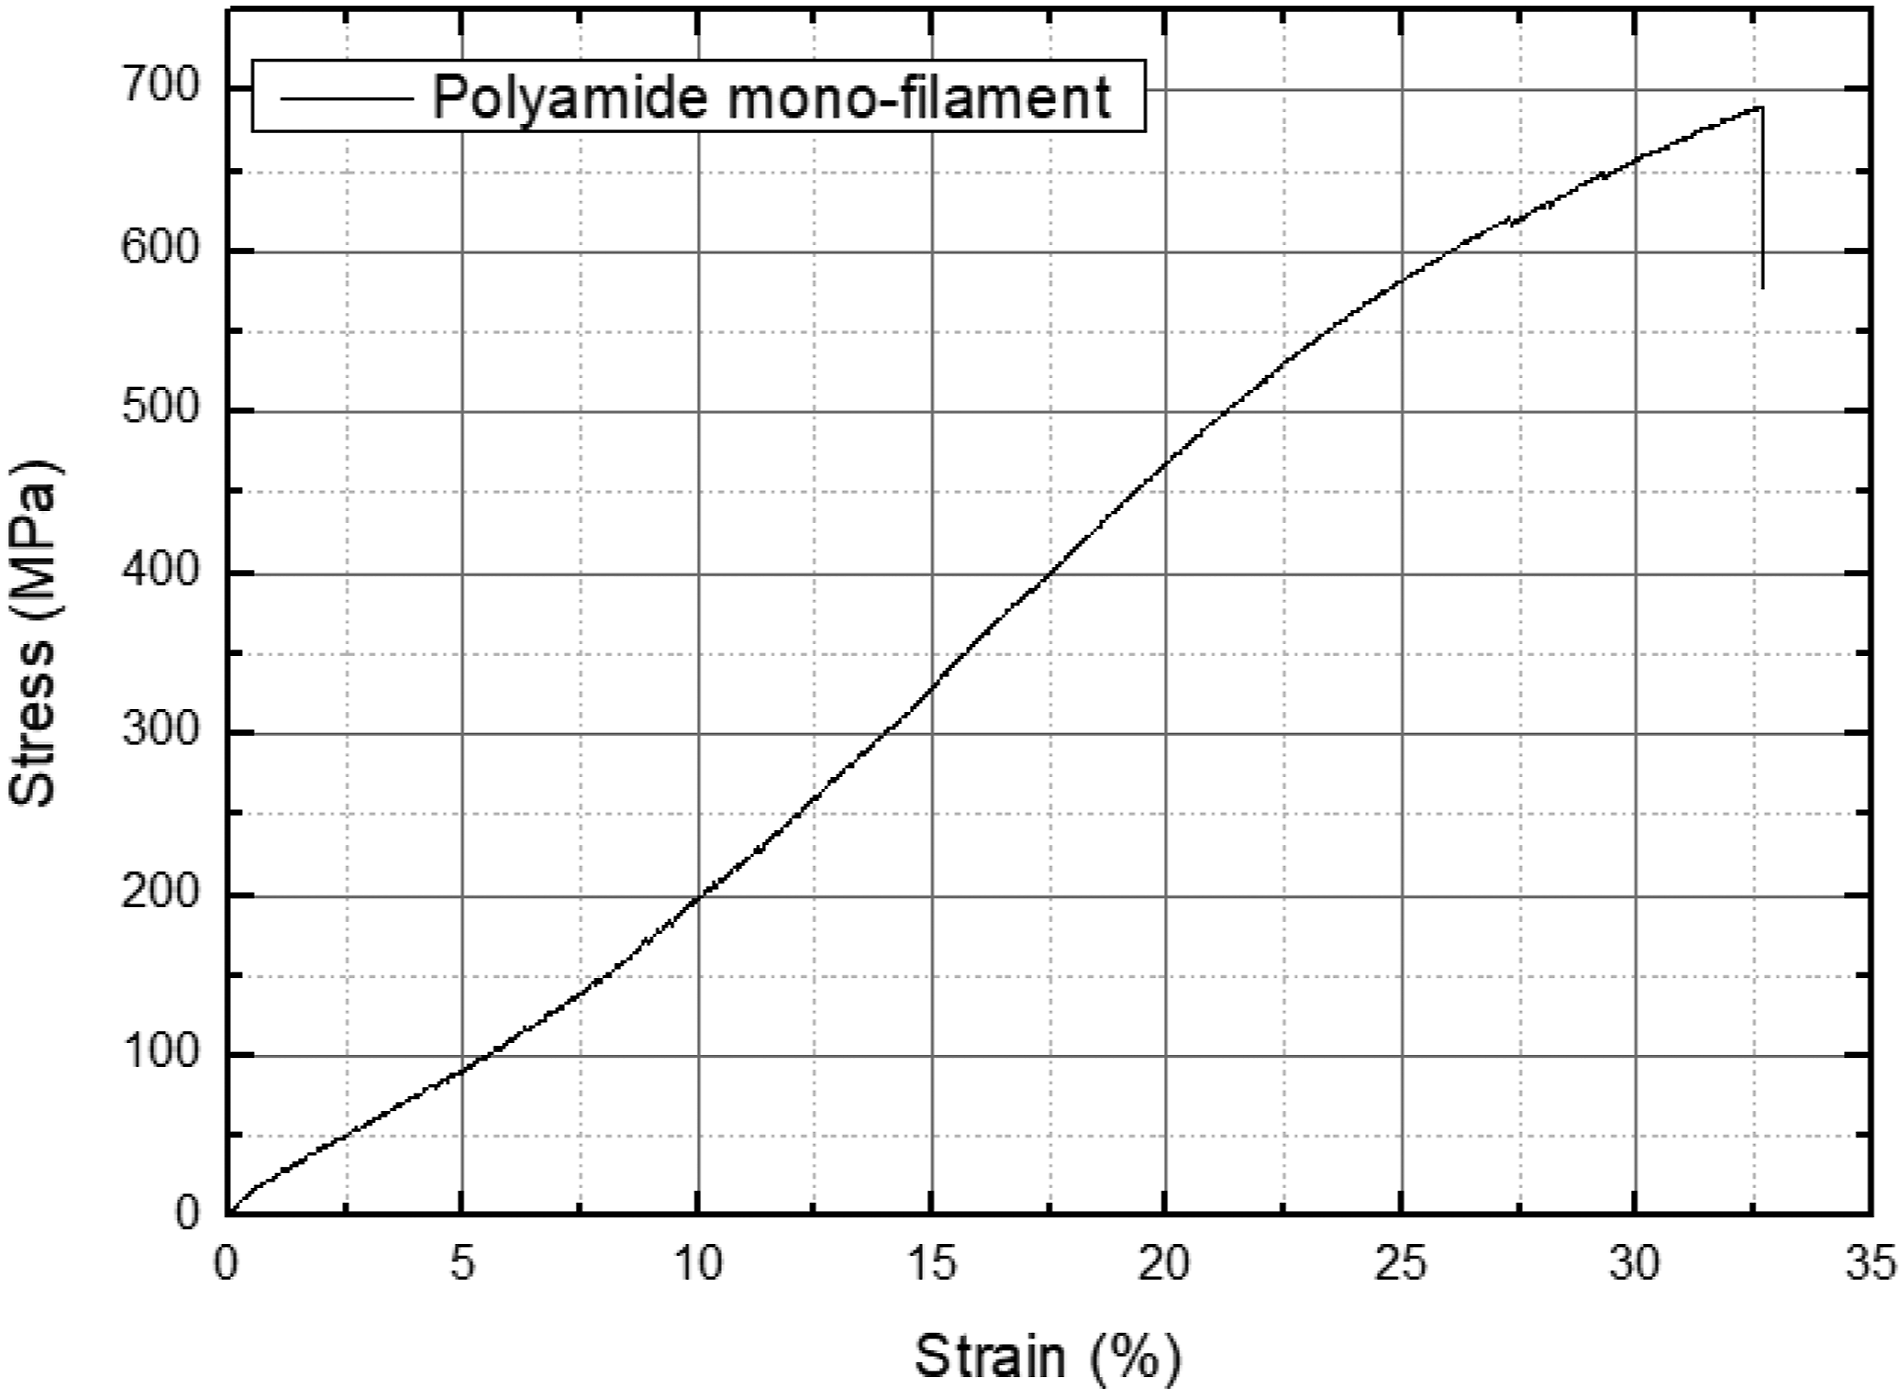
Since we have used linear elastic modulus as an input parameter, we set the range for young modulus from 0 to 10% strain range, corresponding to 1700 MPa.
Knitted fabric uniaxial-wale tensile results
Figure 9 shows the knitted fabric deformation stages in a wale direction tensile test and the representative measured force against displacement in the wale direction. As a result, when loading is applied in the wale direction, the specimen endures massive levels of overall stretch under a low amount of force in the early phases of deformation. This has to do with the sliding of relaxed yarns over each other in Figure 9 (II). Non-uniform lateral contractions (Poisson’s effect) arise because the knitted sutures are welded in the direction of the applied deformation at both ends, resulting in non-uniform strain and stress distributions. Force–strain curve in wale-wise direction tensile test of knitted simple with pictures of the knitted fabric deformation at different stages.
However, during a certain degree of stretching, additional yarn translation leads to significant bending deformation. Stretching becomes more prominent throughout this procedure when the yarns are as straight as possible, Figure 9 (III). Due to the stretching of stiff yarns, a linear final segment Figure 9 (VI) on the load-deformation curve begins and continues until the rupture of the specimen. It was demonstrated that this pathway in the wale direction appears to be less wavy, favoring yarn stretching and inter-yarn sliding over-rotation and out-of-plane motion. 37
Model simulation and validation
Mesh analysis
Total number of elements and degrees of freedom for different mesh resolution.


Mesh resolutions of nodes numbers in the ERC N10, N20, and N30 under wale tension. Interfacial and boundary condition effects on global behavior.
In this section, we investigate the impact of three boundary conditions on global motion behavior. We run uniaxial tensile test simulations with a strain range of 0–22%. The material parameters are based on yarn tensile testing with Young’s modulus of E = 1700 MPa, and from literature 0.39 as Poisson’s ratio
38
of and dynamic friction coefficient of 0.1 as minimal possible value.
39
Figure 11 shows the evolution of contact zone regions and geometrical changes in the wale load direction in four deformation stages for three different structures a (no constraint), b (tie constraint), and c (adjusted form on edge). Lower nodes were fixed in all structures, and prescribed displacement was applied to the nodes above. In structures a and c, the two side edges were left free, while for structure b edges were linked with a tie constraint. Contact zone regions and geometrical change in wale load direction in 2.2%, 8%, 16%, 22% deformation stages (a) basic structure, (b) tie structure, (c) adjusted structure.
At an earlier stage of deformation of 2.2%, the contact begins to occur in the center of the structure (a) and (c) as opposed to the tie structure, which occurs at the borders. This can be physically interpreted by the entanglement of the yarns, creating friction slip and slide between yarns when they are pulled. 40 It has also been shown that no significant geometrical shape changes have occurred in all cases.
As further wale tensile load is applied, there is the appearance of contraction and rotation in the transverse direction perpendicular to the load direction, resulting from motion between the yarn surfaces. This stage is piloted by the bending rigidity properties of yarn B=E.I. The stiffer it becomes, the greater its moment of inertia, which reduces the capability to spin, resulting in an out-of-plane deformation.
From 16% strain, in structure a, the contact-friction interaction between yarns on the left and right boundary edge causes them to slide, resulting in improper load transfer within the domain. The yarn spins lead to out-of-plane rotations. On the other hand, the structure c shows an appropriate load transfer within the domain, besides out-of-plane rotations.
At 22% strain, significant geometrical changes have occurred to the structure-based element; this phase has been highlighted by several authors.26,27 At the beginning of the stretching mode, structures (a) and (c) have undergone a significant form change with the overlapping of nodes, which might cause numerical convergence issues. Unlike tie structures, which endure width restriction and length elongation without causing out-of-plane rotation, the mechanical reaction is mostly controlled by the stiffness of the yarn in this strain range.
Boundary conditions on the free edges of the fabric have a major effect on out-of-plane displacement in the wale load direction. Previous researches have investigated the out-of-plane motion
19
but did not exceed a 5% strain range, whereas our work investigated these effects in a deformation range of up to 42%. Figure 12 shows out-of-plane displacement and form in tensile loading in structures a, b, and c. As mentioned in the experimental work,
37
a rapid transition of ordering in the loop geometry occurs up to stretching mode. This verifies that the modeling approach is sensitive enough to incorporate the complex mechanical behavior under in-plane load. Side view of: (a) basic structure, (b) tie structure and, (c) adjusted structure at 18% deformation.
Comparison with literature
Input parameters for simulation comparison.
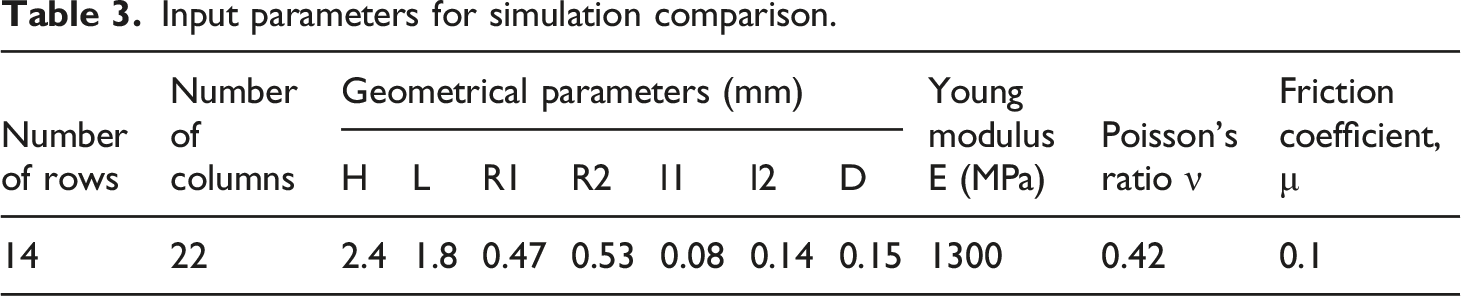

(a)-Comparison of simulation results for wale-wise strip uniaxial tension tests against experimental reference results obtained, 41 (b)wale-wise simulation allure.
Comparison against our experimental results
Uniaxial tensile tests have been performed in the previous section so that such tests can also be performed numerically for validation purposes. First, we computed the input parameters for the single jersey geometric model, and then the three boundary condition scenarios were simulated in order to compare them with the experimental results. The load/deformation curves obtained using the model and experiments are shown in Figure 14. Comparison of the simulations results against experiments.
Overall, there is a considerable accordance between experimental testing and simulations for both basic and adjusted models. As for tie structure, the differences between measurements and simulations are comparatively higher, although the nonlinear stiffening effect as strain increases is quantitatively well represented.
The model may be adjusted to better explain the load/strain curve for larger loads. This can be achieved, for example, by including a change in yarn diameter as well as an increase in contact force and young’s modulus or yarn frictional coefficients as a function of strain. Here, the model is unable to find a solution in wale-wise directions for stresses greater than 0.42 strain. Indeed, the model’s assumptions are quite strong. Nonetheless, this strain level appears to be enough for the intended use in general.
Conclusion
In this paper, we have provided a nonlinear meso-scale modeling and simulation framework for knitted textiles, which is a first step toward the creation of a digital approach for 3D knitted textile design and implementation. Our method relies on modeling and simulating the mechanical behavior of knitted textiles using a geometrical nonlinear beam model and real geometrical structures to describe the yarns of a stitch volume element.
The interactions between yarns were studied using a contact definition including friction, which adds a more physically realistic contact behavior. Local yarn interactions were found to be a direct cause of these mechanical behavior effects, the results of the simulations can be used to understand the evolution of interfacial interactions during tensile load. An experimental approach was also used to verify the model by investigating the mechanical response of single jersey-knitted fabrics under in-plane tensile load.
Further validations of the multi-scale simulation approach for more complex loading scenarios are planned, as well as the extension to the macro-scale model and homogenization procedure to shell models. Hence, this study yields compelling results that encourage parametric investigation of many topological and geometrical variables linked to the hierarchical structure of knitted fabrics.
Footnotes
Acknowledgements
Many thanks to the AIRSOLA company,for its support through our work.
Declaration of conflicting interests
The author(s) declared no potential conflicts of interest with respect to the research, authorship, and/or publication of this article.
Funding
The author(s) received no financial support for the research, authorship, and/or publication of this article.