
Abstract
Knife-coating can confer new properties on different textile substrates efficiently by integrating various compounds into the coating paste. Graphene nanoplatelets (GNP) is one of the most used elements for the functionalization of fabrics in recent years, providing electrical and thermal conductivity to fabrics, later used to develop products such as sensors or heated garments. This paper reports thermoelectrically conductive textiles fabrication through knife-coating of cellulosic fabrics with a GNP load from 0.4 to 2 wt% within an acrylic coating paste. The fabric doped with the highest GNP content reaches a temperature increase of 100°C in few seconds. Besides, it is found out that the thermographic images obtained during the electrical voltage application provide maps of irregularities in the dispersion of conductive particles of the coating and defects produced throughout their useful life. Therefore, the application of a low voltage on the coated fabrics allows fast and effective heating by Joule’s effect, whose thermographic images, in turn, can be used as structural maps to check the quality of the GNP doped coating. The temperature values and the heating rate obtained make these fabrics suitable for heating devices, anti-ice and de-ice systems, and protective equipment, which would be of great interest for industrial applications.
Introduction
The knife-coating technique is a simple, inexpensive, and an industrial way to impart new features to a fabric by adding specific compounds to the coating paste, that is, phase-change materials, active ingredients, or conductive particles. 1 This procedure makes it possible to cover large areas of textile, with machinery well known in the industry, and to easily regulate parameters such as the thickness of the coating or the angle of the blade to achieve greater specificity in the attributes of the final product. 2 The application of conductive elements, such as metallic particles or graphitic nanoparticles, 3 enables the manufacture of fabrics with new functionalities, including sensors, smart textiles, electromagnetic shielding, or heating devices.
Textiles with thermoelectrical properties are of interest in a wide range of commercial and industrial applications like personal thermoregulation, 4 energy harvesting,5–7 or anti-ice/de-ice systems.8,9 Their heating behavior is explained through Joule’s effect, which states that the electric current circulating in a conductive material causes power loss in the form of heat generation 10 and this behavior can easily be used to warm up fabrics if they have the proper level of conductivity. 11
Graphene, a carbon nanoparticle discovered in 2004, 12 is a flat monolayer of carbon atoms tightly packed into a two-dimensional honeycomb lattice. 13 It has high electrical and thermal conductivity,14–16 as well as excellent mechanical 17,18 and optical 19,20 characteristics. In the textile field, there are numerous studies that apply graphene and its derivatives to improve the properties of fabrics or achieve new uses from them. The use of this product makes it possible to tune both thermal and electrical conductivity of the base material, incorporating graphene nanoplatelets(GNP) as part of the coating or the fibers. Some of the most advanced developments use graphene to manufacture sensors and smart textiles,21–27 electromagnetic shielding,28–30 and flexible energy production devices.31,32
Currently, there are several alternatives to incorporate graphene into textile substrates. The most common procedure is dip-coating, where the textile is immersed in a bath containing the conductive particles for a certain amount of time and becomes evenly coated; however, this is not a suitable procedure due to the existence of no affinity between the GNP and the fiber. Pad-coating is similar to dip-coating, but in this case, the textile goes through one or more pairs of rollers to squeeze out the excess of dispersion,33–36 and force the GNP to move toward the inner part of the yarns. Both techniques wet the entire substrate, but pad-coating enables better control of the amount of dispersion transferred to the textile and allows the particles to penetrate deeper. Knife-coating consists of spreading a polymeric coating paste over a textile substrate using a coating knife or blade. 2 Dip and pad-coating coat both sides of the fabric, while knife-coating only coats one side. For certain applications, having both sides of the fabric coated may be unnecessary, so knife-coating would be a more appropriate technique in those cases. Some examples include sensors, soft circuits, or fabrics in contact with the wearer skin where an electric current is applied, such as heating garments. Graphene can be directly added to the coating paste or dispersion as GNP, although some researchers add graphene oxide (GO) and later reduce it, which unlike graphene, shows excellent dispersion in water-based procedures and adhesion due to its hydrophilicity and abundant oxygen-containing groups.37–39 However, the advantage of introducing GNP directly is that its electrical conductivity is higher as it does not have structural defects in the C-C network that decrease its electrical conductivity, such as acid groups or hydroxyl from the GO.
In this work, it is proposed the incorporation of different percentages of few-layers GNP (from 0.4 to 2 wt%) into a coating solution applied on cellulosic fabrics through a knife-coating procedure, using acrylic compounds to formulate the paste. Some authors 40,41 have examined the incorporation of GNP into textiles using the knife-coating technique to achieve thermoelectrically conductive fabrics; however, the amount of GNP they added to the coating solution is considerably higher than in this work or reach lower temperature increase. Considering the wide range of temperatures achieved by the manufactured samples, the spectrum of possible applications is diverse: heated mats for industrial processes, heated furniture, heated seats for automotive products, heated blankets for health and comfort, and heated garments, both for fashion and for technical and protective clothing.
Likewise, this paper introduces using the study of the thermoelectric behavior of the coated fabric to map the distribution of particles and spot irregularities in the coating. Infrared imaging has been used for decades to analyze thermal performance of fabrics, however, its potential as a characterization technique for fabrics has not been fully exploited so far. In this work, it is employed as a tool to provide a macroscopic image of conductive particles distribution, as well as a non-destructive technique to evaluate defects caused in the fabric due to rubbing fastness, obtaining a clear image of the changes produced in the coating. The use of thermal images to provide information about the deterioration of coated fabrics has not been reported in the existing literature and here is proven to be useful to evaluate defects produced when manufacturing the samples and throughout their useful life. Furthermore, the optimal conditions regarding time and voltage to carry out said examination in textile coatings are analyzed.
Experimental
Materials
The fabric used for this research is a 50% cotton-50% flax twill with a mass per unit area of 210 g/m2, a thickness of 0.55 mm, and chemically bleached in an industrial process.
Graphene nanoplatelets with an average size of 30 x 40 µm and 10 nm of thickness, synthesized by a modified Hummers method using flake graphite powders as the starting material, is supplied by Innovatec SC, S.L.
The base coating paste is obtained using acrylic binder Center BC supplied by Color-Center S.A., acrylic thickener Lutexal CSN and fixing agent Luprintol SE, supplied by Archroma, and ammonia 28% provided by Prolabo.
Fabric coating procedure
The coating paste is obtained through mechanical stirring at 2000 r/min for 150 s, and contains 20 g/kg of thickener, 10 g/kg of binder, 10 g/kg of fixing agent, 10 g/kg of ammonia, and distilled water up to 1 kg of solution.
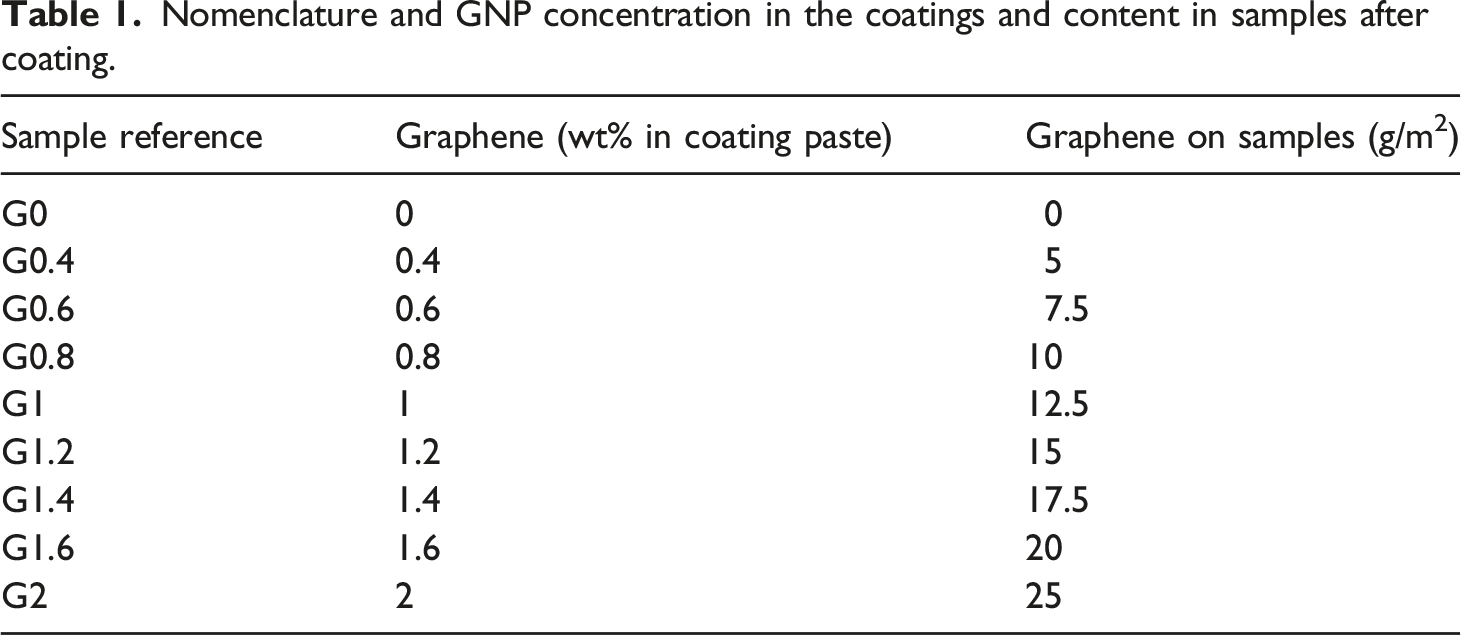
Nomenclature and GNP concentration in the coatings and content in samples after coating.
Fabric samples with a 20 x 30 cm size are coated through a knife-coating technique, using both metallic surface and blade. The samples are fixed to the frame with a pressure grip. The blade is positioned at an angle of 90° and a gap of 1.5 mm from the surface. The coating paste is poured onto the fabric, then the coating paste excess is removed. The samples are oven-dried at 60°C for 1 h and, afterward, cured at 150°C for 3 min. When samples are dried, coating weight is reduced up to 95% due to moisture release, resulting in a dried coating weight of 62.5 ± 5% g/m2. Figure 1 shows a schematic representation of the coating process described above. Schematic representation of the knife-coating process.
Samples characterization
The observation of the samples is carried out using a Field Emission Scanning Electron Microscope (FE-SEM) (ULTRA 55, ZEISS) and Transmission Electron Microscopy (TEM) (TEM-1010 (JEOL)). To analyze the nanoparticles dispersion by FE-SEM, the surface of samples were covered with a thin layer of gold and palladium using a Sputter Coater. The samples are analyzed with an acceleration voltage of 2 kV in SEM and 80 kV in TEM.
Thermogravimetric analyses (TGA) are performed using a Mettler Toledo thermobalance according to UNE-EN ISO11358-1:15. The tests are carried out in nitrogen atmosphere and scanned from 40 to 600°C at a heating rate of 10°C/min.
The rubbing fastness tests are carried out according to UNE-EN ISO 105-X12:2016, with specimens’ size adjusted to 40 x 100 mm. Each sample is abraded against cotton abrasive fabric for 10 cycles in a dry state using a Crockmeter. The results are evaluated in an appropriate light cabin, by visual assessment with a gray scale.
Electrical sheet resistance evaluation
Electrical sheet resistance values are obtained with a source-meter unit instrument, model Keithley 2410. Fabric samples are cut down to 4 x 10 cm, and copper wires are attached with silver paint to both ends distanced 8 cm, as depicted in Figure 2(a). Two sets of measurements are taken for each sample, with voltages from 0 to 10 V, and processed with LabTracer software. Sheet resistance values are obtained from the inverse of the slope of the I-V curve. Setup for (a) electrical sheet resistance evaluation and (b) thermoelectric evaluation.
Thermoelectrical evaluation
Thermoelectrical behavior is evaluated under different constant voltages (10, 20, 30, 40, and 50 V) using a programmable DC source-meter supply from Chroma. Each voltage is applied for 2 min. The thermal heating of each sample is recorded with an infrared thermal camera, model Flir E50, placed 20 cm above the sample at an angle of 90°. The camera records for 2 min while heating and for 2 min while cooling after the voltage is off. Results are processed with FLIR Tools software. Samples are prepared as described in 2.4. Figure 2(b) includes a schematic representation and an actual image of the test setup. Room temperature is 25°C.
Results and discussion
Sample characterization
Figure 3 includes two images of the coated samples, flat and twisted. After coating, the fabric remains flexible and the paste has not penetrated to the back of the fabric. Images of the coated samples.
Figure 4 includes FE-SEM images of the morphology of GNP-coated fabric samples after undergoing the knife-coating process, at ×10000 magnification. Figure 4.a shows the fabric covered by the coating paste without the presence of GNP. From Figure 4(b)–4(h), the samples are displayed in ascending order according to their GNP content and it can be seen how the conductive particles are embedded within the acrylic matrix. It is also observed that the distribution of the GNP particles in the coating is not homogeneous, but rather that several clusters of graphene platelets can be found in random areas. These aggregates are primarily detectable in samples with a higher concentration, such as Figure 4(e) and (f). On the one hand, this fact is attributed to graphene’s hydrophobic behavior,
42
making it challenging to integrate into the coating paste mixture. It is also associated with its low specific density,
43
which implies a relatively high GNP volume incorporated into the coating paste, even with lower concentrations. Likewise, it is detected that the mixing process carried out is inefficient for a correct distribution of the conductive particles, and it is essential to evaluate other mixing systems to achieve greater homogeneity of the GNP dispersion in the coating paste. FE-SEM images at ×10000 magnification of samples (a) G0.4; (b) G0.6; (c) G0.8; (d) G1; (e) G1.2; (f) G1.4; (g) G1.6; (h) G2. The red rectangles mark some GNP agglomerates.
On the other hand, Figure 5 shows two cross-sectional images of sample G1.6, where it is seen how the coating has been deposited on one side of the fabric. Likewise, the thickness of the coating is measured once the samples have dried and the value is around 0.05 mm. FE-SEM cross-section of sample G1.6 at a) ×120 and b) ×500 magnification.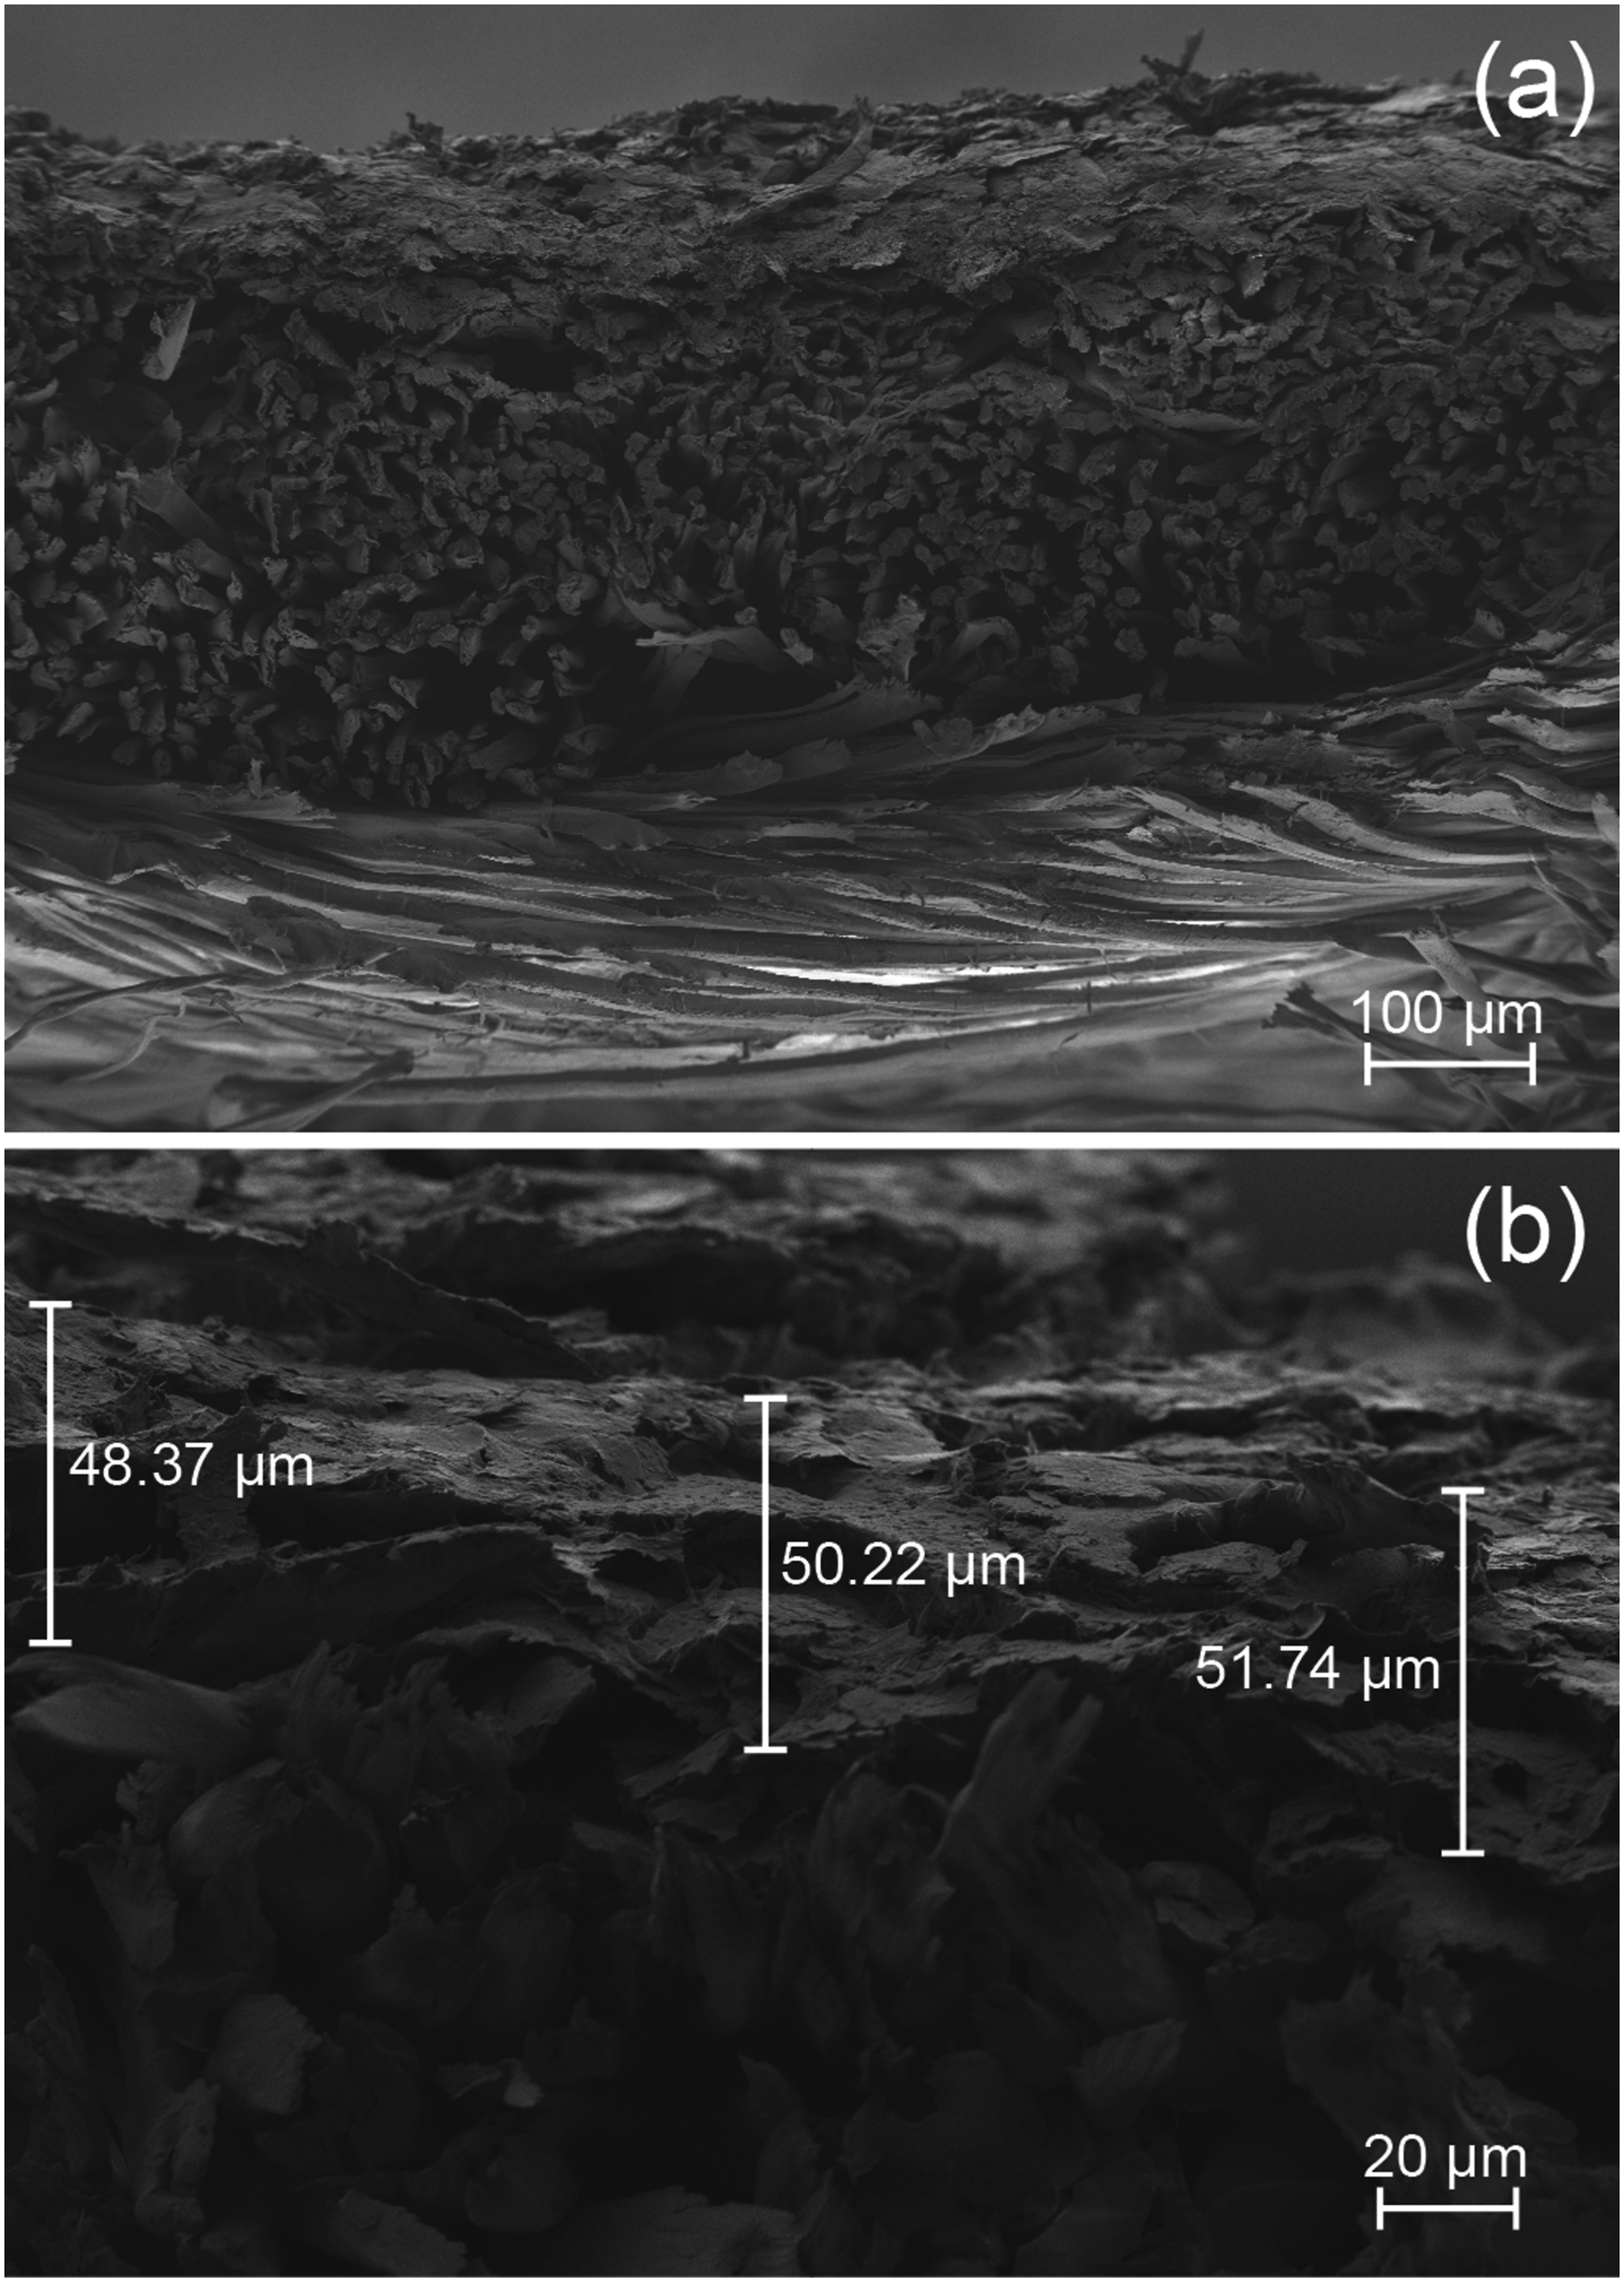
Figure 6 shows the image obtained from TEM analysis of sample G1.6. In this image the distribution of GNP in the coating can be observed, as well as the enlarged details of certain GNP clusters. TEM image of sample G1.6.
The thermogravimetric analysis provides information about the thermal stability of the sample, which is crucial to determine their viability for heating applications. In this case, tests are carried out with the uncoated fabric and the samples G0, G1, and G2, to determine the behavior of the untreated fabric and the several coated fabrics in order to know the thermal strength of used doped paste. Figure 7 shows the result of the thermogravimetric curves of the samples mentioned above and Table 2 includes weight change rates and onset temperatures for each sample. TGA and DTA plots for (a) uncoated fabric; (b) G0; (c) G1; (d) G2. Weight change rate and temperature (°C) details of TGA analysis.

In the uncoated fabric, a first step related to the dehydration is observed as expected, with a mass loss of 2.16%. The most relevant mass loss occurs in a second stage, between 341.50 and 383.42°C, with an inflection point at 368.51°C, during which the compounds of the fabric (mainly cellulose) decompose, with a mass loss of 84.99%. For G0, weight loss in the first stage is very similar to the uncoated fabric, 2.15%, while the loss in the second stage is slightly higher, 85.80%, which indicates the decomposition of elements belonging to the coating paste (primarily acrylic compounds) and the degradation of the fabric as well. Thus, both tests’ thermogravimetric curves have a similar appearance, a fact that is also related to the high percentage of fabric compared to the low amount of coating present in the sample: while the average thickness of the fabric is 0.55 mm, the thickness of the coating is around 0.05 mm. For samples G1 and G2, the temperatures of the different stages remain similar, but the percentage of mass loss decreases when the amount of GNP increases, both in the moisture release stage (2.08 and 1.79%, respectively) as a result of GNP hydrophobicity, and in the second stage in which the fabric and the coating decompose (83.31 and 82.05%). Given the high thermal stability exhibited by graphene,44,45 this component of the sample does not decompose and remains intact during the test, so the higher the GNP content, the higher the residue, therefore the percentage of mass loss for sample G2 is the least among the four of them.
The results obtained from the TGA confirm the viability of the samples for heating applications, which will remain thermally stable up to temperatures of 300°C.
Rubbing fastness of GNP-coated samples.

Electrical sheet resistance evaluation
Figure 8 illustrates the electrical sheet resistance values obtained for each of the samples. In the case of samples G0.4 and G0.6, no electrical conductivity is detected within the values in compliance with the measurement equipment. Electrical sheet resistance for GNP-coated fabrics.
As expected, the sheet resistance values are considerably reduced by increasing the amount of GNP added in the coating paste since a higher presence of conductive particles generates an electrical network with greater connection points that allow better mobility of electrons in the coating. Kim et al. report a sheet resistance of 1.0 × 10² ± 1.0 × 101 Ω/sq with 32 wt% GNP, 40 and 1.93 × 10⁵ ± 3.69 × 10⁴ Ω/sq with 4 wt%, 41 while in this case, with 2 wt% of GNP load in the coating paste the samples exhibit a sheet resistance of 2.03 × 10² ± 0.5 × 101 Ω/sq, therefore achieving better results with lower GNP content in the coating solution. The main differences found between this work and Kim et al. manuscripts are, on the one hand, the add-on quantity of coating solution and moisture release, which are not discussed in the mentioned studies and are expected to differ from this work, and on the other hand, the type and quantity of binder used, 25 wt% WPU 40 and 15 wt% PVDF-HFP, 41 while in this paper acrylic resin has been used at 1 wt%. In previous internal tests, it has been identified that the use of WPU considerably increases the electrical resistance of the samples, mainly due to the higher content of binder necessary according to supplier’s instructions, which generates a denser network within the coating and hinders contact between conductive particles.
Thermoelectrical evaluation
The electrothermal behavior of each sample is evaluated through Joule’s effect, meaning an electric current is applied to the conductive material and produces a power loss in the form of heat generation, which is recorded with an infrared thermal camera. Voltages studied are 10, 20, 30, 40, and 50 V. For samples with higher GNP content, 50 V tests were not carried out for safety reasons, as the temperature reached was far above the ones desired for textile applications. Figure 9 displays the variation of average temperature (ΔTave) recorded in each of the samples, according to the applied voltage, after 2 min of heating. Two samples are tested for each voltage and GNP content, and the mean value is obtained. Average temperature variation of each sample after 2 min.
When testing samples with low GNP content, almost no heating is observed for voltages 10 and 20 V. When 40 or 50 V are applied, a significant increase in temperature is recorded. For samples with high GNP percentage, considerable temperature increases are obtained with relatively low voltages and close to 100°C when applying 40 V with GNP load of 2 wt%. Compared to the literature reviewed, Kim et al. samples reach temperature variations of 40°C with 16 wt%. 41
Figure 10 gathers the heating rates for the mean value of ΔTave reached by each sample according to the applied voltage and Figure 11 presents the heating rate of all samples at every voltage applied after 5 s. The main conclusions drawn when analyzing the graphs are: 1. Samples with lower concentrations experience a moderate temperature increase in all cases. The initial slope of the heating curve is not very steep; however, they reach their highest temperature increase around 50 s, and subsequently, their temperatures remain stable during the rest of the heating phase. The heating rate increase observed is proportional to the increment in GNP content and voltage applied. 2. Samples with higher concentrations heat up quickly, with heating rates higher than expected after having observed the previous samples, suggesting the percolation threshold has been achieved. However, they do not reach a stable temperature so if a voltage is applied for longer than 2 min, these samples will reach higher temperature values. 3. It is worth highlighting that the sample with the highest GNP content, when applying 40 V, has a heating rate close to the previous sample (4.63 °C/s for G2 and 3.93 °C/s for G1.6), which suggests that is the voltage limit to apply and higher increases in voltage will not achieve noticeable differences in the results. 4. In Figure 10, the difference between curves of the tested specimens for samples G1.2, G1.4, G1.6, and G2 does not exceed in any case a deviation greater than 10% compared to the mean represented in the graph. In samples G0.8 and G1, especially at low voltages, the temperature oscillation spans between ± 0.5 and ± 5°C. The standard deviations for the data in Figure 11 range between 0.24 and 4.69°C, with the exception of G1 at 50 V, G1.6 at 40 V, and G2 at 30 V that show SD values of 6.71, 7.89, and 5.89°C, respectively. ΔTave of the samples at (a) 10 V; (b) 20 V; (c) 30 V; (d) 40 V. Heating rate of the samples after 5 s.


To verify the reproducibility of the results obtained when applying these fabrics in commercial or industrial applications, the behaviors of the samples with the highest GNP content are studied for a voltage of 20 V during 10 cycles. Each cycle consists of a 2-min heating phase where the voltage is on, and a 2-min cooling phase where the voltage is off. Figure 12 shows the results for the mean temperature variation obtained by both samples at the end of the heating stage. Both samples remain very stable throughout the cycles with a variation of less than ± 1°C between cycles and a standard deviation around 0.71°C between specimens, confirming their suitability for industrial purposes. Analysis of samples G1.6 and G2 thermal heating after 10 cycles at 20 V.
Thermographic images of samples G1.2 and G2 at 20 and 40V, for 0.5 and 120 s. Temperature scale bars in Celsius degrees.

When high voltages are applied there is a considerable temperature increase in the coating, so the thermal contrast between areas with a large congregation of conductive particles and areas with less quantity is quite evident. By applying lower voltages, the temperature difference between areas with a higher concentration of GNP and areas with lower concentration decreases, so it is not as evident as in the previous case.
Regarding the exposure time, in short periods (0.5 s) the heat is concentrated in the areas where there is a higher amount of conductive particles, so they can be clearly spotted. For longer periods of exposure (120 s), the thermally conductive nature of graphene causes the heat to spread over the surface, so it becomes more complex to identify areas with particle aggregates.
To further explore the defects mapping provided by analyzing thermal behavior through Joule’s effect, Figure 13 shows in detail, marked in red, the conglomerates of particles found in the coating. There are also areas with a significant lack of conductive particles marked with green arrows. By using high voltages for a short period of time, these are exposed and defects in the distribution of the GNPs can be easily visualized. In highly conductive samples (Figure 13(d)–(f)), defects are identified clearly due to the high temperature achieved, which provides better contrast between regions. For lower conductive samples (Figure 13(a)–(c)), GNP agglomerates can be detected, however, areas with lower GNP presence are less noticeable. Thermographic images of samples (a) G0.8; (b) G1; (c) G1.2; (d) G1.4; (e) G1.6; (f) G2; at 40V, for 0.5 s. The red circles mark some GNP agglomerates, the green arrows mark areas with lower GNP presence.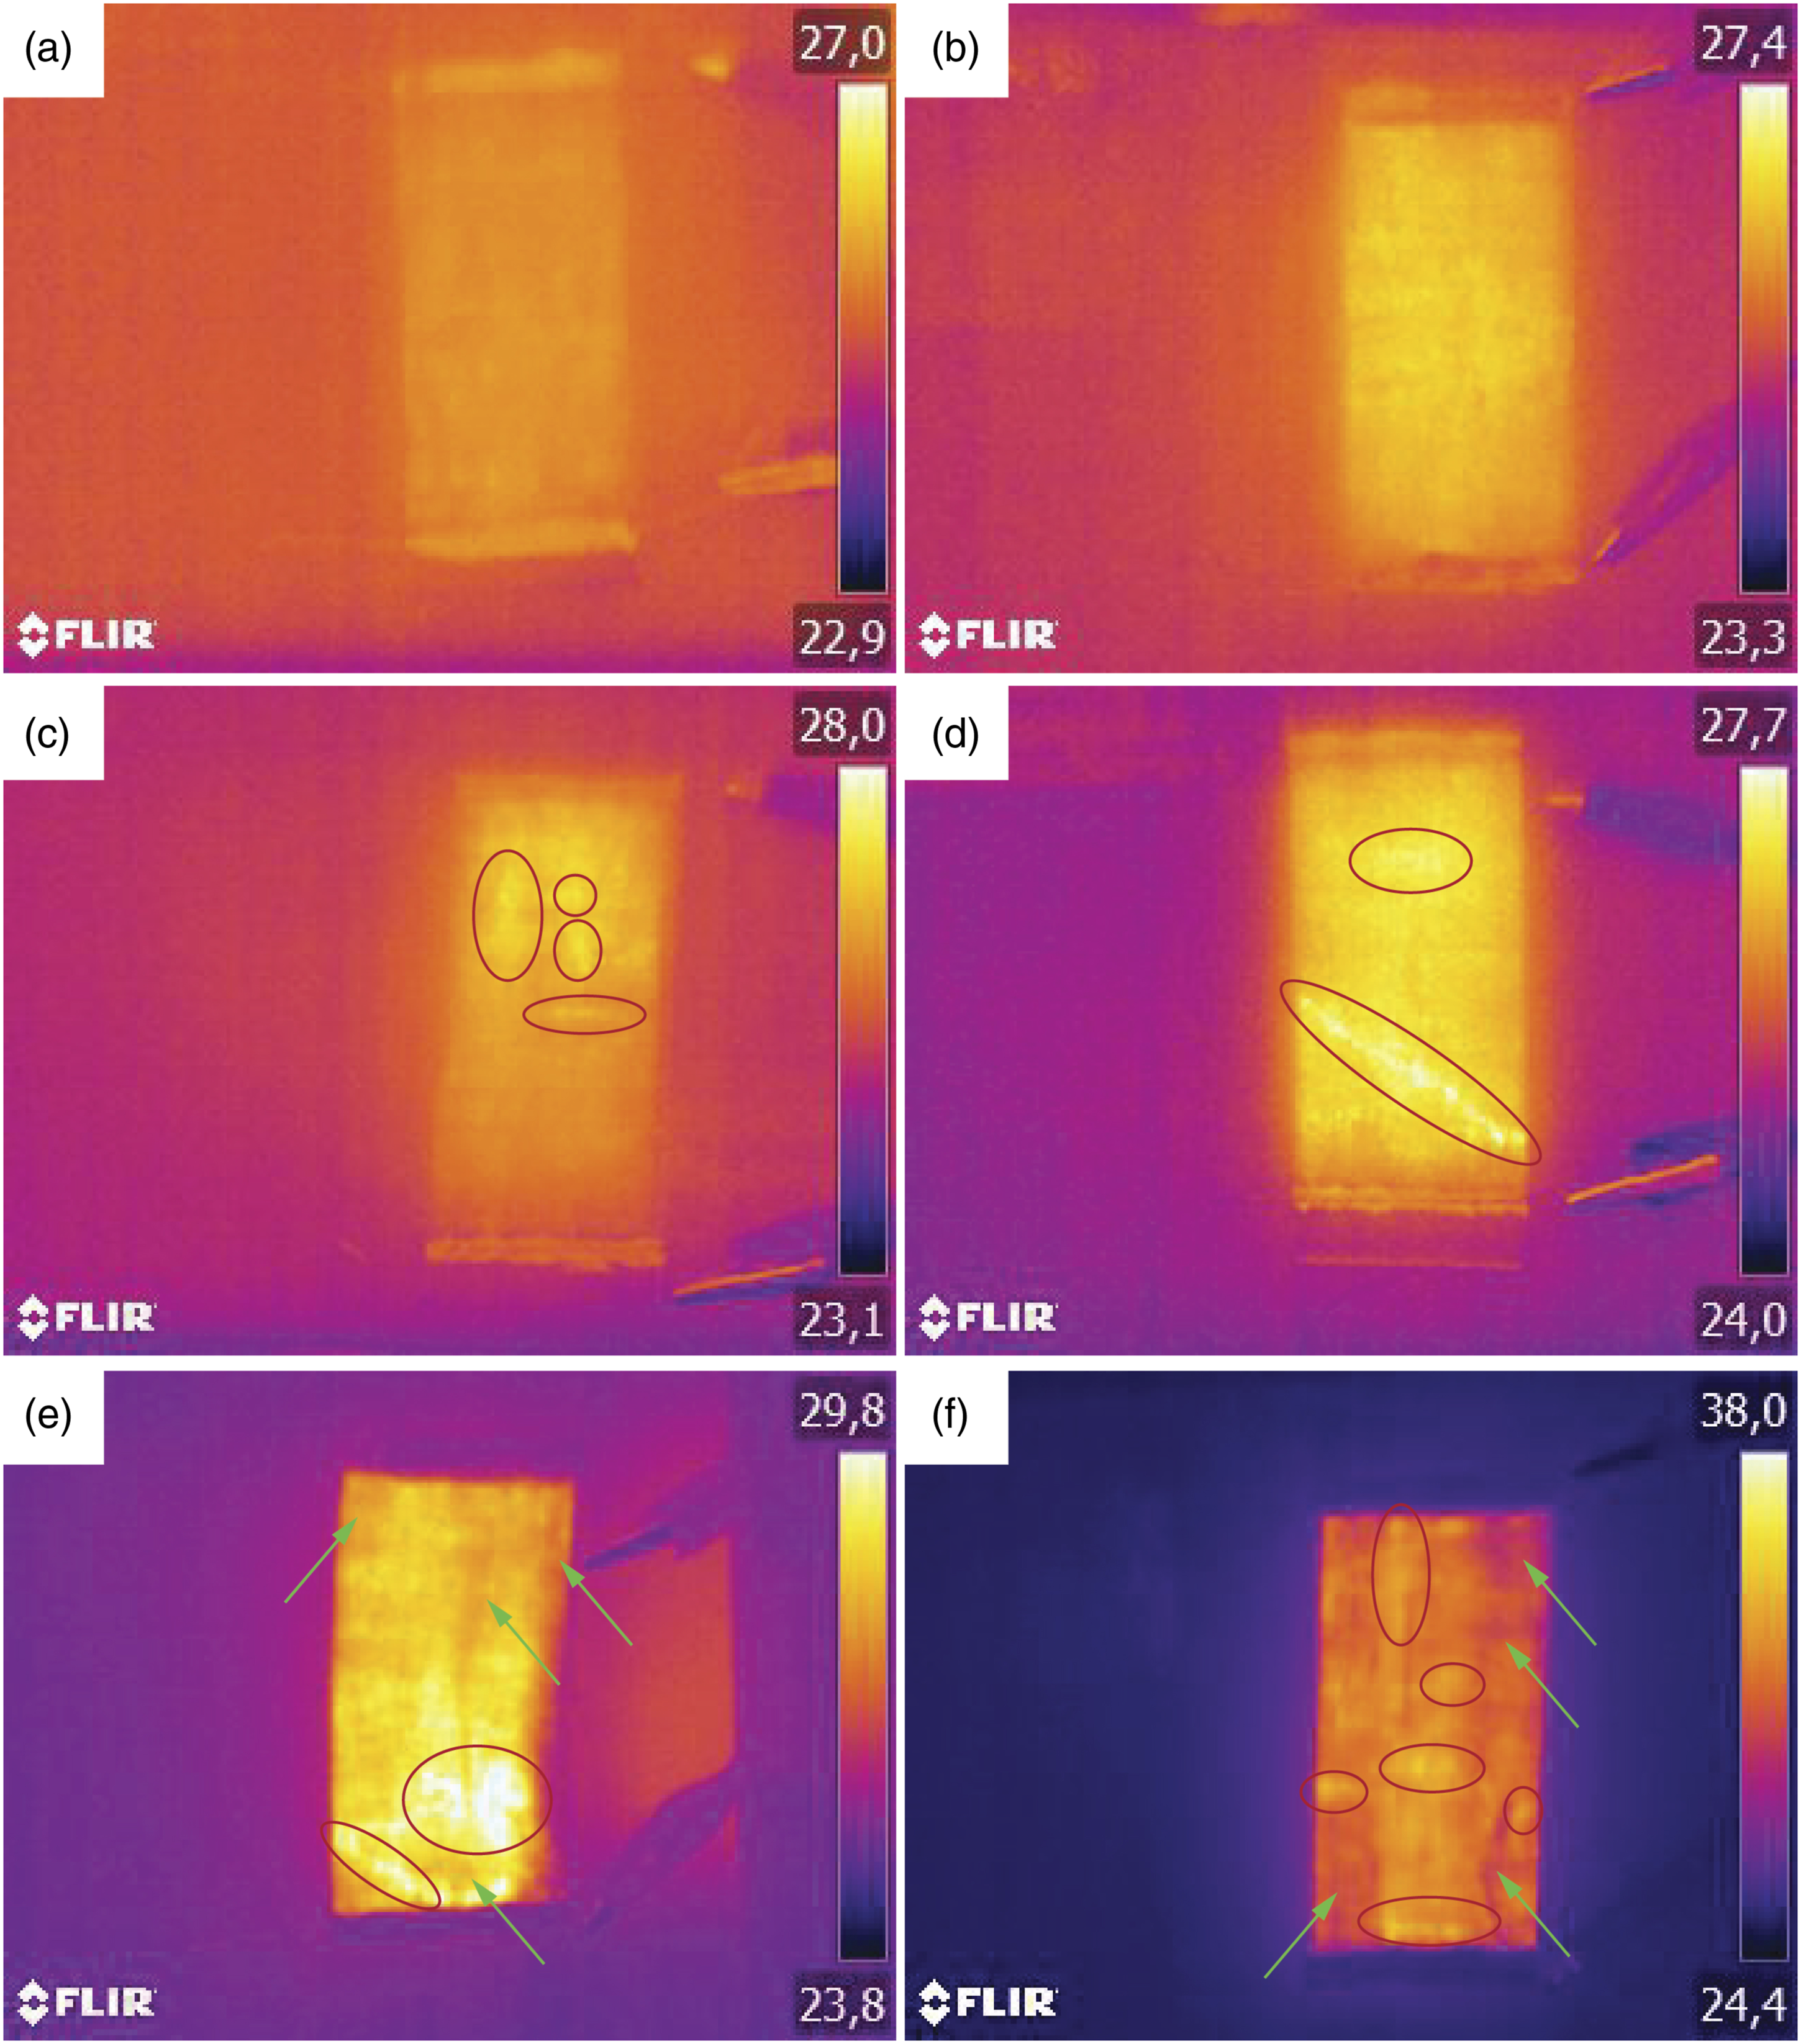
To assess the usefulness of thermographic images for defects monitoring, after rubbing fastness, all conductive samples are subjected to Joule heating for 0.5 s at 40 V. In Figure 14, it is seen that those areas were rubbing was performed, reach lower temperatures than the rest of the coating, especially in samples with a higher GNP content, due to the loss of conductive particles. This finding confirms the suitability of thermographic analysis as a tool for defects monitoring and mapping the quality of the conductive coating. Thermographic images of samples (a) G0.8; (b) G1; (c) G1.2; (d) G1.4; (e) G1.6; (f) G2; at 40V, for 0.5 s, after rubbing fastness.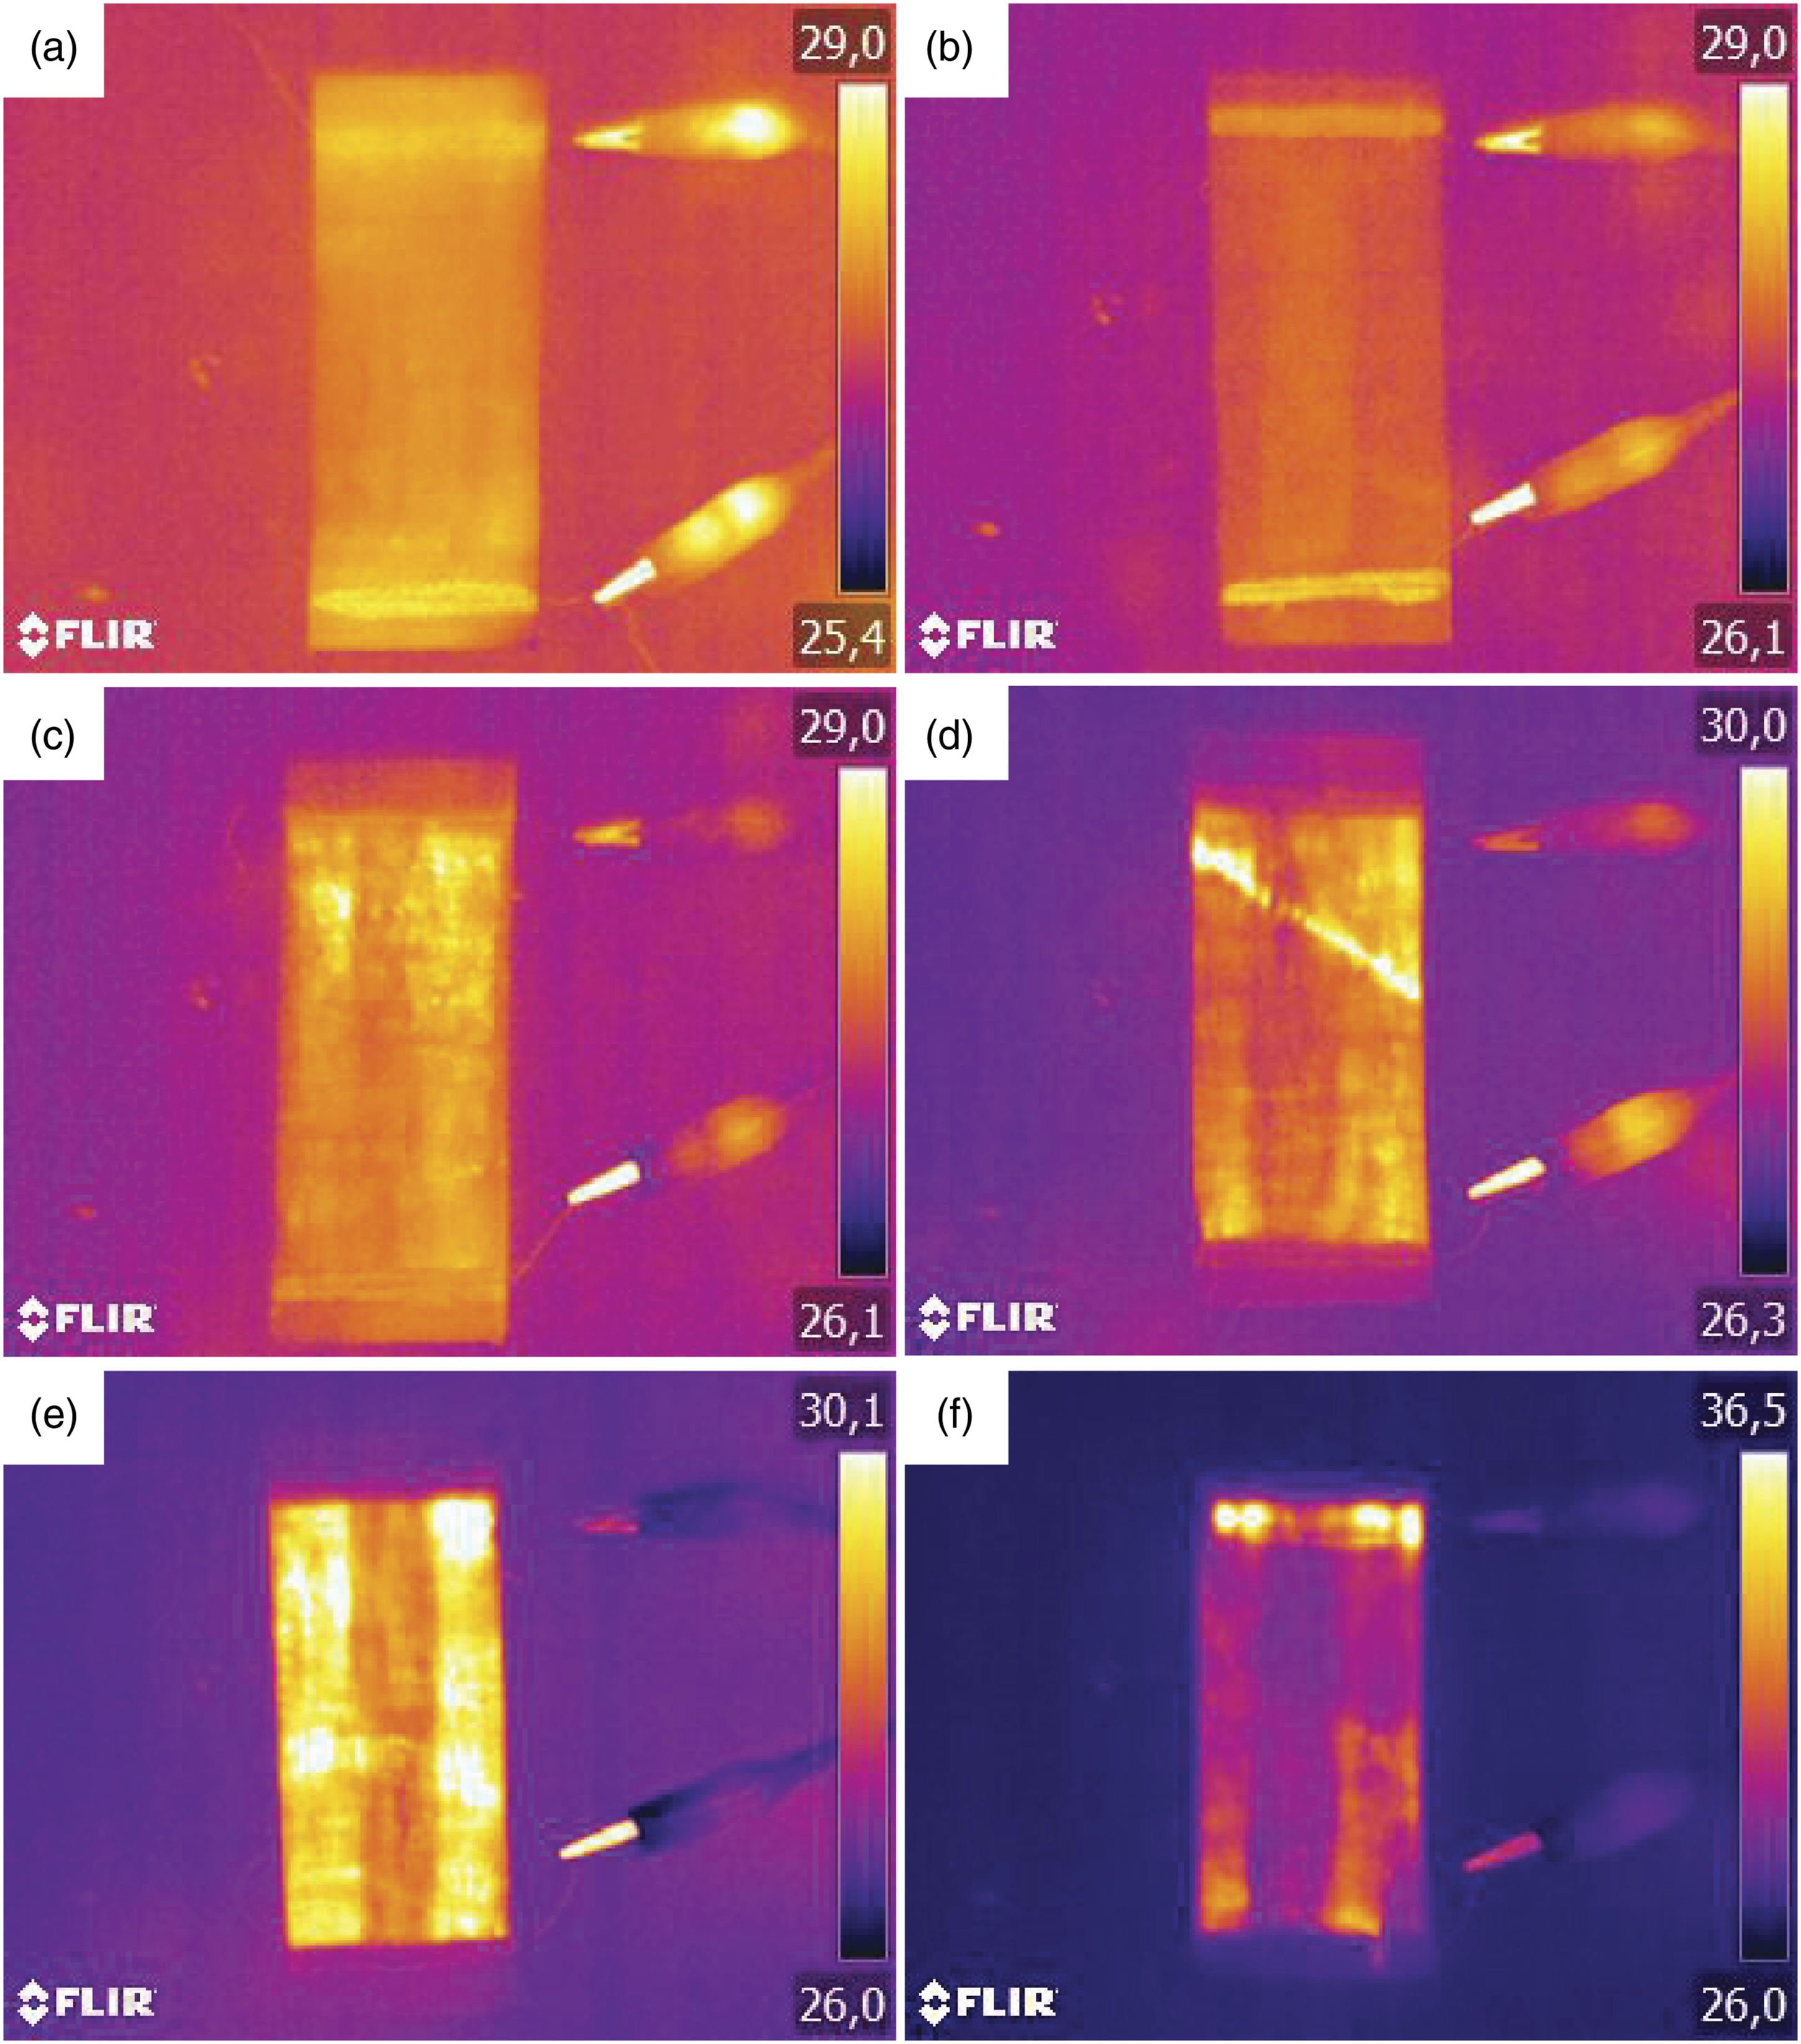
Conclusions
In this work, cellulosic fabrics coated with GNP are obtained through knife-coating, with relatively low electrical sheet resistance values and able to reach temperature increases of up to 100°C using voltages of 40 V in 60 s with thermal stability up to 300°C. The samples examined maintain their properties over several heating cycles. These findings are innovative compared to other investigations with higher GNP content and confirm the suitability of these fabrics for applications where heating textiles are needed, including mats, blankets, floors, car seats, furniture, and clothing.
The analysis of the thermoelectric properties of the samples is also useful to map the distribution of the conductive particles in the coating and provide an image of the electrical network obtained. This technique allows to easily observe the GNP clusters that have been detected using microscopic techniques, as well as defects produced by rubbing fastness. Hence, this non-destructive test can be established as a method to monitor defects of the coating, providing better results with high voltage and low exposure time.
Based on the findings of this study, the following steps will involve the optimization of the dispersion of the conductive particles in the coating paste to examine its influence on the homogeneity of the electrical sheet resistance measurements obtained and the reduction of the voltage necessary to reach a specific temperature. In addition, future works will also focus on analyzing samples with larger areas to determine parameters such as the dependence of reached temperature with the distance and area between electrodes, and the electrical voltage and current necessary for their use in larger industrial applications.
Footnotes
Declaration of conflicting interests
The author(s) declared no potential conflicts of interest with respect to the research, authorship, and/or publication of this article.
Funding
The author(s) received no financial support for the research, authorship, and/or publication of this article.