
Abstract
In this study, the electrical conductivity of PolyEtherKetoneKetone reinforced with five harness satin weave carbon fabric was measured. Induction heating experiments using a hairpin shaped coil were conducted on the same material. The study points out that the thermal response depends on the direction in which the eddy currents are generated in the laminate. The thermal response showed a linear relation with the measured in-plane anisotropic electrical conductivity, pointing towards Ohmic heating mechanisms being dominant during induction heating of the used material. This relation enables the accurate and efficient simulation of the induction heating of woven fabric reinforced composites, using only the electrical conductivity measured in one of the fabric’s weave directions and in the fabric’s 45° off-axis direction.
Introduction
The growing demand for aircraft drives the need for cost-efficient high-rate production of large size composite aerostructures. 1 These structures are typically assembled from smaller components making joining methods for composites a research topic of very high relevance.
Currently, the majority of composites applied in aerospace are thermoset based. In recent years, there has been an increasing interest in thermoplastic composites (TPCs) due to their suitability to be joined via welding. 2 This gives them a key advantage, potentially overcoming the drawbacks of mechanical fastening and adhesive bonding. 3 Moreover, welding enables automated production of large size composite assemblies, meeting the desire for cost-effective high-rate production methods.
A number of thermoplastic welding techniques are already available, e.g. resistance, ultrasonic, laser and induction welding.
4
These techniques mainly differ from each other in the way heat is generated to fuse the thermoplastic polymer in the individual components. This work focusses on induction welding of carbon fabric reinforced TPCs. This welding technique is especially suitable to join thin laminates, such as the skin and the stringers in Gulfstream’s G650 rudders and elevators.
5
The basic principle of induction welding is well described in literature.6–12 A short schematic overview is given in Figure 1. (a) General impression of the electro-magnetic response in a typical induction heating situation; (b) Detail representation of the electrical resistance mechanisms within a carbon fabric reinforced composite.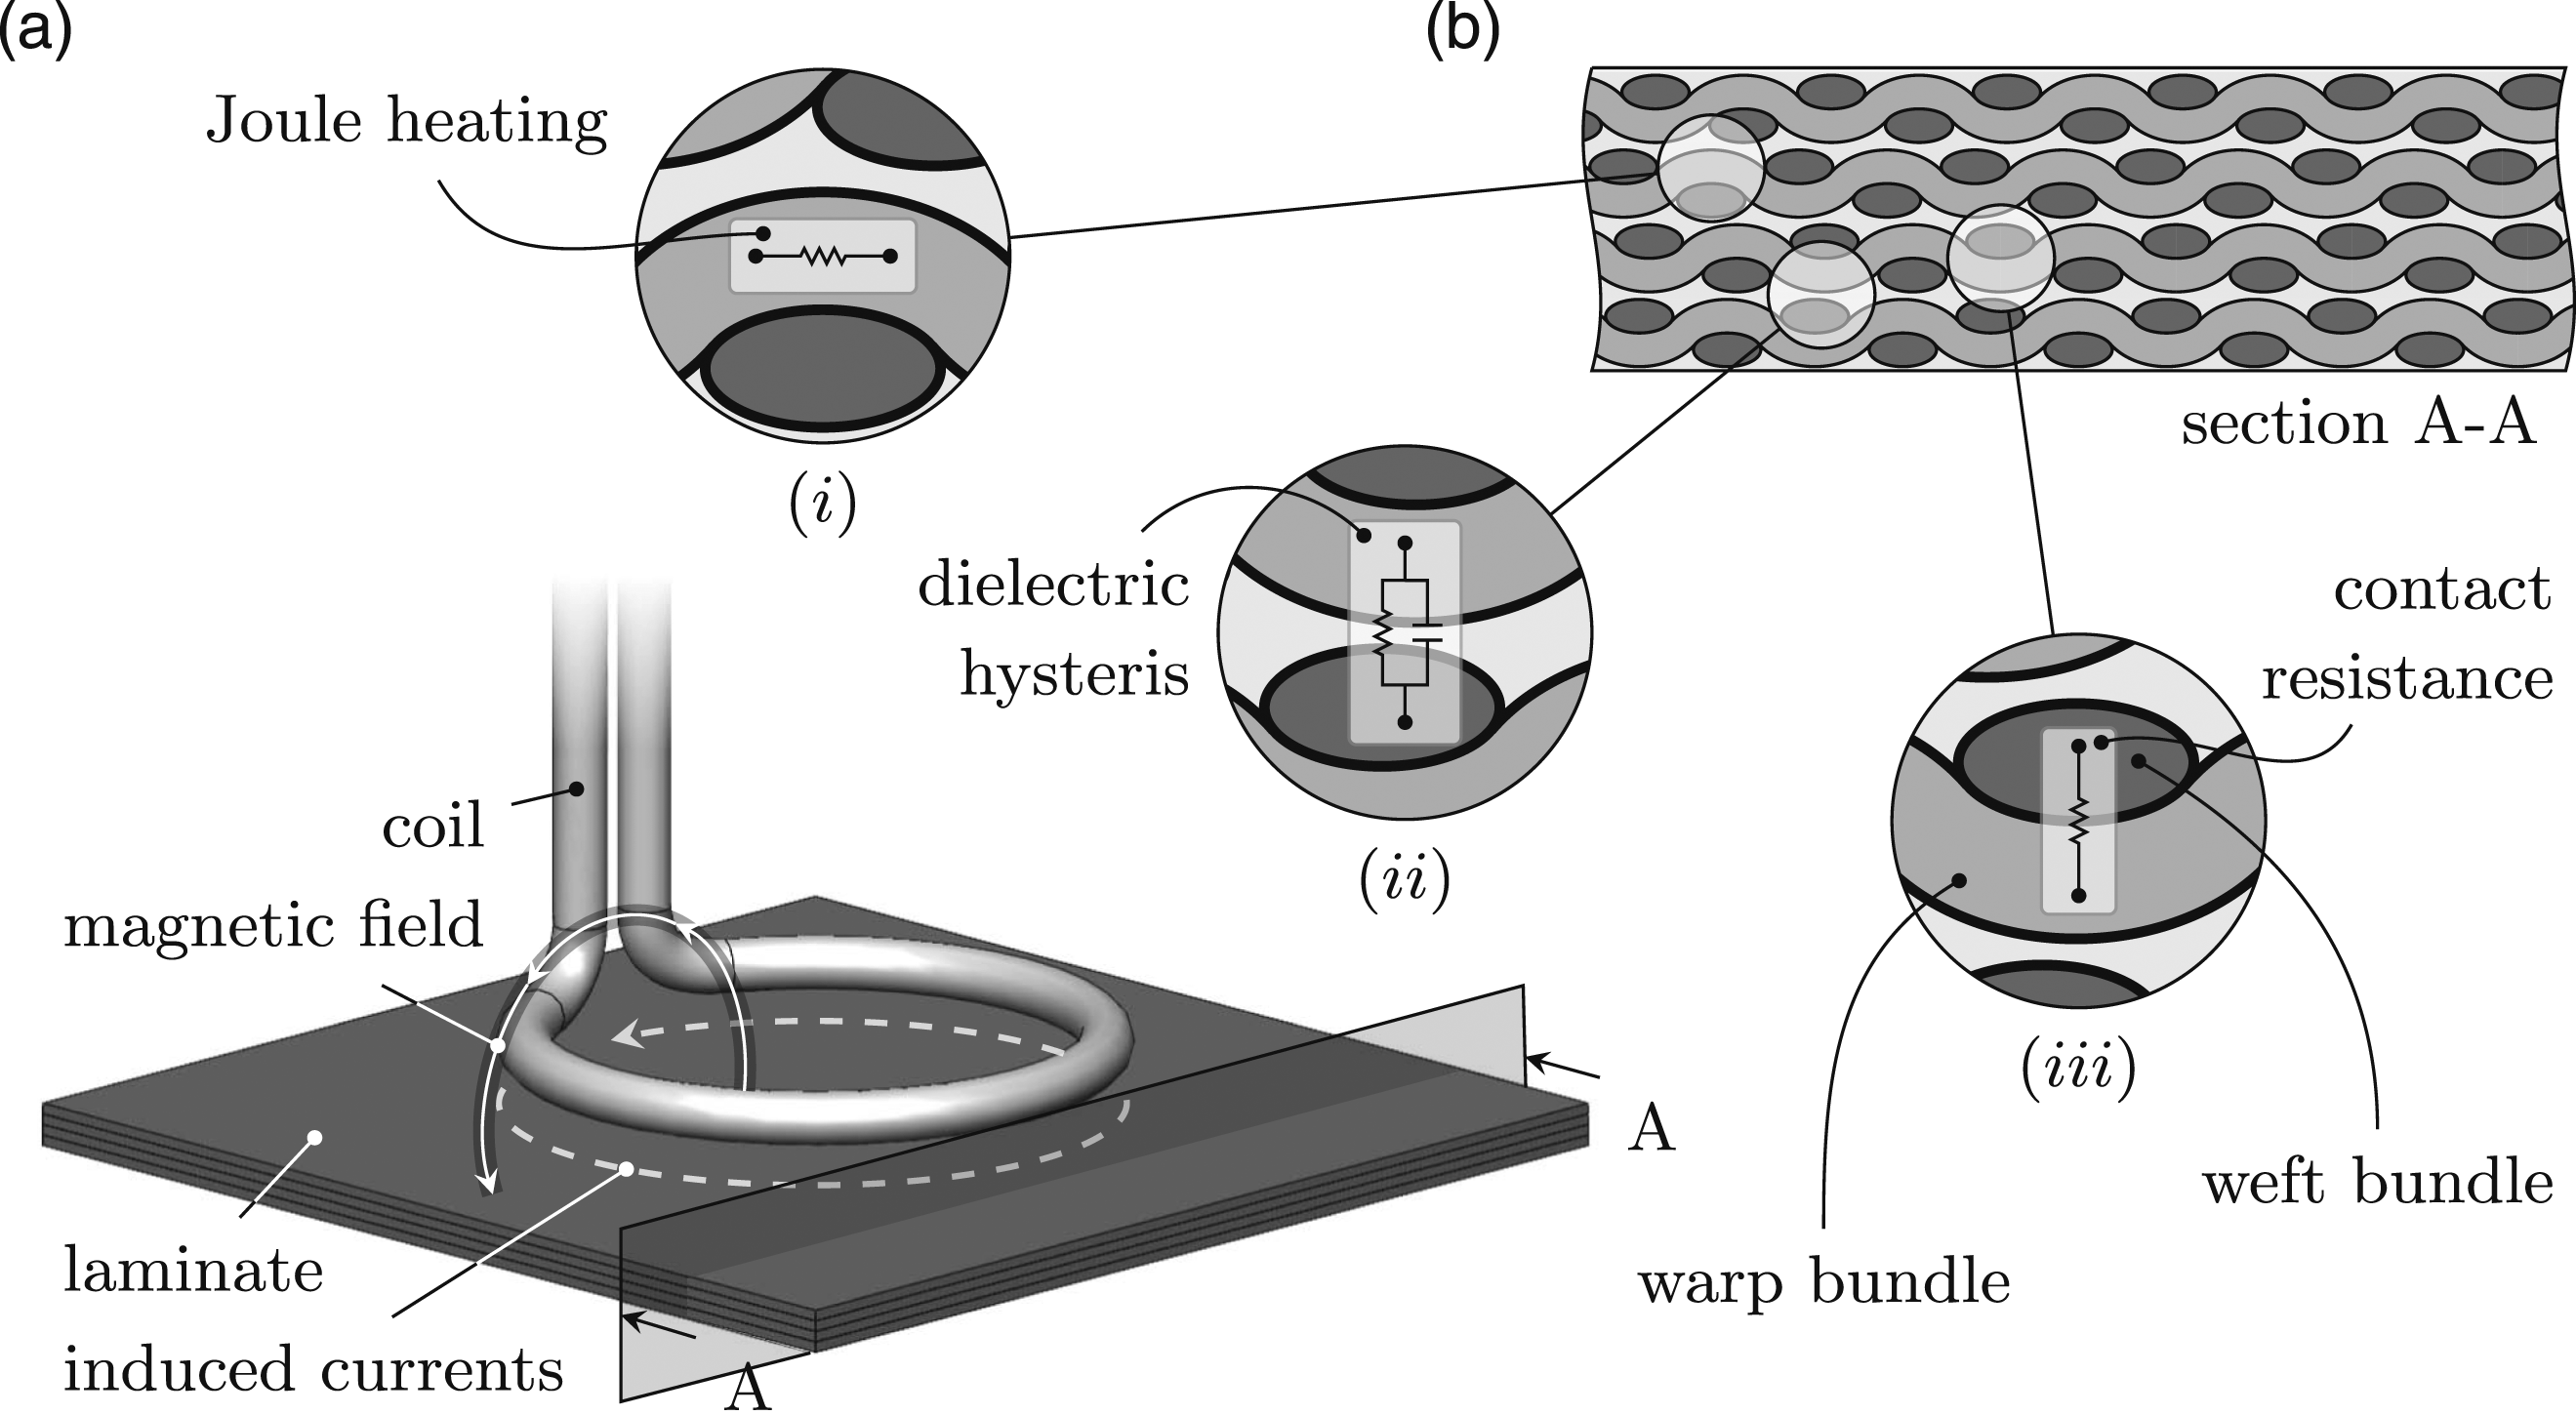
An alternating current in a coil generates an alternating magnetic field, represented by the single magnetic field line around the coil in Figure 1(a). The alternating magnetic field, induces alternating electrical eddy currents in the nearby carbon fibre bundles as they are electrically conductive. These eddy currents generate heat, thereby locally melting the thermoplastic matrix.
In the case of a TPC laminate, three types of heating mechanisms can be distinguished: Joule heating within the fibres, contact resistance losses at the fibre junctions and dielectric losses at the fibre junctions. These mechanisms are best explained by the electrical conductance mechanisms within the TPC. For the eddy currents to be induced, electrically conductive loops in the material are required. For carbon fabric reinforced TPCs, these loops are available within each ply of the laminate due to the architecture of the woven fibre bundles. The electrical currents experience a conductivity along the fibres, denoted by the resistor symbol in detail i of Figure 1(b). The fibre bundles of two adjacent plies are likely to be in direct contact. However, the plies are separated by a relatively resin rich layer, 11 shown in detail ii of Figure 1(b), making the extent of contact unknown.
Mitschang et al. 13 showed that direct fibre contacts are formed at the junctions of the warp and weft fibre bundles within a fabric ply. The electrical currents are subject to a conductivity at the junctions of the warp and weft fibre bundles as well, this is depicted in detail iii of Figure 1(b). Contact resistance losses is considered for this heating mechanism.
Despite the previous described heating mechanisms, accurate predictions of the thermal response of an inductively heated TPC remain a challenge due to lacking knowledge on the electrical conductivity behaviour of the woven fabric reinforced TPC. Studies in which a parallel positioned, circularly shaped induction coil was applied to heat up a flat woven fabric reinforced composite laminate, showed hot-spots in the location where the eddy currents were flowing in one of the weave directions14,15 This type of coils mainly induces eddy currents in a circular direction resembling the shape of the coil as shown in Figure 1(a) by the dashed line.
The previously described heating mechanisms together with the observations that the thermal response is related to the direction in which the eddy currents flow, might lead to the assumption of an anisotropic in-plane electrical conductivity. Such an anisotropy of the electrical conductivity was also described in a previous publication 16 for woven fabric reinforced composites. However, this in-plane observed anisotropy remains challenging to be defined since the measured in-plane anisotropy is also affected by the resistance in the out-of-plane direction of the laminate, details ii and iii in Figure 1. In most previous studies,10,13,17–20 the anisotropic in-plane electrical conductivity has not been taken into account. More recent studies took this effective in-plane anisotropy into account in numerical simulations,15,21 allowing a successful prediction of the thermal response including the higher heating rates (hr) in the weave directions of the fabric but these models rely on a conceptual out-of-plane electrical conductivity parameter derived from eddy current measurements in combination with an inverse numerical method.
Since the out-of-plane electrical conductivity of a woven fabric reinforced TPC laminate, dominated by the electrical conductance mechanism between two adjacent plies as shown in detail iii in Figure 1, is about three orders of magnitude lower than the in-plane electrical conductivity,10,13,17–20 and the orientation of the magnetic field being mainly perpendicular to the laminate (see the magnetic field line in Figure 1), the induced eddy currents will be mostly in-plane oriented. Therefore it seems reasonable that only the planar angle dependence of the in-plane electrical conductivity needs to be measured experimentally to obtain accurate predictions of the magnitude and direction of the eddy currents.
The aim of the present study is to determine whether a straightforward description of a measured anisotropic in-plane electrical conductivity of a woven fabric reinforced TPC can be used to correctly predict the thermal response of a TPC laminate when heated by induction. The anisotropic in-plane electrical conductivity is based on specifically measured electrical conductivities using the six-probe voltage measurement method. 22
The electrical conductivity of a TPC material was measured using the six-probe procedure previously proposed and discussed by van den Berg et al. 22 Induction heating (ih) experiments were conducted on the same material, in which eddy currents were induced in different material directions. Through a combination of the results of both experiments, it can be determined whether accurate ih predictions are possible based on the measured anisotropic in-plane electrical conductivity.
It is important to recognise that, based on first principles, a homogeneous material with equal conductivities in two orthogonal directions will exhibit in-plane isotropy. The response of the tested laminates, as obtained using the six-probe method, however, is evidently anisotropic. It should be emphasised that the tested laminates are layered non-homogeneous electrically conductive structures, and the measured values of electrical conductivity therefore depend upon the underlying material and structural properties, particularly the specimen dimensions. Therefore, this study refers to the measured electrical conductivity rather than the electrical conductivity of the material itself.
Experimental work
Materials, lay-up and consolidation
Details of the five harness satin weave fabric in the composite.
Consolidation cycle details.
Non-destructive inspection using ultrasound did not show voids or defects in the laminates. Samples were cut by CNC contouring, the specimen dimensions were 20 × 150 mm2 for the 6-probe voltage measurements and 285 × 285 mm2 for the specimen applied in the ih experiments. The specimen thickness t was measured using a micrometer prior to both the electrical conductivity 6-probe measurements and the ih experiments. The thickness of the electrical conductivity specimens was measured at three evenly distributed positions along the length, the thickness of the ih specimen was measured at nine evenly distributed positions over the surface.
Electrical conductivity experiments
In a prior publication, 22 the authors demonstrated the validity of a technique for measureing the electrical conductivity of a carbon fabric-reinforced composite specimen in its principal directions. This methodology was employed in the present research to measure the apparent in-plane anisotropy of the TPC.
In the electrical conductivity measurements, schematically shown in Figure 2, a direct current I of 200 mA was applied using a DC Lab power supply over the total specimen width of 20 mm at the top surface over a distance of 120 mm to generate a non-uniform current distribution throughout the thickness t of the specimen. Voltages were measured, using a TiePie HS6D-100 differential oscilloscope data acquisition system, at the top and bottom surface, Vt and Vb respectively, over a distance of 40 mm. Subsequently, the electrical conductivities in the principal directions of the specimen x and y were obtained following the inverse numerical method as described in.
22
Schematic overview of the six probe voltage measurements; the applied electrical current was 200 mA for all six probe measurements.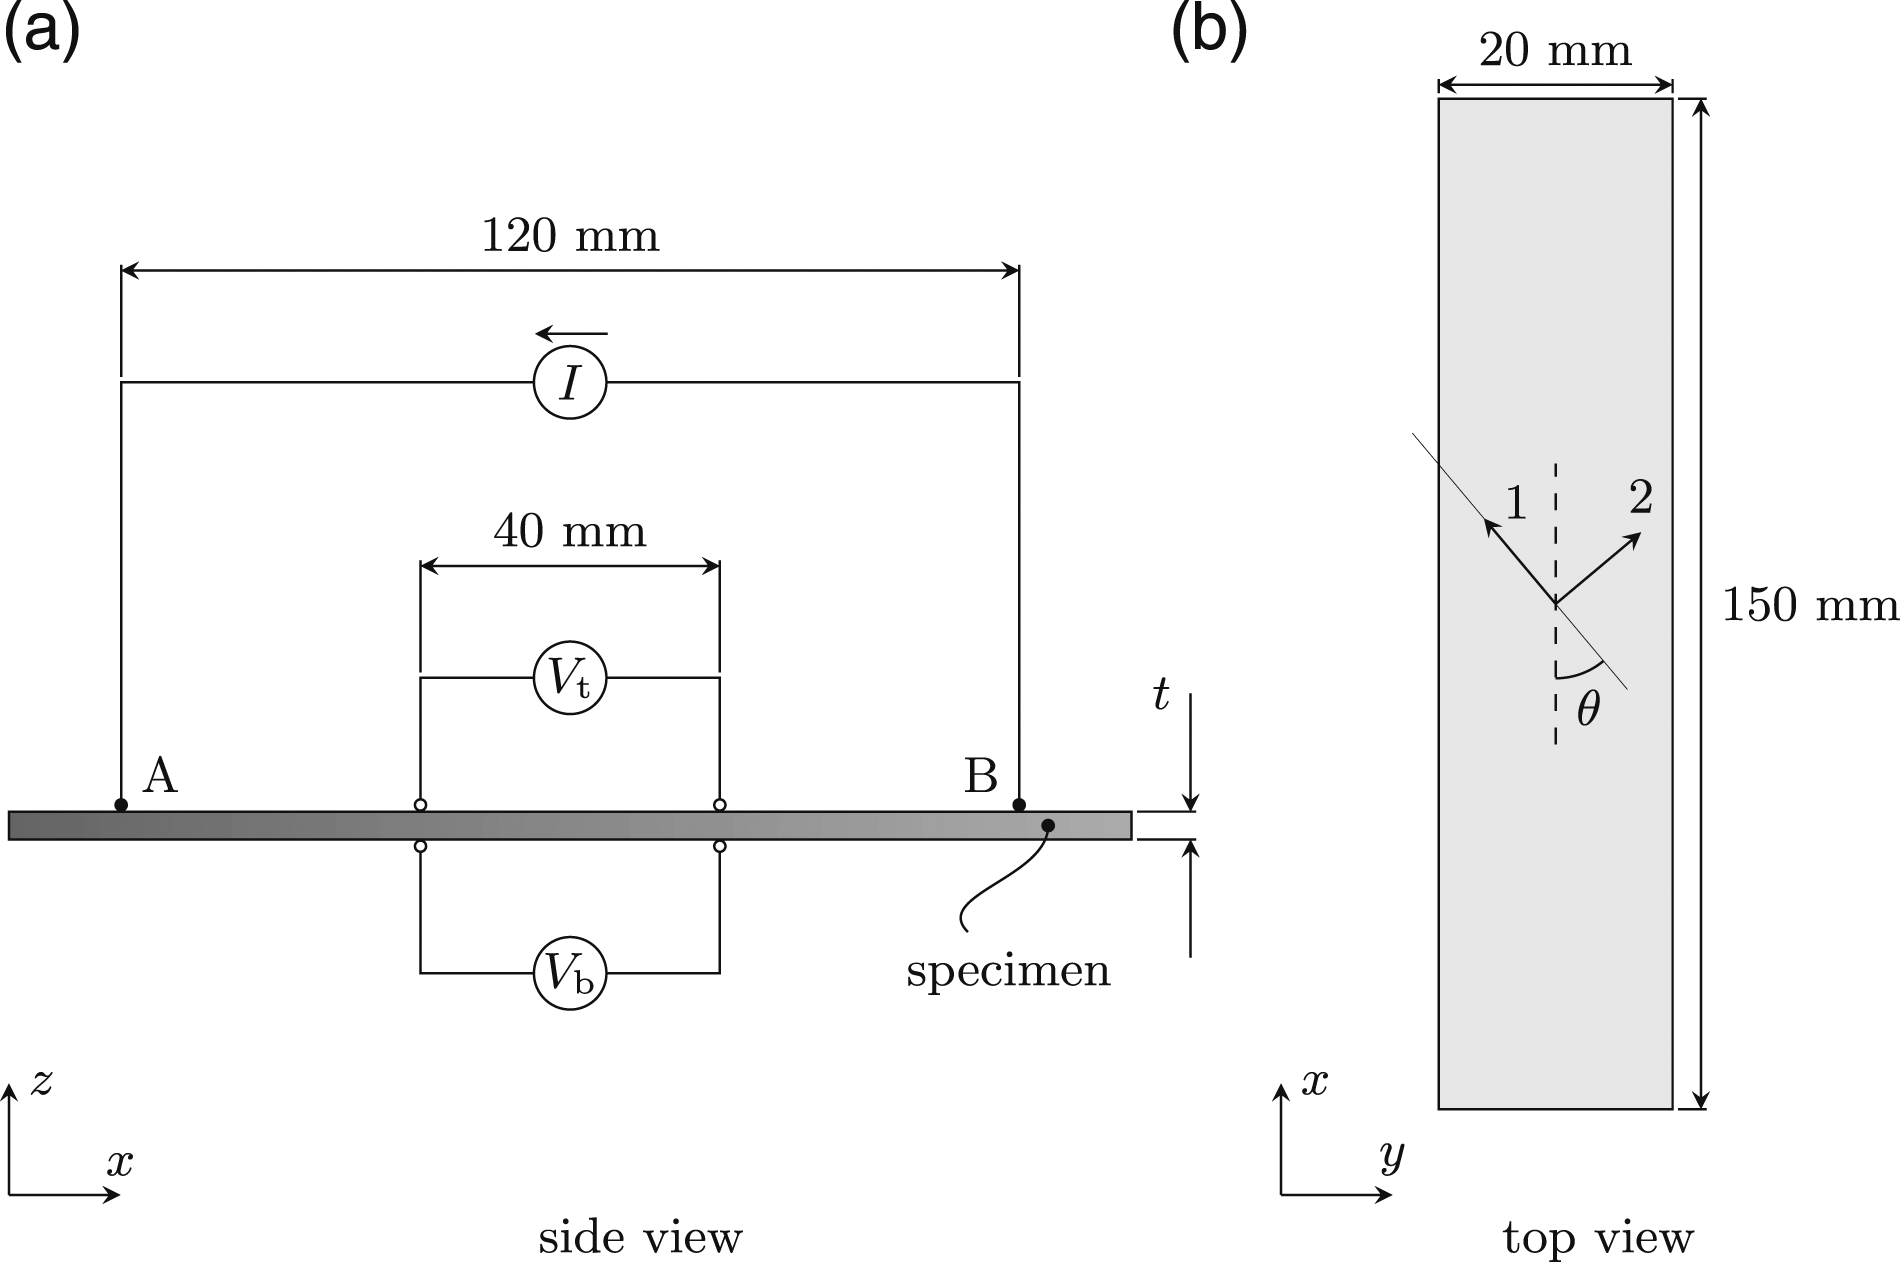
The coordinate systems shown in Figure 2 define the coordinate system of the specimen and the orientation of the fabric. The x-direction agrees with the length direction of the specimen, the y-direction agrees with the width direction of the specimen and the z-direction agrees with the specimen’s normal direction. The 1- and 2-directions agree with the fabric’s warp and weft direction, respectively. The normal direction of the fabric, generally referred to as the 3-direction (not depicted), coincides with the specimen’s z-direction.
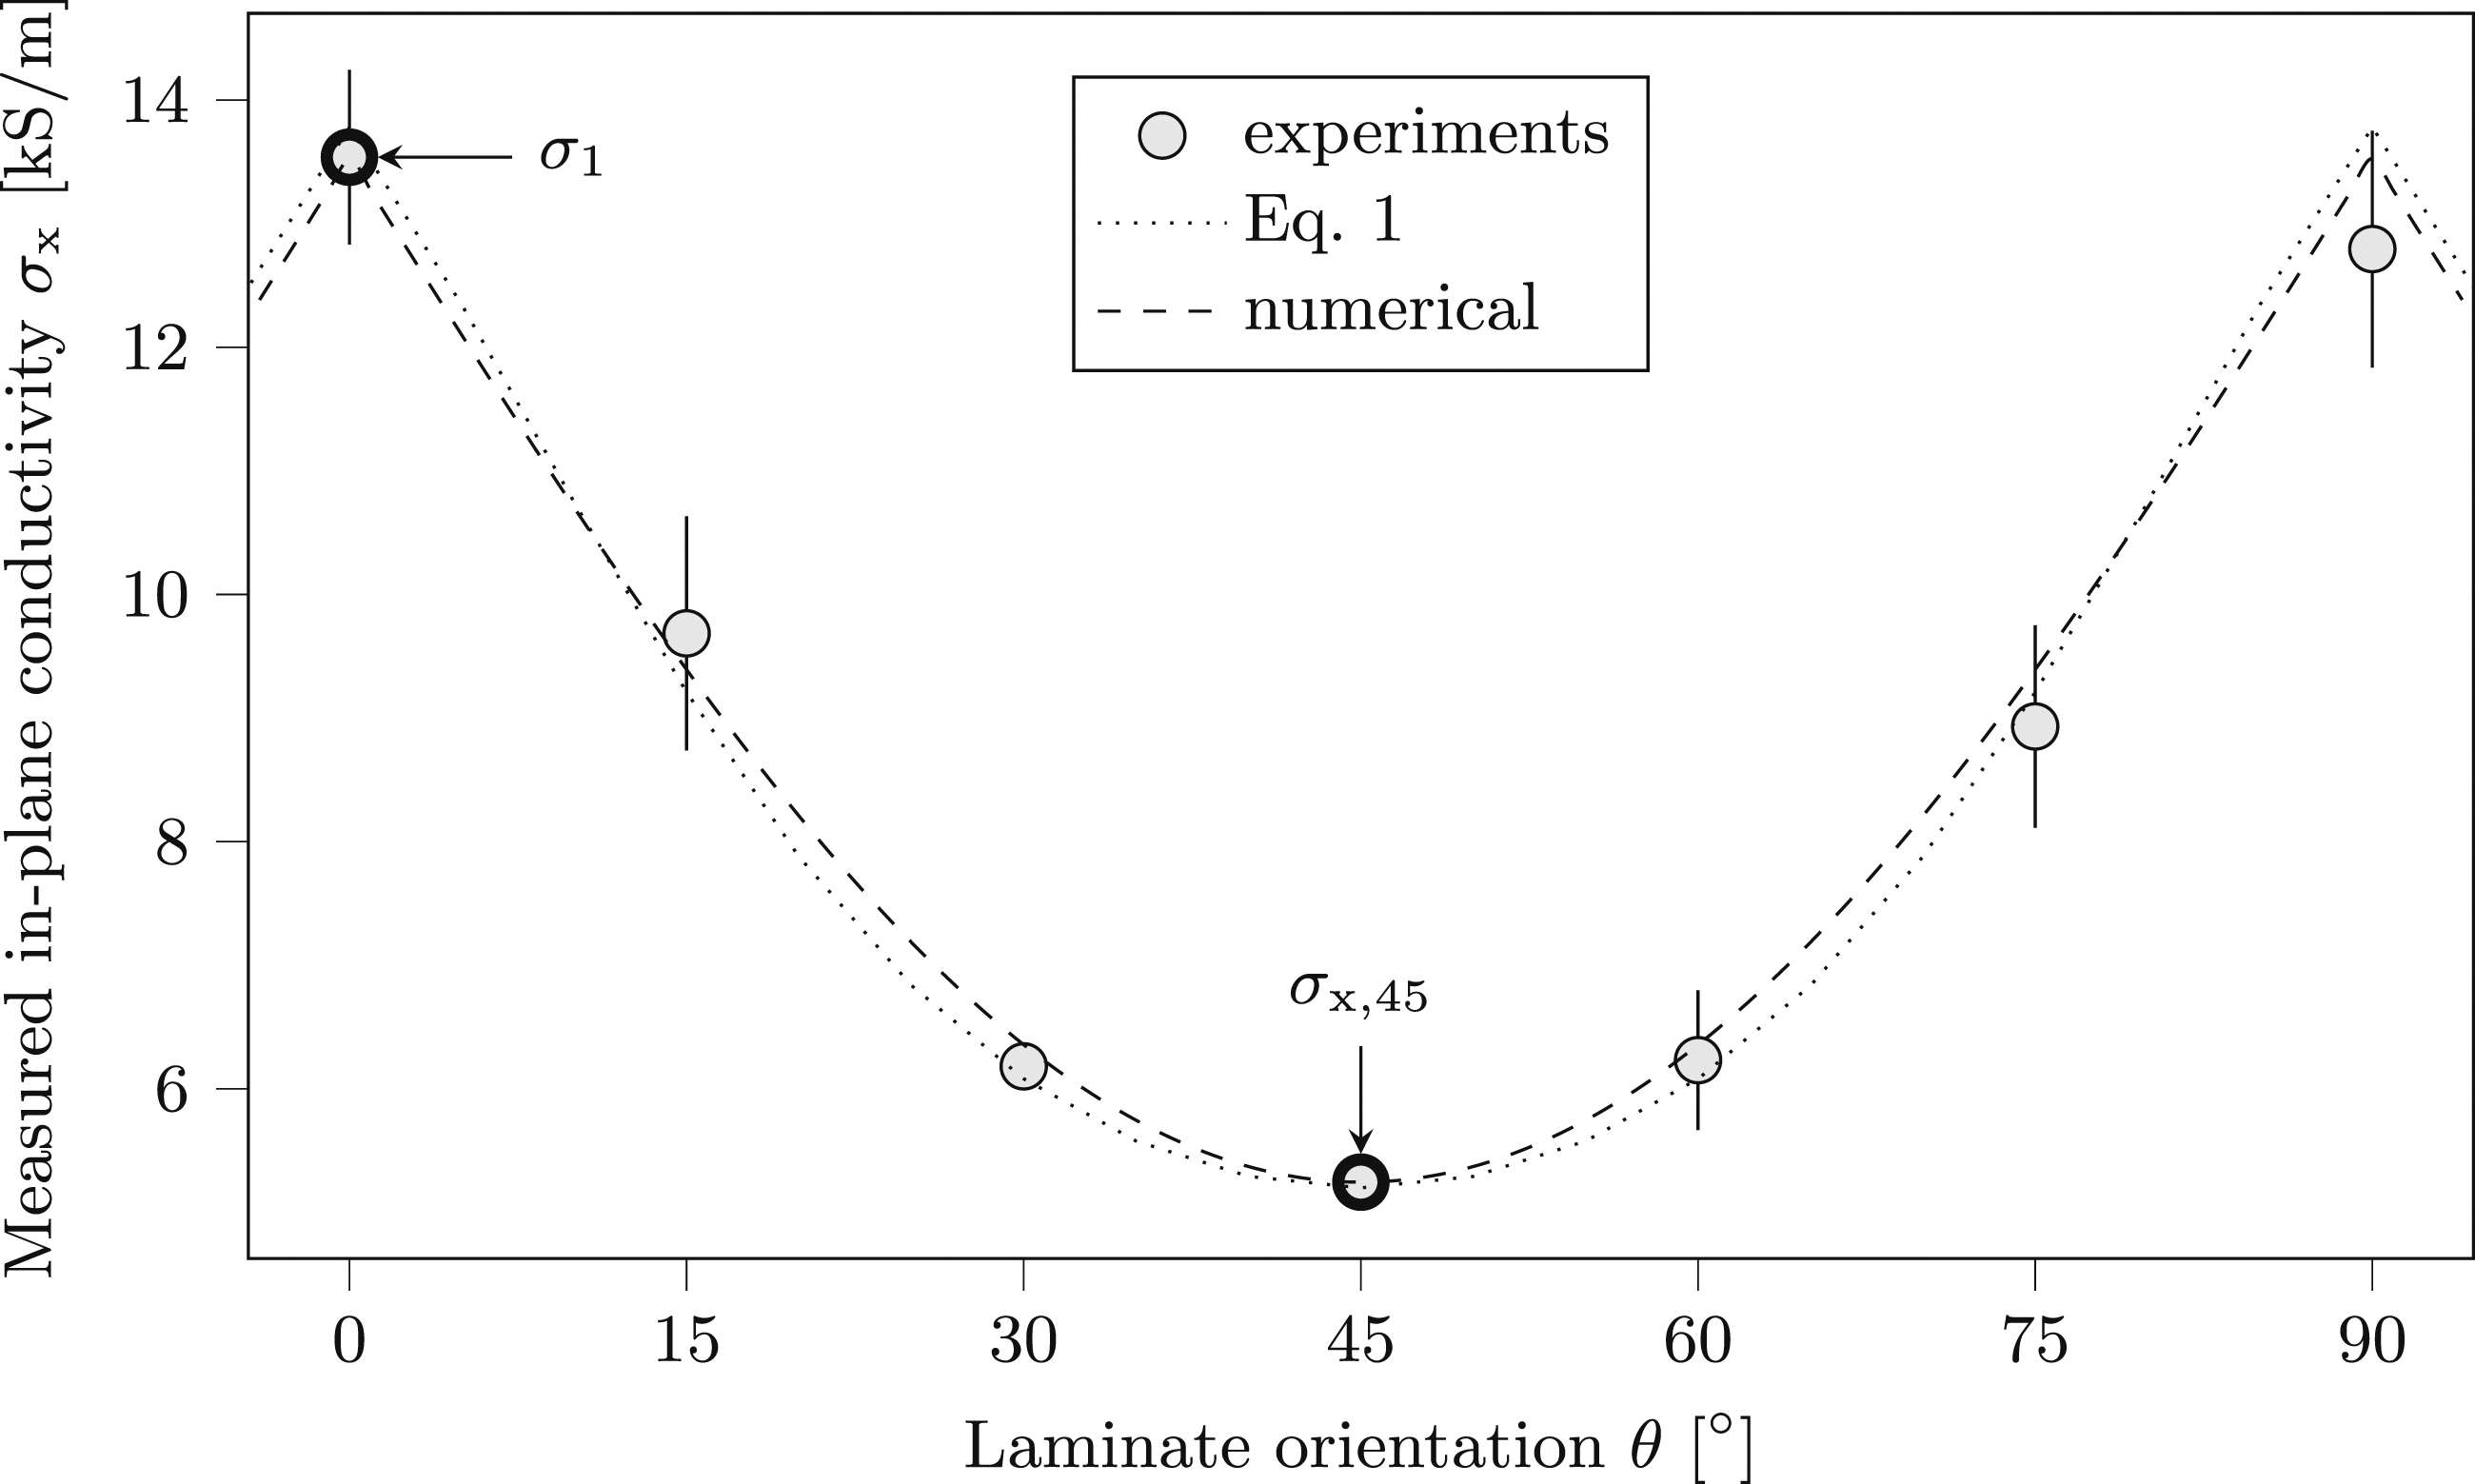
To measure the in-plane electrical conductivity of the specimen, the electrical conductivity in the x-direction, σx, specimens were taken from the laminate at various angles (0°, 15°, …, 90°) with respect to the warp direction of the fabric to obtain σx,θ. The θ in the subscript of σx,θ denotes the orientation of the fabric in the specimen; accordingly, σx,0 = σ1 and σx,90 = σ2. Four specimens were tested for each angle θ.
Induction heating experiments
An ih experiment was designed to generate currents in a predefined direction of the laminate. The aim was to induce electric currents in the same directions in which σx,θ was characterised in order to correlate the induced thermal response to σx,θ.
Therefore, the orientation angle θ is used to represent both the direction of the fabric in the electrical conductivity measurements and the orientation in which the eddy currents were mainly flowing in the fabric during the ih experiments.
A schematic overview of the ih set-up is shown in Figure 3. In this set-up, the induced eddy currents were primarily oriented in the coil’s length-direction, this corresponds to the x-direction of the rotated coordinate system in Figure 3. Schematic overview of the induction heating set-up.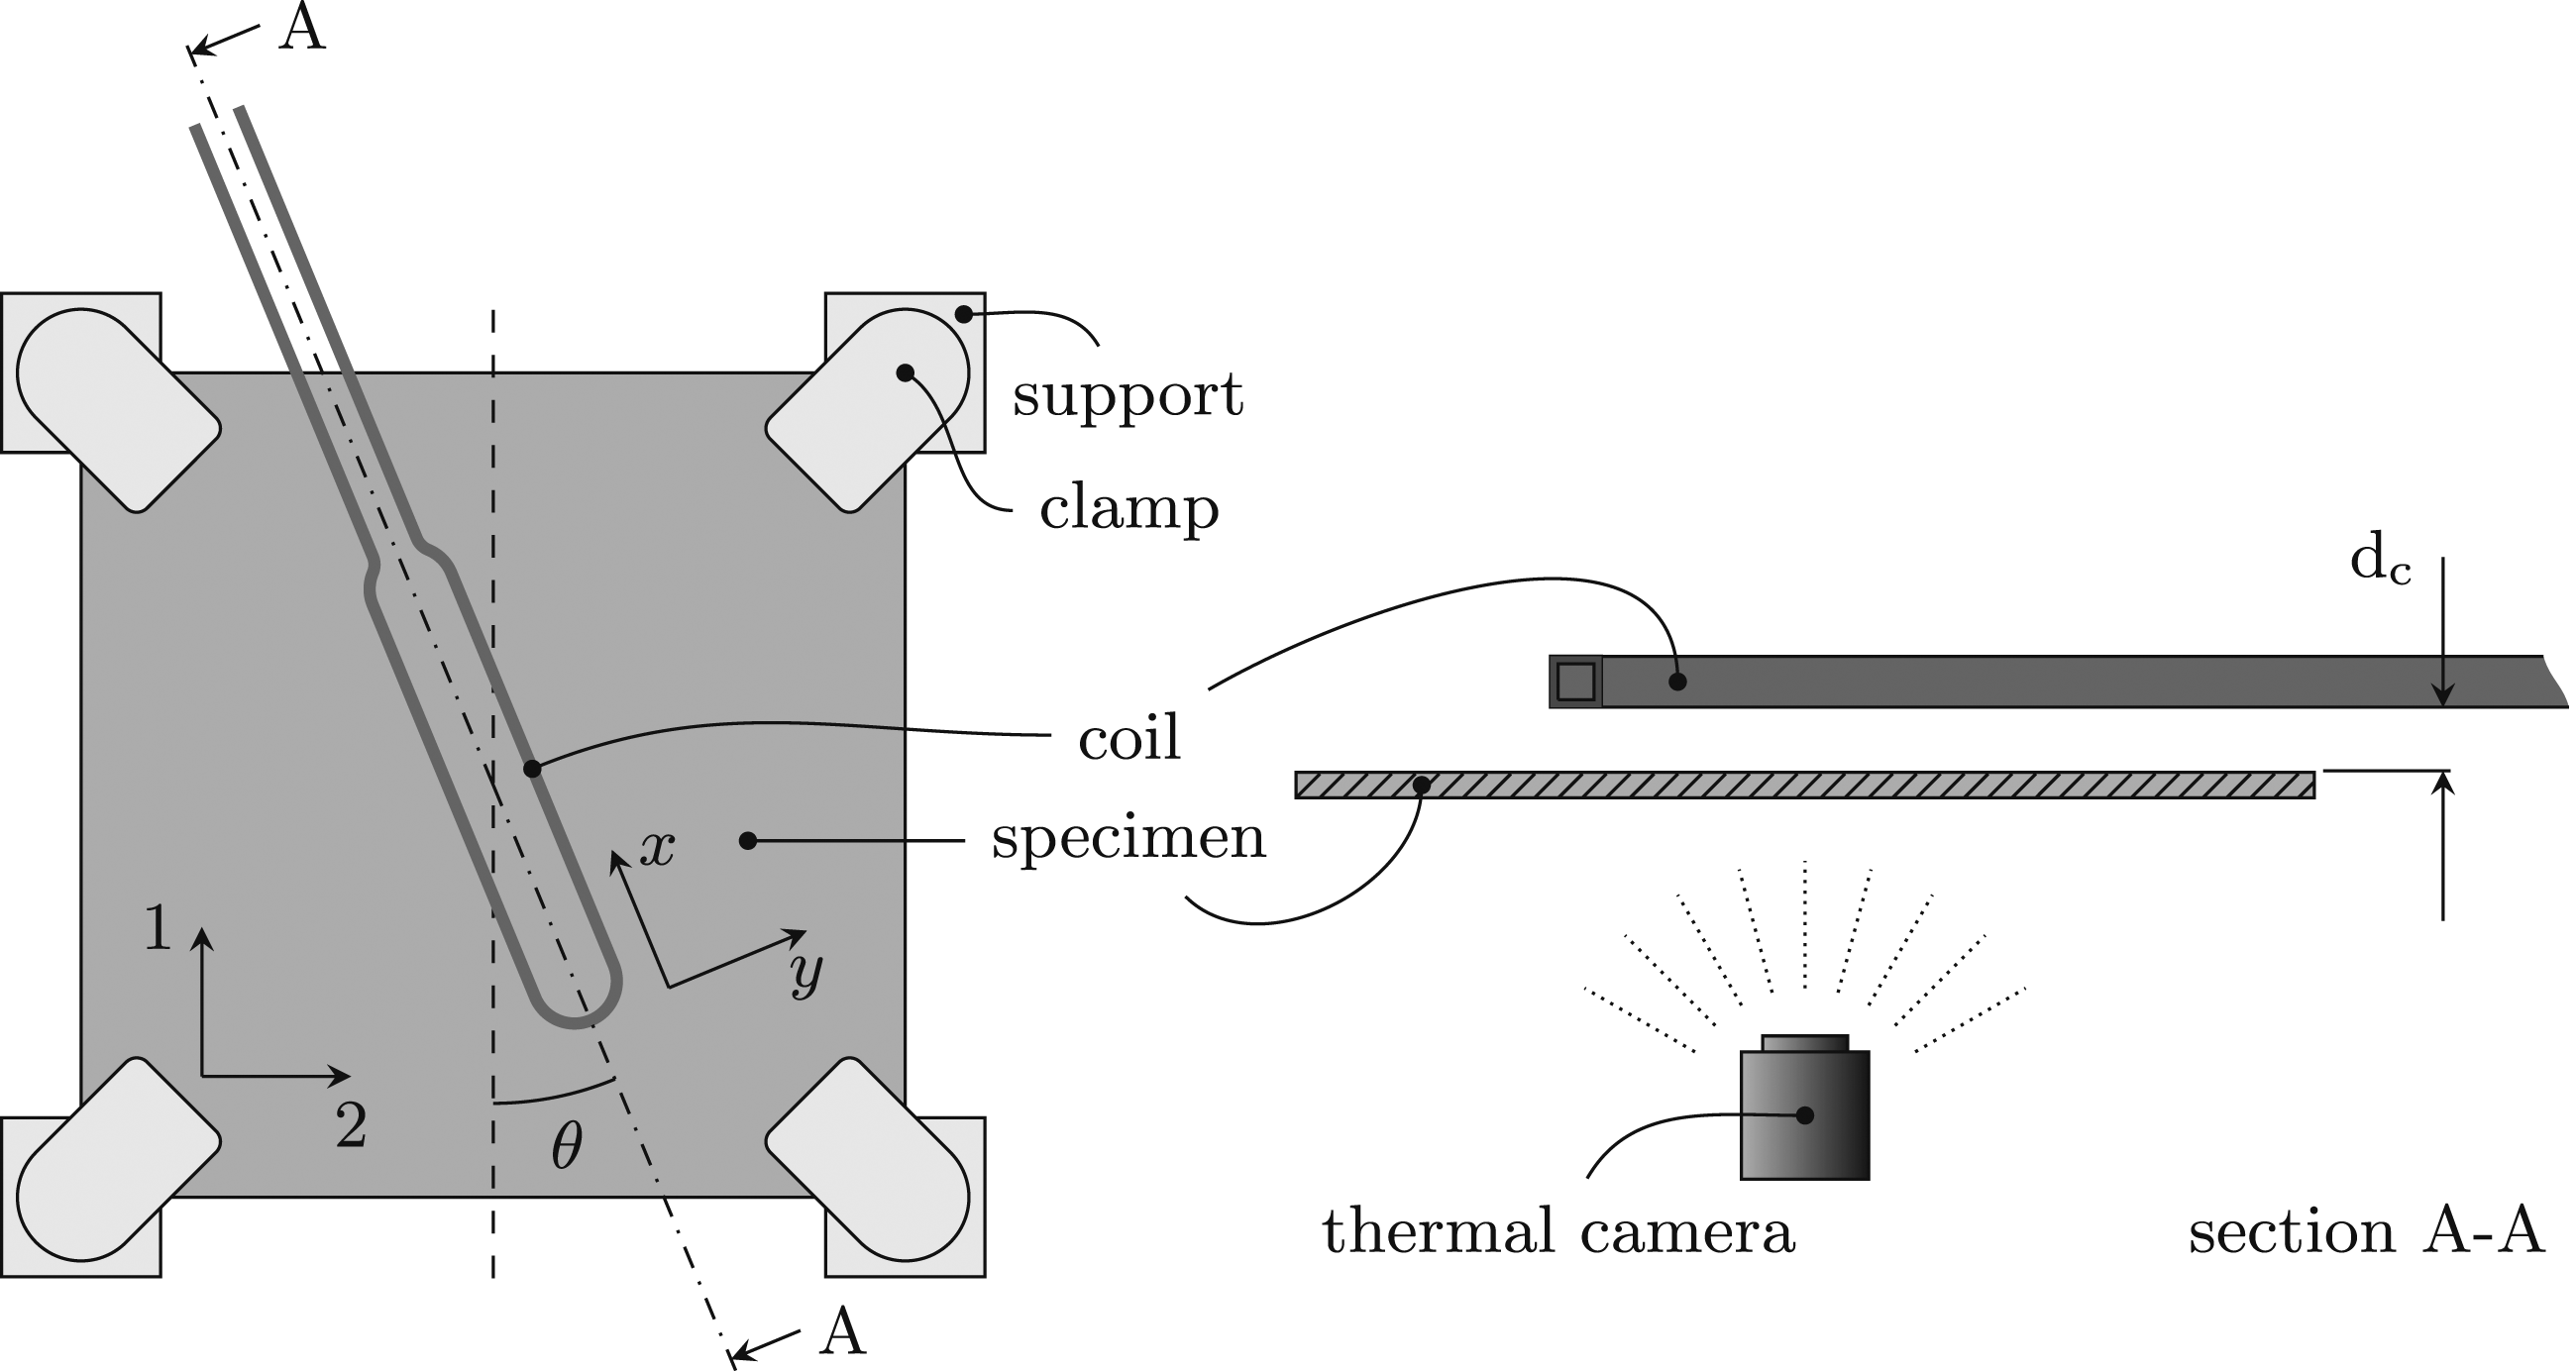
All ih experiments were performed on one square shaped (285 × 285 mm2) specimen at various coil orientations (θ = 0°, 15°, …, 90°) while the temperature of the specimen’s bottom surface was monitored using a thermal camera (FLIR A65). E-type thermocouples, placed at the center of the top and bottom surface of the specimen were used to validate the thermal camera measurements. The coil, custom made using a 4.8 mm square hollow copper tube with a 0.8 mm wall thickness, was water-cooled during the experiments. Details of the coil dimensions are provided in Figure 4. Top-view of the applied induction coil. The coil was manufactured using a 4.8 mm square hollow copper tube with a 0.8 mm wall thickness.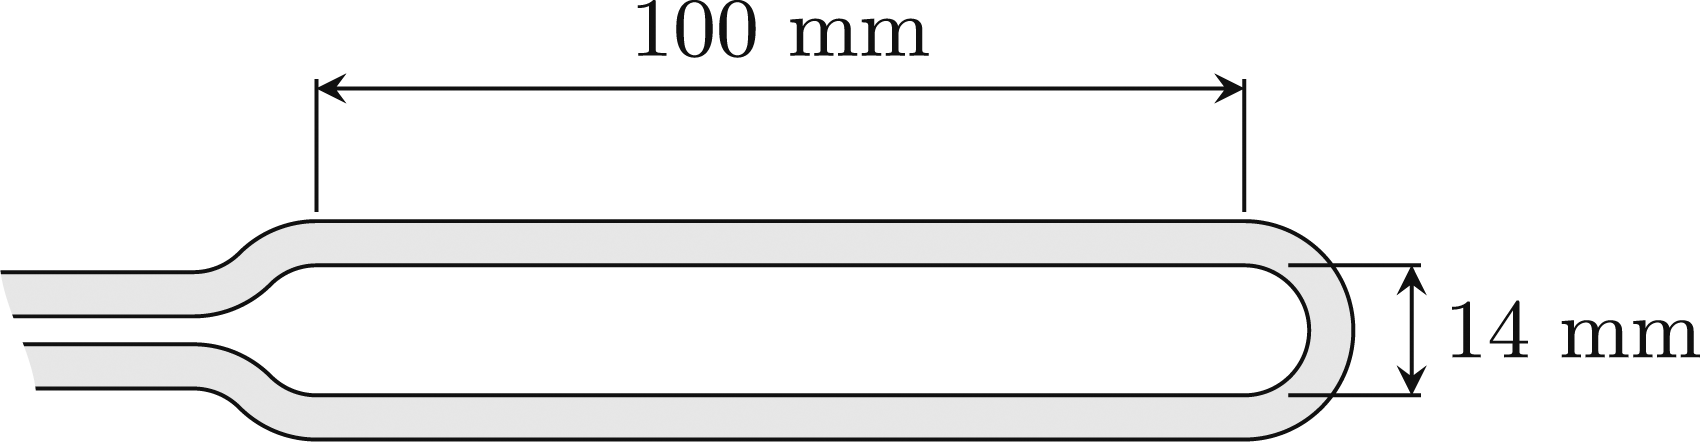
The distance between coil and specimen, referred to as the coupling distance dc, was 5 mm for all experiments and fixed by using a gauge block. An Ambrel EASYHeat 8310 LI ih system was used to provide the current for the induction coil. For all experiments, a controlled RMS current of 380A at a frequency of 344.9±0.5 kHz to heat the specimen from room temperature for 1.00 ± 0.01 s, after which the current was switched off for the laminate to cool to room temperature. Each experiment was repeated five times per coil orientation. Between the repetitions, both the set-up and the parameters remained unaltered.
Results
Results of the six-probe measurements and the induction heating experiments.
The thickness of the heated laminate was 2.49±0.05 mm, as measured at nine points that were evenly distributed across the plane of the laminate.
Six-probe voltage measurements
The specimen-to-specimen standard deviations in the derived electrical conductivities presented in Table 3 were deemed satisfactory for assessment purposes. The experimental results demonstrate a decrease in the measured in-plane electrical conductivities σx,θ as the direction deviates from the weave directions, with a minimum in the 45° orientation. The through-thickness electrical conductivities σz,θ are observed to be 2.8±0.3 S/m which is three orders of magnitude smaller than those for the σx,θ, and appear to be independent of the material orientation in the specimen.
Induction heating experiments
The temperature distribution at the bottom surface of the specimen when the maximum temperature reached 90°C is shown in Figure 5 for the experiments with coil orientation θ = 45°. Depicted is the mean result of the five heating experiments at this coil orientation. This maximum temperature Tmax was reached after a heating time of t = 0.90 ± 0.02 s, this value represents the average and the standard deviation over the five measurements. Temperature distribution at the bottom surface of the specimen when the maximum temperature reached 90°C for a coil orientation of θ = 45°.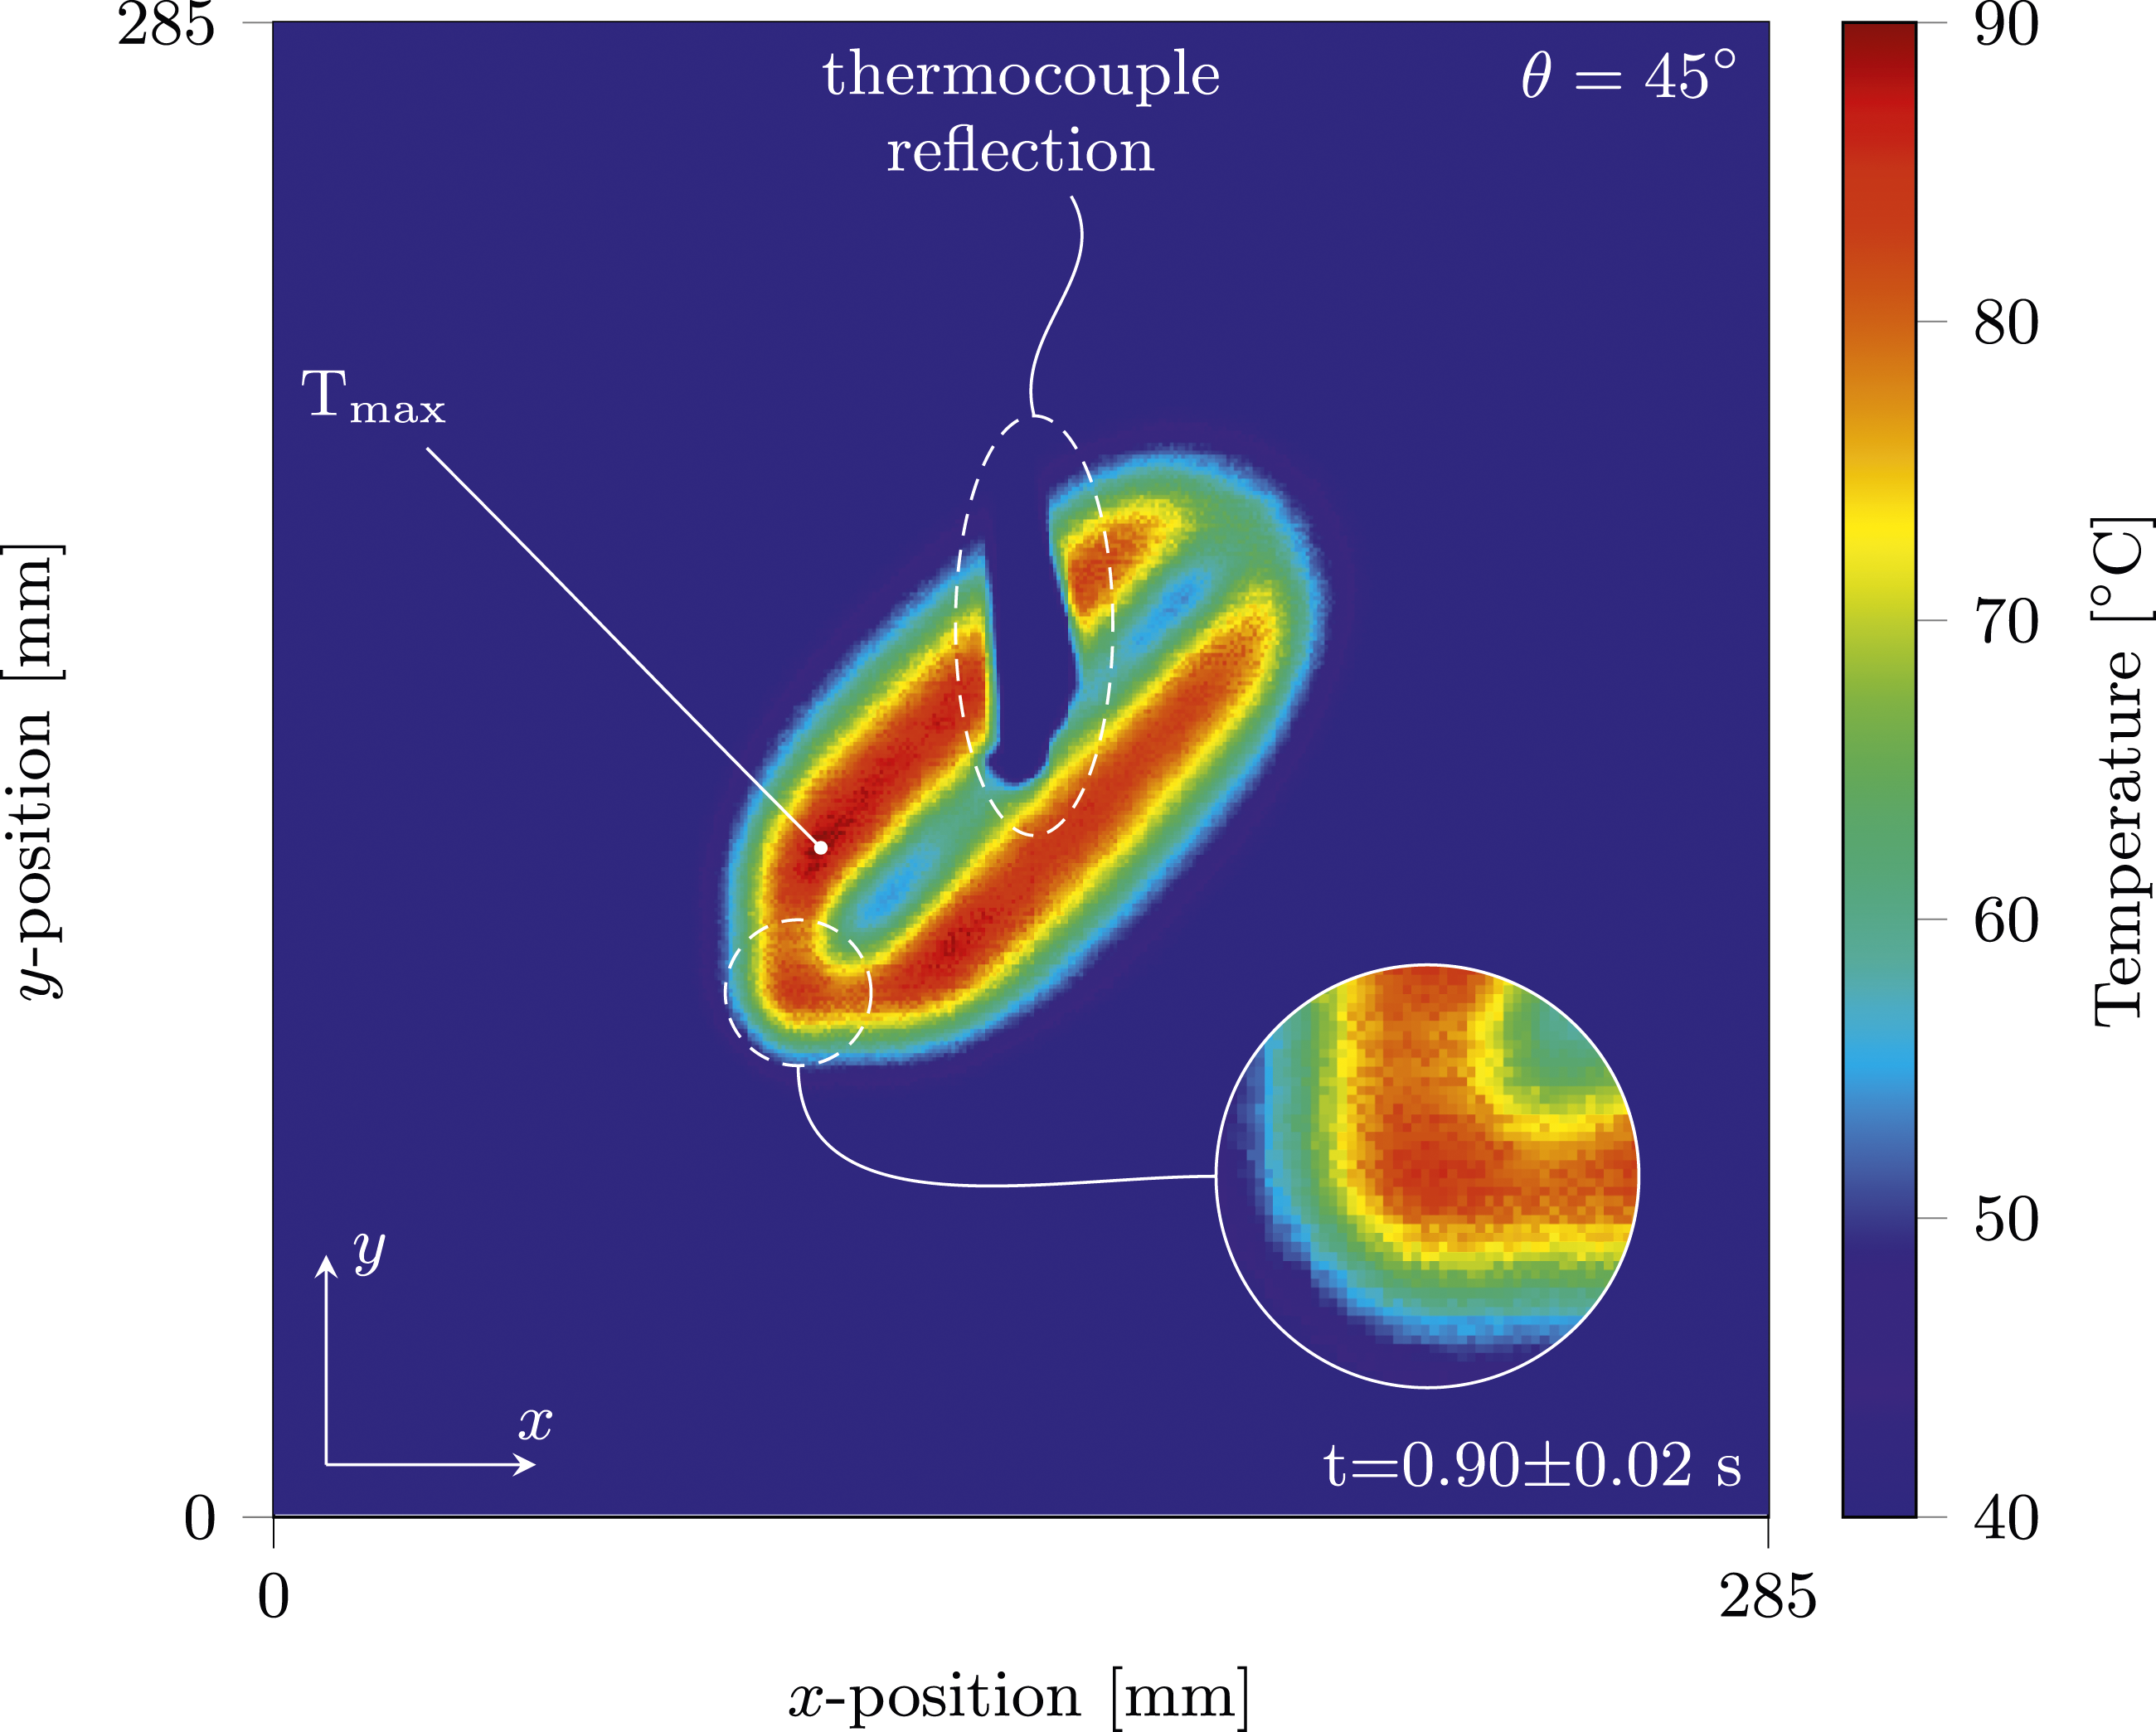
The position of the maximum temperature is indicated in Figure 5 which did not change during the experiment. The reflection of the thermocouple, used to validate the thermal camera measurements, is visible in the denoted area. A hot-spot appeared at the coil’s turn around, this is shown in the magnification inset in Figure 5.
Figure 6 shows the temperature distributions at the bottom surface together with the positions of the maximum temperature for the experiments with all the other coil orientations once the maximum temperature at the specimen’s bottom surface reached 90°C. The reflection of the thermocouple during the experiments is also visible in these temperature distributions but not indicated in Figure 6 for clarity purposes. Temperature distribution at the bottom surface of the specimen when the maximum temperature reached 90°C for all the other coil orientations.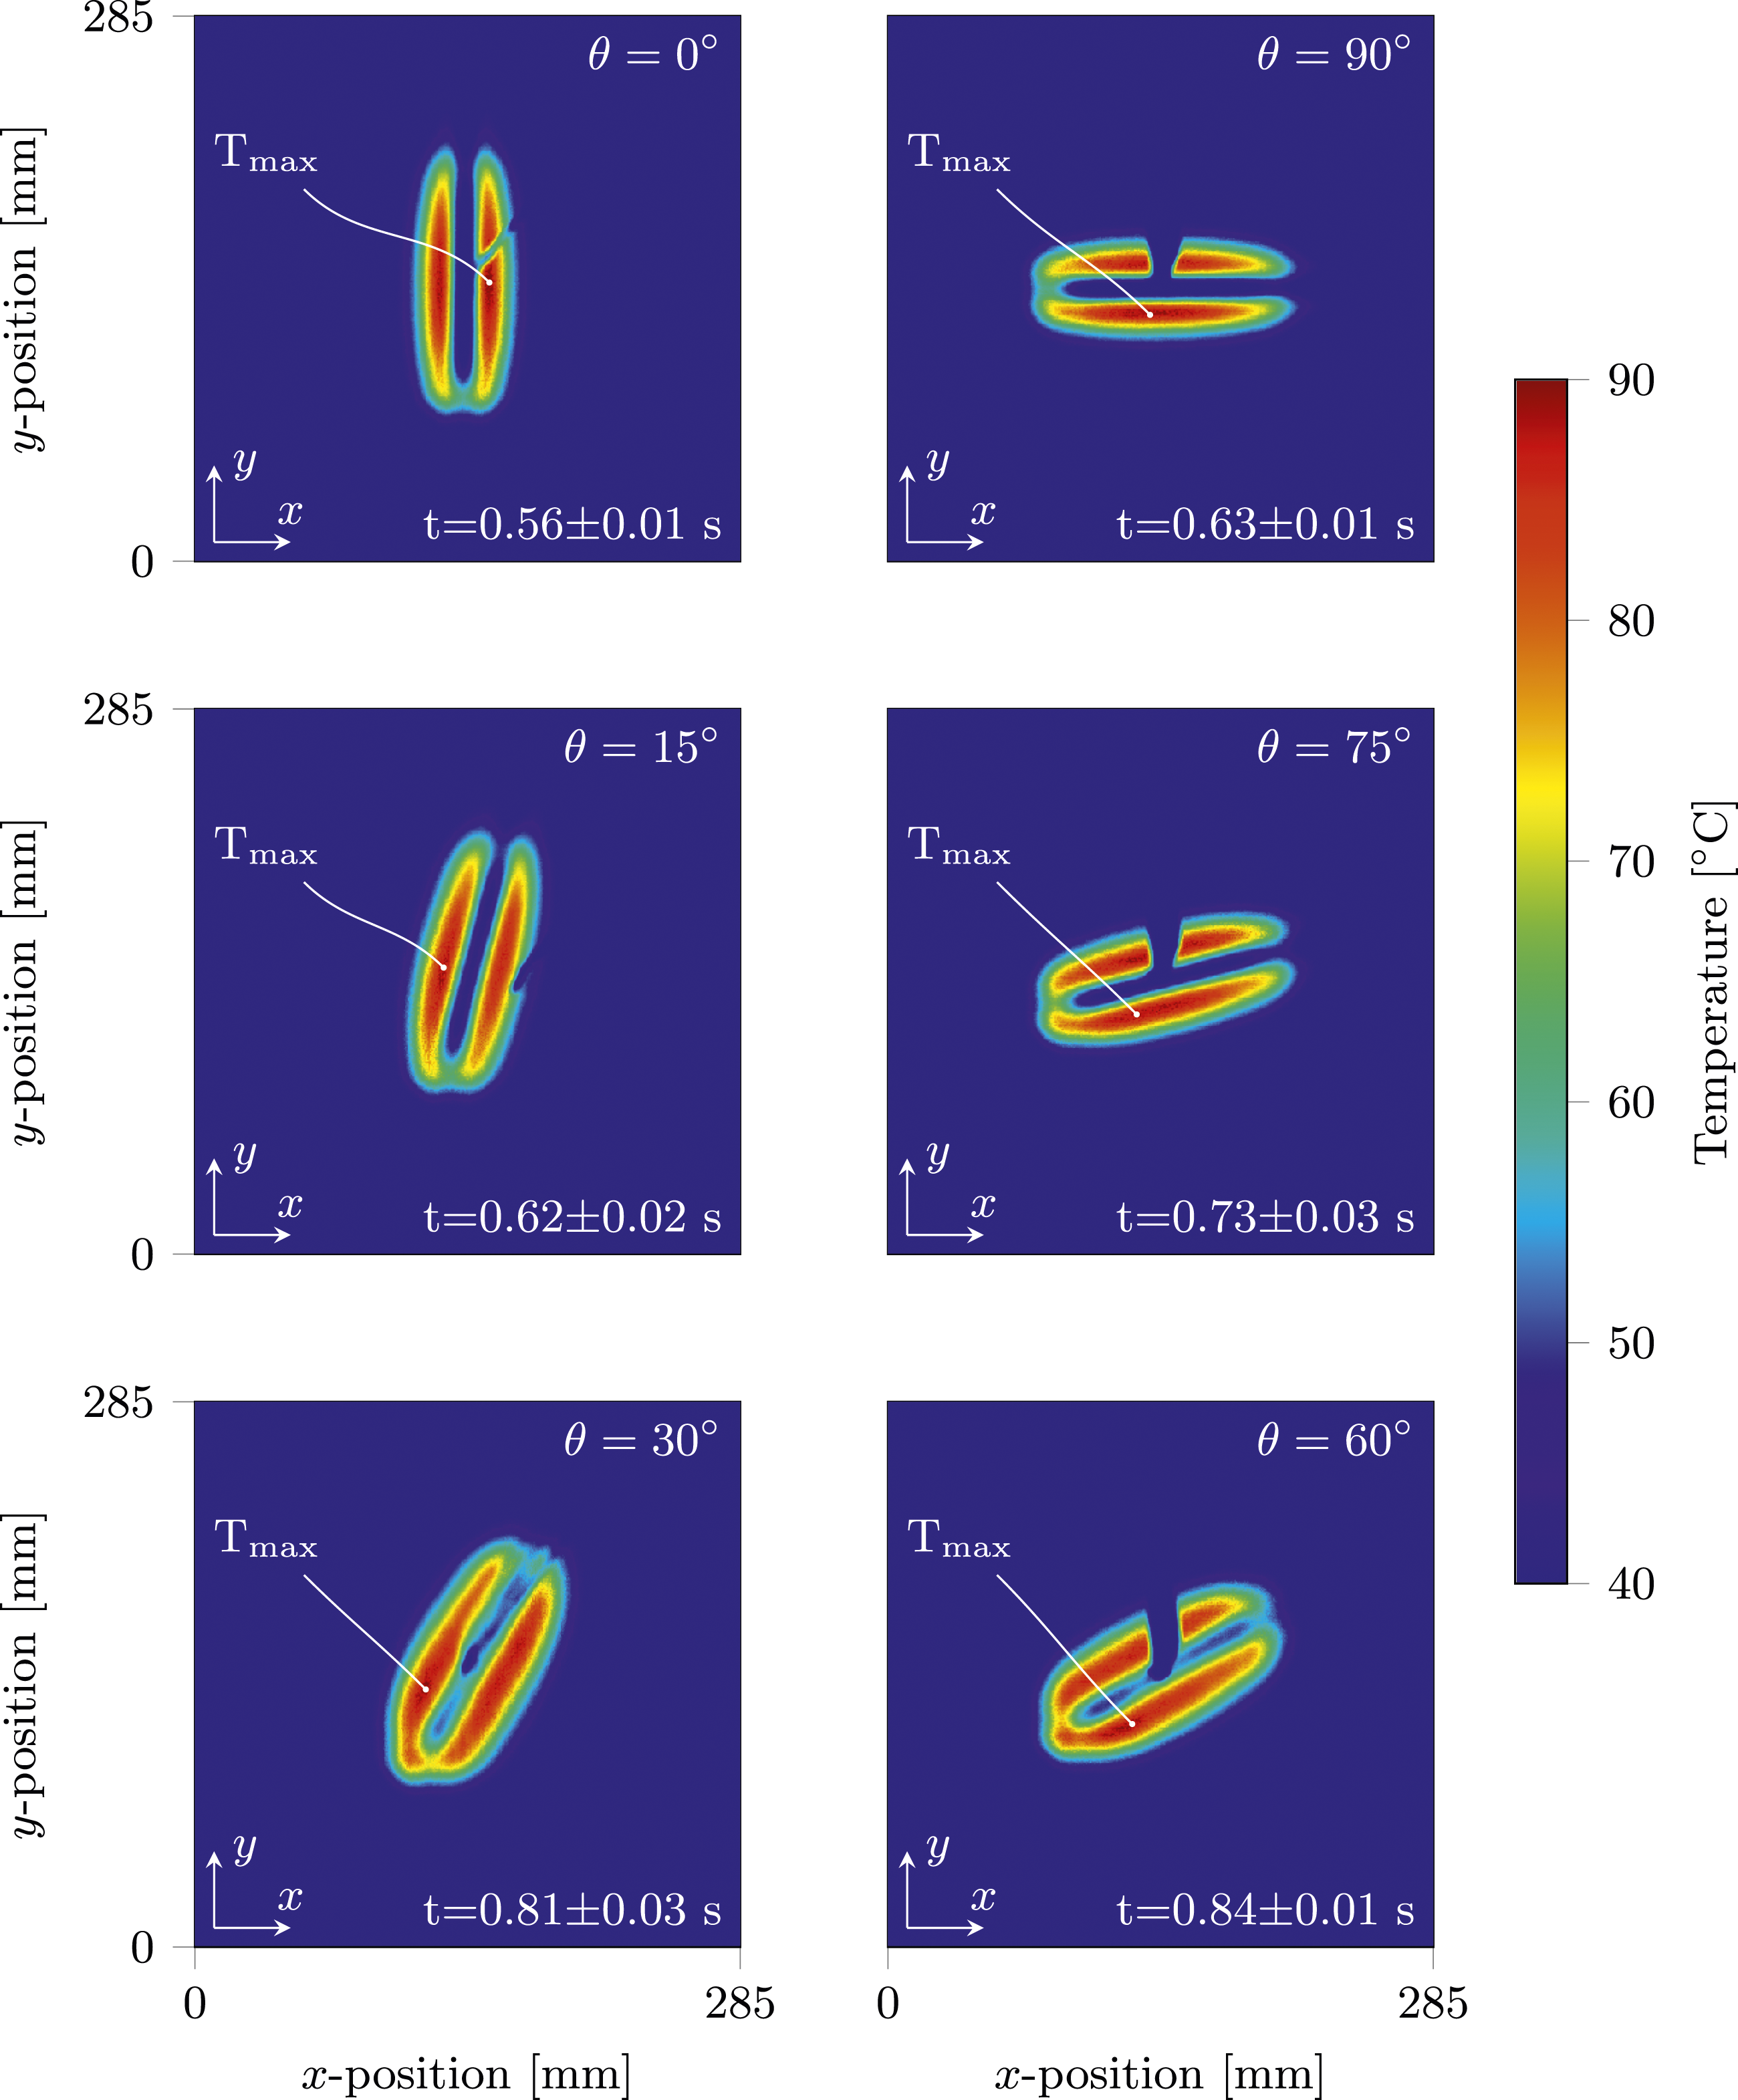
The hot-spots at the coil’s turnaround are visible for certain angles (30° and 60°), similar to the hot-spot in Figure 5, these are not specifically indicated as well.
The time needed for the maximum temperature at the bottom surface of the specimen to reach 90°C, provided in Figures 5 and 6, depends on the direction in which the eddy currents were induced. The development of the maximum temperature at the bottom surface of the laminate is shown in Figure 7. Maximum temperature development at the bottom surface. The error bars represent the standard deviation of five measurements. The measurements are only plotted for every 0.1 s for clarity.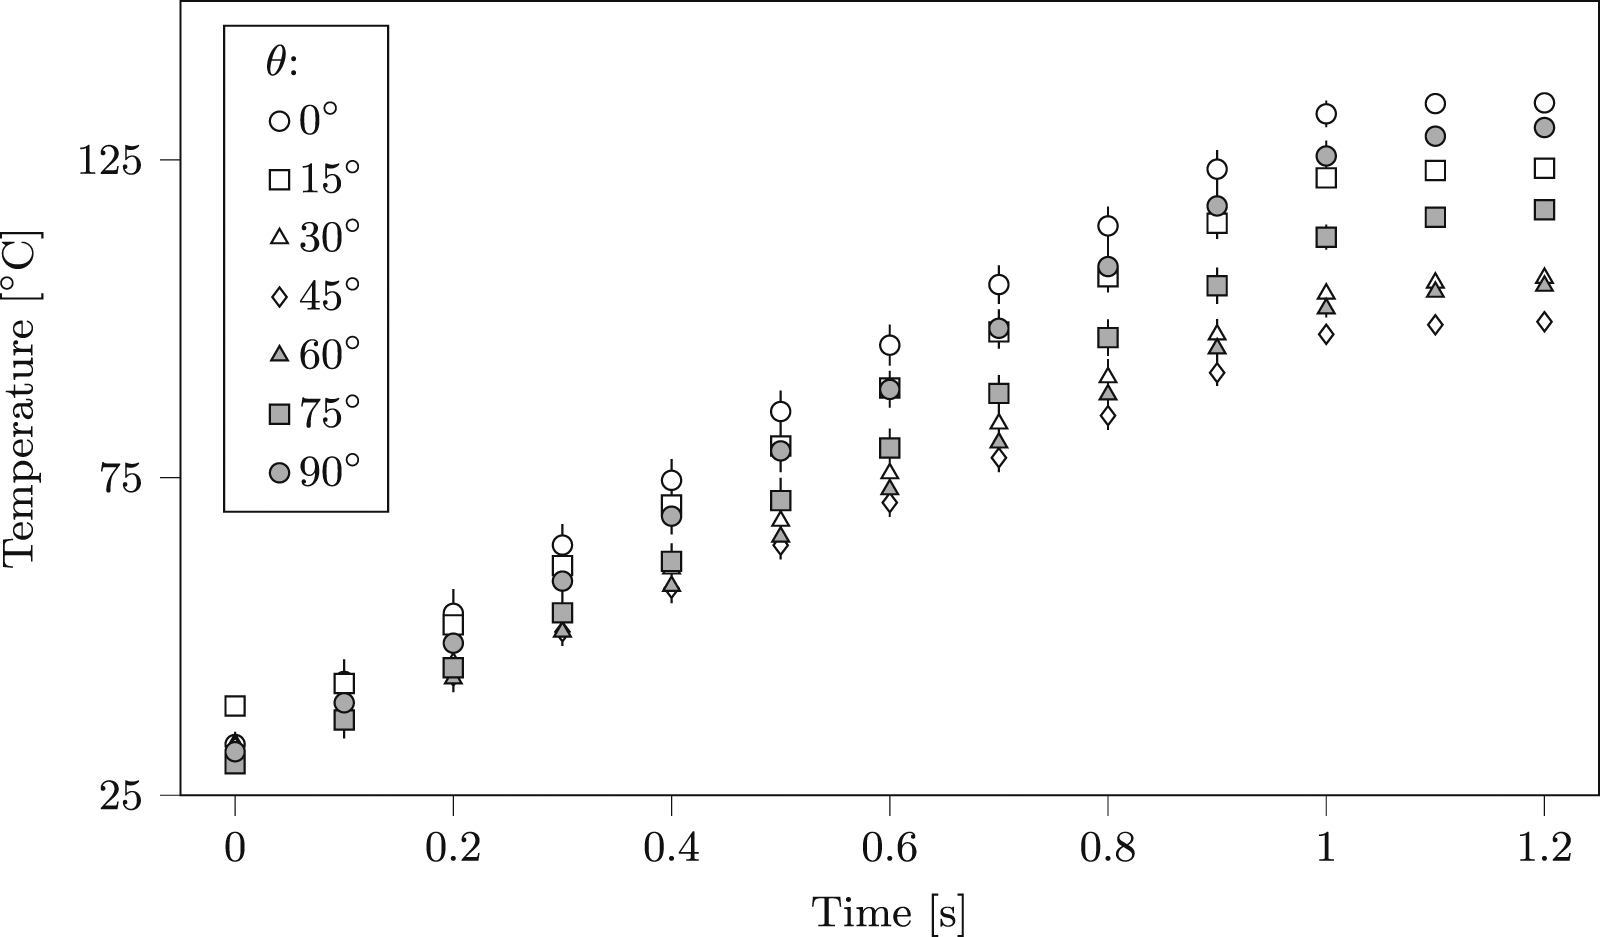
Higher hr occurred when the eddy currents were generated in one of the fibre directions of the fabric.
The hr were determined for each separate experiment by linear regression between 0.1 and 0.9 s of heating. In this way, it was assured to obtain a single value for the heating behaviour at the different coil orientations avoiding the different initial temperatures in the separate experiments. It is assumed that the hr is not affected by the initial temperature (room temperature) of the specimen. The hr are provided in Table 3 and the standard deviations of the experiments were considered acceptable. The experimental results show a decrease of the hr for eddy current generated in the directions deviating from the weave directions with a minimum in the 45° orientation.
Discussion
Electrical conductivity experiments
The measured electrical conductivities indicate an in-plane anisotropic electrical conductivity of the specimens. This is not compatible with a straightforward continuum model in which the anisotropic electrical conductivity of the TPC is considered within a two-dimensional Cartesian representation implying that the in-plane electrical conductivity of the material is isotropic when the electrical conductivity is equal along and across the weave. The measured in-plane electrical conductivities were a combination of the material’s anisotropic electrical conductivity and the specimen’s dimensions. Although not specifically studied in the present study, it is assumed that the anisotropy is caused by the contacts at the junctions of the crossing fibre bundles at the material’s microstructural level as schematically displayed in details ii and iii of Figure 1.
A numerical analysis has been conducted to study the effect of the specimen dimensions on the measured electrical conductivity of the weave-based TPC specimen. A single fabric ply laminate, subjected to conditions typical for a conductivity measurement, was modelled using the approach outlined in Ref.
15
to define the electrical conductivity of the TPC material. A schematic overview of the specimen undergoing a conductivity measurement is presented in Figure 8. Schematic overview of the conductivity measurement studied in the numerical parameter study is presented, depicted is the layered approach to define the electrical conductivity of the weave based TPC material.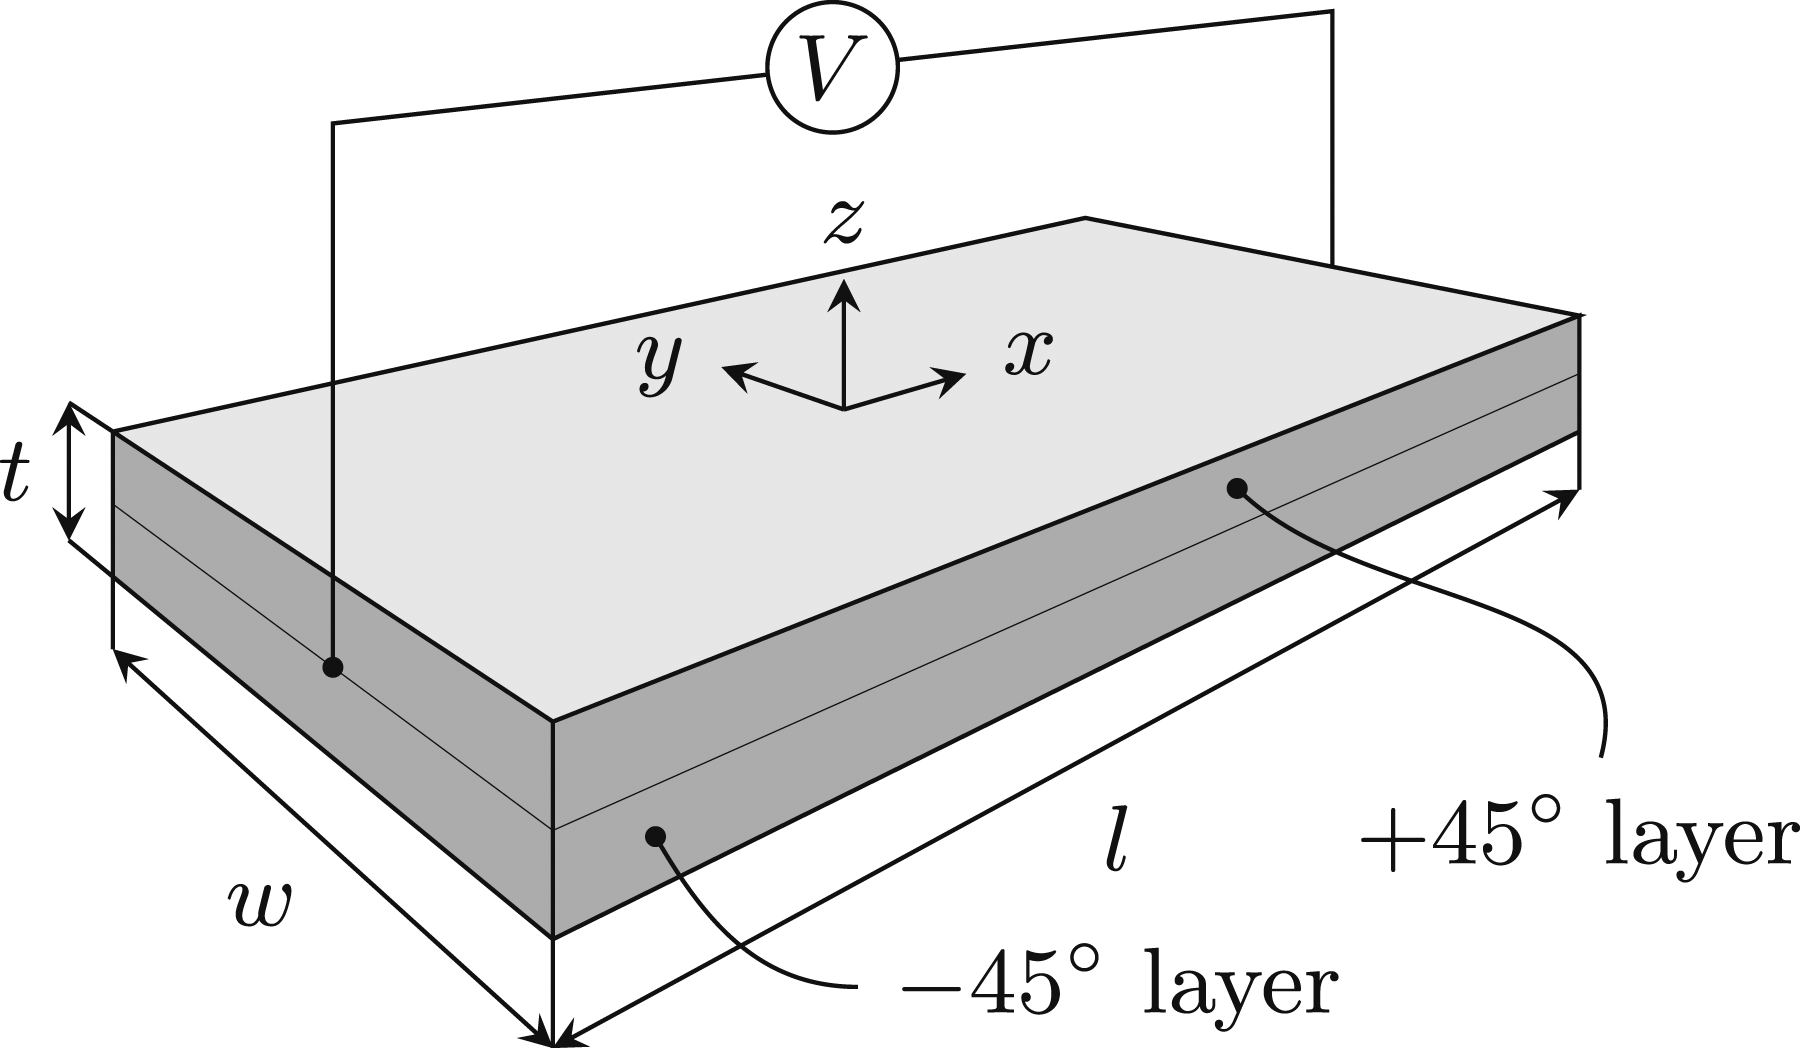
The specimen comprised two layers of equal thickness, exhibiting typical unidirectional electrical conductivity properties, but with perpendicular in-plane fibre orientations. The first principal directions 1 and 2 of each layer were confined to the plane of the layer, with the first principal direction assumed to be coincident with the fibre direction in the corresponding layer. The third principal direction was normal to the plane of the laminate in the specimen. The longitudinal axis of the specimen is denoted as the x-direction, the y-direction corresponds to the width direction and the z-coordinate coincides with the laminate normal. The numerical parameter study was performed on a ±45° fabric ply, thus a +45° layer and a −45° layer in the numerical model, with the angles representing the angle between the fibre direction of the corresponding layer and the x-direction of the specimen. The laminate thickness t was set to the ply thickness of the considered material in this study, being 0.31 mm, and the length l was set to 120 mm, corresponding to the distance between positions A and B in Figure 2. The applied electrical conductivity in the fibre direction of the layers in the model was set to 13.5 kS/m agreeing with σ1 in Table 3. The electrical conductivity in the 3-direction was set to 2.8 S/m agreeing with σz in Table 3. The transverse electrical conductivity σ2 and the width w of the laminate were varied in the numerical parameter study. The result of the parameter study is depicted in Figure 9. Effect of the specimen width/specimen thickness ratio on the measured in-plane electrical conductivity for a material orientation, θ, of 45°.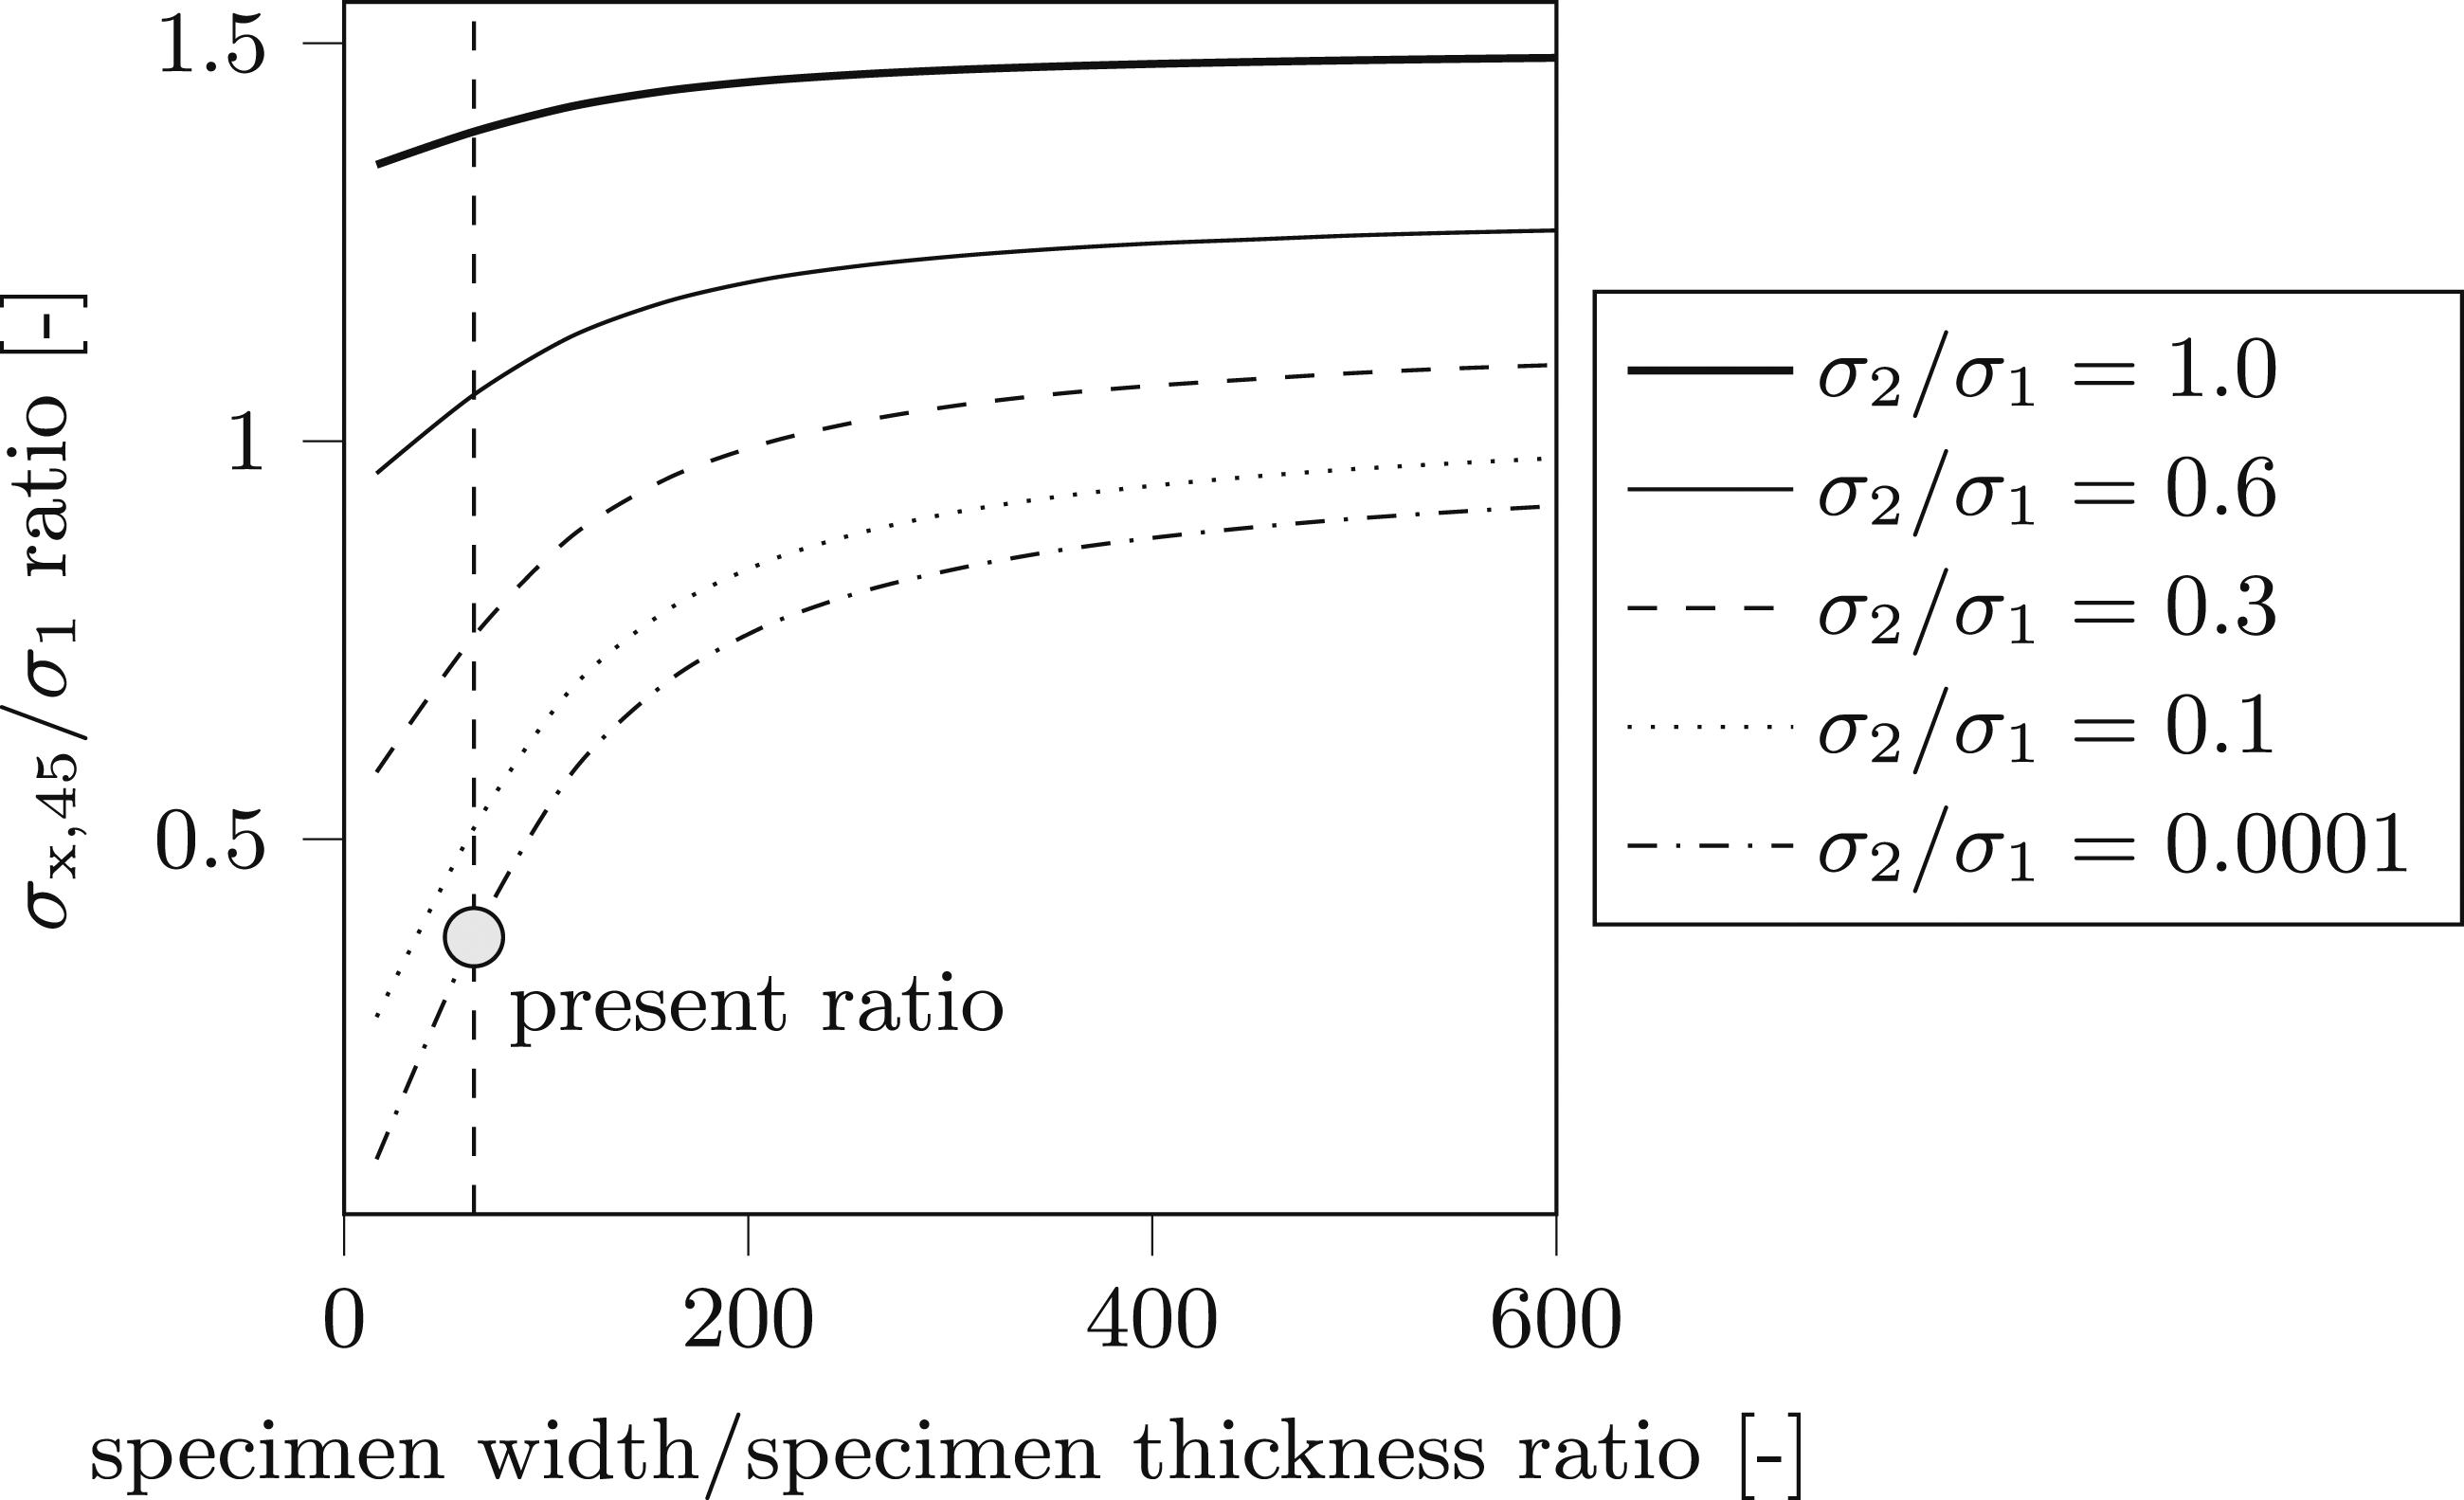
The parameter study has demonstrated that a small value of σ2 results in a greater dependency of the measured σx,45 on the specimen’s w/t-ratio, yet does not significantly change for σ2/σ1 < 0.1. Moreover, a small value of σ2 provides for a conservative estimate of the geometry-dependence. When σ2 is significantly smaller than σ1 and the chosen w/t-ratio in the present study is applied, the influence of specimen geometry on the measured electrical conductivity were observed. For w/t-ratios of approximately 300–350 and above, the measured electrical conductivity is no longer influenced by the specimen geometry, thus allowing for the determination of the material’s electrical conductivity.
The same numerical model, with σ2 = σ3, was applied to investigate the planar angle dependence of the measured in-plane electrical conductivity, which is accurately described by The measured in-plane electrical conductivities, the error bars represent the standard deviation of four measurements. The applied electrical conductivities in equation (1) are: σ1 = 13.5 kS/m and σx,45 = 5.2 kS/m.
Correlate electrical conductivity and heating behaviour
Plotting the hr from Table 3 against their respective measured in-plane electrical conductivities, as plotted in Figure 11, shows a linearity with an R2 value of 0.99. The maximum temperature at the bottom surface was found to be subject to varying heating rates, depending on the orientation of the coil. The standard deviation of five measurements was used to ascertain the error bars of the data.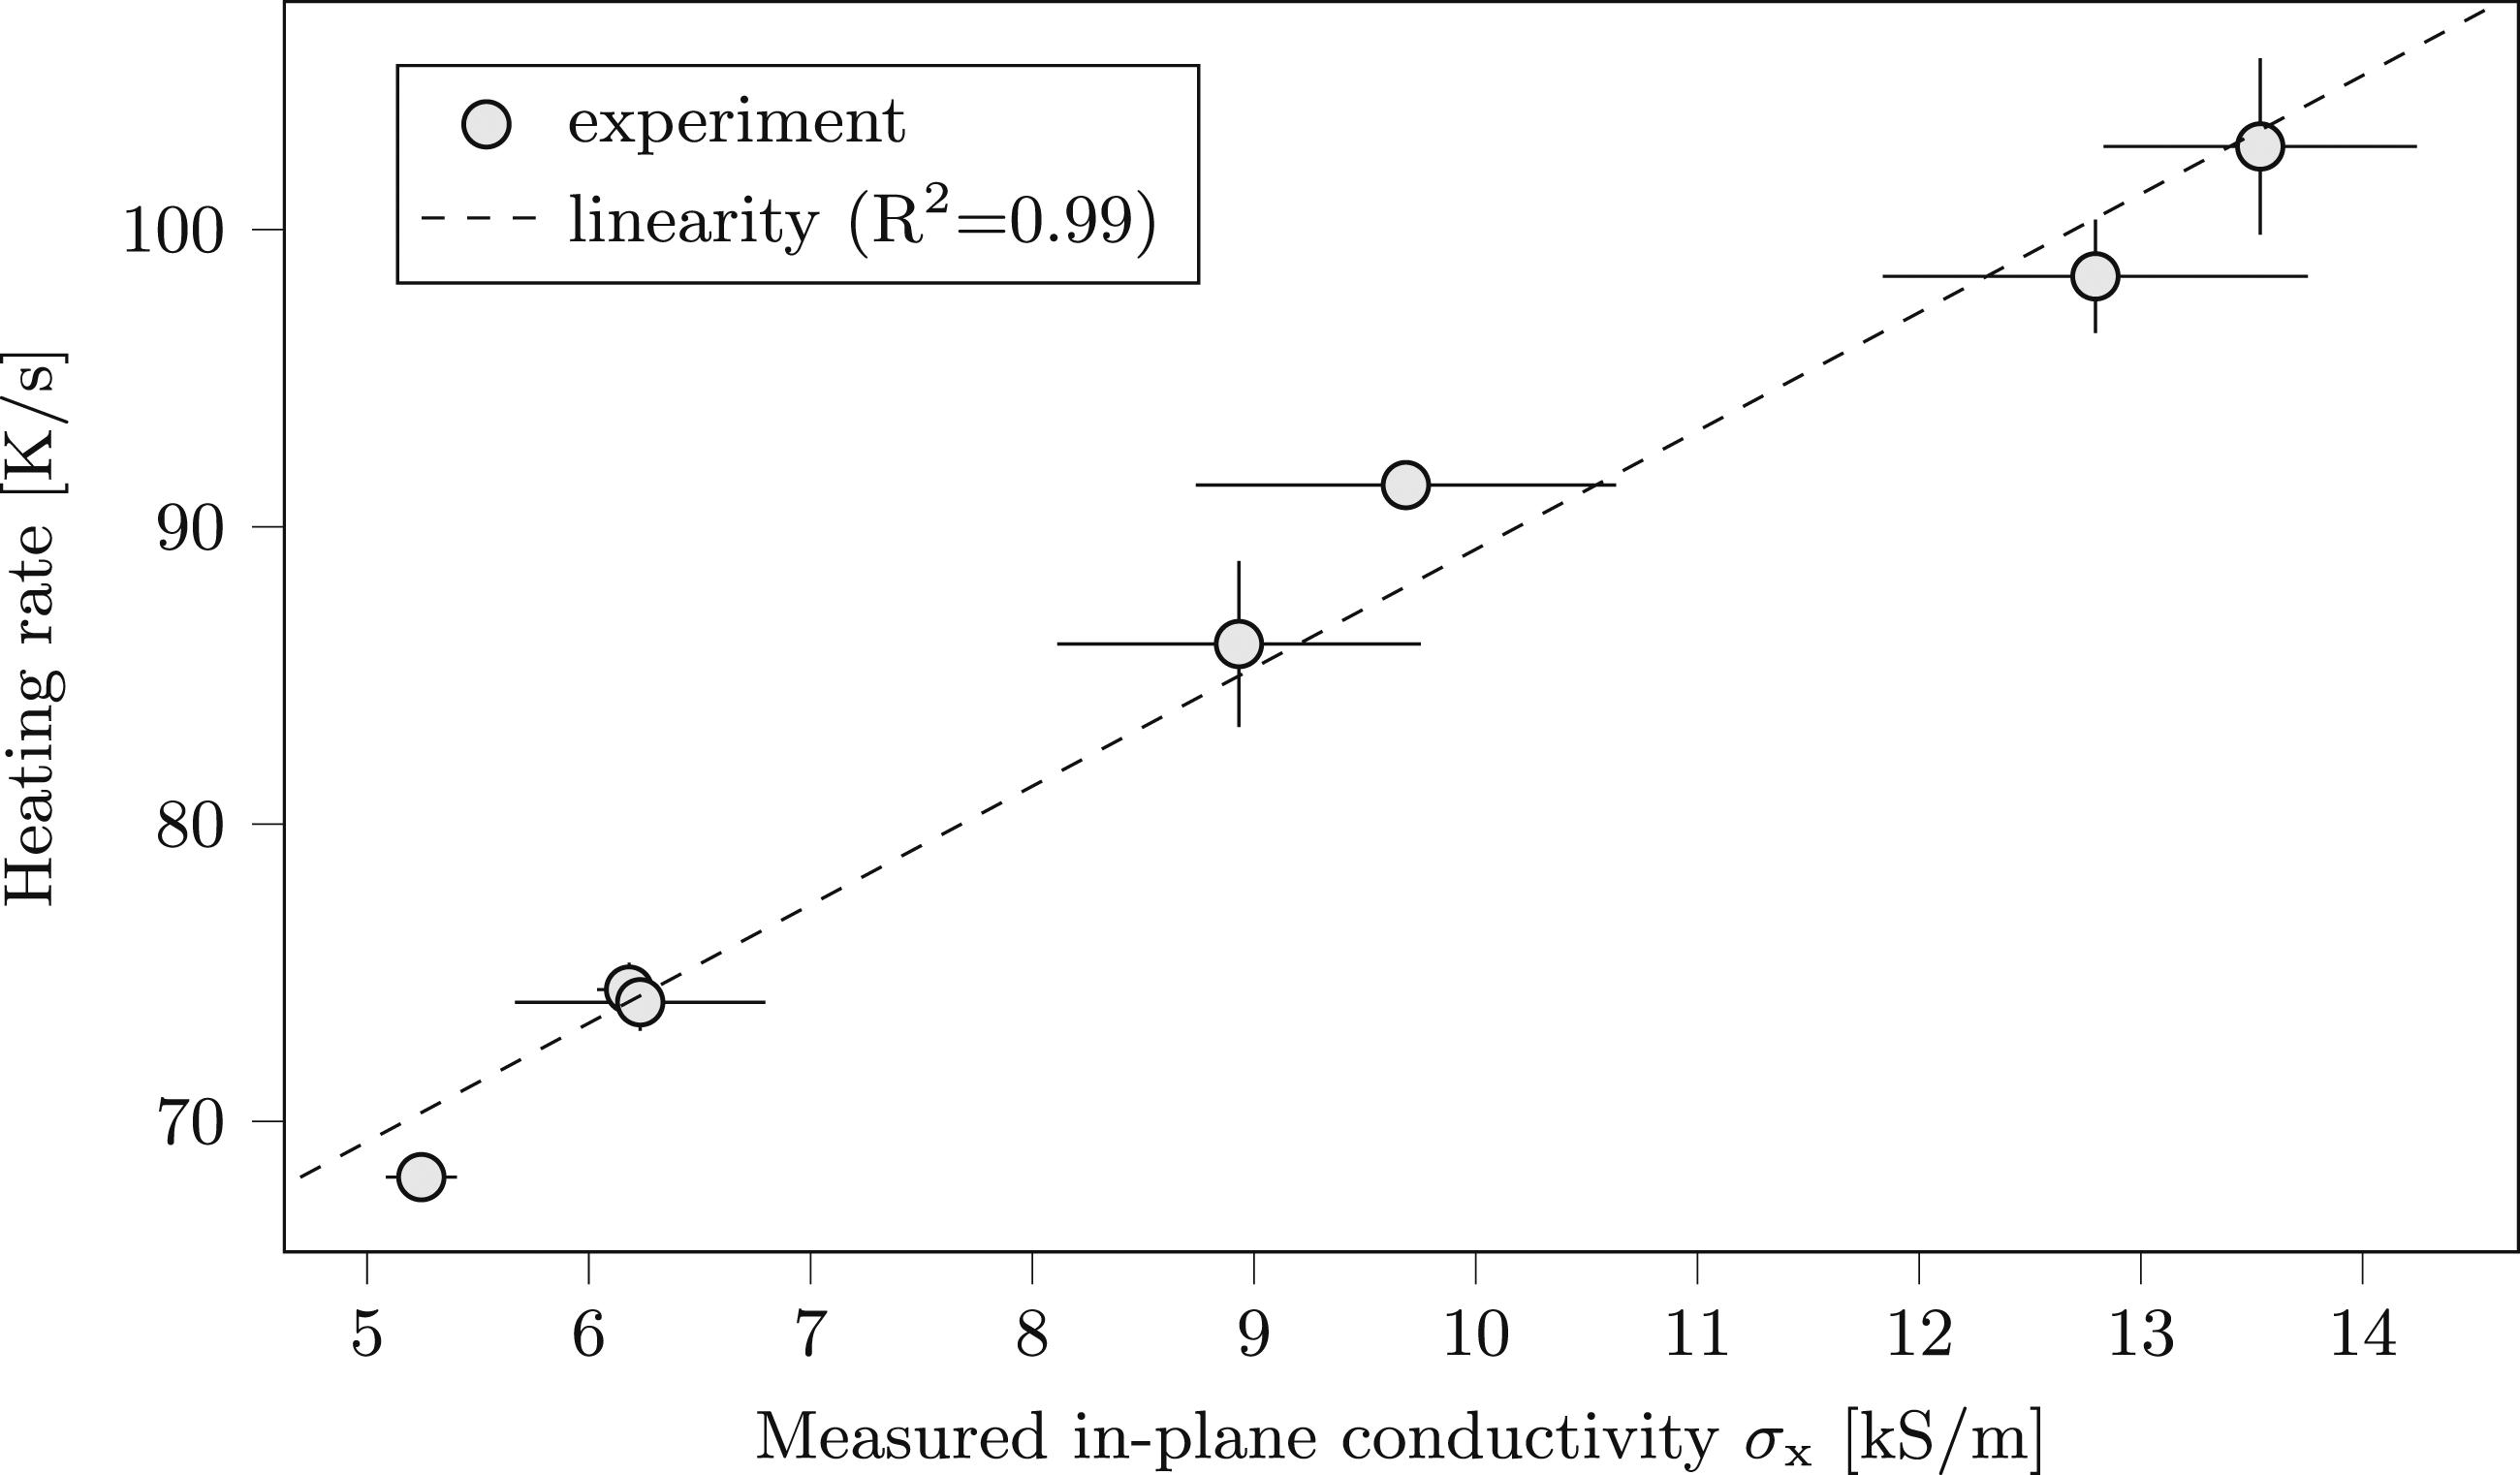
The linear correlation observed between the hr of the maximum temperature and the measured in-plane electrical conductivity of the TPC specimen, ascertained using direct current measurements, suggests that the thermal response in an inductively heated TPC, under the given experimental conditions, no dielectric heating occurs, which is in agreement with the findings reported in Ref. 24
The linear correlation between the hr of the maximum temperature and the measured electrical conductivity of the TPC specimen, represented by the dashed line in the graph, does not cross the origin. The numerical parameter study has suggested that, as the w/t-ratio increases, the measured electrical conductivity also increases (see Figure 9) with the values at the x-axis of the graph shifting towards σ1 (13.5 kS/m). This behaviour can be qualitatively explained by a relation between the specimen width at the conductance measurement and the width of the zone affected by the coil during the ih experiments, as the thickness of the specimens in both experiments is the same.
Conclusions and recommendations
The overall objective of the present study is to determine whether a straightforward description of a measured anisotropic in-plane electrical conductivity of a woven fabric reinforced TPC can be used to correctly predict the thermal response of a TPC laminate when heated by induction.
It was shown that a linear correlation exists between the measured anisotropic in-plane electrical conductivity and the thermal response during ih experiments for the range between 5.2 and 13.5 kS/m. The study: • shows, in the experiments, that no perfect contacts exists at the junctions of the fibre bundles in the fabric. In practice, this resulted in a measured in-plane anisotropic electrical conductivity. Related to this, the measured conductance is an effective conductance that should be measured for each material; • shows that the measured in-plane anisotropic electrical conductivity of a fabric-based TPC can be accurately described using electrical conductivity measurements in the warp direction and in the 45°-direction; • points out that the thermal response of a TPC depends on the direction in which the currents are generated in the laminate; • reveals that the thermal response in a laminate is linear to the measured in-plane anisotropy of the electrical conductivity; • points towards Joule heating being the dominant heating mechanism during ih of the used material.
Footnotes
Acknowledgements
The authors gratefully acknowledge the support from the industrial and academic members of the ThermoPlastic composites Research Center (TPRC), specifically the contribution from Toray Advanced Composites regarding the supplied materials.
Declaration of conflicting interests
The author(s) declared no potential conflicts of interest with respect to the research, authorship, and/or publication of this article.
Funding
The author(s) disclosed receipt of the following financial support for the research, authorship, and/or publication of this article: This work was supported by the industrial and academic members of the TPRC.