
Abstract
The glass fiber felt made through flame blowing process was characterized on morphology and its filtration performance. Fiber diameter has been measured through SEM and BET methods. Theoretical calculations on pressure drop and filtration efficiency were developed and compared with the experimental measurement. The discrepancy between the calculated results and measurement on filtration efficiency is derived from the presence of fine fiber (<0.5µm) in the glass fiber felt, which contributes to the actual high filtration efficiency in measurement. The multiple micro-layered structure in glass fiber felt, which improves the dust holding capacity and enables glass fiber felt as a depth filter. Glass fiber felt showed a longer duration of the slow increase region for pressure drop build-up comparing to other filter materials with lower averaged pressure drop through its filtration service life. Furthermore, quality factor calculation has been developed for prediction on the energy cost performance of the filters based on the pressure drop, separation efficiency and dust holding capacity.
Keywords
Introduction
The impacts of indoor air quality (IAQ) on health of human body have been studied by several researchers and are well documented in the scientific literature [1–4]. With the rapid industrialization and urbanization, the particle emissions from industrial processes, automotive exhaust and some other particulate matter pollution have been increasing [5]. The airborne particulates and pollutants have become the major source of the problem of indoor air quality. The air filter in the heating ventilation and air conditioning (HVAC) systems can remove air particulates and pollutants, and have been widely used as the main control of improvement of indoor air quality [6].
For any air filtration system, the efficiency and affordability need to be balanced. Within HVAC system, air filter is the main consumable product, and it plays the critical role on filtration efficacy. Besides the price of air filter product, the associated operation energy cost should also be taken into consideration in filter selection [7]. In a HVAC system, the operating costs of a standard pleated filter can be 10 times greater than its price [8]. Study has demonstrated that doubling the pressure drop across the filter caused 13% increase in fan power, and quintupling the pressure drop across the filter caused 63% increase in fan power [9]. A model developed by Montgomery [10] to predict filter’s energy efficiency and annual operation cost is shown in Figure 1. The results indicated that the higher particle concentration is in the air stream, the higher the operating cost of the system generates. And the electrical energy cost place equally important role in the annual operation cost. In order to reduce energy and operating costs, the development of an air filter material needs to consider having low pressure drop, which results in lower energy costs, and having high dust holding capacity, which results in longer service life, while remaining high filtration efficiency.

Montgomery’s annual operation cost model [10].
Many research and development have been focused on improvement of filtration efficiency through filter material innovation. For example, electret filter media employs electrical charge mechanism to capture particles in addition to traditional physical filtration [11,12]. Nanofiber filter media [13,14] through electrospinning process possess significantly more surface area for particle deposition, resulting in improved filtration efficiency [15,16]. On the other hand, changes in structure of filter, such as increasing porosity, can enhance dust holding capacity to prolong the service life [17], as well as to reduce pressure drop. Jabri et al. [18] enhanced the dust holding capacity of the filter media by combining two fibers of different diameter. The fine fibers contribute the main filtration for particle deposition, while the coarse fibers provide more stiffness and three-dimensional architecture to the media leading to an improvement of the dust holding capacity. Brown and Thorpe [19] confirmed that the pressure drop across a mixed-fiber filter was similar to the pressure drop for a single-filter filter by theoretical calculation and experiment.
Glass fiber felt is a porous material with high porosity and excellent thermal, mechanical and chemical stability properties [20]. Besides the acoustic and thermal insulation applications [21], glass fiber felt has drew resurrective attentions as air filtration material due to its low cost and high dust holding capacity. There are three main manufacturing processes on making glass fiber felt, i. e., the continuous draw, the flame blowing and the centrifugal spinneret blow processes [22]. Each process produces fiber felt with unique set of characteristics such as diameter, length, surface chemistry and structure. The most important morphological properties of glass fiber felt in filtration are diameter and structure. Diameter distribution is perhaps the most fundamental to filtration efficiency for glass fiber felt. Fiber diameter and its distribution also impact the structure which is related to flow resistance and dust holding capacity. With the increase of fiber diameter, the thickness of glass fiber felt increases, which results in lower airflow resistance and higher dust holding capacity.
Although glass fiber felt material has been long studied on its physical properties and its performance, there is gap in understanding of the correlation of fiber morphology and its filtration properties. In this study, we focus on flame blowing fiber felt formation process. The objective is to investigate the morphology of glass fiber felt such as fiber diameter, surface area and microstructure of glass fiber felt, and their impact to filtration performance. We also analyzed the pressure drop profiles of the glass fiber felts during the particle deposition, and aim to provide prediction of the filtration performance of glass fiber felt in HVAC system, including the energy cost performance of glass fiber felts.
Experiment
Materials and fabrication
The glass fiber felt materials were made through the flame blowing process by the production equipment in TianShengYuan Co., Ltd., China. The flame blowing process is illustrated in Figure 2. The frits melt into glass liquid in an electric melting furnace. The viscous melt fluid is drawn through a nickel alloy leak board by a drawing roller to form the primary glass filaments. Under the hot airflow jetted from combustion nozzle, the glass filament splits into secondary fibers of diameter ≤ 5 µm, i.e. glass fibers. During the glass fiber drop formation on the transfer substrate, Polyacrylic resin adhesive is sprayed onto the web, and cured at 180 °C to form glass fiber felts.

Schematic diagram of flame blowing process [23].
The fiber dimension and physical properties are dependent upon process conditions on the certain glass composition, such as blow nozzle temperature, diffusion duct structure [23], fiber suspension flow, cooling time, and et al. In this study, blow nozzle temperature, air jet velocity, electric melting furnace temperature and the type of leak board were kept the same, different fiber diameters and various morphologies of felts were produced through the control of the rotating speed of the drawing roller. The motor input of the drawing roller was controlled between 25 Hz and 40 Hz. The properties of the glass fiber felt materials are presented in Table 1.
Properties of the filters.

Measurement
Morphology
Morphologies of glass fiber felts were examined by scanning electron microscopy TM-3030 (SEM). In order to prevent the structure of the glass fiber felts from being damaged during the sample preparation process, the glass fiber was cooled before slicing. The sample was treated by liquid nitrogen for 1 min, then left 30 seconds at room temperature before ready for slicing. The conductive coating was applied to the specimen before scanning electron microscopy.
Fiber diameter of glass fiber felt
For microfiber products, mean surface area equivalent diameter values are usually reported, which were often derived from direct air absorption BET measurement. The BET method [24] is widely used in materials science for the calculation of surface areas of solids by physical adsorption of gas molecules. The total surface area Stotal and the specific surface area SBET are given by
The following assumptions are made when calculating the diameter of glass fiber. The glass fiber is a cylinder with uniform diameter and the fiberglass is continuous.

The air flow resistivity measurements
The measurement of the flow resistance and flow resistivity of porous materials has been standardized on a compressed-air apparatus according to ASTM C 522-3 Standard Test Methods. The air velocity through the samples was 1.75∼14 cm/s.
Determination of filtration efficiency of glass fiber felt
Figure 3 shows a schematic diagram of the TOPAS AFC-131, the apparatus for filtration efficiency measurement. It consists of an aerosol generator, a dust disperser, a test channel containing the test filter, a volume flow control and two sampling ports for optical particle counter upstream and downstream the filter. The size of test channel was designed according VDI 3926. Aerosol particles generated from aerosol generator and the number of aerosol particles are measured by sampling ports for optical particle counter. The filtration efficiency is calculated by the number of different of aerosol particles in the upstream and downstream particle counters of the test filter. Air velocity inside the filter is kept constant using a volume flow control system and pressure drop across the filter is measured with a high accuracy differential pressure transducer. A computer enables data acquisition.

Schematic diagram of experiment setup.
Determination of dust holding capacity of glass fiber felt
The solid particles were generated by Dust disperser SAG-410 with a moving toothed belt for dispersion of the dry solid particles (ISO 12103-A2 fine). The particle size ranges are shown in Table 2. The particle concentration of the output aerosol can be adjusted by changing the speed of the feeding belt for feeding to the test channel through the compressed air. The dust mass flow rate controlled by feeding belt speed is shown in Figure 4. The difference between the weights of the test filter before and after dust loading process is calculated as the dust holding capacity. The solid particles passing through the test filter was intercepted by absolute filter in the downstream. By weighing these two filters (test filter and absolute filter), the total separation efficiency of the filter media is determined.
Size ranges of particle.


Dust disperser SAG 410: Mass Flow Rate vs. Feeding Belt Speed determined for different powders.
Results and discussion
Morphology
Fiber diameter and its distribution are the key parameters that contribute to filter media performance properties, such as filtration efficiency and pressure drop. The fiber diameter of glass fiber was mostly determined by the glass fiber felt manufacturing processes. The diameter distribution for a commercial continuous draw process is typically in normal distribution with mean diameters of 8 to 16 µm. The diameter distribution for a centrifugal spinneret blow process is distinctly in exponential distribution with mean diameters in the range of about 2 to 8 µm. The geometric mean diameters of the fibers made through a flame blowing process range from about 0.1 to 5 µm, and the diameter distribution is in exponential distribution, but with a greater positive skew.
The SEM image and fiber diameter distribution of samples were shown as Figure 5. The diameter distribution and the averaged geometric diameter were calculated based on about 400 fibers through SEM measurement. In comparison to the average diameter in SEM, the mean surface area equivalent diameter was calculated based on BET measurement, and both results are listed in Table 1. It's worth noting that the mean surface area equivalent diameter derived from BET method is greater than the geometric mean diameter. The main reason for the difference is that the calculation in BET method is affected by the length of the fibers and the surface property. For our glass fiber felt sample, it consists of both long and short fibers. The presence of resin adhesive on fiber surface also attributes in BET calculation, while in SEM measurement, the resin adhesive impact is much less.

SEM image and measured (SEM) fiber diameter distribution of samples.
Previous Bauer [22] study showed that the fiber diameter distribution for the felt made by flame blowing process is in exponential distribution. Based on our data, the exponential distribution applies to the fine fibers, while for the coarse fibers, their diameter distribution is more in Gaussian distribution, as shown in sample G1. Increase of fine fiber content in the felt will result in smaller average fiber diameter, and the shift of the diameter distribution towards to fine fiber region along with exponential distribution.
Previous research has pointed out the primary layer formation mechanism in glass fiber felt formation [25–28]. Glass fibers overlaid at x-y plane. Our data confirmed the layer formation structure of glass fiber felt through flame blowing process. Our SEM images and cross-section structure shown in Figure 6 clearly indicate that multiple micro-layers were formed at X-Y plane. It should be noted that with the decrease of average geometric diameter, the felt becomes much thinner and solidity increases. This is due to the decrease of coarse fiber content, which provides the support structure between micro-layers.

Cross-sectional structure of glass fiber felt.
Air flow resistivity
The pressure drop is a critical property for air filtration media material. Fiber diameter, material bulk density, and thickness all affect the pressure drop. In this study, air flow resistivity and experimental pressure drop were employed to illustrate the effect of fiber diameter on pressure drop. The air flow resistivity is determined by the experiment with steady air flow passing through a sample of fiber material placed in a tube [29]. The air flow resistivity of the material, R, is defined as
Where v is the mean air velocity, Δp is the pressure decreases over the sample, and L is the thickness of the sample.
According to the Bies and Hansen’s model [30], the air flow resistivity can be expressed as a function of bulk density and fiber diameter
Where d is the fiber diameter, ρm is the bulk density. In this paper, K1 = 1.37 and K2 = 3.18 × 10⁻⁹. Based on equation (5) and equation (6), the pressure drop can be expressed as a function of felt properties
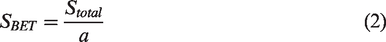
The initial pressure drop against face velocity measured by experiment is shown in Figure 7(a). The comparisons of experimental data and theoretical data for samples are shown in Figure 7(b) to (f), respectively.
(a) Initial pressure drop of glass fiber felt; (b) Sample G1; (c) Sample G2; (d) Sample G3; (e) Sample G4; (f) Sample G5.
The data in Figure 7(a) showed that the initial pressure drop increases with the decrease of fiber diameter. It should be noted that in response to different face velocity of the air flow, samples with smaller fiber diameter showed higher increase of the pressure drop, likely due to the increased density and solidity for the finer fiber samples.
As shown in Figure 7(b) to (f), the initial pressure drop profiles are much closer to experimental results for the calculations based on BET measurement than those based on SEM method, indicating that the mean surface area equivalent diameter (MSAED) based on BET measurement is a better reflection of the fiber diameter for the glass fiber felt than the geometric mean diameter (GMD) based on SEM method. In the original Bies and Hansen’s model, K1 was set as 1.53 for glass fiber product. The calculation using K1 value of 1.37 will result in a discrepancy of the Theoretical calculation data and the experimental results. In our study, the value of K1 was modified.
Filtration performance
Single fiber filtration theory has been often employed in calculation of the filtration efficiency. Particles with size greater than 0.3 μm are mainly removed by diffusion efficiency (ED) and interception efficiency (ER) as shown in equations 8 and 9 below [31]

Where α is the solidity of filter, K is the hydrodynamic factor as defined by equation (10), Pe is Peclet number as defined by equation (11), R is dimensionless particle radius as defined by equation (12)


Where u is the flow velocity, Df is the fiber diameter, Dp is the particle diameter, D is the diffusion coefficient.
The filtration efficiency measured by experiment and the filtration efficiency calculated based single fiber theory are compared in our study. The filtration performance of various glass fiber felts under the face velocity of 11 cm/s is presented in Figure 8. The smaller the particles are, the higher discrepancy on the filtration efficiency is for the different glass fiber felt samples. Also, samples with smaller fiber diameter have higher filtration efficiency, and can achieve the maximum filtration efficiency at faster pace for all particle sizes.

Filtration efficiency of glass fiber felt.
Table 3 shows the calculated filtration efficiency based on GMD and MSAED for 0.4 μm and 4 μm particles, with comparison to the experimental measurement. It shows that the theoretical filtration efficiency is much lower than experiment data, especially for higher efficiency materials, In contrast to what we observed in pressure drop comparison, where MSAED data is closer to the experimental results, the MSAED based calculation of filtration efficiency showed more discrepancy to experimental results comparing to GMD based calculation, for both 0.4 μm and 4 μm particles. We believe the discrepancies are related to fiber diameter distribution. As shown in Figure 6, the fine fiber content increases from sample G1 to G5, especially for the fiber content below 0.5 μm. In summary, for glass fiber felt with both fine and coarse fiber distribution, single fiber theory is not appropriate for filtration efficiency calculation, although the trend on fine fiber impact on filtration efficiency still correlates to the experimental results.
Comparison of experimental and theoretical filtration efficiency.

Our results also indicate that the importance of fine fiber in glass fiber felt on filtration efficiency and initial pressure drop. W. Leung’ research [32] has the same conclusion. The increase of the fine fiber of less than 0.5 μm in the felt can deliver high filtration efficiency while still maintaining good pressure drop.
Dust holding capacity
The total separation efficiency (ISO 12103-A2 fine) of the different samples are presented in Table 4. It should be noted that the total separation efficiency is different from filtration efficiency, with the former measured by weighing the mass of the particle collected at the filter and filter itself. For sample from G1 to G5, the total separation efficiency increased from 96.7% to 99.9%, showing atrend of increase of separation efficiency with the decrease of fiber diameter.
The total separation efficiency (ISO 12103-A2 fine) of the filter mediums.

The pressure drop against dust load for various glass fiber felt samples are shown in Figure 9. Dust holding capacity is defined as the dust weight (gram) per square meter of filter when the filter reaches to either its change time or certain pressure drop limit. For our study, we referred to EN779-2002 standard where the pressure drop limit is set at 450 Pa. The last data point for each sample shown in Figure 9 represent the dust holding capacity for each sample. The results on dust holding capacity showed a good correlation with the sample morphology. The larger the geometric diameter of the fiber is, the higher the dust holding capacity is. This is due to the higher porosity for the larger diameter sample, The coarse fiber provides more support structure in the material, thus increasing the porosity of the material. While for fine fiber sample, much less pores are present due to lack of coarse fibers.
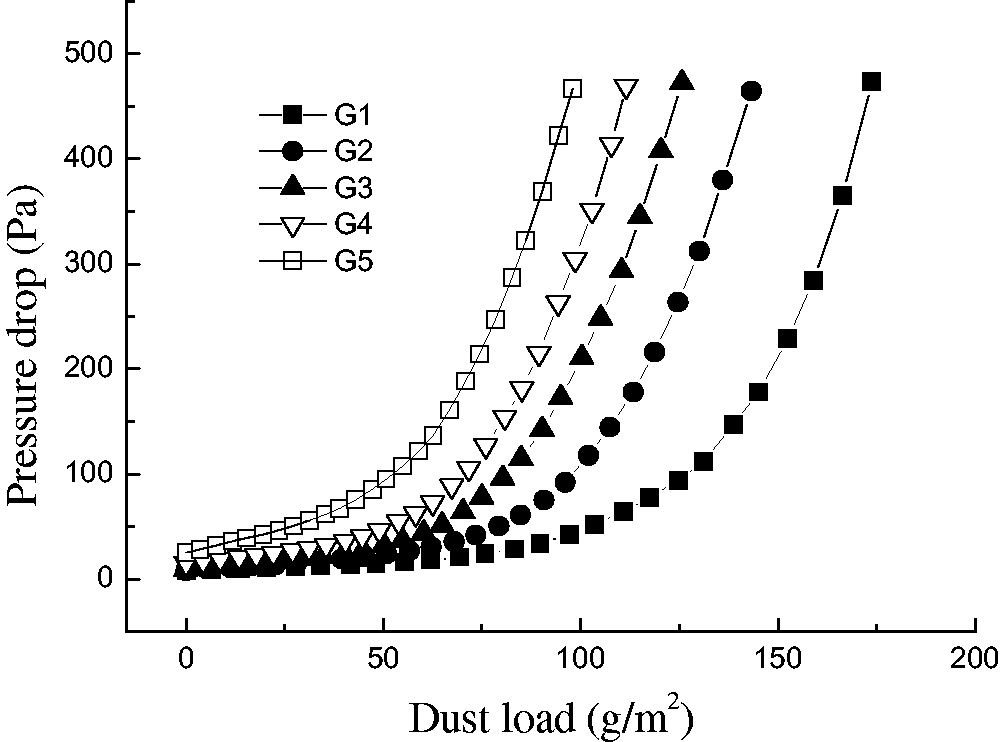
Pressure drop against dust load for variety glass fiber felt.
The pressure drops were measured throughout different dust loading, and the filter samples at different dust loading were imaged. The pressure drop profiles of sample G3 at different dust loading is shown in Figure 10(a) with the representative sample images shown in Figure 10(b). Based on different increase rate of pressure drop, the pressure drop profile showed 3 regions, slow increase region, transition region and cake filtration. At the beginning of dust loading, the pressure drop increases slowly. In this region, the particle deposition occurs inside the filter media, where majority of the pore are present. The image taken at 50 Pa pressure drop showed a visible clear filter surface. In the transition, the filtration transits form depth filtration to surface filtration, resulting in a higher rate of pressure drop increase and the filter surface starting covered by dusts. At final region, the filtration occurs on the surface of filter, which is typically called caking effect. When the cake forms, pressure drop is mainly related to the porosity of the cake layer, resulting in the similar sharp increase rate of pressure drop for all samples at the final region [33].

(a) Three region of filter medium; (b) the picture of glass fiber felt at different stage.
To better understanding the pressure drop characteristic for glass fiber felt, we used a polyethylene filter, which has the same filtration efficiency as our glass fiber felt sample G3. The filter material of polyethylene has web weight of 120 g/m2 and thickness of 5.2 mm, with average fiber diameter of 1.4 μm. The pressure drops at different dust loading for both polyethylene filter and glass fiber sample G3 are shown in Figure 11. At majority of filtration stage (dust landing), glass fiber felt showed much lower pressure drop except in the final caking region close to 450 Pa limit, indicating that glass fiber felt should have better operation handling in term of pressure build-up during its service life, which is beneficial to energy and operation cost. Notably, such comparison is circumscribed and the statement is based on the limit at 450 Pa.

Pressure drop against dust load of polyethylene filter and sample G3.
Filter service life cost
Quality factor has been often used to compare different filter materials with different filtration efficiency and different initial pressure drop
Where Q
f
is the quality factor; ΔP is the pressure drop of air filter; EF is the filtration efficiency of air filter. In actual applications, the energy cost during the operation life of the filter product is the most important. According to the model build by Montgomery [10], the energy cost of an air filter throughout the operation life can then be determined by the following integral
Where Wave is the average power; E is the filter’s energy consumption up to the time of air filter replacement; t is the filter’s operating time, η is the efficiency of the air exchange system used for filtration; Q is the air flow rate; and Pave is the average pressure. The average pressure drop for filter during the filter’s operating time is calculated as follows
Where P is the instantaneous pressure drop. The operation time of air filter can be related to dust load. For constant volume systems, operating time can be calculated as follows
Where m is the dust load of filter at replacement pressure; Ef is the total separation efficiency of filter; Cp is the particulate concentration in the air stream. Based on equation (14) to equation (16), the equation of energy cost can be derived
According to equation (17), we can use the average pressure drop (Pave), total separation efficiency (Ef) and the dust load (m) to predict the energy consumption during operation. However, when comparing different products, filtration efficiency needs to be considered. Therefore, combining energy cost (equation (18)) and quality factor (equation (13)), a new quality factor, Qc, can be derived as comprehensive energy efficiency ratio, and can be used to compare different filtration products with consideration of different filtration efficiency along with energy cost.
In calculation of the quality factors, the reference settings are taken according to EN779-2002: the efficiency of the air exchange system is assumed to be 80 percent, and the particulate concentration (Cp) is assumed to be 70 mg/m3. Using the pressure drop profile of glass fiber felt samples as shown in Figure 9 with service life defined as reaching to 450 Pa, the quality factors of various filters are calculated by equation (18) and shown in Table 5.
The quality factor of total cost for tested samples.

Table 5 shows that the dust holding capacity m and the quality factor Qc of samples, which can be used to predict the performance of filter media and to select the air filter by different applications. The pressure drop equation shown in Table 5 is fitted by the pressure drop profile in the dust loading, indicating that changes of pressure drop and energy cost happened simultaneously during dust loading. Based on the EN779-2002 standard, the quality factor of the glass fiber felts is calculated for particle size at 0.4 μm. The quality factor can be used to evaluate the filtration materials with different filtration efficiency and different pressure drop during the dust loading. In our study, dust holding capacity of the glass fiber felts was selected as the main criteria on service life, since it is directly related to the service life of the filter media and the frequency of replacing the air filter. Figure 12 shows our evaluation of the filter materials through comprehensive comparison of quality factors and dust holding capacity. Sample G1 is a representative filter material of high dust holding capacity and low filtration efficiency. Such filtering material is suitable for applications that need longer service life and lower energy cost requirements. Sample G5 represents the product with low dust holding capacity and high filtration efficiency, which provides the best filtration effect and is suitable for applications requiring high air quality cleanliness. Sample G3 reachs a balance in terms of dust holding capacity and quality factors, which may be the most comprehensive filtering material. In terms of the performance of the sample G3, it corresponds to the grade F7 air filter in EN779-2002 standard, which is also the filter product with the largest share in the market.

Comparison of quality factors and dust holding capacity for glass fiber felts.
Conclusions
In this paper, comprehensive characterization of glass fiber felt has been conducted on the morphology of the material, including fiber diameter distribution and microstructure. The filtration efficiency and dust holding capacity of glass fiber felt were measured. The fiber diameter and its distribution have direct impact to filtration efficiency and dust holding capacity. For glass fiber felt, due to the presence of both fine and coarse fibers, it has high porosity, which results in low initial pressure drop, while the presence of fine fiber provides good filtration efficiency. The multiple micro-layer structure of glass fiber felt contributes to the high dust holding capacity and prolongs the depth filtration process before it finally becomes surface filtration. The averaged pressure drop throughout the filtration service life is much lower comparing to other type of filter materials. Through the calculation of energy consumption and quality factors, the service cost of the filter material can be predicted. The quality factor can be used to evaluate different filtration materials for selection of air filtration system.
Footnotes
Declaration of conflicting interests
The author(s) declared no potential conflicts of interest with respect to the research, authorship, and/or publication of this article.
Funding
The author(s) received no financial support for the research, authorship, and/or publication of this article.