
Abstract
Ultra-fine glass fiber felt (fiber diameter ⩽3 μm) is prepared by the flame blowing process with superior thermal insulation and sound insulation. It is widely used in construction and aerospace by improving its uniformity and fiber diameter to further enhance its thermal and acoustic insulation properties. In this article, the purpose is further to create a smart manufacturing system using artificial neural network to provide analysis, judgment, and optimization for the manufacture of aerospace-grade ultra-fine glass fiber felt. When there were 11 neurons in the hidden layer, both the relative error Z values of the uniformity and the fiber diameter were the smallest, which were 0.0382 and 0.0073, respectively. So the structure 3−[11]1–2 with the back-propagation training algorithm was the most adaptive model, which was proved by comparing the mean relative error. In addition, after comparison with the measured data, the predicted and measured values are very similar and the error between them is small, so this structure has been confirmed to have a high accuracy. Finally, three-dimensional planes for the predicted uniformity and fiber diameter as a function of each process parameters are established. The predictive quality was pretty satisfactory, which can be applied to predict new data in the same knowledge domain.
Keywords
Introduction
Glass fibers are thermal insulation materials. Currently, glass fibers can be divided into nanometer glass fiber (diameter d <0.6 μm), micro-thin glass fiber (d = 0.6–1.0 μm), ultra-fine glass fiber (d = 1.0–4.0 μm), thin glass fiber (d = 4.0–12.0 μm), thick glass fiber (d = 12.0–15.0 μm), and coarse glass fiber (d ⩾25.0 μm).1,2 At present, there are four main preparation techniques of glass fiber felt: centrifugal injection technology, flame blowing technology, airlaid technology, and wet felting technology. Centrifugal injection technology and flame blowing technology are mainly used to produce glass fiber cotton and glass fiber products. 3 Although the production by flame blowing technology is very limited (a few kilograms per hour), they are still receiving more and more attention because of their ease of production of glass fibers with a diameter less than 4.0 μm, which are not achievable by other production methods.
Glass fiber felt is prepared by flame spraying after melting silicate or broken glass raw materials at high temperature. It has excellent characteristics, such as small bulk density, high temperature resistance, incombustible, and good chemical stability. Because of its excellent sound insulation properties and thermal insulation properties, it is increasingly used in transportation, building environmental protection, petrochemical, electrical and electronic, aerospace, and other fields. 4 Generally, uniformity affects the mechanical behavior of fibrous materials, such as tensile strength and hydrophobicity properties, and fiber diameter affects the acoustical behavior. 5 The finer the fiber diameter, the higher the sound absorption coefficient of the material and the better the sound insulation performance of the material.6,7
In order to acquire better performance of fibrous materials, for the past decades, there are a lot of research works about the uniformity of fibrous materials. Bajcar et al. 8 discovered that the formation of the primary layer of mineral wool was influenced by the aerodynamic characteristics of the “blow-away” airflow, the secondary surrounding airflow, and the velocity fluctuation. Yang et al. 9 studied the microstructural forming mechanism and physical properties to compare the uniformity changes under different processes by using the Venturi tube to transform the fibers. In addition, a method that enabled on-line monitoring and control was presented by Hočevar et al. 10 This experimental method was based on image acquisition and processing of the mineral wool primary layer structure.
In the past years, artificial neural networks (ANNs) with a back-propagation (BP) algorithm have already been applied to the prediction of material uniformity. The BP neural networks are effective methods for solving some complicated problems. Compared with conventional regression analysis, the advantage of ANNs is that they do not involve complex formulas. ANNs have been applied to facilitate material research, which may immensely reduce experimental work in the process and design of materials.11–14 The most important property of ANNs in engineering problems is their capability of learning directly from examples. The other is their relatively correct response to incomplete tasks, their extraction of information from noisy or poor data, and their production of generalizing results from the novel cases.
Malik et al. 15 have predicted the uniformity and tensile properties of blended yarn using ANNs. They came to the conclusion that the coefficients of determination of ANNs and regression models indicate that there is a strong correlation between the measured and predicted yarn characteristics with an acceptable mean absolute error value. Jiang et al. 16 used ANN to predict the mechanical and wear properties of short fiber–reinforced polyamide composites as a function of short fiber content and testing conditions. Julius Pfrommer et al. 17 used deep ANN as surrogate models to optimize manufacturing process parameters. The approach is shown to reduce the number of resource-intensive finite element (FE) simulations required to find optimized parameter configurations.
As stated earlier, most researchers rarely enhance the basic properties of fibrous materials by improving their process parameters. In this article, a BP neural work was developed. The training and test of the neural network require a database containing various process parameters, that is, airflow, primary filament, and suction airflow content. Afterward, the well-trained neural network was employed to predict the uniformity and fiber diameter according to new input data. Besides, the result of the prediction was assessed too. It turned out that the results of the neural network–based uniformity and fiber diameter prediction looked very viable. It could be used to adjust the process parameter and analyze the properties of ultra-fine glass fiber felt in this study.
Experiment
Materials and fabrication
The ultra-fine glass fiber felt was produced by the flame blowing process. Figure 1 presents the flame blowing process. In the preparation process, the molten mineral material in a furnace was drawn into primary filaments of diameter 150–250 μm by means of drawing rollers through a die. These primary filaments were immediately exposed to a hot-air current jetted from a nozzle which caused them to melt, then transported through the horizontal guide tube to the fiber collection chamber, and a binder applied to form the primary felt. Finally, glass fibers with phenolic resin adhesive were sent into a curing furnace where glass fiber felt was formed. In this process, we mainly control the final molding quality of the ultra-fine glass fiber felt by adjusting the process parameters, which includes airflow content, primary fiber diameter, and suction airflow pressure.
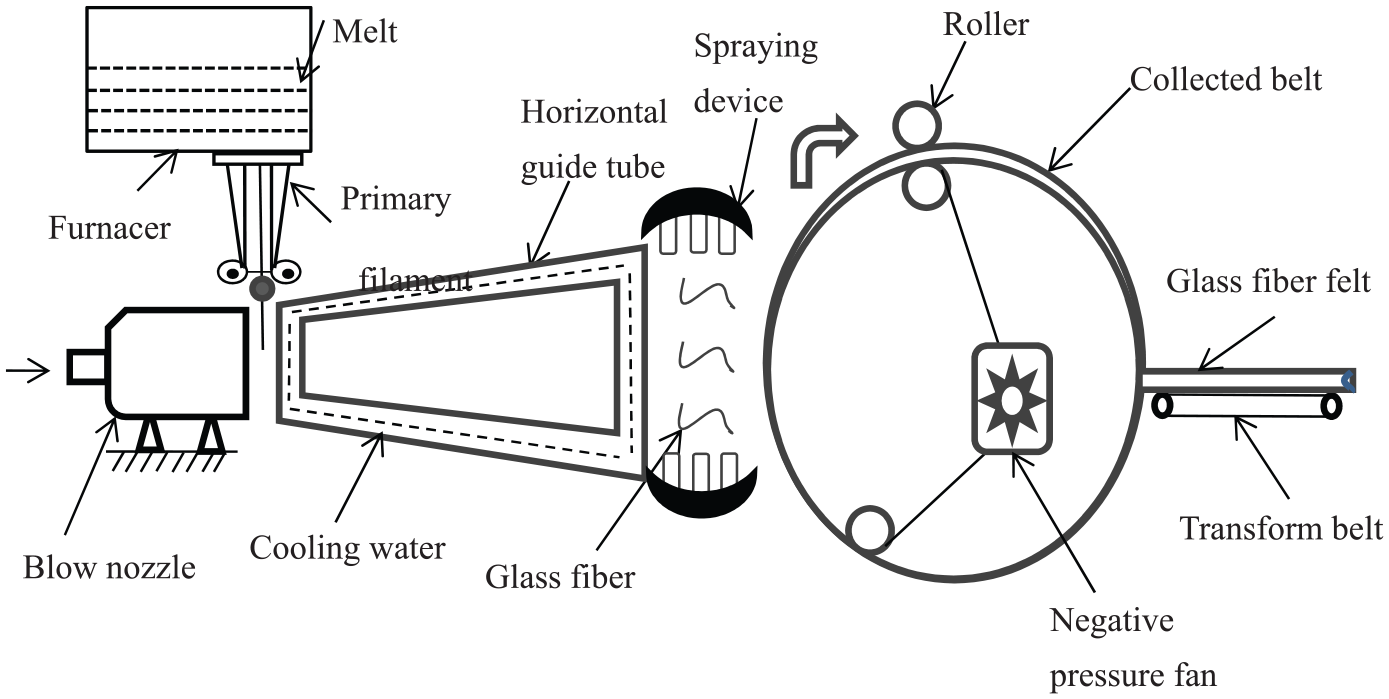
Flame blowing process.
Finally, the range of parameters of light glass fiber felt we obtained (density, thickness, resin content, and fiber diameter) was 8–10 kg/m3, 14–25 mm, 17.5%, and 1.4–2.8 μm, respectively.
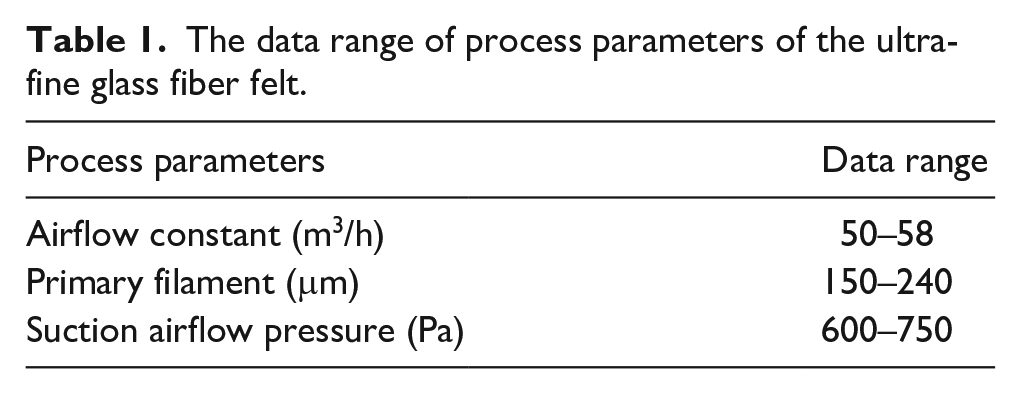
The data range of process parameters of the ultra-fine glass fiber felt is given in Table 1. The airflow content here referred to flux of the natural gas. There were mainly two airflow parameters in the flame blowing equipment. One was natural gas flow and the other was gas flow. Combined with the actual production process, the gas flow was set to a constant value of 420 m3/h. Suction airflow was achieved by negative pressure fan, which helped collecting fibers on the accumulation belt, where they formed the primary layer. A pressure gauge was installed in the suction channel to regulate suction fan speed so that the pressure inside the channel remained constant during particular operating points. Suction airflow pressure was set in the range of 600–750 Pa. 18
The data range of process parameters of the ultra-fine glass fiber felt.
Morphology
The morphology of the light glass fiber felt and glass fibers was examined by optical microscopy (BD-200) and scanning electron microscopy (SEM; JEOL JSM-6360), respectively, and the samples of fiber for SEM imaging were deposited on Si wafers.
Characterization of uniformity
In order to quantify the uniformity of material, the ultra-fine glass fiber felt (size of 1000 × 1000 mm2) was delivered from the production line and divided into 100 pieces, with each having an equal size of 100 × 100 mm2.
Coefficient of variation (CV) was calculated by the weight of samples. CV reflects the non-uniformity rate of fiber materials, which is defined by
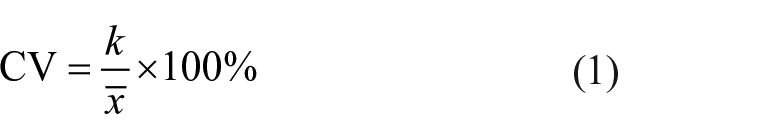
where k is expressed as

where k is the mean square error of the sample,
Establishment of model
Research on physical properties
Before constructing the ANN model, we explored the physical properties of the ultra-fine glass fiber felt to obtain data for simulation. The uniformity of ultra-fine glass fiber felt was determined by the process parameters in the whole preparation process, which included airflow, primary filament, and suction airflow pressure.
Figure 2 shows the SEM photographs of the ultra-fine glass fiber felt, which indicates that the microstructure of ultra-fine glass fiber felt is quite complicated and the glass fibers with different lengths and diameters are intertwined to form a three-dimensional network. In the preparation process, the variation of the process parameters changed the distribution, diameter, and arrangement of the fibers, which affected the physical properties of the ultra-fine glass fiber felt.

SEM of ultra-fine glass fiber felt: (a) 1000× and (b) 5000×.
Figure 3 illustrates the contour plots and weight uniformity of the ultra-fine glass fiber felt (comparison of uniformity with airflow constant was 50 and 56 m3/h, respectively) when the primary filament was 210 μm and the suction airflow pressure was 700 Pa.

The distribution of glass fibers: (a) 50 m3/h and (b) 56 m3/h.
The CV of the ultra-fine glass fiber felt (at 50 and 56 m3/h airflow) was 11.14% and 6.57%, respectively. It was found that a change in the process parameters had changed the uniformity of the ultra-fine glass fiber felt, and so does the fiber diameter of felt.
Figure 4 shows the distribution of the final fiber diameters under different airflow contents. It could be seen that the change in airflow resulted in a different size distribution of the final fiber diameter. Therefore, in order to better predict and optimize the process parameters of the ultra-fine glass fiber felt and reduce the number of tests, we need to use ANNs to predict the properties of the ultra-fine glass fiber felt.

The distribution of the final fiber diameter.
The ANN model
We used the neural network module of MATLAB to build a BP neural network. Figure 5 shows the configuration of a BP neural network developed in this article, which is composed of input layer, hidden layer, and output layer. There are three neurons in the input layer, namely, airflow, primary filament, and suction airflow pressure, and the uniformity and final fiber diameter are regarded as output parameters. Since the number of input parameters and output parameters is not too many in this network, one hidden layer is enough.

The schematic illustration of an artificial neural network.
We regarded the output parameters of the hidden layer as input parameters of output layer, which is modulated by transfer function and weight. This process can be expressed by the following equation

where ϕ(x) means a transfer function; Ti and xj refer to the output of node i in the present layer and node j in the last layer, respectively; wij represents the weight from node j in the last layer to node i in the present layer; and yi refers to the bias of node i in the present layer. In this study, a tan-sigmoid transfer function was applied between the input and hidden layer, and a linear transfer function was employed between the hidden and output layer, which can prevent the output from being restricted to a small range.
After a vector was provided to the input layer as initial data, units in the hidden layer compute a weighted sum of the input and output the results according to a transfer function and bias. Units in the output layer repeat the process and the predicted values are obtained. The weights and biases in each node will be optimized continually to minimize the errors between the predicted and desired values automatically. As a type of algorithm for BP neural network with high accuracy, the Bayesian regularization algorithm was chosen in the present study to model the performance of the ultra-fine glass fiber felt.
Determine the network structure
The training sample data of the ANNs were taken from the data obtained in this experimental test, and Table 1 offers the data range of the process parameters of the ultra-fine glass fiber felt. After testing the constructed ANNs, the experimental data obtained from the experiment are compared with the simulated data to calculate the accuracy of the neural network. In this article, we selected 70% of the total sample as the training data, and 30% of data were applied to assess the well-trained network.
Generally, the more the neurons, the closer the output value is to the target value and the longer it takes. Conversely, the fewer the neurons, the greater the difference between the output value and the target value, but it takes less time. Because more neurons would make the algorithm more complex, we should try slowly to find a suitable intermediate point. 19 The optimal number of neurons in the hidden layer can be found using the following formula

where n is the number of neurons in the hidden layer; p and q refer to the number of input and output parameters, respectively; and A is a constant between 0 and 10.
In ANNs, since the results calculated by the same model were slightly different every time, the process of training and testing was repeated many times. The mean relative error Z was defined to evaluate the accuracy of the ANN model, which can be expressed as

where K stands for the number of training and testing, and L stands for the total number of test data. Oi and Si refer to the ith predicted and measured values, respectively. Obviously, an ANN model with better prediction ability appears as a lower value of Z. Once Z ⩽0.1 of test dataset, the model could be regarded as acceptable with high quality. 13
In order to find the best number of neurons in the hidden layer, the mean relative error Z of the ANN model with different number of neurons were calculated, which could be seen in Figure 6. Obviously, when there were 11 neurons in the hidden layer, both the Z values of the CV and the fiber diameter were the smallest, which were 0.0382 and 0.0073, respectively. It meant that the ANN structure with 11 neurons in the hidden layer has the highest prediction accuracy.
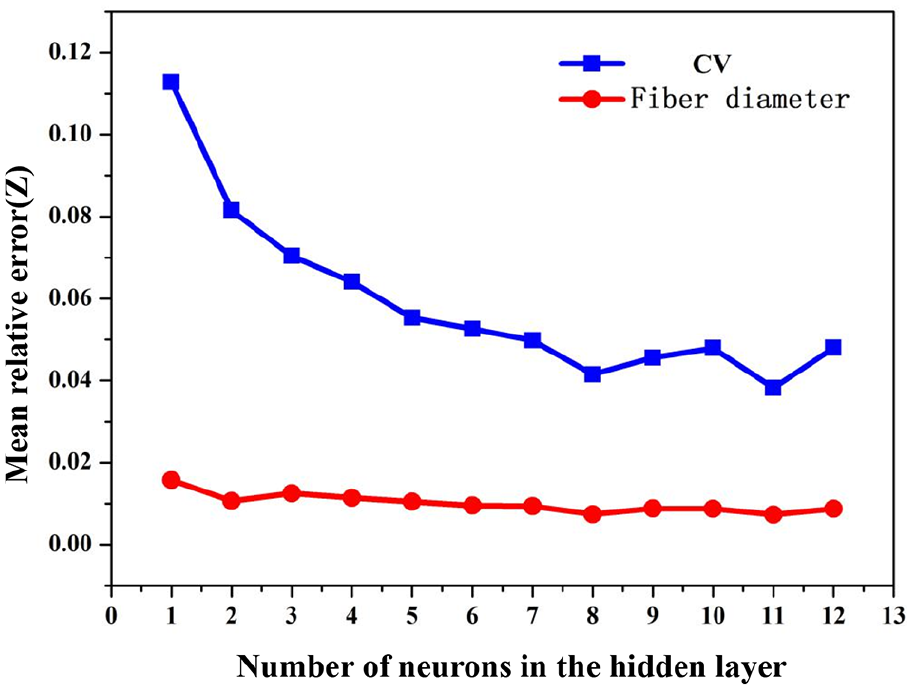
The mean relative error of the ANN model with different numbers of neurons in the hidden layer.
Results and discussion
Verification of the ANN model
Figure 7 shows a comparison of the predicted and measured values of the CV and fiber diameters of the two output parameters. The result is that 80 sets of data are randomly selected from the database to reflect the accuracy of the ANN model. It can be seen that the predicted and measured values are very similar and the error between them is small. This also shows that the prediction error of the whole ANN model is small and has high prediction accuracy. The ANN model has excellent prediction ability and can be used to optimize the process parameters of the ultra-fine glass fiber felt preparation.

A comparison of the predicted and measured values of performance: (a) CV and (b) fiber diameter.
Prediction results of the ANN model
Performance prediction of the ultra-fine glass fiber felt under airflow and suction airflow pressure
After the structure of the ANN was fully confirmed and trained, it could be used to predict the same performance domain to obtain new results, and further improved the preparation process by completing the prediction function of the ANN. Figure 8 shows the prediction of the uniformity (CV) and final fiber diameter of the ultra-fine glass fiber felt as a function of the airflow and suction airflow pressure when the primary fiber diameter was 210 μm.
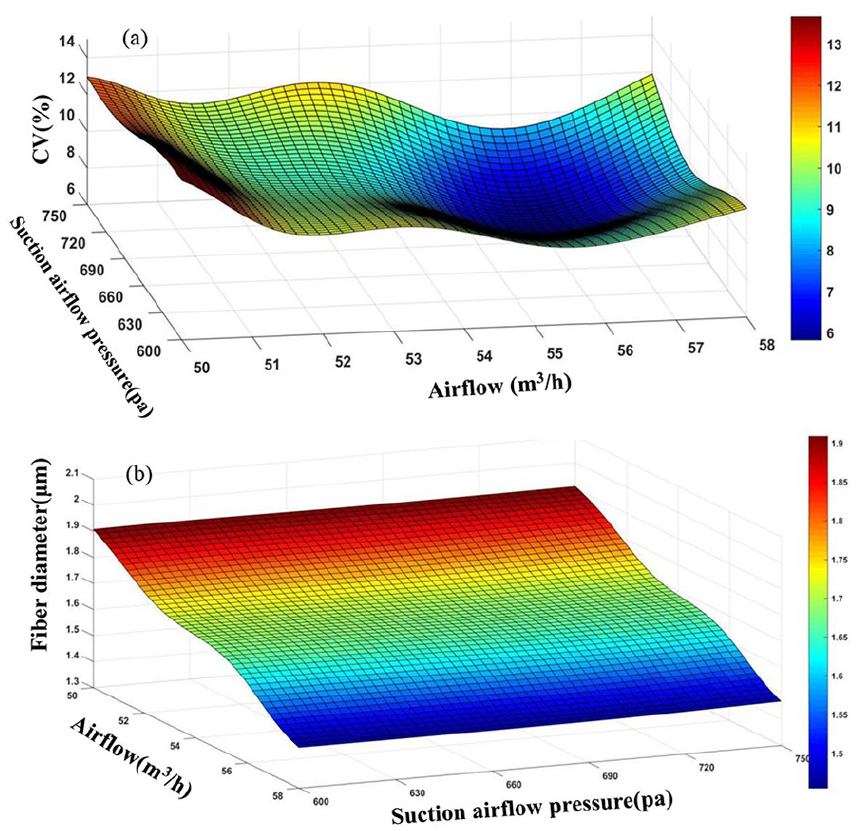
Predicted results of performance when the primary filament is 210 μm: (a) CV predicted results and (b) fiber diameter predicted results.
The prediction results of the values of uniformity as a function of airflow and suction airflow pressure were displayed of the ultra-fine glass fiber felt when the primary filament was 210 μm, as shown in Figure 8(a). It showed the uniformity predicted results—that the optimum uniformity of the ultra-fine glass fiber felt was acquired in the airflow constant of 55–57 m3/h and the suction airflow pressure was in the interval of 680–720 Pa. Figure 8(b) shows the fiber diameter predicted results—as the constant of the airflow increased, the final fiber diameter tended to decrease, and the suction airflow had little effect on the final fiber diameter of the ultra-fine glass fiber felt. This result was basically consistent with the data obtained from the experimental test.
Performance prediction of the ultra-fine glass fiber felt under airflow and primary filament
Figure 9 shows the prediction of the uniformity (CV) and final fiber diameter of the ultra-fine glass fiber felt as a function of the airflow and primary filament when the suction airflow pressure is 700 Pa.
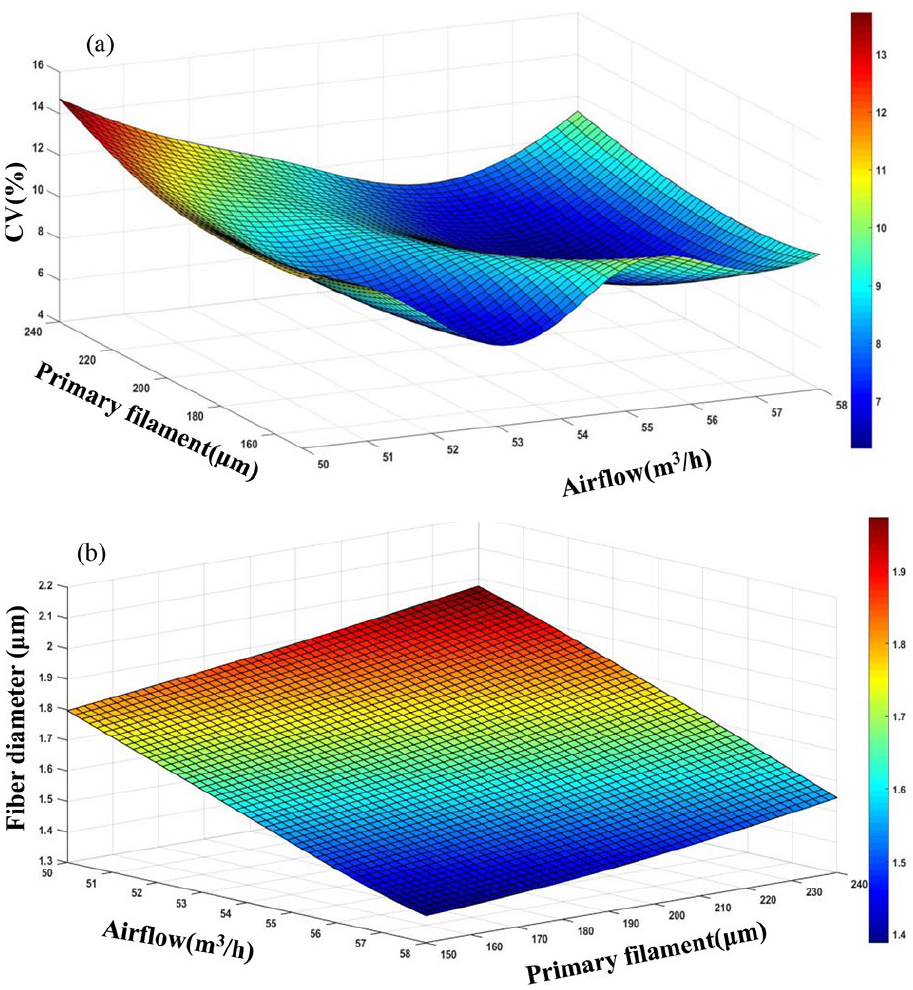
Predicted results of performance when the suction airflow pressure is 700 Pa: (a) CV predicted results and (b) fiber diameter predicted results.
Figure 9(a) shows the uniformity predicted results. The CV value representing the uniformity of the ultra-fine glass fiber felt had two lowest areas here, one of which is the airflow content was 53–54 m3/h and the primary filament was in the interval of 160–170 μm, and the other is the airflow content was 55–57 m3/h and the primary filament was within the interval of 190–220 μm. Figure 9(b) shows the fiber diameter predicted results—as the constant of the airflow increased, the final fiber diameter tended to decrease, and the relationship between the fiber diameter and the airflow was approximately linear. The fiber diameter was mainly increased with the primary fiber diameter.
Performance prediction of ultra-fine glass fiber felt under suction airflow pressure and primary filament
Figure 10 shows the prediction of the uniformity (CV) and final fiber diameter of the ultra-fine glass fiber felt as a function of the airflow and primary fiber diameter when the airflow is 56 m3/h.

Predicted results of performance when the airflow is 56 m3/h: (a) CV predicted results and (b) fiber diameter predicted results.
When the airflow was 56 m3/h, the uniformity of the ultra-fine glass fiber felt decreased as the primary filament increased, and it decreased as the suction airflow pressure increased. When the suction airflow pressure was about 700 Pa, CV reached the lowest point and then continued to increase, as shown in Figure 10(a). Figure 10(b) shows the fiber diameter predicted results—the suction airflow had basically no effect on the final fiber diameter of the ultra-fine glass fiber felt, and the relationship between the fiber diameter and the airflow was approximately linearly increasing. This result was basically consistent with the data obtained from the experimental test.
Application and discussion of prediction results
All the results showed that using ANNs to optimize process parameters is a feasible approach. We used the ANNs to predict the effects of different airflow, primary filament, and suction airflow pressure on uniformity and fiber diameter of the ultra-fine glass fiber felt. The final predicted value could directly reflect the corresponding relationship between process parameters and performance. By using this kind of correspondence, we could easily obtain the desired result by directly adjusting the process parameters, rather than obtaining it through a large number of experiments. At the same time, we also optimized the process parameters of the ultra-fine glass fiber felt by ANNs and obtained the ideal range for obtaining the best uniformity and fiber diameter.
In engineering applications, the ultra-fine glass fiber felt should have different properties in different application fields to suit their application environment. Table 2 shows the performance requirements for the ultra-fine glass fiber felt in different fields.
The performance requirements for the ultra-fine glass fiber felt in different fields.

CV: coefficient of variation.
When we have a higher requirement for the uniformity of the felt, the ultra-fine glass fiber felt should have a more uniform structure. At this time, we needed to give priority to the influence of process parameters on uniformity. Therefore, we were able to use the prediction results of ANNs to select the process parameters of the lower CV.
All in all, the ANN model could be used to predict sample performance based on big data. When the experiment has sufficient experimental data to support it, we can train the ANN model through the data to predict product performance or feedback-related process parameters. Therefore, ANNs can be used to predict a larger range of nanofiber felts and same knowledge domain instead of repeating long-term experiments to a certain extent.
Conclusion
In this article, in order to optimize and improve the process parameters of aerospace-grade ultra-fine glass fiber felt, we have introduced an intelligent manufacturing method, which is intelligent manufacturing system built using ANNs combined with practical experimental methods. During the practical experiment, we studied the physical properties of the ultra-fine glass fiber felt and found that the airflow, primary filament, and suction airflow pressure are the main factors affecting the uniformity and fiber diameter of the ultra-fine glass fiber felt. A slight change in each process parameter would have a huge impact on the physical properties of the ultra-fine glass fiber felt. Therefore, an ANN model is constructed to estimate the uniformity and fiber diameter of the felt.
By comparing the measured values and predicted values calculated by ANNs, we find that the relative error is small and the prediction accuracy is satisfactory. The influence of each parameter on the uniformity and fiber diameter can be seen intuitively from the three-dimensional diagrams, which is based on the ANN model. So we can reasonably derive the ratio of the parameters to reach the expected result by the three-dimensional diagrams. Through the ANN model of this article, we can predict the preparation process parameters of the ultra-fine glass fiber felt with good uniformity and suitable fiber diameter. It means a considerable saving in cost and time when it is applied in the engineering applications. The value range of input parameters covers the actual production situation basically, so the ANN model in this article is very useful in the manufacture of aerospace-grade ultra-fine glass fiber felt.
Footnotes
Declaration of conflicting interests
The author(s) declared no potential conflicts of interest with respect to the research, authorship, and/or publication of this article.
Funding
The author(s) received no financial support for the research, authorship, and/or publication of this article.