
Abstract
Vertically laid nonwoven fabrics are structurally different from conventional cross-laid nonwoven fabrics, resulting in an exceptional bulkiness and unique compressional recovery performance. In this paper, two testing methods (manual procedure vs. machine procedure) to determine bulky nonwoven thickness were first studied and statistically analyzed. Then, pore sizes of selected nonwoven samples were measured by a porosimeter to examine relationship between the pore size and nonwoven structural parameters. Finally, compressive properties of the nonwoven samples were measured by an Instron tester for assessment of main effects of nonwoven structural parameters in terms of thickness, gram weight, bulk density, and porosity on nonwoven compressional properties. The results showed that there was no significant difference between the two thickness measurement methods, and the manual measurement was basically consistent with the machine measurement. Bubble point pore size and average flow pore size were correlated with the structure parameters in varied correlation coefficients. Compared to cross-laid nonwovens, vertically laid nonwovens exhibited a greater compressive energy and linearity and a lower compressive resilience.
Keywords
Introduction
Highloft nonwovens are a kind of fiber composite with low density and high thickness. These fabrics have a wide range of applications in daily necessities and industrial products due to their good porosity and compression resilience. In fact, highloft nonwoven fabrics can be formed in two ways, namely traditional cross-laid nonwovens and vertically laid nonwovens. The structure and mechanical properties of these two kinds of nonwovens are different due to the different laying methods of fiber web.
As a novel highloft nonwoven product, vertically laid nonwoven is formed by vibrating vertical webs, called the Struto technology. Another rotated vertically laying process known as Wave Maker technology can also form vertically laid nonwovens [1,2]. Different from the horizontally laid fibers in traditional cross-laid nonwovens, both of these vertically laid nonwovens have a highloft nonwoven structure where all the fibers are orientated in the vertical plane (Figure 1); this gives excellent compression recovery, softness, and very good sound absorption performance [3–5].

Highloft nonwoven cross section images: (a) vertically laid nonwoven and (b) cross-laid nonwoven.
Early studies mainly focused on the effects of fiber types and fiber properties on the compression and resilience properties of highloft nonwovens. Varma and Meredith reported that man-made fiber type has little effect on the compression recovery of fiber masses, similar to the influence of fiber friction and fineness, whereas fiber crimp has a significant influence on resilience [6]. Kothari and Das found that the properties of continuous fibers, fabric porosity, and bonding mode have an effect on the compression properties and energy loss rate of nonwoven fabrics. It showed that adhesive-bonded nonwoven fabrics had a higher compressibility than needle-punched nonwoven fabrics, and staple needle-punched nonwovens had a higher energy loss percentage than continuous filament fabrics [7]. Parikh et al. studied the compressional resistance and recovery properties of perpendicular-laid highlofts made with cotton–polyester (PES) blended fibers, and found that low cotton-content highlofts had a similar compression resilience to pure synthetic fiber nonwovens, and the increase of cotton blending ratio would reduce the compressive rigidity and elasticity of nonwoven fabrics [5,8].
In addition, some models were developed to simulate the compression process of nonwovens and influencing factors were analyzed. Schoppee developed a Poisson model of fiber mass to predict the relationship between packing uniformity and fiber web weight, fiber diameter, and fiber transverse compression modulus [9]. The nonwoven compression properties were tested and compared with the simulated results. By establishing a fiber assembly model, Beil and Roberts reached the same conclusion as Verma’s conclusion that fiber crimp has a great influence on the compression properties of fiber assemblies, except that they drew this conclusion from the perspective of energy absorption [10,11].
Furthermore, the compressive properties of nonwovens were also compared with different processing methods and with other types of structural materials. Kang et al. studied the compressive fatigue properties of perpendicular-laid nonwovens produced by two different processing methods. The results showed that air folded nonwovens had higher initial compression energy than mechanically folded ones [12,13]. Njeugnaa et al. compared the compression characteristics of a 3D fiber structure and polyurethane (PU) foam [14]. It is considered that the 3D fiber structure made of a vertically lapping nonwoven fabric and traditional nonwoven laminate was better than the foam material and consumed more energy. Yang et al. compared the compression performance of vibrating perpendicular-laid nonwovens with that of rotating nonwovens, and found that the former had better compression performance. At the same time, it was found that fabric density directly affected the compressive resistance of the fabric, and a higher fiber initial angle was more conducive to improving the compressive properties of nonwovens [15].
The recent research progress has reported systematical studies on the compression properties of vertically laid nonwovens from the aspects of raw materials and vertically laid nonwoven fabrics and traditional cross-laid nonwoven fabrics would be helpful. This paper compares and analyses the difference of compressional recovery between vertically laid nonwovens and traditional cross-laid nonwovens based on the influence of several factors, such as fabric thickness, fabric weight, and volume weight. At the same time, in view of the problem that determination of thickness of highloft nonwovens is greatly affected by testing methods and applied compressive stress during testing, both a direct and indirect testing method are used in this comparative study, so that a difference between the two methods can be analyzed.
Experimental materials and methods
Materials
Four vertically laid nonwoven fabrics (denoted as V1, V2, V3, and V4) and four cross-laid nonwoven fabrics (denoted as T1, T2, T3, and T4) are used. These samples are produced by the same manufacturer but no detailed information is given. It is, therefore, assumed that the samples V1–V4 and T1–T4 use the same vertical-laid processing and cross-laid processing respectively for nonwoven formation. The T1–T4 nonwovens are conventional needle-punching nonwovens. In these samples, the T1–T2 set is made of cotton and T3–T4 set is made of 70% polypropylene (PP) fiber and 30% co-polyester (CO-PES) fiber. Each set has the same structure and raw material composition, but different fabric thickness and weight. The samples V1–V4 are all cotton/Polyethylene (PE) blended nonwovens. For V1 and V2, their blend ratios are unknown and their weight and thickness are different. The cotton/PE blend ratio for V3 and V4 is 40/60 and 20/80 individually. These two samples are formed with almost the same thickness. However, V3 possesses a significantly higher weight than V4, obviously because of the increased amount of cotton blended. The characteristics of the nonwoven specimens are listed in Table 1. The sample thickness and bulk density in Table 1 are average values from the indirect and indirect measurement methods.
Characteristics of nonwoven specimens.

Test methods
Measurement of fabric thickness
The fabric thickness is measured using two methods: direct measurement using manual measurements (denoted as Method A) and indirect measurement by an Instron Test Machine (denoted as Method B). Both measurements are performed on each set of four circular specimens with a diameter of 100 mm. Method B tests five different positions for each sample.
In method A, the thickness of the sample (L, as shown in Figure 2) was obtained by measuring the vertical distance from a plane parallel to the upper surface of the sample to the lower surface. The base plate used in this method is a square aluminum plate with a side length of 5 in. and a flat surface. Weight and thickness of this plastic plate are extremely small and negligible. A sample left at room temperature for 24 h without pressure is placed on the base and a plastic plate of the same size as the base is placed on top of the sample. The total thickness of base plate and sample and the thickness of base plate are measured respectively by vernier caliper, and the sample thickness is calculated.

Schematic diagram of direct measurement of thickness.
In Method B, a compression test device was used, which consisted of a pallet with a size larger than the sample size and a pressure plate that was a circular indenter having a diameter of 38.1 mm (1.5 in.). Referring to the compression test method, a gauge length (GL) is initially set for each set of samples, which is larger than the thickness of tested samples, so that the sample can be conveniently placed on the platform. The compression process of the sample was tested using a compression test procedure to record load and compressive extension data. After the end of the experiment, the position value was extracted at the point where the load was no longer negative, and the displacement value was subtracted from the separation distance to determine the sample thickness.
Measurement of fabric porosity
Fabric porosity was measured by an Advanced Capillary Flow Porosimeter (ACFP-1100AEXLFNBH) from Porous Materials Inc. (PMI) which can effectively evaluate the porosity of nonwoven fabrics.
There are four modes for the capillary flow porosimetry test: wet-up/dry-down, wet-up/dry-up, dry-up/wet-up, and wet-up/linear-dry. Wet and dry refer to sample states whereas up and down refer to pressure. In this test, the dry-up/wet-up mode is used, because the dry phase is run before the wet phase and it yields the best dry data. The mode is reliable.
When testing, a dry sample was first installed in the sample chamber and the measurement began after setting the parameters. The regulator opened to increase flow, pressure, and flow rate through the sample. Data points were recorded at each equilibrium point as long as the pressure and flow rates increase. When either maximum flow rate or maximum pressure was reached, the regulator reset itself to zero. Then the sample was soaked in silwick solution with surface tension of 20.1 dynes/cm after the isobaric head was lifted and the wet sample was tested to get the wet curve. When the test continued, the bubble point was taken by recording the wet curve. In each nonwoven group three samples were tested.
Measurement of compression recovery performance
Compression recovery performance of the nonwoven fabrics was measured by an Instron Test Machine 5966 system with 1 kN load cell. The diameter of the press head was 38.1 mm (1.5 in.) and the size of the lower pallet was 229 × 127 mm (9 × 5 in.) as shown in Figure 3. Compression speed was 12 mm/min. There were four samples per group and each sample was tested in five different locations. Before the test, the distance between the upper and lower plates was set to be higher than actual sample height to ensure that each sample could be placed in between freely. Each sample was pressed to a compression depth of 60% of the sample thickness.

Fabric compression performance test device.
Results and discussion
Comparison of the two methods for thickness measurement
The weight of the plastic plate used in Method A is 0.000178 g/mm2, which is negligible compared with the weight of tested samples, i.e. the weight applied on the fabric can be regarded as zero. In Method B, when the compression load is from negative to zero, the distance between the press head and platform is the thickness fabric sample, which is equivalent to the nonwoven cross-sectional height without compression force existing on the fabric sample. Therefore, the two methods are comparable in terms of fabric thickness under the same pressure conditions without any other conversion. The thickness of the samples was measured by the two methods described above, and the calculated mean value and standard deviation are shown in Table 2.
Sample average thickness tested by the two methods and analysis of variance (ANOVA).

As shown in Table 2, by analyzing the variance of the two methods, it is known that the difference between the two methods is not significant at the 95% confidence level (p > 0.05). Similarly, it can be seen from the correlation analysis plot of Figure 4 that the thickness values of the samples in each group measured by the two methods are all on the ideal linear correlation line, indicating a high correlation between the two groups. That is, the direct and indirect methods for measuring the thickness of the highloft nonwoven fabrics are not significantly different. The two testing methods are highly correlated.

Correlation analysis of test results of two methods.
It is also known from Table 2 that although there is no significant difference in sample thickness measured by the two methods, the SD value and CV value of each group of samples are different. In general, the mean square deviation of the samples calculated by Method B in the same group is slightly higher than that of Method A. A major reason for this could be caused by different numbers of test locations on the samples. In Method A, whole sample area of each sample was measured as one location. In contrast, in Method B the machine measurement was taken from five different locations on each sample. As a result, the standard deviation (SD) and coefficient of variation (CV) values obtained by Method B in the same group of samples are larger.
Although there is little difference between the two methods in terms of measurement results, the indirect method of the Instron machine measurement is more complicated and cumbersome in the actual testing process and data processing, while the direct method is relatively simple to operate. Which testing method should be selected is based upon available instruments and actual experimental situation.
Comparison of pore size and distribution
The pore size characteristics of the nonwoven fabric were tested on a PMI porosimeter using the dry-up/wet-up mode. The typical pressure and flow rate curves obtained are shown in Figure 5. The dry and wet curves in the figure were obtained by gradually increasing the pressure, while the

Dry-up/wet-up curve.
Nonwoven fabric porosity.

The correlation between the test results and fabric structure parameters is analyzed. The scatter plots are shown in Figures 6 to 8. Through the correlation analysis, the Pearson correlation coefficient between the aperture size and the structural parameters is obtained, as shown in Table 4. According to the trend analysis of linear fitting in the figures, with the increase of fabric thickness, unit weight and bulk density, the bubble point pore size of the highloft nonwovens overall increases, while the mean flow pore size decreases. The correlation coefficients in Table 4 also illustrate this trend. At the same time, Table 4 also shows that the bubble point pore size is related to the bulk density slightly higher than the fabric weight and the fabric thickness, while the mean flow pore size is opposite, which is most affected by fabric thickness.

Scatter plot of fabric average thickness and pore size.

Scatter plot of fabric weight and pore size.

Scatter plot of fabric bulk density and pore size.
Pearson correlation coefficient between pore size and structural parameters.

The bubble point pore diameter of the vertically laid nonwovens fluctuates greatly with the change of the fabric structural parameters. In contrast, for the variation of the mean flow pore diameter, the cross-laid nonwovens show a more dramatic fluctuation.
Compression recovery performance and analysis of influencing factors
A typical compression recovery curve of the tested nonwovens is shown in Figure 9. In general, this resembles to compression recovery performance of apparel fabrics that is usually characterized and evaluated by the following parameters, namely compressive linearity (LC), compressive energy (WC), compressive resilience (RC), and maximum compressive strain (EMC) [5]. Definitions to calculate these parameters are listed below.


Typical compression recovery curve of nonwovens.
LC is used to measure the elasticity of fabrics. For a fully elastic material, LC value is 1. However, LC for fabric materials should be between 0 and 1 because fabrics are nonelastic materials. WC represents the compressive toughness of fabrics. The higher the WC value, the harder the fabrics are to generate compressive deformation. RC represents the elastic recovery rate of fabrics. The larger the RC value, the better the fabric resilience. Since nonwoven fabrics are neither fully elastic nor rigid, after removal of a compressive load, the nonwovens thickness will not completely return to its initial state. Consequently, a permanent compressive deformation called compressive strain residual occurs. EMC represents the compression ratio of the tested nonwovens when they reach the maximum compression load, with an initial setting value of 60%. Due to the heterogeneity of sample thickness, there is a certain deviation between the set value and the calculated value after actual measurement.
In this study, we tried to apply these same parameters in the evaluation of the highloft nonwoven fabrics. The test results of compressive properties of the nonwovens are listed in Table 5. At the same time, the correlation between the compression properties and structural parameters of the two nonwoven fabrics is compared and analyzed. The Pearson correlation analysis results are shown in Table 6.
Compressive properties of the nonwovens.

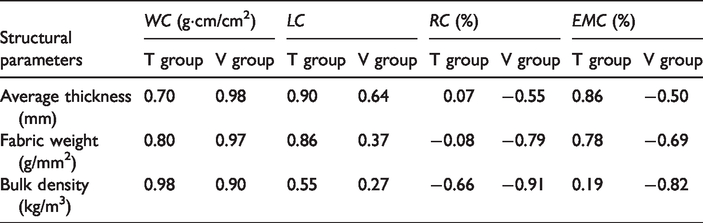
Pearson correlation coefficient between the structural parameters and compressive performance.
Influencing factors on compression energy of nonwovens
As can be seen from Figure 10, WC of the vertically laid nonwoven fabrics is significantly higher than that of cross-laid nonwoven fabrics. Among possible reasons, it is inseparable from the structure of nonwoven fabrics. The vertically laid nonwovens form a three-dimensional V-shaped support structure, which can bear large compressive energy under pressure [16], compared to the cross-laid nonwoven fabrics.

WC of Nonwoven fabrics.
According to the relationship between WC and structural parameters of nonwovens (Figure 11), the nonwoven WC increases with the increase of fabric thickness, gram weight, and bulk density. Referring to the correlation coefficient in Table 6, WC of the vertically laid nonwovens (V Group) is mainly affected by fabric thickness, followed by fabric weight and bulk density, while for the cross-laid nonwovens (T Group) WC is mainly related to bulk density, and is less affected by fabric weight and fabric thickness. In comparison between T2 and V1 and between T3 and V2 according to their similar thickness, WC of V1 and V2 is 5.9 times and 1.07 times higher than that of T2 and T3, respectively. This shows that the toughness of the vertically laid nonwovens is generally higher than that of the cross-laid nonwovens. In the meantime, from the viewpoint of fabric weight, V1 is 34% heavier than T2, while V2 is about the same weight as T3, indicating that the influence of weight on WC is greater when nonwoven thickness is similar. This phenomenon can also be seen from T3 and T4 having a similar size of thickness.
Relation between WC and fabric structure parameters.
From the above analysis, the following conclusions can be drawn: The compression energy of nonwovens is greatly influenced by the fabric structure, especially fabric weight and bulk density. When the structure parameters are similar, the compression energy of vertically laid nonwovens is higher than that of cross-laid nonwovens.
Influencing factors on compression linearity of nonwovens
It can be seen from Figure 12 that the vertically laid nonwovens have higher LC than cross-laid nonwovens, regardless of the difference in fabric thickness and weight. Since the fibers in the vertical direction have a better effect on improving the plasticity of the fabric than the fibers in the horizontal direction [17], when the highloft nonwoven fabrics are compressed, the vertically laid nonwoven fabric shows better elastic recovery, as the results shown in Figure 12.

LC of nonwoven fabrics.
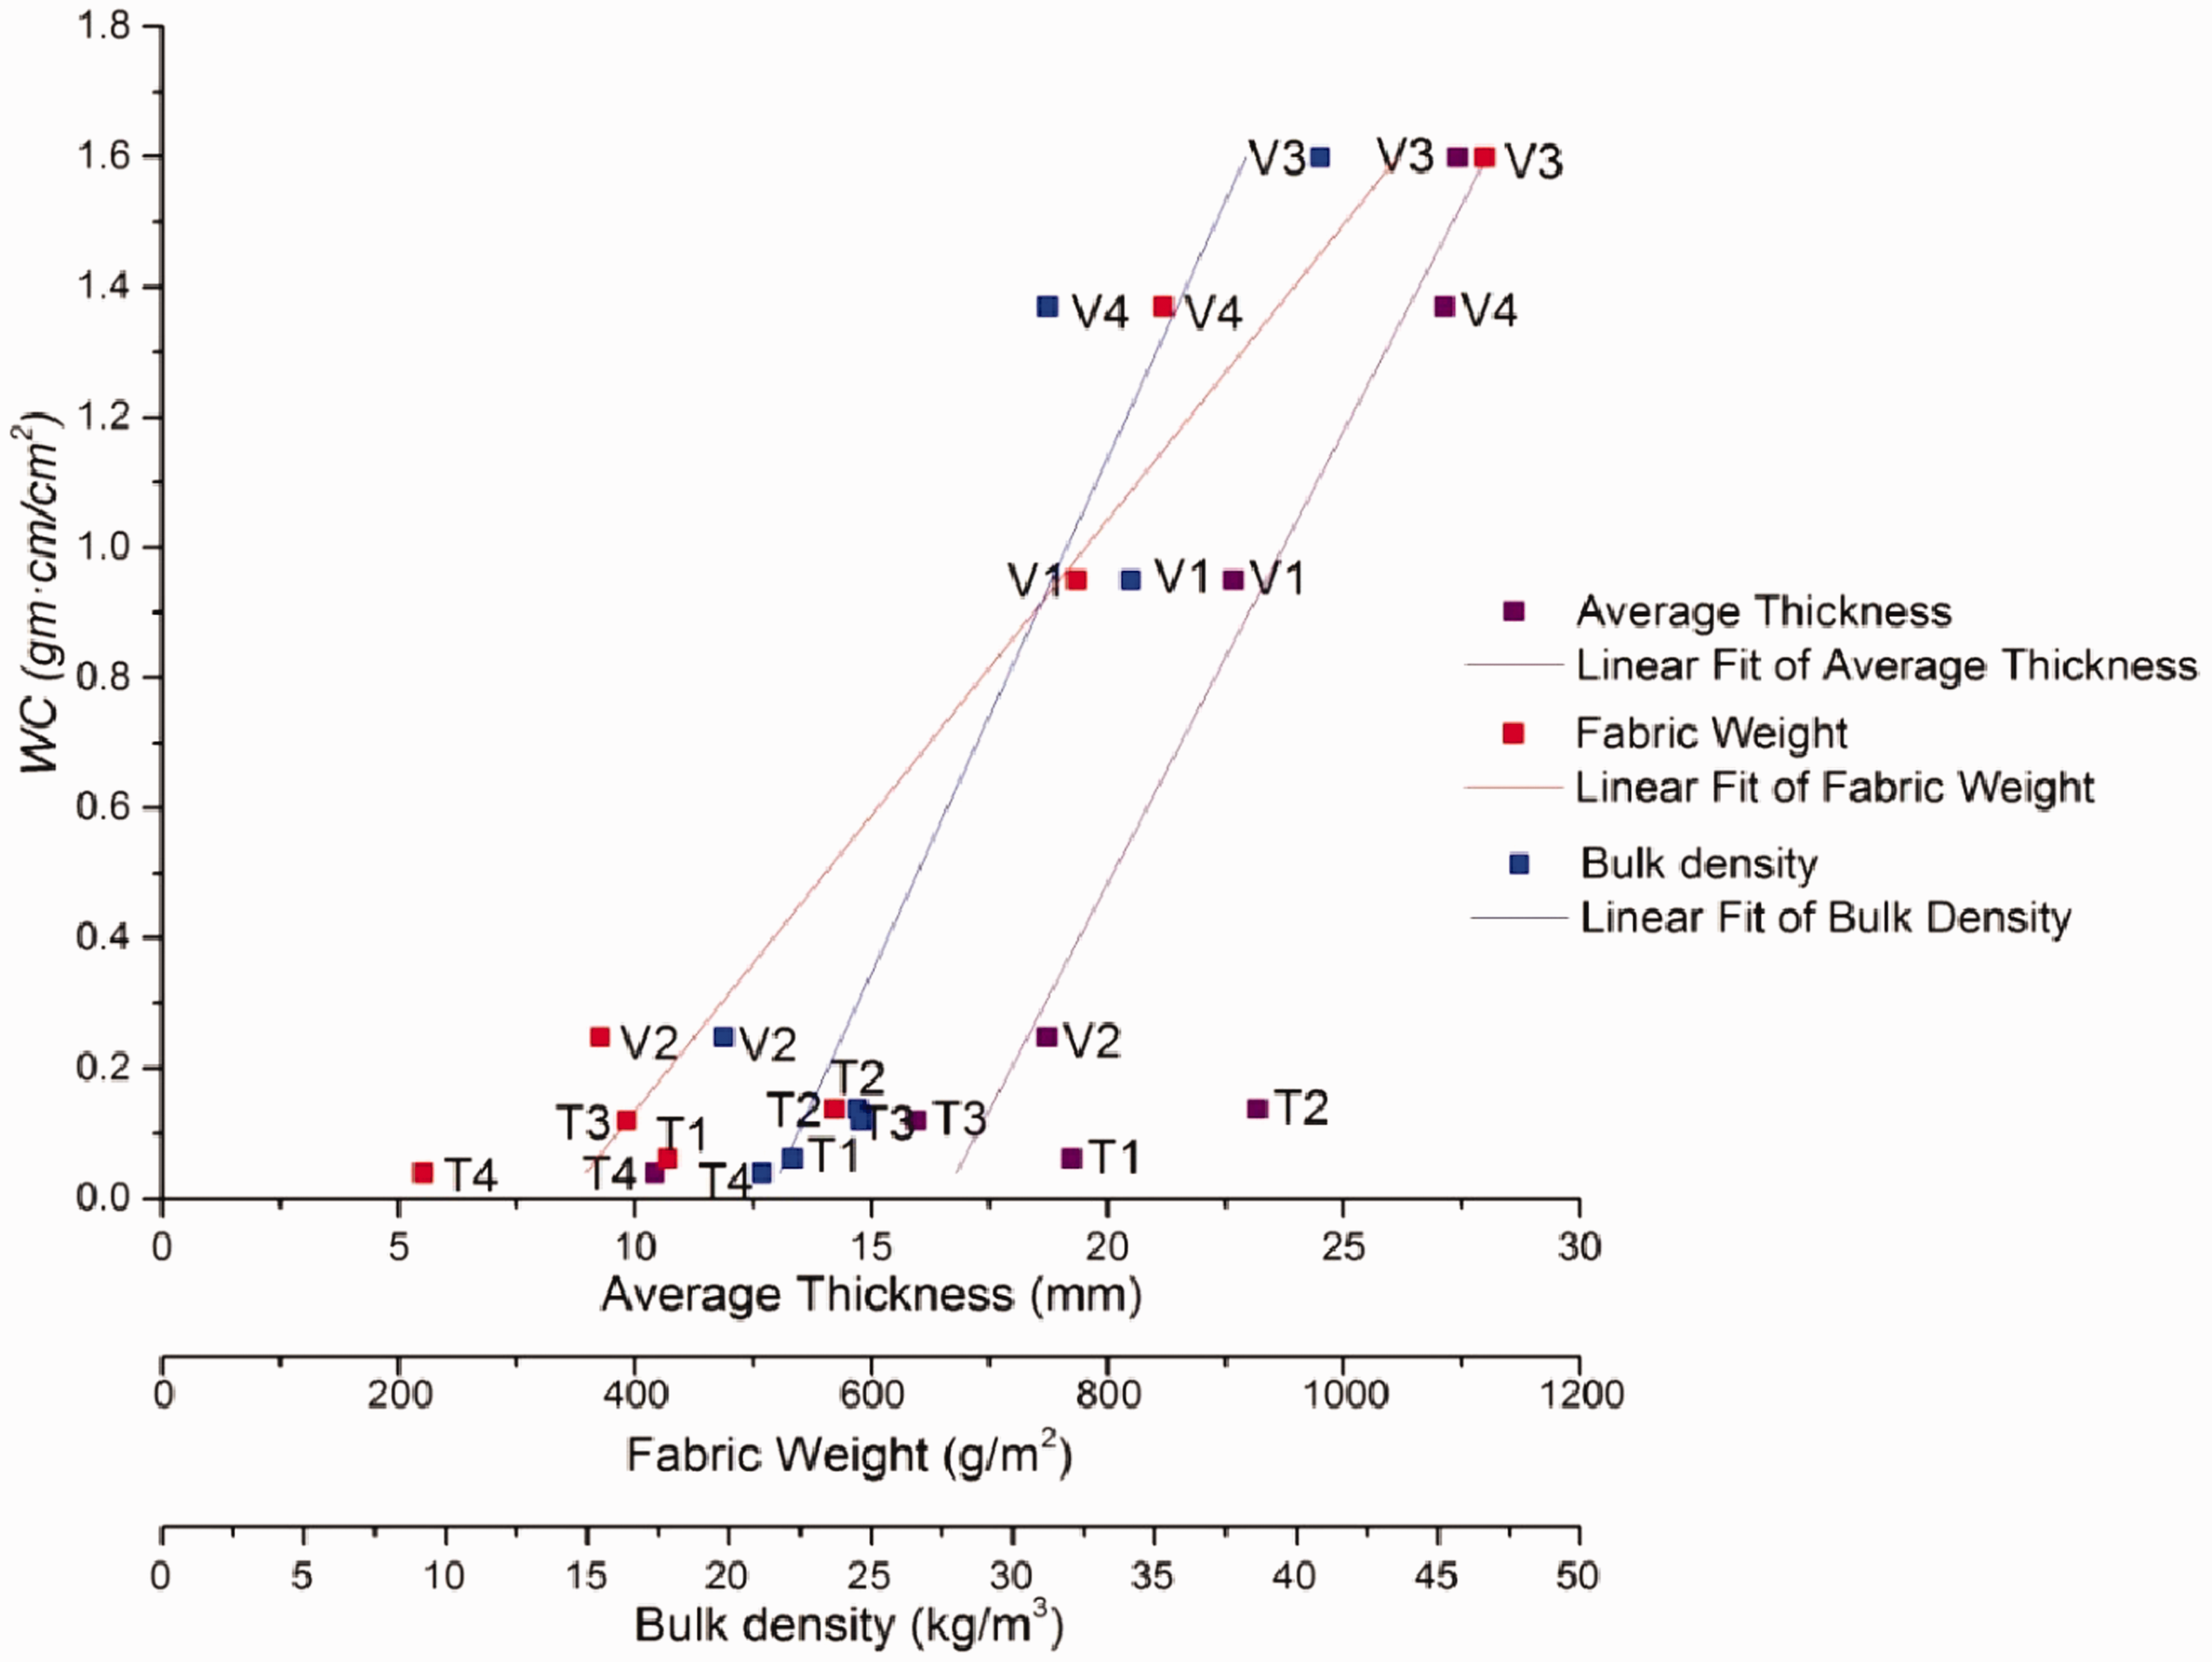
Figure 13 plots an overall trend of LC versus the fabric structural parameters. LC increases with the increase of nonwoven thickness, weight, and bulk density [18,19]. It can been seen that all LC values from V Group are larger than those of T Group regardless of changes of structural parameters. At the same time, the LC value of T Group has little variation with the change of structural parameters. For example, the thickness of T2 is 2.22 times thicker than that of T4 and the weight of T2 is 2.58 times heavier than that of T4, but the LC value is only increased by 6.38%. In contrast, LC of V Group varies greatly.
Relation between LC and fabric structure parameters.
In summary, the compression linearity value of the vertically laid nonwovens is generally higher than that of the cross-laid nonwovens, which is affected by the thickness and weight of the nonwovens, as well as the nonwoven formation methods.
Influencing factors on compression resilience of nonwovens
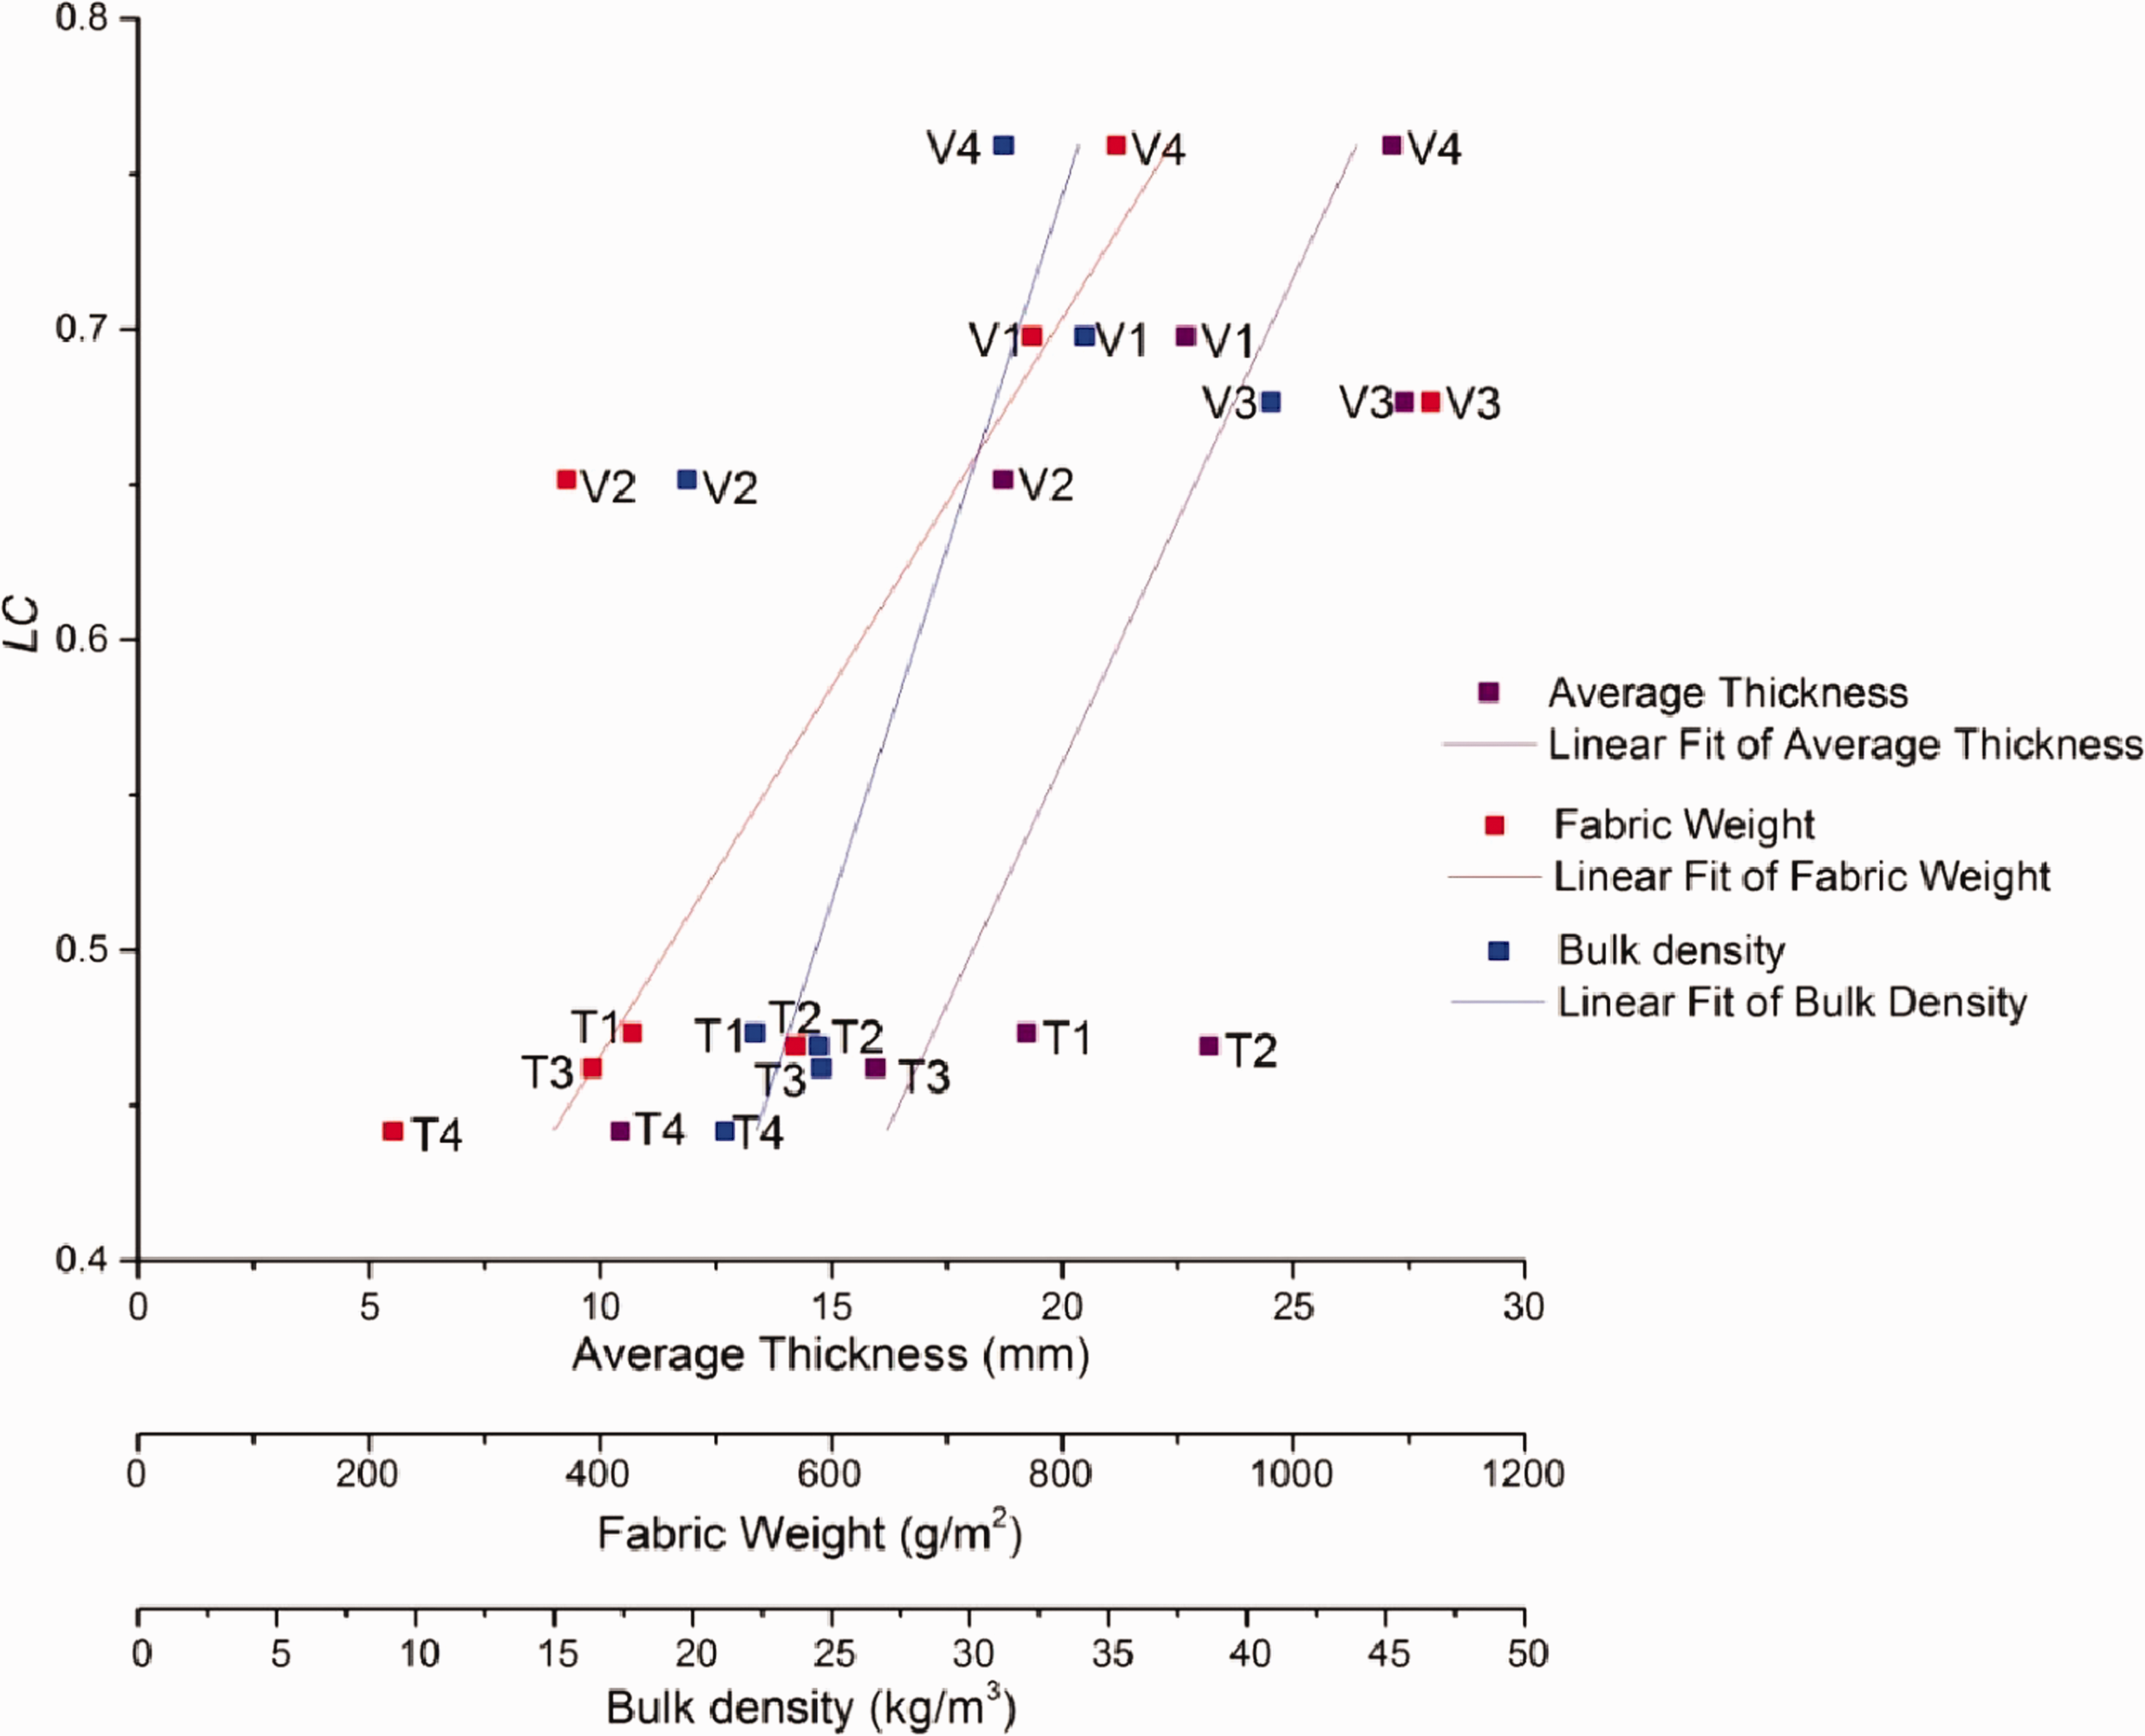
It can be seen from Figure 14 that the compressive elastic recovery rate of T Group is higher than that of V Group, regardless of the change of fabric thickness and weight, when the thickness compression rate is 60% of nonwoven thickness. With a cross-reference to the test results of compression energy, V Group exhibits a higher WC but a lower RC. This is also due to the V-shaped cross-section structure. From the results of correlation analysis, RC is almost all negatively correlated with the fabric structural parameters and is greatly affected by fabric bulk density. The influence of the other two parameters is relatively weak, especially for T Group.
RC of nonwoven fabrics.
As can be seen from Figure 15, the difference of thickness, weight, and bulk density between V1 and V3 samples with similar RC values is smaller than that of other samples, which further shows that the elastic recovery rate of nonwovens is related to the change of fabric structure.

Relation between RC and fabric structure parameters.
From the above analysis, it can be concluded that the compressive resilience of the two kinds of nonwovens is different due to the different laying methods of fiber in web. The cross-laid nonwovens have a better RC at the 60% compression rate. RC is negatively correlated with the nonwoven structural parameters, with a heavy influence by the bulk density shown especially in V Group.
Influencing factors on maximum compressive rate of nonwovens
It can be seen from Figure 16 that due to the unevenness of the thickness and density of the samples, the maximum compression ratio EMC calculated by the eight sets of samples at the initial 60% compression rate shows larger errors varied among the nonwoven samples. Overall, the errors in T Group are greater than those in V Group, which indicates that the compressibility is more predictable for V Group than for T Group. It is also found that the EMC measured values varies around the set value (60%) with an error less than 2% for all tested samples except T3 and T4. Referred to Table 5, it could be observed that the largest deviation of EMC from 60% is always associated with the lowest WC, such as T4 and V2.
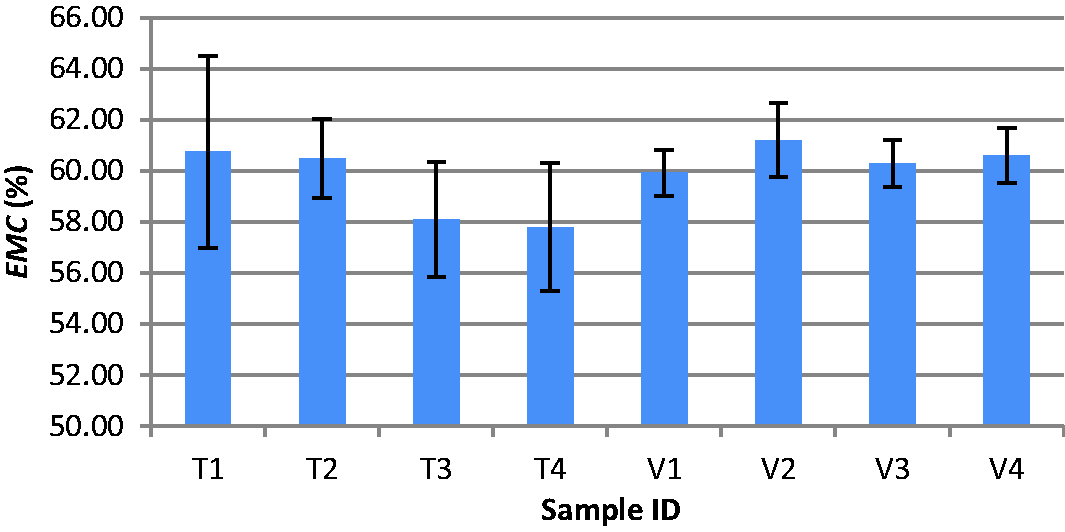
EMC of nonwoven fabrics.
From the results of correlation analysis (Table 6), EMC of T Group is strongly related to nonwoven thickness and weight only. For V Group, EMC is negatively correlated with all three nonwoven structure parameters among which bulk density indicates the highest correlation coefficient. Figure 17 plots the linear correlations between EMC and the three structural parameters.

Relation between EMC and fabric structure parameters.
Summary of compressive performance analysis
The above analyses show that the compressive properties of the two types of nonwoven structures are significantly influenced by the nonwoven thickness, weight, and bulk density. From the correlation analysis, it can be seen that the compression energy of nonwovens is more affected by the nonwoven structural parameters than other compression parameters. Especially for the vertically laid nonwovens, the correlation coefficients associated with the three structural parameters are all above 0.90. Therefore, it can be concluded that thickness, weight, and bulk density of the nonwovens are the main factors affecting the nonwoven compression energy. Generally speaking, the vertically laid nonwovens have a substantially higher compressive energy and compressive linearity, and a considerably lower compression resilience, in comparison with the cross-laid nonwovens.
Conclusions
The thickness of vertically laid nonwovens and cross-laid nonwovens was measured by two different methods, and the differences between the two methods were compared. At the same time, the porosity and compression recovery properties of the two kinds of fabrics were tested, and the influence of fabric structure parameters on them was analyzed. The conclusions can be drawn as follows: According to the analysis of variance, there is no significant difference between the direct method of manual measurement and the direct method of machine measurement in measuring nonwoven thickness. Therefore, either measurement method can be selected according to available testing facilities. The pore size of the nonwoven fabric has a certain correlation with the fabric structure. The bubble point size is more affected by fabric bulk density and fabric weight than by fabric thickness, while the mean flow pore diameter is the opposite, mainly affected by fabric thickness, and shows a negative correlation trend. The vertically laid nonwovens have higher compression energy and compression linearity than the cross-laid nonwovens. The compression energy is significantly affected by the weight, bulk density and thickness of the nonwovens compared to other compression parameters. In contrast to compression resilience, the cross-laid nonwovens are superior to the vertically laid nonwovens. For nonwoven fabrics of the same material and structure, an increase in thickness and bulk density reduces the nonwoven compression resilience, which also indicates that the greater the compression energy, the less the compression recovery. On the premise of the predicted compression rate of 60%, the biggest deviation of a measured compression rate is always related to a nonwoven sample with the lowest compression energy.
Footnotes
Acknowledgement
Thanks are to Nantong University for providing visiting scholarship for Dr. Lizhe Zhang.
Declaration of conflicting interests
The author(s) declared no potential conflicts of interest with respect to the research, authorship, and/or publication of this article.
Funding
The author(s) received no financial support for the research, authorship, and/or publication of this article.