
Abstract
In this article, acoustic properties of fibrous structures made of banana fibres have been studied. Impedance tube method was used for the testing of acoustic barrier properties. An attempt to counter low-frequency noise as well as enhancing transmission loss characteristics of fibrous structures was carried out. The effect of different parameters and arrangement of structures with respect to sound source on sound absorption as well as sound insulation of these structures has been reported. A unique structure has been developed with varying compactness throughout its thickness, and it was observed that the areal density of samples, compactness of structure and arrangement of structures can be utilised to customise its sound barrier and absorption behaviour. Maximum noise reduction coefficient of 0.78 and transmission loss up to 23 dB was observed for samples with gradient in compactness. Acoustic performance of the structure developed as a part of this research is at par or better than acoustic materials reported in literature and other commercial products.
Keywords
Introduction
Noise is any unwanted and unpleasant sound and noise pollution is an underrated health hazard. With industrialisation, increasing dependence on machinery and ever contracting living spaces, it is almost impossible to avoid noise in daily life. Prolonged exposure to noises at various frequencies is reported to have detrimental effects on human health [1–3] and accelerated ageing of materials in its vicinity [4]. Engineers and researchers have been working on various techniques, strategies and materials to address the challenge of noise pollution for a long time. All the strategies can be broadly classified under active or passive noise control [3,5]. Active noise control methods are sophisticated and require expertise to apply in every individual case. Moreover, cost and space constraints do not favour active noise control in many cases. Due to limitations of practical viability of active noise control, passive noise control strategies have become popular for materials and design experts.
Material scientists are progressively working on materials or combination of materials in order to provide better noise control solutions. A sound-absorbing material or sound insulating material can be placed in the way of sound waves. There are broadly two types of materials that are being studied by researchers [6]. In the first type, rigid and compact structures are developed, which primarily reflect the majority of sound waves incident on them. Such materials thus restrict the transmission of sound waves and exhibit sound barrier property. For a rigid infinite single layer material, which has no damping forces and independent displacement, the sound reduction index (R) plane wave incidence follows the Law of Theoretical Mass [7] mentioned in equation (1)

The second type of materials have porous structure, which primarily absorbs sound waves incident on them by dissipating the sound wave energy into heat [8]. It is due to vibrations while sound waves pass through the porous channels inside the material. Sound absorption of a material can be denoted by the sound absorption factor,

Conventionally, glass wool and mineral-based materials such as perlite, vermiculite, rockwool, etc. have been used for sound and thermal insulation in residential buildings [10,11]. However, these materials are harmful to human health and were reported to cause skin irritation and respiratory diseases [12,13] due to the presence of microcrystalline silica, tremolite and amphibole fibres [14]. In recent years, various materials have been used and studies have been conducted on developing porous materials and understanding the effects and mechanism of sound wave attenuation with respect to pores and porosity of these materials [15,16]. Polyester fibres in the form of nonwoven fabrics displayed excellent sound absorption properties [8]. Effect of the number of layers on the sound absorption coefficient was determined for the combination of polypropylene nonwoven and polyethylene terephthalate woven fabric [17]. Extensive studies on needle-punched nonwovens have been carried out and role of various parameters have been discussed. Yilmaz et al. demonstrated that the type of material, fibre size, porosity of nonwovens [16], thermal [18] and alkali treatment [19] parameters affect the sound absorption of hemp-based trilayer nonwovens, fabricated through needle punching technique. Relation between airflow resistivity and sound absorption of these nonwovens was also established [20]. Studies on using recycled or waste materials are also reported for sound barrier materials [21–27]. Polyester fibres of different cross-sectional shapes and diameters were used in the nonwoven form. It was also observed that the shape factor of fibres determined the porosity of the structure and thus played a vital role in determining its sound absorption properties [28,29]. Nonwoven structures of para-aramid and polyester fibres were studied as a substitute for glass wool as a fire-retardant material and its absorption performance was found to be than glass wool [30]. In the reported literature, regarding natural fibre-based composites, it has been confirmed that the selection of fibres [31,32] and matrix [33] using various approaches plays a crucial role in determining the end properties [34,35]. Sound insulation of jute [36], glass, polypropylene, polyester [2], waste fibres [21,23] and inorganic particle [37]-based composites has been investigated by researchers. Particle boards based on coir fibres [3] and agriculture waste such as corn cob [38] have also been reported.
In the reported literature, there are certain gaps and challenges. Almost in all the studies, it can be observed that porous materials are effective at medium- to high-frequency regions but are inefficient at low-frequency regions. Some studies that include the air cavity behind the sample are reported to tackle sound absorption at low frequencies up to a certain extent [27,39]. It has also been observed that researchers target materials for either sound absorption or sound insulation. Moreover, most raw materials are obtained from non-renewable resources and pose environmental hazards on disposal. Studies on non-hazardous materials, specially using plant-based fibres in acoustic applications are limited [27,40].
In this study, fibrous structures have been fabricated from banana fibres. Banana fibres are available in abundance in various countries. Currently, their potential is unexplored in many applications [41,42]. These are biodegradable lignocellulosic fibres obtained from pseudostem of banana plants, which is an agricultural waste and usually thrown or used as compost. Lumen present in banana fibres entraps air cavities. Banana fibres have been found to be interesting materials and studies have been done on their basic characterisation of mechanical properties [43], variability [44] and possibility of technical applications [42]. There are other advantages of natural fibres like low wear and tear of machinery and non-lethal health hazards during processing [27]. Based on the above discussion, this study makes an effort to use banana fibres to produce a biodegradable, low cost and harmless acoustic material, which may later be developed into a commercial product. Unlike most studies, both the sound absorption as well as sound insulation properties are targeted in this study. Polypropylene has been used for adhesion among the fibres. Very small quantity of polypropylene has been used as a binder, which bind fibrous structure at less compactness, thereby maintaining the porous structure.
Materials and methods
Materials
Banana fibres from the pseudostem of banana tree were procured from Tokyo Engineering Corporation, Coimbatore, India. Density of fibres as measured by density gradient column prepared with mixture of cyclohexane and carbon tetrachloride ranged between 1.28 g/cm3 and 1.35 g/cm3. Diameter of banana fibres ranged between 50 µm and 250 µm. The diameter was measured under an optical microscope. Each fiber was measured at three different locations and 100 fibers were tested. The average diameter of was 167 µm with coefficient of variation of 16.17%. Reliance H110MA polypropylene chips from Reliance Industries Ltd., having MFI of 11 g/10 min were used. Sodium hydroxide pellets (CAS No. 1310-73-2) from Fisher Scientific were used for surface treatment of fibres. Toluene (CAS No. 108-88-3) from Fisher Scientific was used as the solvent of polypropylene.
Preparatory processes
Fibres cleaning and cutting
Banana fibres were obtained as continuous strands of fibres. Fibres, which were in partially adhered state, were manually combed using a hair comb to individualise the fibres and unwanted wooden material was removed. These parallelised and individualised fibres were cut to 10 mm length. Fibres were weighed and stored in air-tight bags for further use.
Alkali treatment
Fibres were treated with 3% NaOH solution for 12 h. The material-to-liquor ratio was maintained at 1:15 by weight. The treatment was carried out at 27°C. After 12 h, the fibres were taken out and washed thoroughly with running tap water to remove any traces of alkali in them. Fibres were dried at 60°C in vacuum oven till constant weight was achieved and stored in air-tight polyethylene bags.
Fabrication of specimens
Banana fibres were used to produce specimens with different areal densities. Two types of structures were prepared from the fibres. One set of structure was uniform in compactness, whereas the second had a varying level of compactness throughout the thickness. Weighed amount of treated fibres were laid with random orientation. The fibre assembly was immersed in 3% solution of polypropylene in toluene for 5 min and dried in hot air oven at 50°C. This led to samples with porous structures and uniform compactness across the thickness. Specimen with gradient compactness were produced by an additional treatment under controlled conditions of temperature, pressure and time in compression moulding machine as shown in Figure 1. Samples were subjected to heat treatment at 172°C for 180 s and 0.5 MPa pressure. The process of fabrication of specimen has been discussed in detail in the patent (Indian Patent Application No: 201811042151).

Process of producing samples with gradient in compactness.
Both uniform and gradient compactness structures were produced with three different areal densities, i.e. 4500 gsm, 3000 gsm and 1500 gsm. The areal density was changed by differing the thickness of the material. The samples with 4500 gsm were 36 mm thick, whereas samples with 3000 gsm and 1500 gsm were 24 mm and 12 mm thick, respectively. Figure 2 displays the banana fibres and the structures made of these fibres at different areal densities.
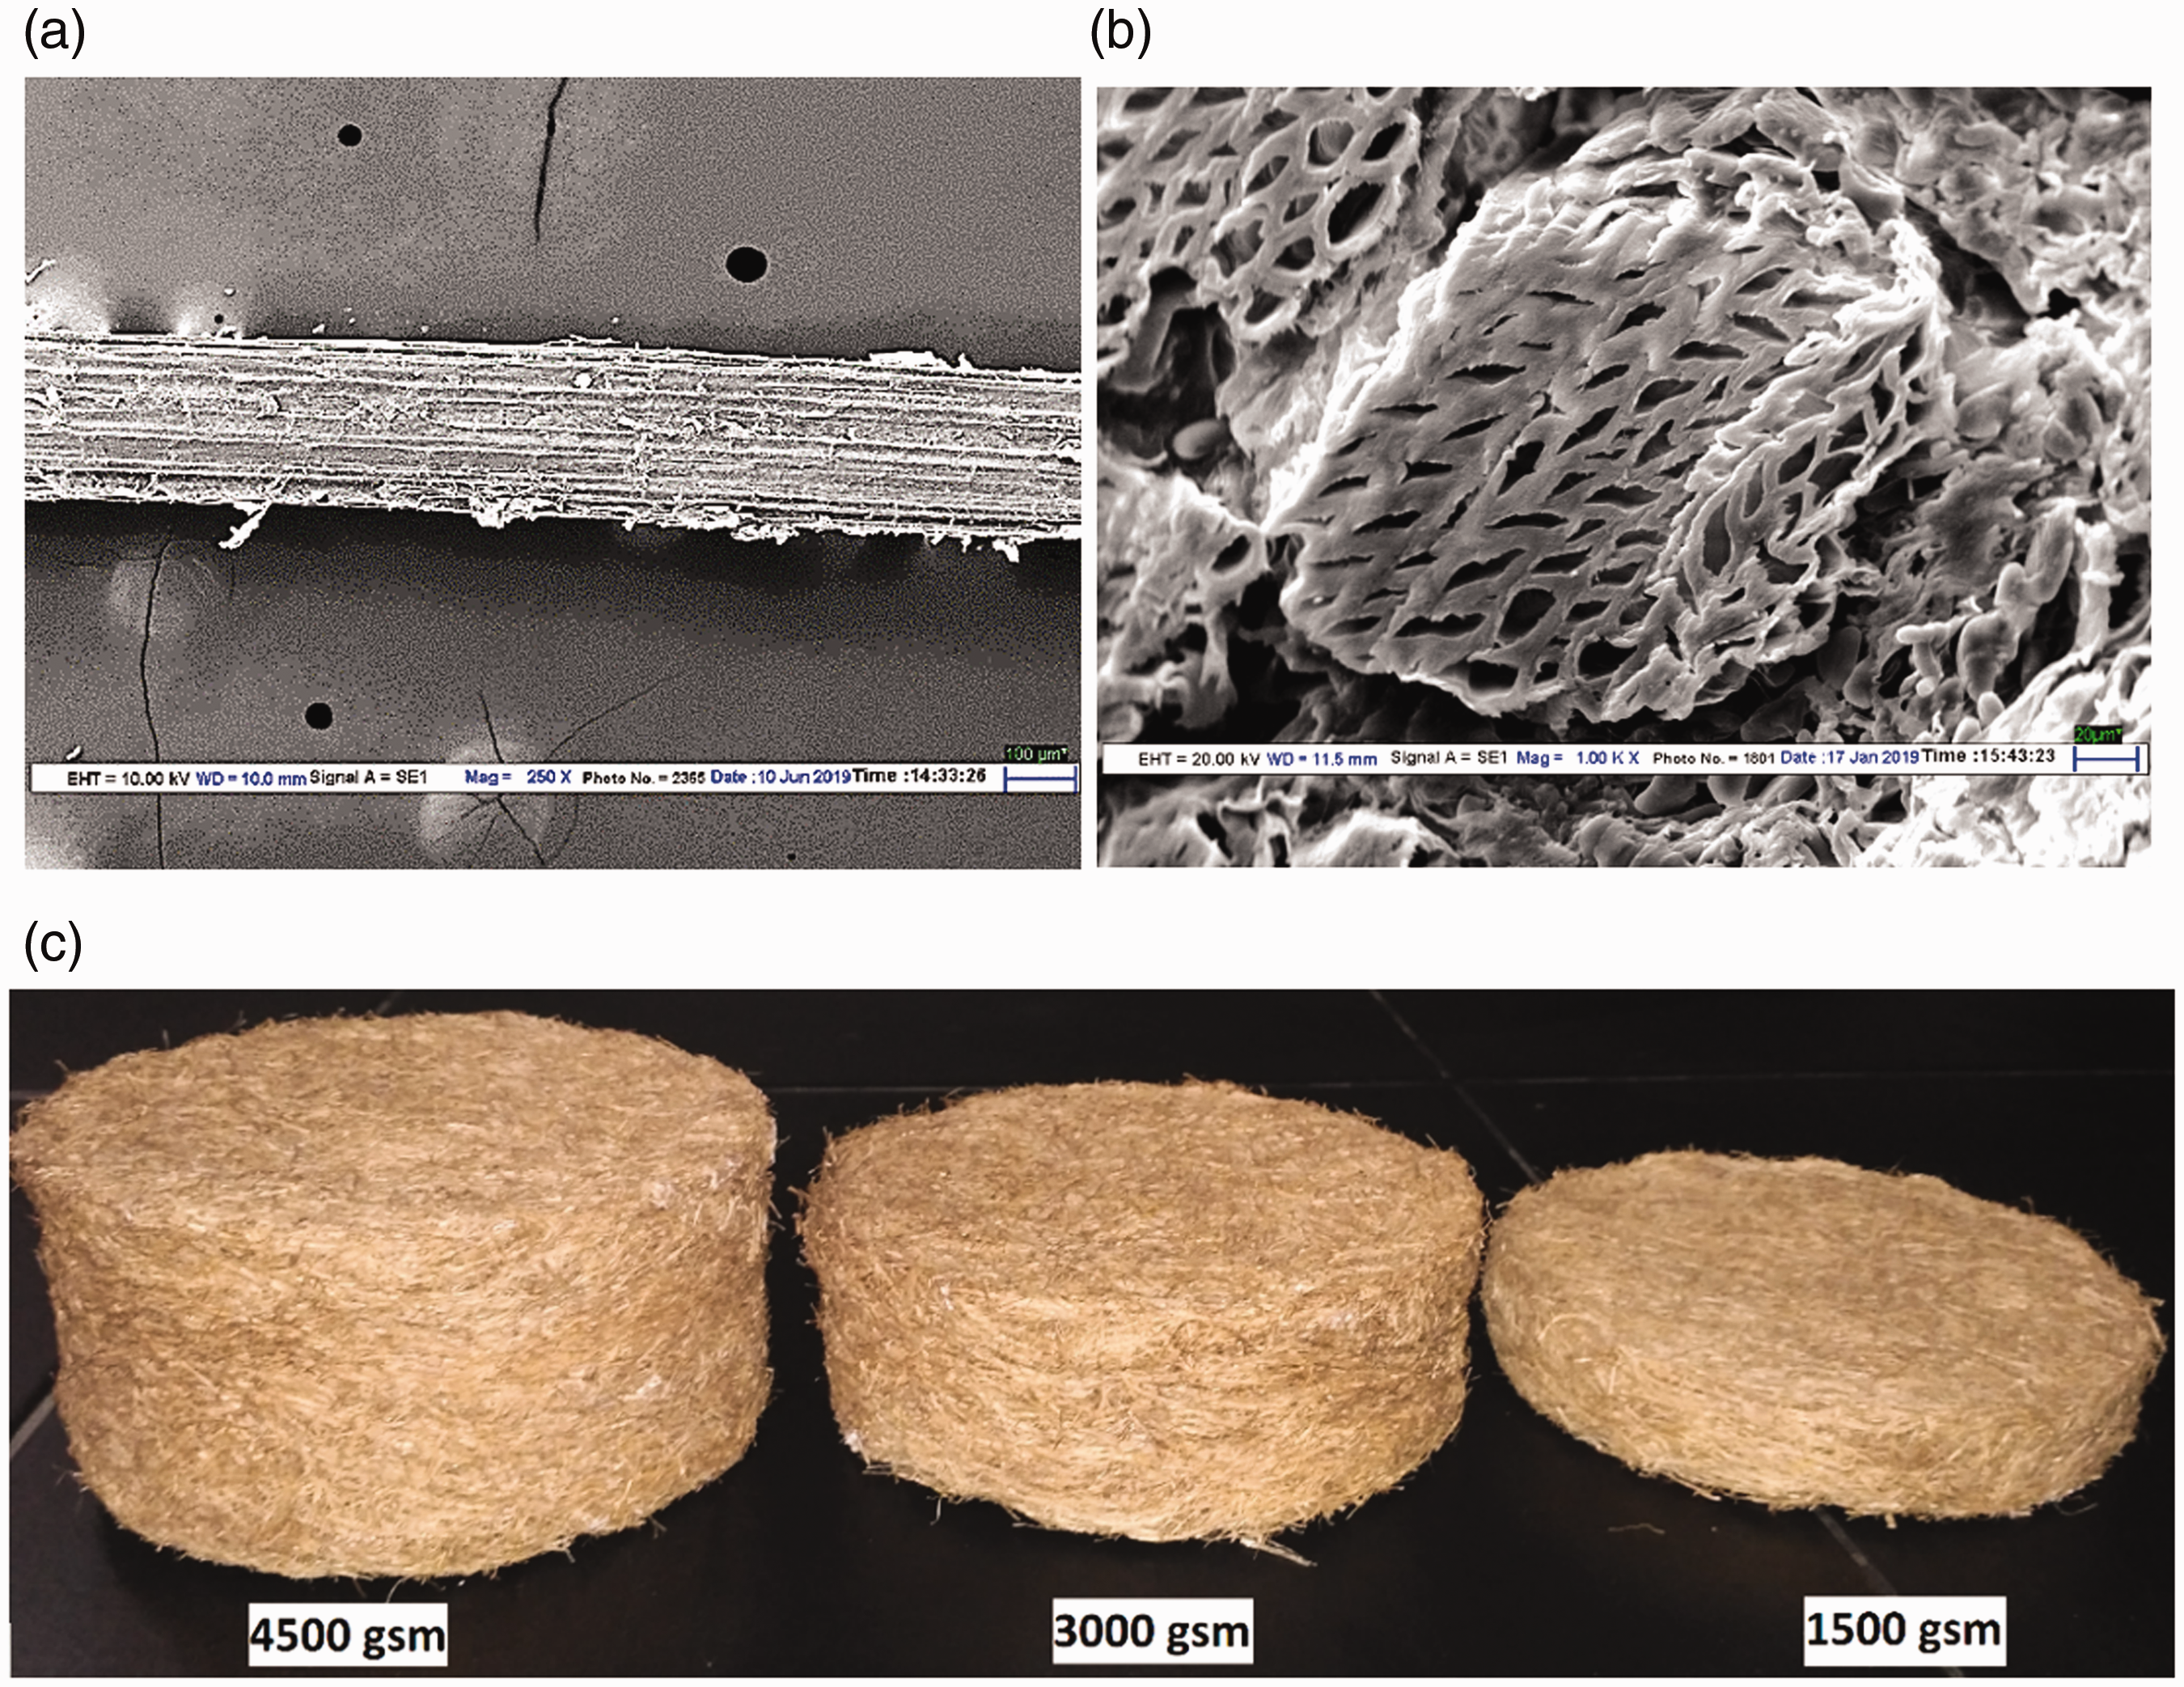
Image obtained from scanning electron microscope for (a) longitudinal view and (b) cross sectional view of banana fibres. The fibre beds at different areal densities are shown in (c).
Testing
The fibrous panels were cut into circular dimensions of 100 mm and 30 mm diameter. Samples with 100 mm diameter were used for acoustic testing at low-frequency range of 150–2000 Hz and samples with diameter of 30 mm were used for medium to high frequency of 2000–6600 Hz. Impedance tube AcoustiTube® supplied by Akustik Forschung Dresden (AFD) along with AFD 1201 and AFD 1001 software packages was used. Signal-to-noise ratio (SNR) was maintained at 60 to 65. Samples were conditioned at 27°C and 65% relative humidity for 24 h prior to acoustic testing. The experimental setup was arranged according to two microphone method, ISO 10534-2 standard for measurement of sound absorption coefficient. Four microphone method, i.e. DIN EN ISO 717-1 standard was used for observing transmission loss of the samples. The acoustic testing of samples in absorption and transmission mode was carried out with various arrangements with respect to sound source as mentioned in Figure 3.

Placement of samples with respect to the sound source. (a) Arrangement ‘A’ denotes homogeneous samples and arrangement (b) ‘B’ and (c) ‘C’ denote samples with gradient in compactness.
Results and discussion
The samples were tested in absorption and transmission mode. The results are thus broadly discussed for sound absorption and sound insulation. The factors that affect these acoustic properties are discussed in detail in the subsequent sections.
Sound absorption
It is well established that when sound waves pass through porous materials, it travels through air cavities and energy is lost as heat due to vibrations. This leads to absorption of sound waves by the dissipating medium [8,15,16]. Thus, structures with air cavities are considered good for absorbing sound waves rather than compact materials, which reflect back the sound waves [16,20,29]. The effect of various parameters affecting sound absorption coefficient has been discussed in subsequent sections. Impedance tube setup for determining sound absorption coefficient is shown in Figure 4.

Experimental setup for determining sound absorption behaviour of material using impedance tube.
Effect of areal density on sound absorption
From the observations made in Figure 5, it can be observed that sound absorption of the fibrous material depends considerably on the areal density. In Figure 5(a), it can be observed that fibrous samples having uniform compactness display higher sound absorption coefficient at 4500 gsm. Samples having 3000 gsm also display sound absorption without much fluctuation in the observed frequency range, but do not exceed the sound absorption of 4500 gsm samples. In Figure 5(b) and (c), the samples with gradient in compactness also show similar results and increase areal density resulted in increased sound absorption coefficient, with reduced fluctuations when the frequency of sound increases. In all the observations, samples with 1500 gsm display inconsistent sound absorption behaviour and the sound absorption coefficient values are lower than 3000 gsm and 4500 gsm. The values of sound absorption coefficient for 4500 gsm samples were the highest and mostly consistent. Samples with 3000 gsm in all the arrangements display moderate sound absorption performance.

Variations in sound absorption coefficient of samples having different areal densities for: (a) arrangement ‘A’; (b) arrangement ‘B’; (c) arrangement ‘C’.
It can be seen that in all the arrangements, i.e. uniform samples in arrangement ‘A’ and gradient samples in arrangement ‘B’ and ‘C,’ the effect of the areal density is similar. However, in arrangement ‘C’, the absorption curves do not display a clear trend. Moreover, the sound absorption of the material decreases with the increase in frequency of incident sound waves, which is different from materials in arrangement ‘A’ and ‘B.’ The reason for this will be discussed using Figure 7 in the following section. Samples with higher areal density are thicker and have larger number of air cavities. Lengthy tortuous path results in more dissipation of sound waves into heat energy and thus, results in higher sound absorption values. This explains why sound waves are absorbed better in samples with higher areal density.
Effect of arrangement of samples on sound absorption
Keeping in view that there are different ways the samples can be placed with respect to the sound source as shown in Figure 3, it seems noteworthy to observe its effect on the sound absorption coefficient.
An interesting trend can be observed in the sound absorption of all the sample arrangements. For arrangement ‘A’ and ‘B,’ it can be seen that the absorption coefficient for both of them undergo fluctuations at lower frequencies, but stabilises as the frequency increases (Figure 6). On the other hand, in arrangement ‘C,’ it can be seen that the absorption pattern is different than both arrangement ‘A’ and ‘B.’ The sound absorption coefficient of samples with ‘A’ and ‘B’ arrangement increases with the increase in frequency, whereas the samples with arrangement ‘C’ drops as the frequency increases. These patterns are present at all areal densities, i.e. 4500 gsm, 3000 gsm and 1500 gsm. It can be noticed that arrangement ‘B’ displays comparatively consistent sound absorption than that of arrangement ‘A.’ However, the difference in sound absorption between arrangement ‘A’ and ‘B’ is more prominent in samples with 1500 gsm where the thickness of samples is lower and least prominent in 4500 gsm samples, which are the thickest. This phenomenon of better performance of samples in arrangement ‘B’ compared to that of samples in arrangement ‘C’ can be explained using the mechanism proposed in Figure 7. It is to be noted that the ray diagrams are mere illustrations, where sound waves do not incident at right angle. It would have been complex to explain the mechanism using sound waves incident at right angle to the surface, which occurs during the actual practice.

Variations in sound absorption coefficient of different arrangements in: (a) 1500 gsm; (b) 3000 gsm; (c) 4500 gsm samples.
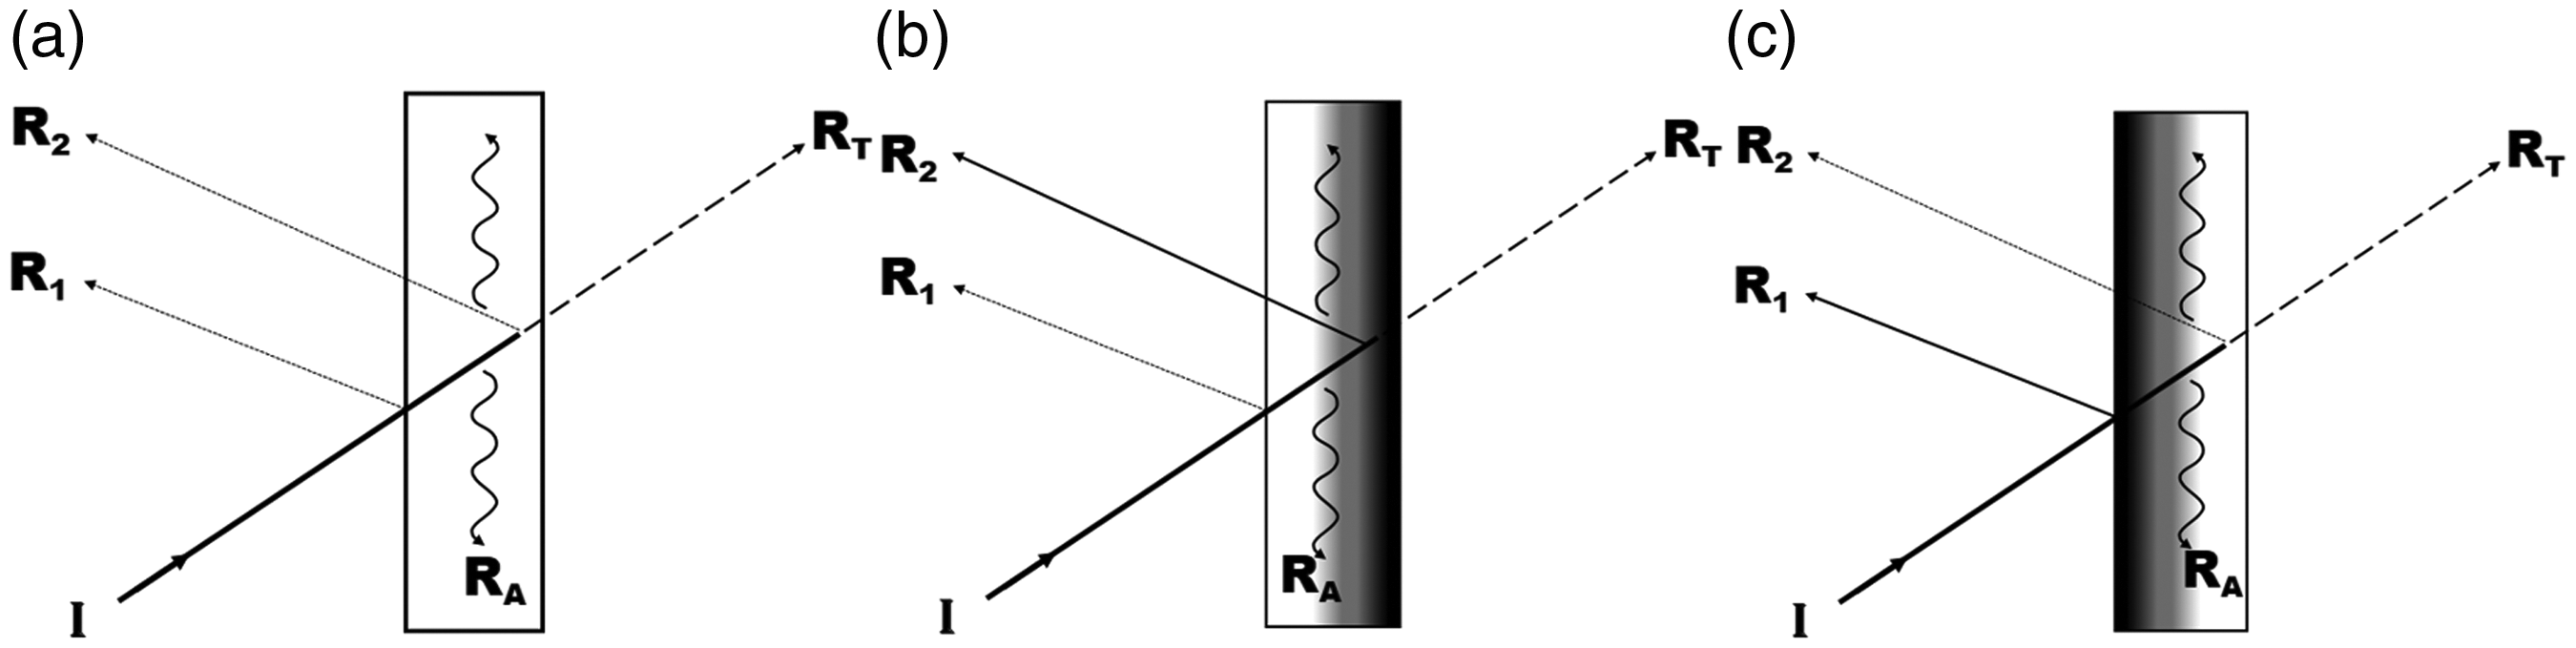
Schematic representation of mechanism of sound wave propagation, absorption and reflection in samples with: (a) arrangement ‘A’; (b) arrangement ‘B’; (c) arrangement ‘C’.
In Figure 7(b), the incident sound wave is partially reflected by the surface as R1, and rest continue to penetrate the structure. The increasing compactness of sample across the thickness reflects some amount of sound waves (denoted by R2) while remaining sound waves RT pass through the sample. The amount of sound waves absorbed in the material by dissipation as heat is denoted by RA. It can be noted that R2 waves are further absorbed by the material on their way backward. Similarly in arrangement ‘C’ as shown in Figure 7(c), the sound wave propagates, reflects and gets absorbed in the fibrous structure. But the reflection R1 in arrangement ‘C’ is higher than arrangement ‘A’ or ‘B’ due to the compact surface facing the sound source. The other reflected waves R2 are lower in arrangement ‘C’ when compared to R2 in arrangement ‘B.’
The successive penetration of sound waves into the structure and absorption of a portion of R2 waves lead to higher sound absorption coefficient in samples with arrangement ‘B’ when compared to arrangement ‘C,’ where most of the sound waves R1 are readily reflected by the compact surface. As a result, fewer sound waves make it through the material to be absorbed, transmitted and reflected back again by the structure. This explains why arrangement ‘C’ shows lesser amount of sound absorption than the arrangement ‘B.’ It also explains the poor trend in sound absorption performance of samples with arrangement ‘C’ in Figure 5(c). Arrangement ‘A’ has uniformity in compactness and thus displays almost similar sound absorption as the arrangement ‘B.’
Effect of air cavity on sound absorption
The fundamental challenge faced by the sound absorbing material is their poor performance in the low-frequency region. There are various approaches adopted by the researchers in order to achieve better absorption of low-frequency sound waves [45–47]. One approach is to have an air cavity behind the sample, which improves the sound absorption at lower frequencies. Noise signals at lower frequencies can be dealt by shifting the absorption peaks towards such noise signals. The samples with uniform compactness were subjected to back air cavities of 30 mm and 60 mm by adjusting the plunger shown in Figure 4, and the sound absorption results were compared to samples with no air cavity behind them (Figure 8). It was found that the sound absorption curves shifted to lower frequencies with the introduction of air cavity. At 60 mm air cavity, the curves further shifted to the lower frequency and resulted in much better absorption at lower frequency than the samples with air cavity of 30 mm or no air cavity.
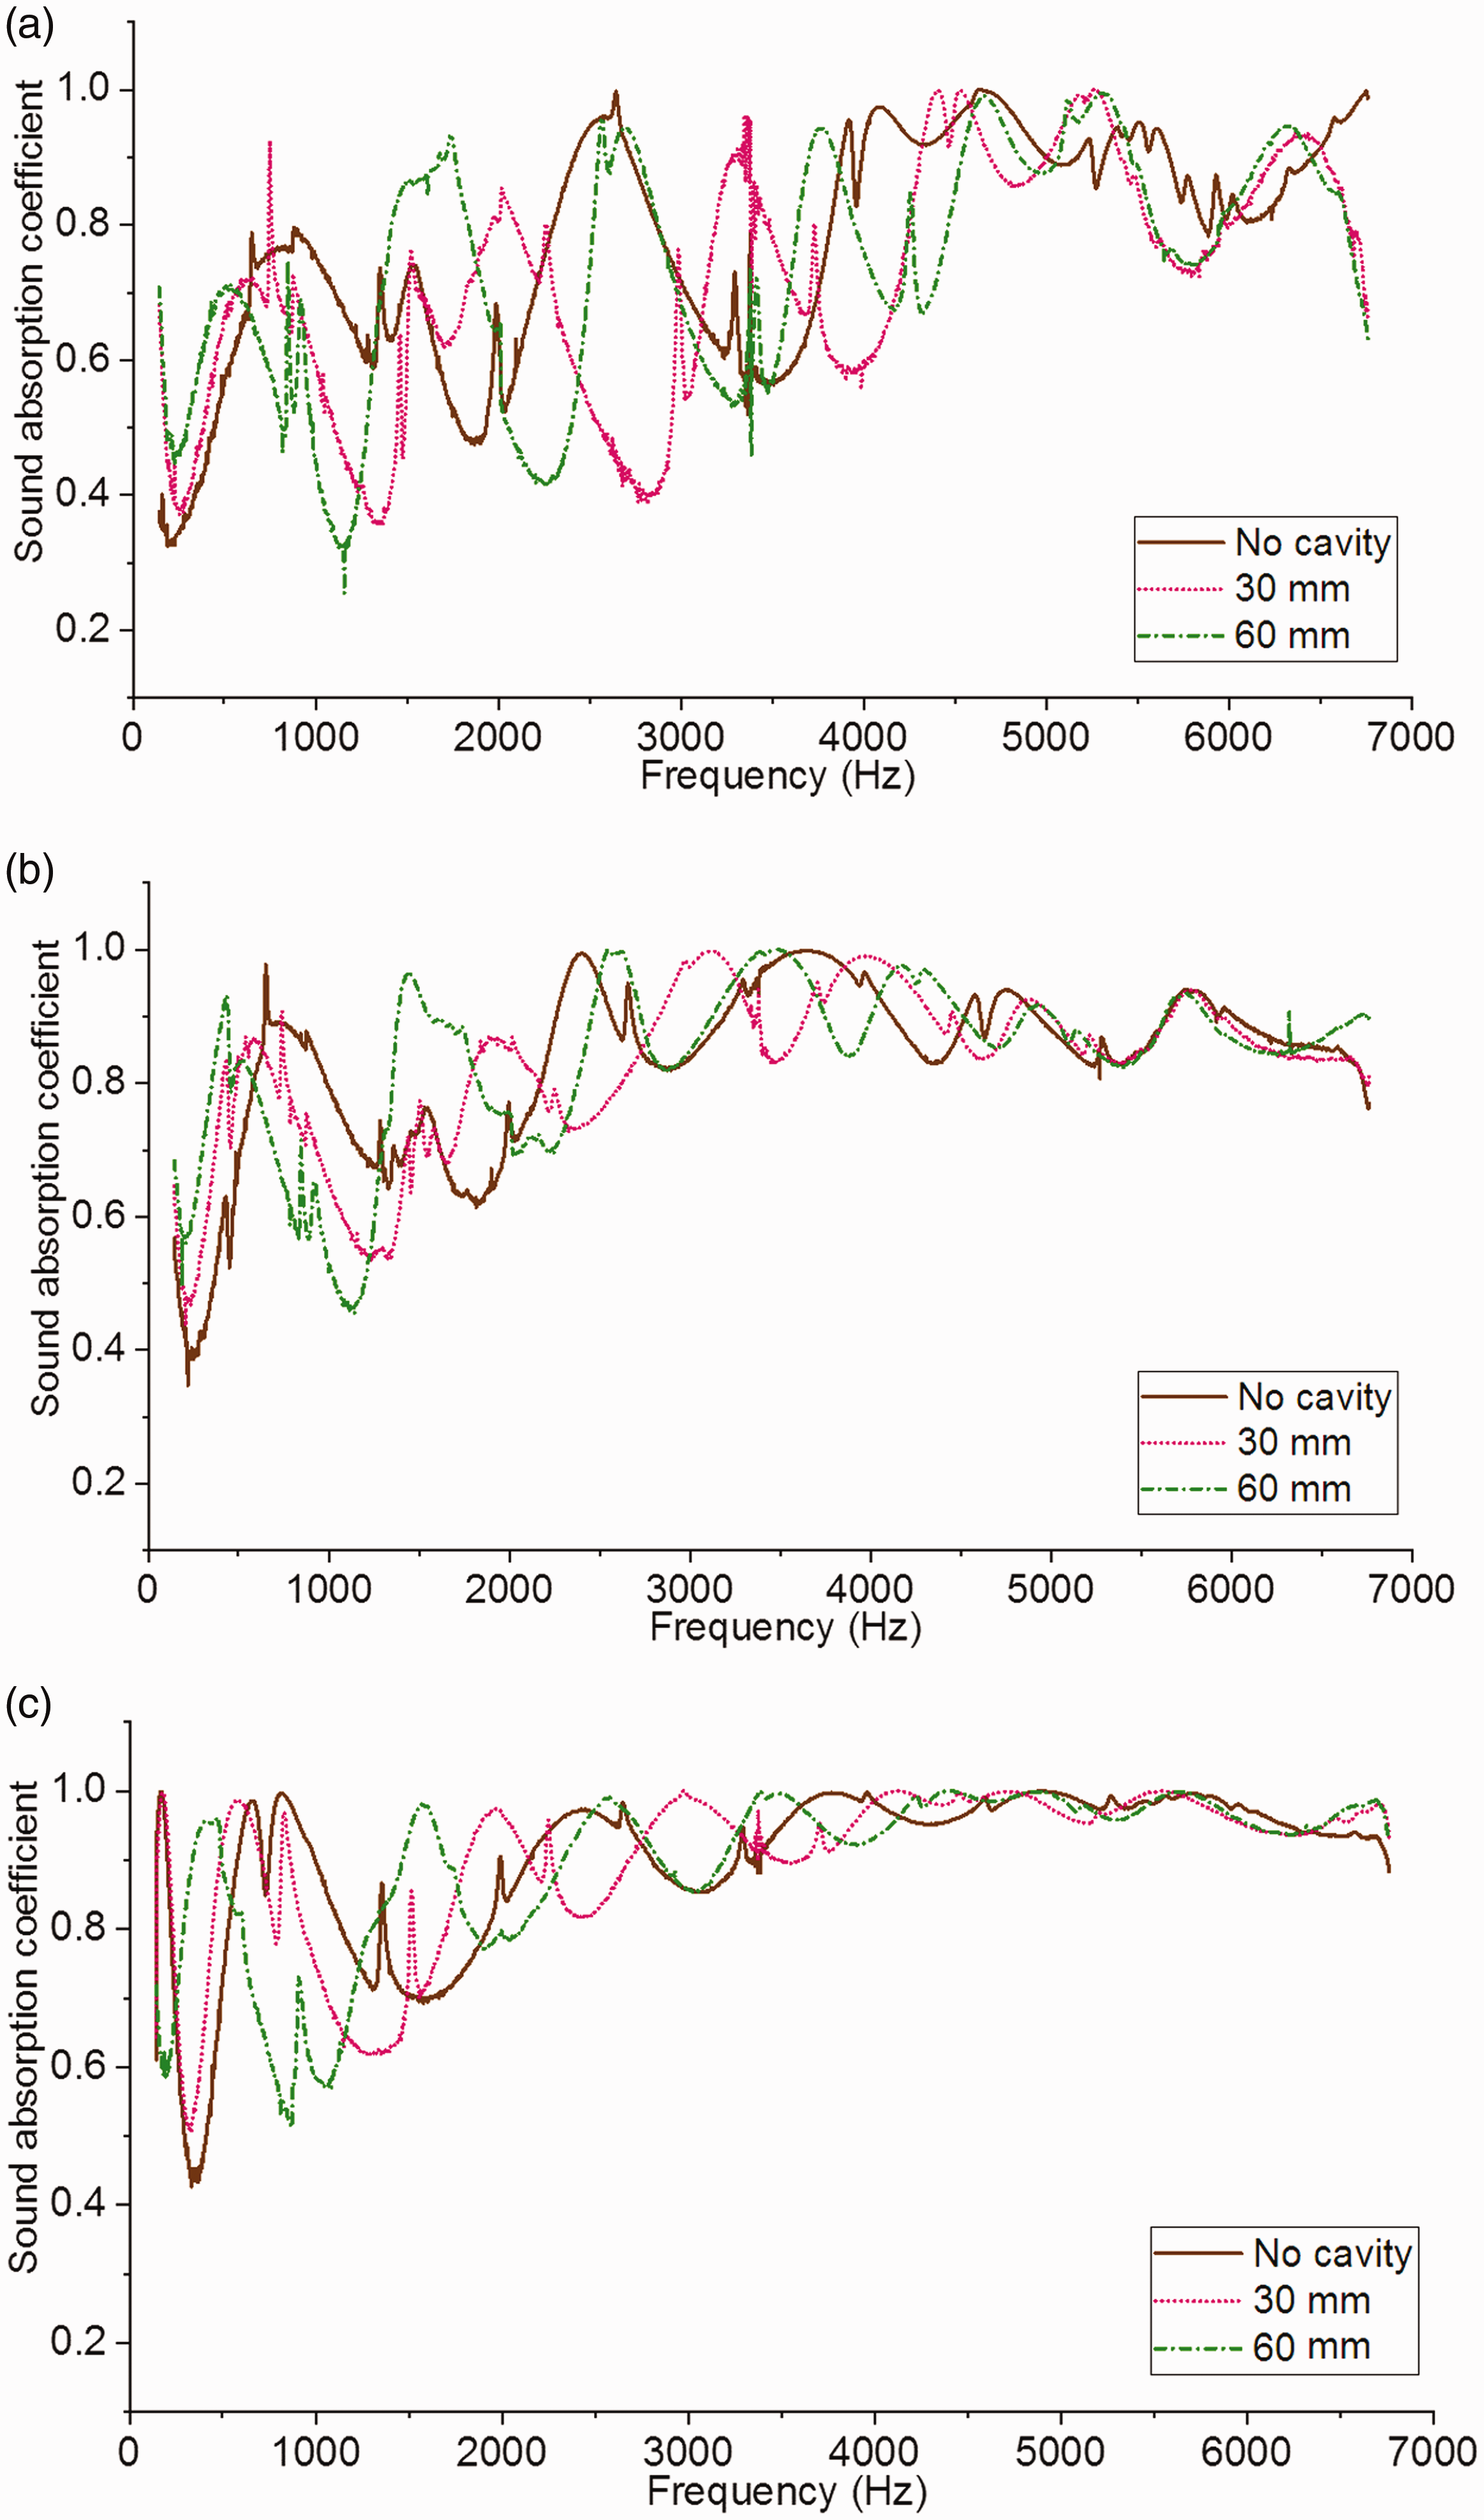
Variations in sound absorption coefficient with different air cavities in: (a) 1500 gsm; (b) 3000 gsm; (c) 4500 gsm samples.
However, it can be observed that shifting of sound absorption curve do not necessarily change the actual pattern of sound absorption over the frequency range. Only the curves tend to shift towards lower frequencies. The effect of air cavity seems more prominent in the specimen with lower areal density and nominal effect is observed as the areal density increases. There was a considerable change in the sound absorption characteristics of material when air cavity was introduced. The whole system, i.e. material and air cavity function as one single unit where majority of mass is towards the sound source while minor mass with enough space (cavity) allows the sound waves to vibrate at incident frequency. Optimising the air cavity to specifically target the sound absorption at a particular frequency can be utilised in end applications.
Transmission properties
Less compact materials having low surface mass and porous structure do not provide good sound insulation because their transmission loss values are very low [40,48]. Such materials do not restrict the sound waves and thus, the transmission of waves takes place without much resistance.
With the introduction of samples with gradient in compactness through the thickness, and one surface being more compact than other, it is expected that some interesting behaviour in transmission loss of samples may be observed. The effect of areal density and nature of arrangement on sound insulation has been subsequently discussed. Setup for determining sound transmission loss through the material using impedance tube is shown in Figure 9.

Experimental setup for determining sound insulation behaviour of material using impedance tube.
Effect of areal density on sound insulation
As discussed in the section “Effect of areal density on sound absorption,’ the thickness of the sample due to varying areal densities had a notable influence on the sound absorption properties. Specimens having higher areal density provided better sound absorption. Similarly, areal density can be expected to have some effect on the transmission loss as well.
Specimens with different areal densities were tested in transmission mode (Figure 10). The transmission loss for samples in all three arrangements has been included. It was seen that samples with higher areal densities displayed higher transmission loss characteristics, in accordance with the mass law. It was also observed that transmission loss increased gradually with the increase in frequency. The transmission loss of samples with arrangement ‘A’ displayed lesser fluctuations than arrangements ‘B’ and ‘C,’ with increasing frequency. Higher transmission loss of samples having higher areal densities is due to higher mass available for restricting sound waves.

Variations in transmission loss of samples having different areal densities for: (a) arrangement ‘A’; (b) arrangement ‘B’; (c) arrangement ‘C’.
Effect of arrangement of samples on transmission loss
During the acoustic testing in transmission mode, the samples were placed in arrangements as shown in Figure 3. The transmission loss values for samples with arrangement ‘B’ and ‘C’ displayed relatively higher values over the frequency range than the arrangement ‘A.’ The difference between the transmission loss for different arrangements diminished as the areal density of the samples increased. This denotes that the effect of arrangement of samples with respect to sound source will be lower for samples having higher areal density. The reason behind this observation is discussed in the subsequent paragraph.
The samples with different areal densities were subjected to the same temperature, pressure and heating time which resulted in a certain depth of compactness in all the samples. This depth was same in all the specimens. Samples with 4500 gsm are the thickest and 1500 gsm thinnest. In 4500 gsm samples, this depth of compactness would be minor when compared with its thickness, but would cover a higher fraction of thickness in case of 1500 gsm samples. This may be the possible reason for the substantial difference in sound insulation with different arrangements in low areal density samples and minor difference at higher areal density.
The uniform samples displayed different transmission loss pattern than gradient compactness samples in arrangement ‘B’ or ‘C’ as shown in Figure 11. It was further noted that the gradient samples displayed significantly better performance in sound insulation than samples in arrangement ‘A.’ It was due to the absence of a compact surface in the structure in samples with arrangement ‘A.’ Regarding the sound insulation performance of arrangement ‘B’ and ‘C,’ the higher transmission loss in arrangement ‘B’ can be explained on the basis of Figure 8. Arrangement ‘B’ and ‘C’ have higher reflectance of sound waves due to the presence of compact surface. In arrangement ‘C,’ the R1 component is higher than in arrangement ‘B’ because the compact surface facing the sound source readily reflects back majority of incident sound waves.

Variations in transmission loss of samples having different sample arrangements: (a) 1500 gsm; (b) 3000 gsm; (c) 4500 gsm.
Conclusions
An effort was made to create structures from chopped and randomly oriented banana fibres, which could perform better for both sound absorption as well as sound insulation. Two types of structures with different areal densities were produced by variation in thickness of the fibrous beds, with fibre length of 10 mm and were tested for different arrangements in both sound absorption and transmission mode. Structures with varying compactness were produced and enhanced sound insulation, and absorption properties were achieved depending upon their placement with respect to the sound source. The major outcomes of the study have been summarised below. Increasing the areal density up to 4500 gsm increases the sound absorption by material in both uniform and gradient structures. The placement of gradient samples with respect to sound source influenced the sound absorption of specimen. 4500 gsm samples having non-compact side facing sound source were found to have best sound absorption performance. Introduction of air cavity shifted the absorption curve to lower frequencies and thus, the depth of air cavity can be optimised to target specific frequency of noise in lower frequency region during any practical application. In transmission mode, gradient samples performed better than the uniform samples, and thus an enhancement in the transmission loss was noticed. The samples with compact side facing sound source performed better than any other arrangement. The areal density of samples influenced sound absorption, and a similar trend was observed for sound insulation as well. In the transmission mode, 4500 gsm samples displayed the highest transmission followed by 3000 gsm and 1500 gsm samples. Overall a structure from randomly distributed banana fibres and the pattern of its arrangement w.r.t. the sound source was determined so as to give an optimum sound absorption as well as enhanced transmission loss characteristics, which is the primary outcome of this study.
Comparison of sound absorption and transmission loss values of banana fibre structures having gradient compactness and products reported by other researchers is mentioned in Table 1. It can be noticed that unlike most studies, current study targets both sound absorption and insulation simultaneously. The performance of the structure developed as a part of this research, in both the modes, is at par or better than acoustic materials reported in literature. As can be inferred from the table, only a patent reporting the acoustic performance of a particle board had a better combination of absorption and transmission loss. However, the structure reported in the patent is a multi-layered structure when compared with the single-layered structure developed as a part of the work.
Comparison of acoustic performance of various materials and banana fibre structures.

NRC: noise reduction coefficient.
The observations in this study can further be used for agricultural waste and natural or synthetic fibres. Efficient noise control products having both sound absorption as well as sound insulation properties can be designed using biodegradable materials.
Footnotes
Acknowledgements
The authors would like to thank Indian Institute of Technology, Delhi and Ministry of Human Resource Development, Indian government for financial and infrastructural support. The authors are thankful to Dr Mahavir Singh and Dr Kirti Soni from CSIR National Physical Laboratory, Delhi for their generous support and setup for acoustic testing facility.
Declaration of conflicting interests
The author(s) declared no potential conflicts of interest with respect to the research, authorship, and/or publication of this article.
Funding
The author(s) disclosed receipt of the following financial support for the research, authorship, and/or publication of this article: Fellowship and financial support for this study was provided by the Ministry of Human Resource Development, India.