
Abstract
This paper is concerned with the effect of core pile yarn hybridization on the low-velocity impact response of 3D integrated-woven sandwich composite panels. For this purpose, at first, hybrid yarn was produced by a co-wrapped technique that is composed of polyester and glass fibres as shell and core structure, respectively. Then, 3D-woven samples with glass and hybrid pile yarns were fabricated, and after the impregnation, the behaviour of fabricated samples under low-velocity impact was experimentally investigated. In order to characterize this new type of hybrid structure, the fabricated samples with different pile heights and pile distribution densities were subjected to low-velocity impact tests at an energy level of 8 J. The impact characteristics of all panels including the load–time and load–displacement curves, contact time, absorbed energy and extent of the damage have been studied. Also, the extent of damage is interpreted in terms of the compressive strength loss after the impact of samples. According to the results, in comparison with the homogeneous glass/epoxy composites, contact time and deflection increased in panels with hybrid pile yarn, whereas the impact load decreased for the hybrid one. On the other hand, hybrid samples have a lower impact index than the homogeneous glass/epoxy composites. The compression after impact test results showed that the residual strength in hybrid samples is higher than the glass/epoxy composites.
Keywords
Introduction
Over the past several decades, considerable attention has been paid to composites reinforced with fibrous three-dimensional textile structures [1–4]. In this context, a modified face-to-face velvet weaving machine was used to produce new 3D integrated-woven sandwich composites (IWSC) [5]. Three-dimensional IWSCs consist of two woven fabric faces. These two parallel faces are bonded together using pile yarns which keep a defined distance between the top and bottom skins to form an integrated hollow core and are woven into the deck layers, thus forming IWSC (or spacer) composites [6–8].
Sandwich panels have found increasing applications in structures where high mechanical strength and stiffness at low weight are desired [9–11]. Due to the dissimilarity of the face-sheet and core materials, the connection between the skin and core is the important concern in traditional core sandwich structures [12–14]. The material similarity and integrated connection between the face-sheet and hollow core in the IWSC panels provide a through-the-thickness reinforcement during impact, shear and bending loads, and therefore, core-skin delamination of 3 D sandwich composites has been fully prevented [15,16]. The 3D IWSC panels provide high strength, low weight, thermal insulation and acoustic damping which are attractive for lightweight structures and have been increasingly used in industries such as marine, road and rail transport, automotive and aircraft industry, building and construction [6].
The impact response of 3D IWSC has been examined by many researchers. Vaidya et al. [17] have studied the low velocity impact (LVI) response of 3D sandwich composite panels of different types including, wax filling, wire routing, adhesively bonded polycarbonate sheet facing and stacking of two integral cores. The results indicated that due to additional energy absorption, stacking of the cores and the functionality-embedded cores were effective ways of LVI resistance enhancement.
Hosur et al. [18] have examined the LVI characteristics of 3D glass IWSC structures with foam in the core section, while the face-sheets were strengthened by adding plain weave S2-glass and twill weave carbon layers. Their study concludes that the foam core and the 3D structure support each other, and additional face-sheets considerably enhance damage resistance. LVI response of the 3D sandwich composites with hollow core and a polyurethane foam-filled core were studied by Vaidya and Vaidya [19]. Their results showed that the mode of failure for the unfoamed specimens was primarily the buckling of the core piles and the rupture of the face-sheets, while for the foamed specimens, the foam core crushing along with the core piles failure was the primary mode of failure. The foam-filled specimens could withstand the impact energies much more than the unfoamed panels.
Karahan et al. [20] have investigated the effect of core thickness on the LVI characteristics and impact damage of sandwich composites with and without foam filling. They reported that foam filling results in a significant increase in core resistance and damping properties. As the core thickness increases, the peak load values decrease due to decreasing core resistance.
Hosseini et al. [21] studied the low-velocity impact properties of the 3D-woven hollow core sandwich composite and concluded that contact stiffness and perforation load decreased as the panel thickness increased, whereas panels of higher thicknesses exhibited higher energy absorption capacity. Asaee and Taheri [22] proposed a modified analytical model based on the configurations of 3DFMLs and impactor’s geometry to predict the maximum impact force and deformation of the 3DFMLs.
As mentioned above, the 3D-woven sandwich composite panels are formed by glass fibre (GF) which has the low strain to failure; therefore, the focus of recent research has been on the improvement of composite toughness and impact resistance with ideas such as additional reinforcement layer in the face-sheets or foam filling and promotion of core properties. On the other hand, hybridization is one of the strategies to increase the toughening properties of brittle materials such as glass or carbon fibres via using ductile fibres such as polyester and polyamide as a matrix filament [23–27].
In the present study, effects of composite thickness, pile density and the use of hybrid pile yarn on the low-velocity impact behaviour of IWSC panels were investigated. For this purpose, at first, a new wrapping machine has been designed and manufactured to produce co-wrapped hybrid yarns [28]. Then, glass and hybrid composite samples were produced by two different core thicknesses and three different pile densities. The other fabrication parameters for all 3D fabrics were the same. LVI tests have been conducted at an energy level of 8 J, and impact behaviour has been determined as a function of the load–time and load–displacement curves, contact time, absorbed energy and extent of damage.
Experimental procedure
Material and specimen preparation
Hybrid yarn fabrication
In order to fabricate the hybrid pile yarn, GF roving and polyester continuous filament yarn were used with linear densities of 603 and 16 tex (g/km), respectively. Table 1 shows the detailed specifications of yarns.
The specifications of glass and polyester filament yarns.

The geometry of the polyester wrapping filament and the glass core of the hybrid yarn are illustrated in Figure 1. The glass core filament lies straight in the centre of the yarn, and the polyester filament wraps around the core by a helical path to produce a hybrid yarn. The wrapping pitch factor, which is the distance between two successive wraps, is the important specific feature of this hybrid yarn, and it was uniform over the yarn length [28]. One of the important points which have been noted is that the wrapping density of polyester fibre must not have any effect on the GF wetting and resin impregnation.

Co-wrapped glass/polyester hybrid yarn geometry.
3D integrated-woven fabrics
Figure 2(a) shows the schematic representation of a 3D integrated-woven spacer fabric. The structure consists of three distinct layers, two face-sheets with plain weave fabrics, which are integrally connected to each other by means of a core of vertically pile yarns. The pile yarns are connected to the face-sheet in the warp direction and can be seen in the form of the ‘8’ shape and in the weft direction resembling the ‘c’ shape. In this study, all fabrics are identical in terms of their top and bottom-woven fabrics. The warp and weft yarns in all the samples are fabricated by roving of E–GF with a linear density of 600 tex. The composite differences are in their pile density, panel thickness and pile yarn type (hybrid (H) or glass (G)).
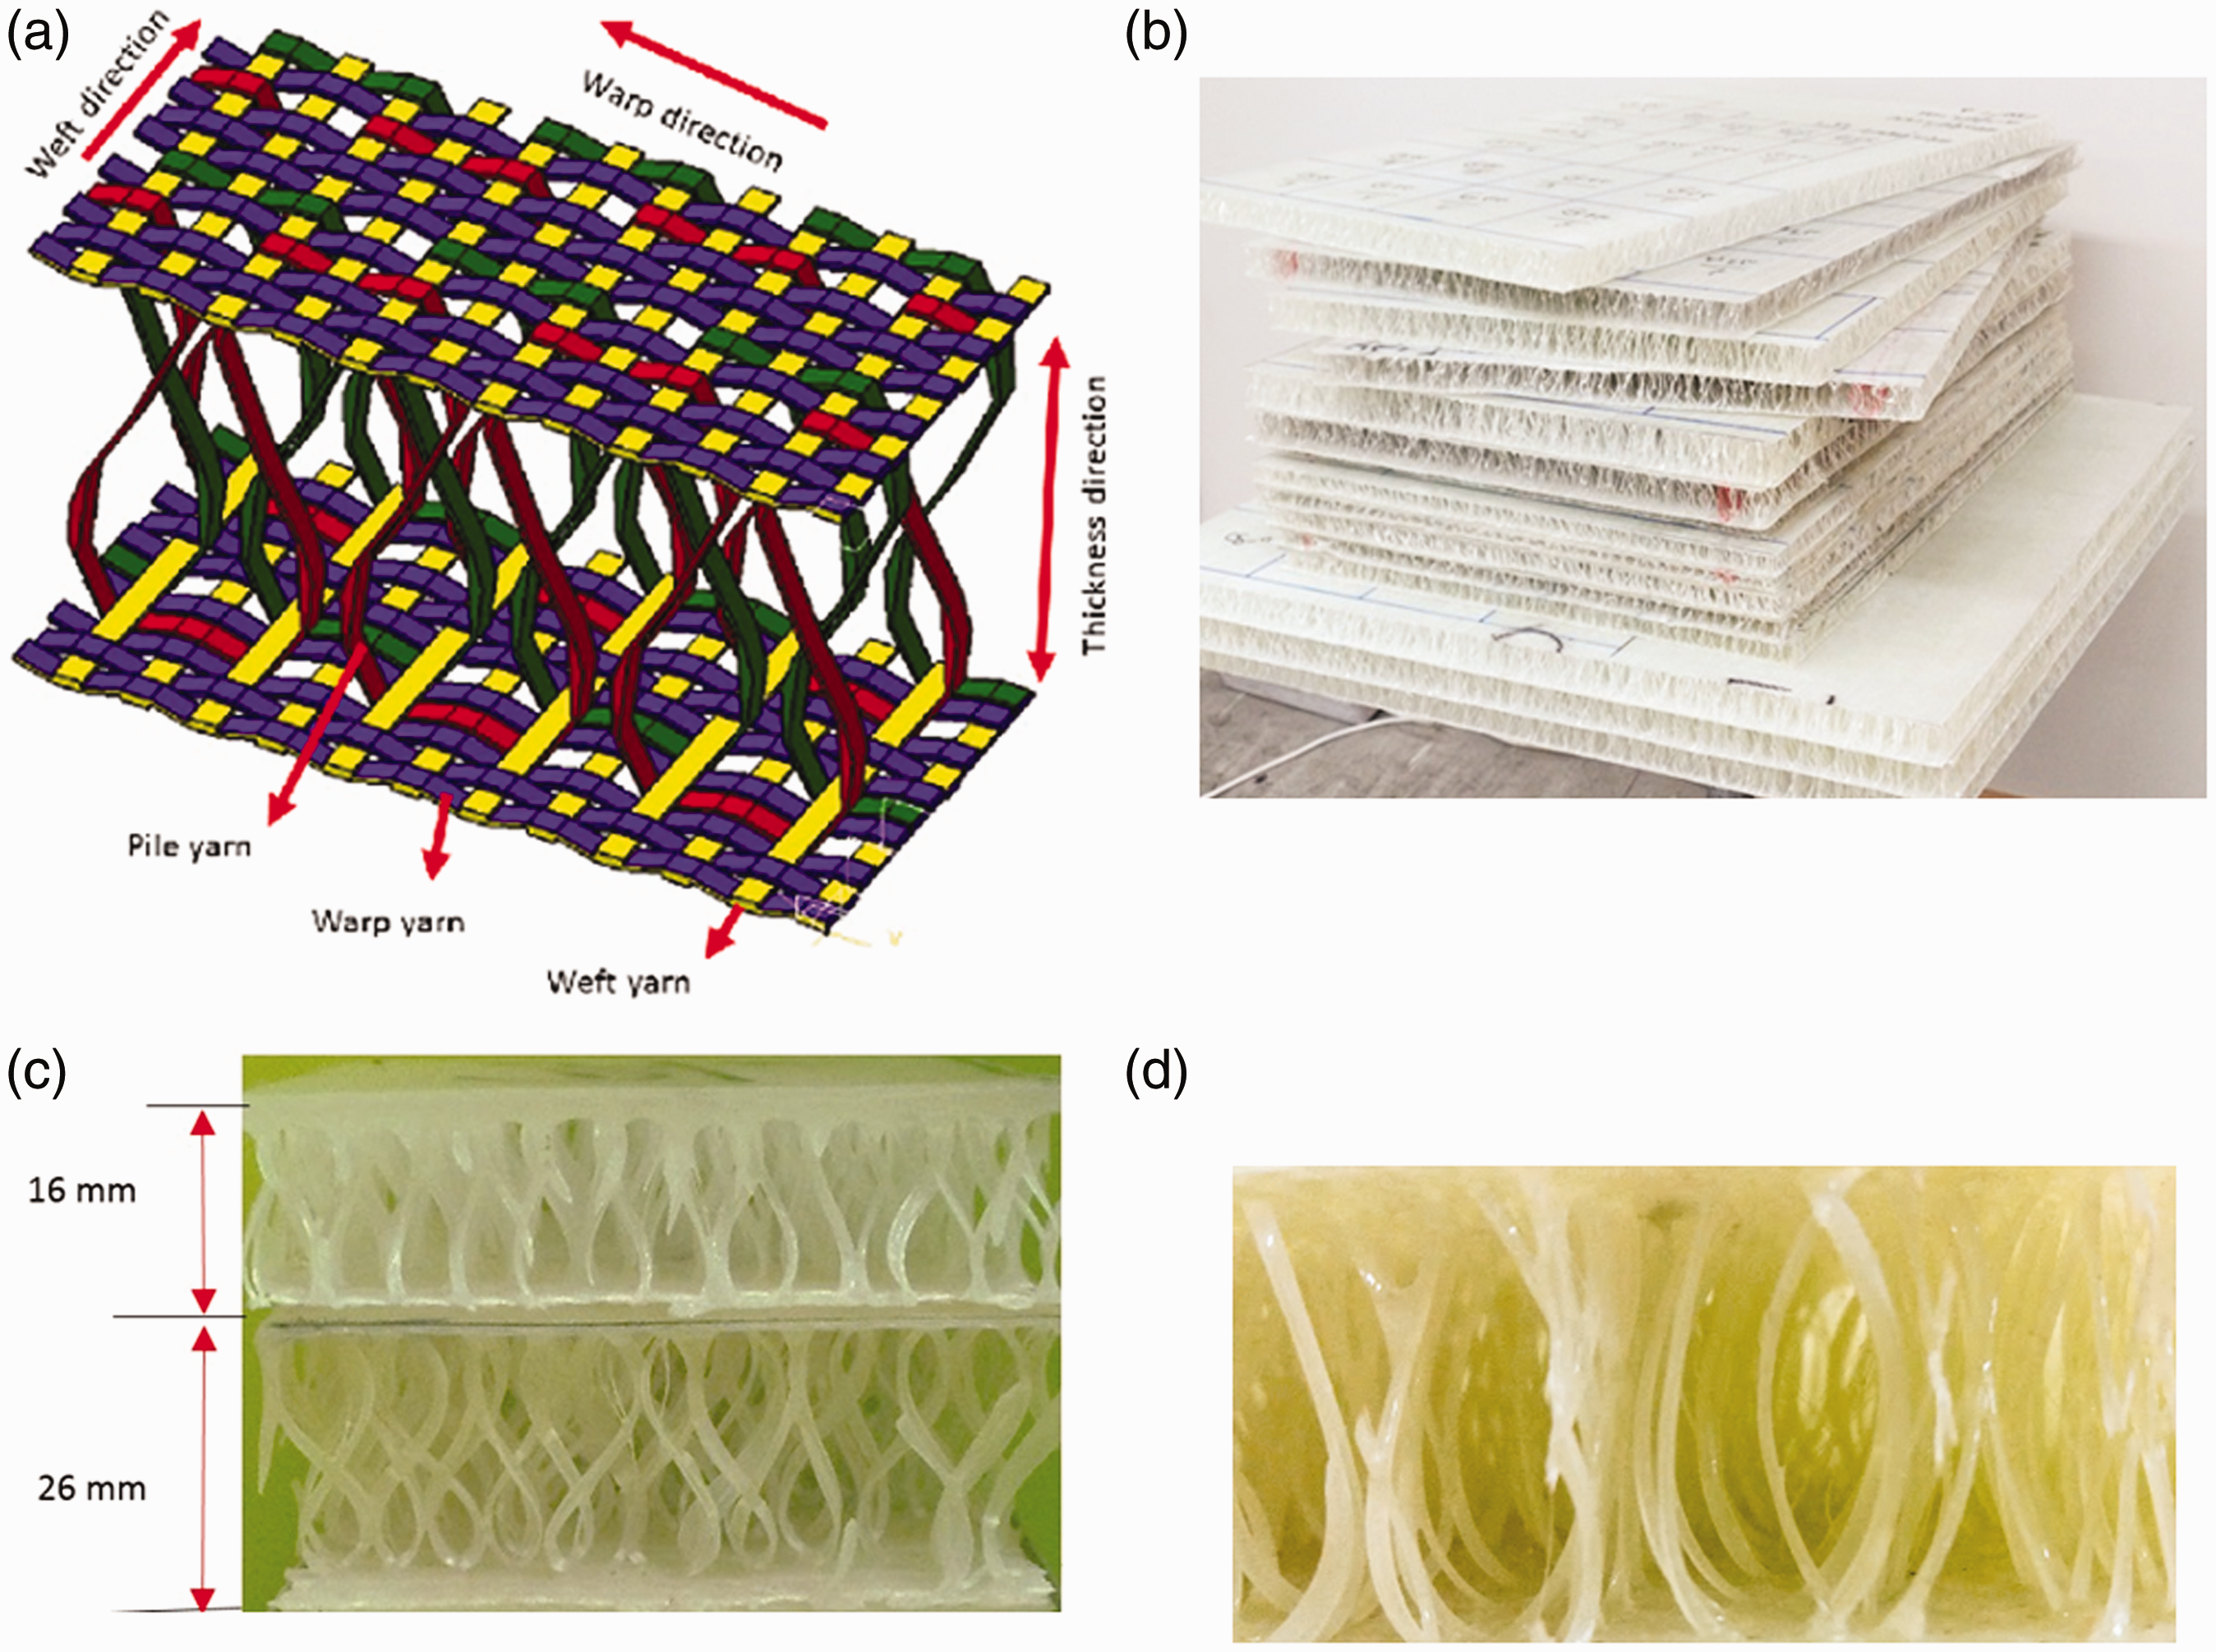
(a) The schematic display of the 3 D fabric structure, (b) typical finished IWSC panels, (c) cross-sectional view of composite in the warp direction, and (d) cross-sectional view of composite in the weft direction.
Fabrication of sandwich composites
In order to fabricate sandwich composite panels, produced fabrics are impregnated with diglycidyl ether of bisphenol F epoxy resin (ML-506) and hardener (HA-11). Panels with two different pile heights (H1 and H2) at three different pile distribution densities (D1, D2 and D3) were fabricated by the hand lay-up technique. The mould was first polished with releasing agent, then about 40% of resin was applied on the mold evenly and the fabric was placed over it. After the resin impregnated the fabric, the remaining 60% of the resin was applied over the top face-sheet. Special care was taken to control the fibre volume fraction and resin penetration to the entire fabric by controlling the ambient temperature and viscosity of resin during the production of each panel in which the resin content of the final panels was 55% in weight. Then, the samples were kept in ambient temperature for 24 h to complete the curing process. Figure 2(b) shows the schematic view of produced panels, and the cross-sectional view of the composite in the warp and weft directions are illustrated in Figures 2(c) and 2(d), respectively. The detailed characteristics of all samples are summarized in Table 2. The 3D-woven fabrics have been fabricated by a modified face-to-face carpet weaving machine.
The main specifications of the finished IWSC panels.
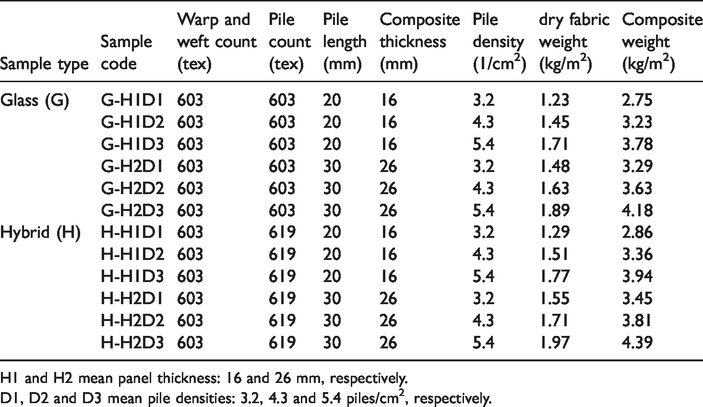
H1 and H2 mean panel thickness: 16 and 26 mm, respectively.
D1, D2 and D3 mean pile densities: 3.2, 4.3 and 5.4 piles/cm2, respectively.
Test methods
LVI test
In the present study, the LVI tests were conducted by using an instrumented drop-weight impact testing machine (Figure 3) according to the ASTM standard D 7136. The impactor tip nose possessed hemispherical shape with a diameter of 12.7 mm. The impact energy and velocity of the impactor can be varied by changing the mass and height of the impactor. All tests were performed by dropping the impactor from a fixed initial height of 25.7 cm. The impactor mass was 2.712 kg, and additional weights were used. Thus, the total mass of impact (the sum of the added weights and impactor mass) was 3.172 kg for an energy level of 8 J. Specimens with 110 × 110 mm dimensions were firmly fixed on all edges by using four clamps with a circular opening of 76 mm diameter. The impactor was released from the chosen height and dropped freely along the guide columns (rails) to ensure that the impactor position is always fixed during the test.

(a) The schematic display of LVI test machine; (b) LVI test setup.
To measure the force–time history for each test, the impactor was equipped with an accelerometer connected to a data acquisition system. The time interval between the recording data was 13 µs. Then, the acceleration was numerically integrated to obtain the velocity and displacement of the impactor according to equations (1) and (2), respectively [29]

The impact energy without considering friction can be calculated as equation (3), where E is the impact energy, m is the mass of the impactor, g is the acceleration of gravity and h is the drop height.
For the drop-weight impact machine, it was empirically proven that 15% of initial incident energy would be lost due to friction. Therefore, real incident energy was computed by considering the friction [30]. At least five specimens were tested for each type of sample. As the impact device was not capable of detecting the velocity of the impactor, therefore, the impactor velocity at the incident point is calculated by the following equations
Therefore
CAI test
The in-plane compression properties of the sandwich composites after impact were measured using the edgewise compression test. For this purpose, all the specimens were subjected to compression to determine their residual strength and post impact properties according to the standard test method, ASTM C364.
The edgewise compression test on the un-impacted samples was also conducted with the same method, which is giving the baseline strength for comparison. The compression test device is shown in Figure 4. Three samples in the warp and weft directions of both the impacted and un-impacted sandwich composites were tested. The samples were put between two rigid steel surfaces under identical edgewise compression conditions. The specimens were fully clamped at two opposite edges, and the fixture contains side supports made of steel bars fastened together for gripping of sandwich samples during the experiment. A sufficient clamp force was implemented to avoid slippage and to prevent the rotation and lateral displacement of the specimens mounted on both clamps without causing pre-deformation during the test process. Special care was given to the alignment of the samples in the test rig. The tests were carried out on a universal testing machine, SANTAM (STM-150), at a loading rate of 1 mm/min.

(a) Edgewise compression test setup; (b) designed fixture.
Results and discussion
In the current study, a total of 12 sample types were tested. Two different core thicknesses (H1, H2), three different pile distribution densities (D1, D2 and D3) and two pile yarn types (hybrid and glass) were used. At least five drop-weight impact tests have been conducted for each type of sample. The detailed results of impact test for all samples are presented in Table 3.
Details of impact test results.

Impact parameters
In order to characterize the main parameters reported in Table 3 and a better understanding the impact behaviour of composite samples, a typical diagram of force, deflection and energy in terms of the contact time, obtained from the LVI testing machine, is presented in Figure 5 [31–33]. As shown in this figure, the important parameters of the impact test are: maximum contact load or peak force (Fmax), which can be defined as the maximum reaction force imposed to the impactor by the specimen, the maximum amount of impactor energy which is in accordance with the maximum deflection (Emax), the total energy absorbed by the specimen during the impact event and is obtained by the integral area under the load–displacement curve (Et), the elastic energy which is defined as the difference between the maximum energy and the total absorbed energy that is not transferred into permanent damage or deformation and is responsible for returning the impactor from the specimen (Ee), maximum deflection (Dmax), residual deflection is the deformation that remains in the specimen during impact and does not return to the initial position (Dr) and contact duration or total duration of the impact event (t) [31–33].
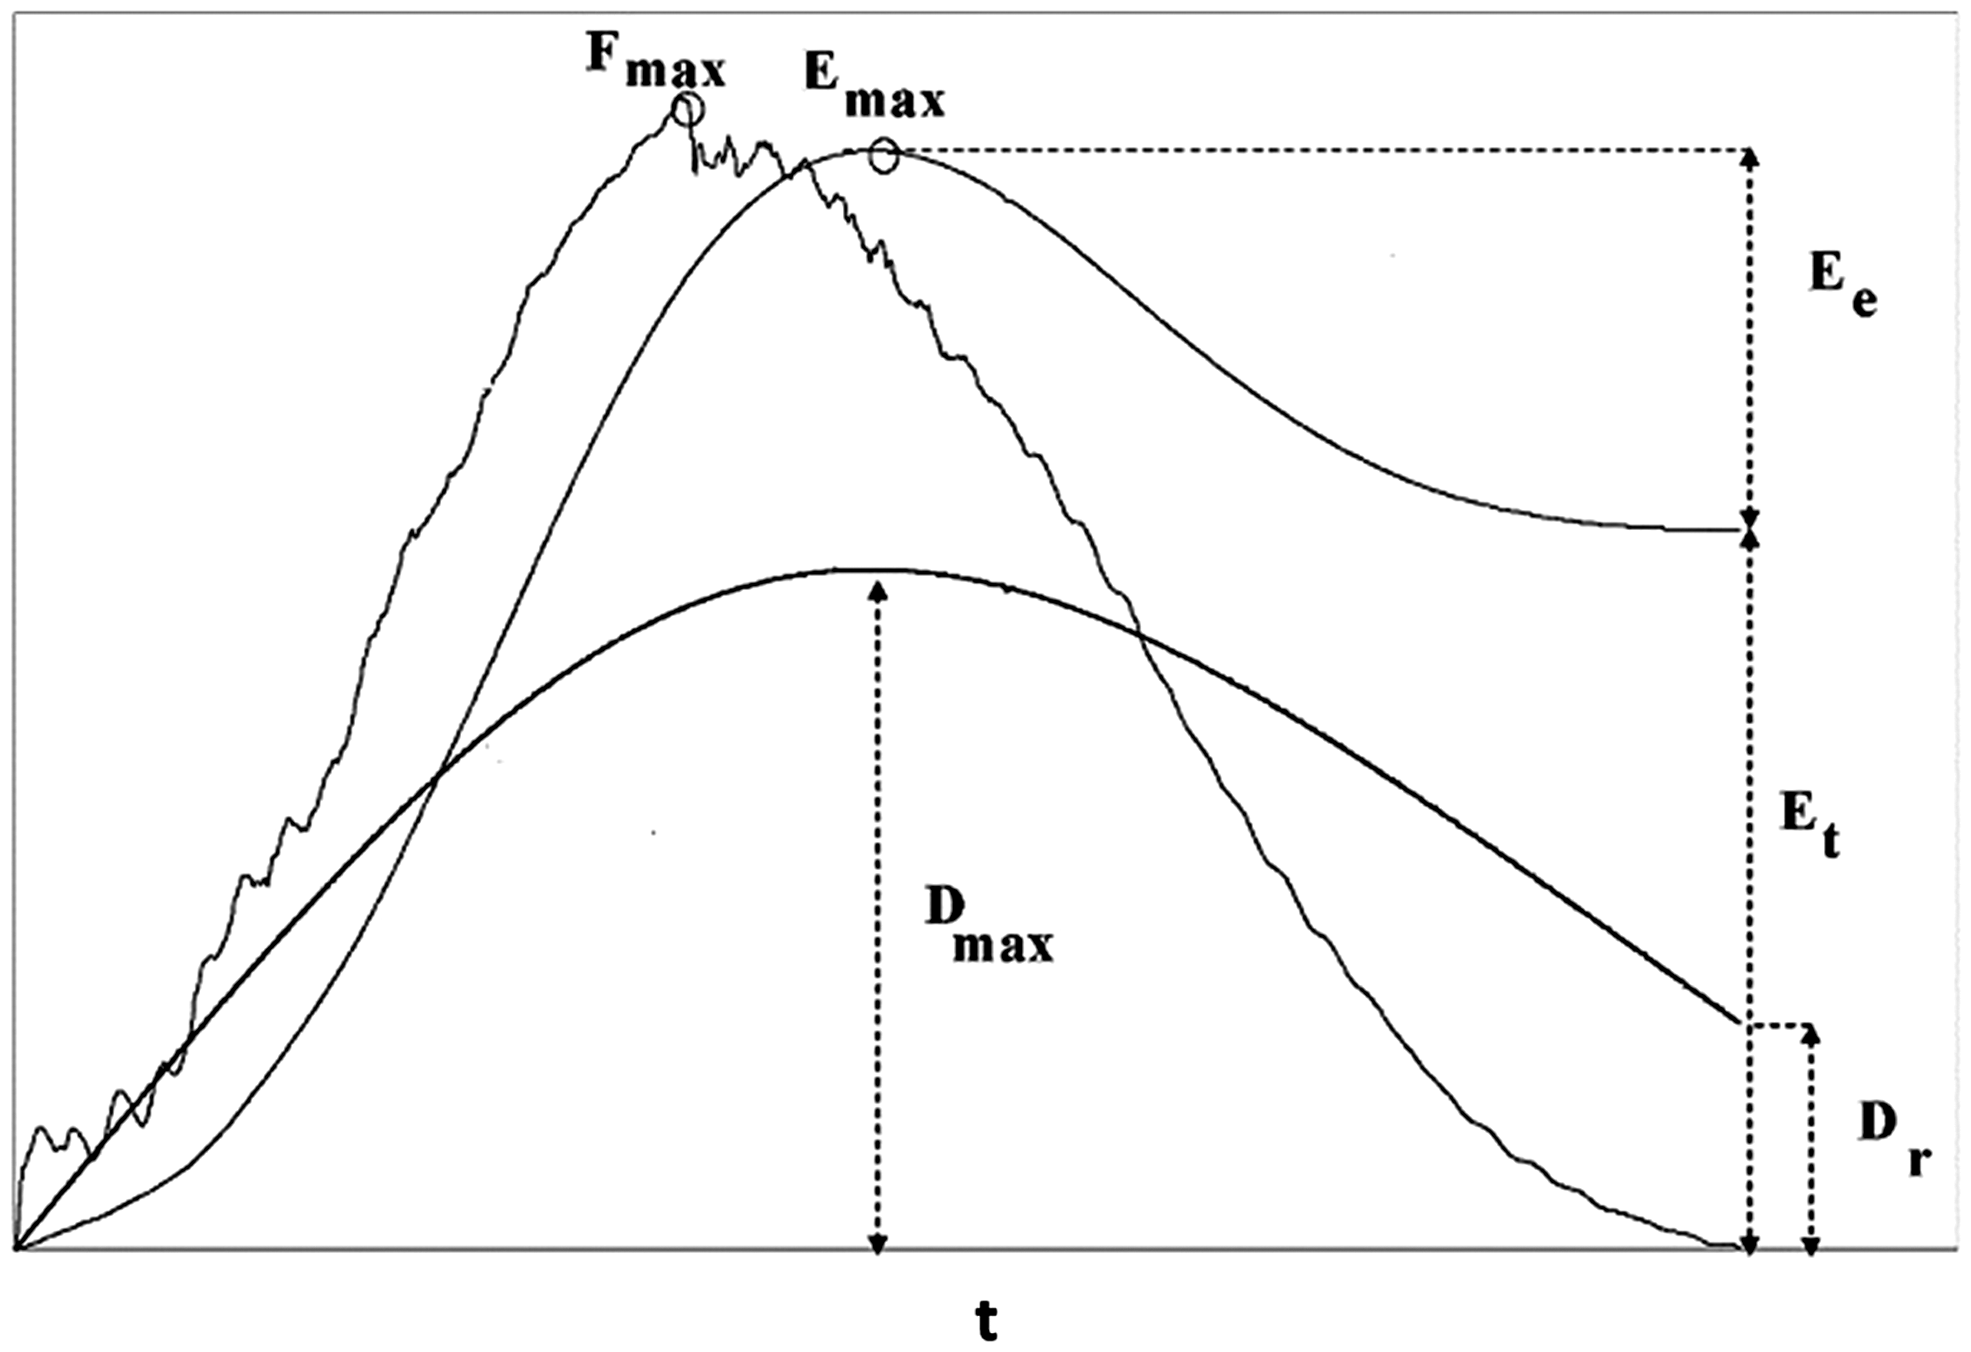
Typical representation of force-energy-deflection versus time curves from low velocity impact test.
The impact response of different materials can be quantified in term of ductility index or damping index (DI). The ratio of the absorbed energy Et to elastic energy Ee is defined as the DI and is calculated as DI = Et/Ee. The DI is an excellent dimensionless parameter which is used to characterize the material structure, extent of damage and impact response of different materials subjected to impact loading. Small values of DI index are identified as an indication of less damage and vice versa [31–33].
Force–time curves and load histories
The load–time curves of the LVI test of the hybrid and glass samples conducted at 8 J are presented in Figures 6 and 7 for specimens of 16 and 26 mm thickness, respectively. The impact energy of 8 J was adopted in such a manner that the impactor did not penetrate completely through the top face-sheet, and no perforation took place on any of the samples. The general trend of all curves is similar, but there are differences between their details, which are affected by the core pile structure and properties. It is useful to note that the trend of all curves was similar, and each of the presented experimental curves was selected among at least five impact test results as its contact force was the most nearest to the mean specimen’s value in order to assure that the presented graph is the best representative for that specimen.

Typical impact load-time curves of glass and hybrid sandwich panels with 16 mm thickness.

Typical impact load-time curves of glass and hybrid sandwich panels with 26 mm thickness.
As shown in Figures 6 and 7, small load drops and reversal before the peak load are largely due to matrix cracking and buckling of the piles in the core. This phenomenon reveals that damage is generated in the composite. Furthermore, the unloading regions of plots show load drop and some oscillations. Generally, oscillations on the load–time curves of the impact tests are used to interpretate the extent of damage in the composites [34–37].
The results indicated that for 16 mm curves, the load increases with time until it reaches its maximum peak, in which the failure in the top face-sheet is started, and then decreases and load drop occurs in these samples until the curves reach zero. The largest reversal and abrupt changes after the peak load occurred, especially for G-H1D2 and G-H1D3 samples. These specimens showed two peak loads which means that slight penetration took place during the impact events. Throughout the penetration, the top face-sheet was torn up and significant skin damage took place. Therefore, the vertical piles under the impact point buckled and compressed. As a result of compaction of tilted piles, impact loads are transferred to the bottom face-sheet. Then, they start to resist against the impactor, which accordingly results in the second considerable peak load.
The minor load drops following the first and second peak loads correspond to the buckling of the core piles. The first and second peak loads are related to impact resistance of face-sheet and bottom skin, respectively. In comparison to samples with 26 mm thickness, the 16 mm samples curves contain many oscillations especially after the first peak load as a result of formation of matrix cracking and pile buckling.
As it is observed in Figure 7, the load-time curves in the 26 mm samples have an ascending section up to peak load followed by a descending section. In comparison with the 16 mm thickness samples, the transient load response curves have a mountain-like-shape with only one peak load and no indication of large load reduction. This indicates that as a result of top skin resistance, the core section has been damaged, and the significant damage has not taken place in the top face-sheet. On the other hand, the loading and unloading regions of load–time response are nearly equal and symmetric, which exhibit that the panels are essentially undamaged. Similar behaviour has been reported in the literature on the effect of panel thickness [20,21].
In addition, as can be seen from Figures 6 and 7, as the core pile density is increased, the curve oscillations are increased, which means that the extent of damage is augmented.
In comparison to glass samples, the load–time curves of hybrid composites show smooth loading and unloading, and less vibration in their graphs has been seen. This reveals that the slight fibre breakage occurring in the top face-sheet and the buckling of hybrid pile yarns is reduced in comparison to glass pile yarns, and the response of the hybrid composites is more ductile than glass samples.
Peak force
The peak load values of glass and hybrid composite samples are given in Figure 8. The graph suggests that by increasing the panel thickness, the amount of maximum force decreases which has been reported in previous studies [20,21]. Also, the results showed that the peak load values are increased by increasing the pile density.

Peak force of glass and hybrid composites.
It is clear that all peak force values of glass composites are higher than those of hybrid samples. The findings indicate that the highest peak load among the glass and hybrid samples has been obtained for the G-H1D3 sample, which has the lowest thickness and maximum pile density. On the contrary, the hybrid sample H-H2D1, which has the maximum thickness and lowest pile density, exhibits the minimum peak force.
As the top face-sheet of all samples is identical, the impact resistance of IWSC sandwich panels is dominated by the compression properties of core piles. Previous research has shown that the compression strength of IWSC panels is decreased remarkably by increasing the pile length and therefore the panel thickness [6]. On the other hand, pile distribution density has a dominant effect on the mechanical properties of IWSC panels. The low pile length with a high distribution density provided the best compressive strength [6].
In hybrid samples, pile hybridization causes the reduction of core stiffness and therefore withstands the impact load in a ductile manner. These findings suggest that the hybrid composites bear the applied load up to a higher deflection and failure occurs in a ductile manner because of the high elongation of the polyester fibre in the pile structure, and as a result, the impact force decreases for hybrid samples.
The obtained results have been statistically evaluated with the ANOVA test at a 95% confidence interval. The findings indicate that the changes in panel thickness and pile densities and the use of hybrid pile in the core section have a statistically significant effect on the variation of the peak load.
Contact duration
The contact duration of impact tests, which can be determined as the contact time between impactor nose and specimen, are outlined in Figure 9 (also see Table 3). The time interval between the recording data of the drop weight impact testing machine was 13 µs. The total duration of the impact event from the start of impact event until the point of impactor rebounding was approximately about 11–18 ms for all impact tests.

Contact duration of glass and hybrid composites.
It is apparent from this figure that the contact time values increase with an increase in panel thickness which has already been reported in the literature [20,21]. In addition, the contact duration decreases with an increase in pile density. Additionally, it can be seen that contact duration of hybrid composites is consistently higher than those of glass composites. The least contact duration is generated by the G-H1D3 composite (10.45 ms), and the contact duration value of H-H2D1 composite (17.65 ms) is higher than those of the other composites.
As discussed in the previous sections, when the panel thickness is increased, the stiffness of the core of the 3 D sandwich composite decreases, and so the deformation and contact time are augmented. Likewise, as the stiffness is increased in the case of composites with high pile density, the contact time is decreased.
It is clear that all contact duration values of glass composites are smaller than those of hybrid samples. These results are attributed to the low elongation and brittle nature of the glass fibre. By comparing the difference between the duration of impact event for glass and hybrid composites, it is concluded that the difference between the contact time of the glass and hybrid samples was strongly influenced by the stiffness of the composite sandwich panels which is related to the pile yarns.
By considering Figures 6 and 7, it is further concluded that the time to first peak load was increased with an increase of panel thickness. However, it seems that the time for first peak load is independent of the pile distribution densities and the pile types (hybrid or glass), and no significant difference has been observed.
The obtained results have been statistically evaluated with the ANOVA test at a 95% confidence interval. The findings indicate that the changes in panel thickness and pile density and the use of hybrid pile in the core section have a statistically significant effect on the changes of contact duration.
Maximum and residual deflections
The load-deflection and deflection-time curves of composite samples are shown in Figures 10 and 11 (see also Table 3). After the force exerted by the impactor on the specimen during the impact event, the pile buckling under the impact point occurred, and this results in the deformation of core section.
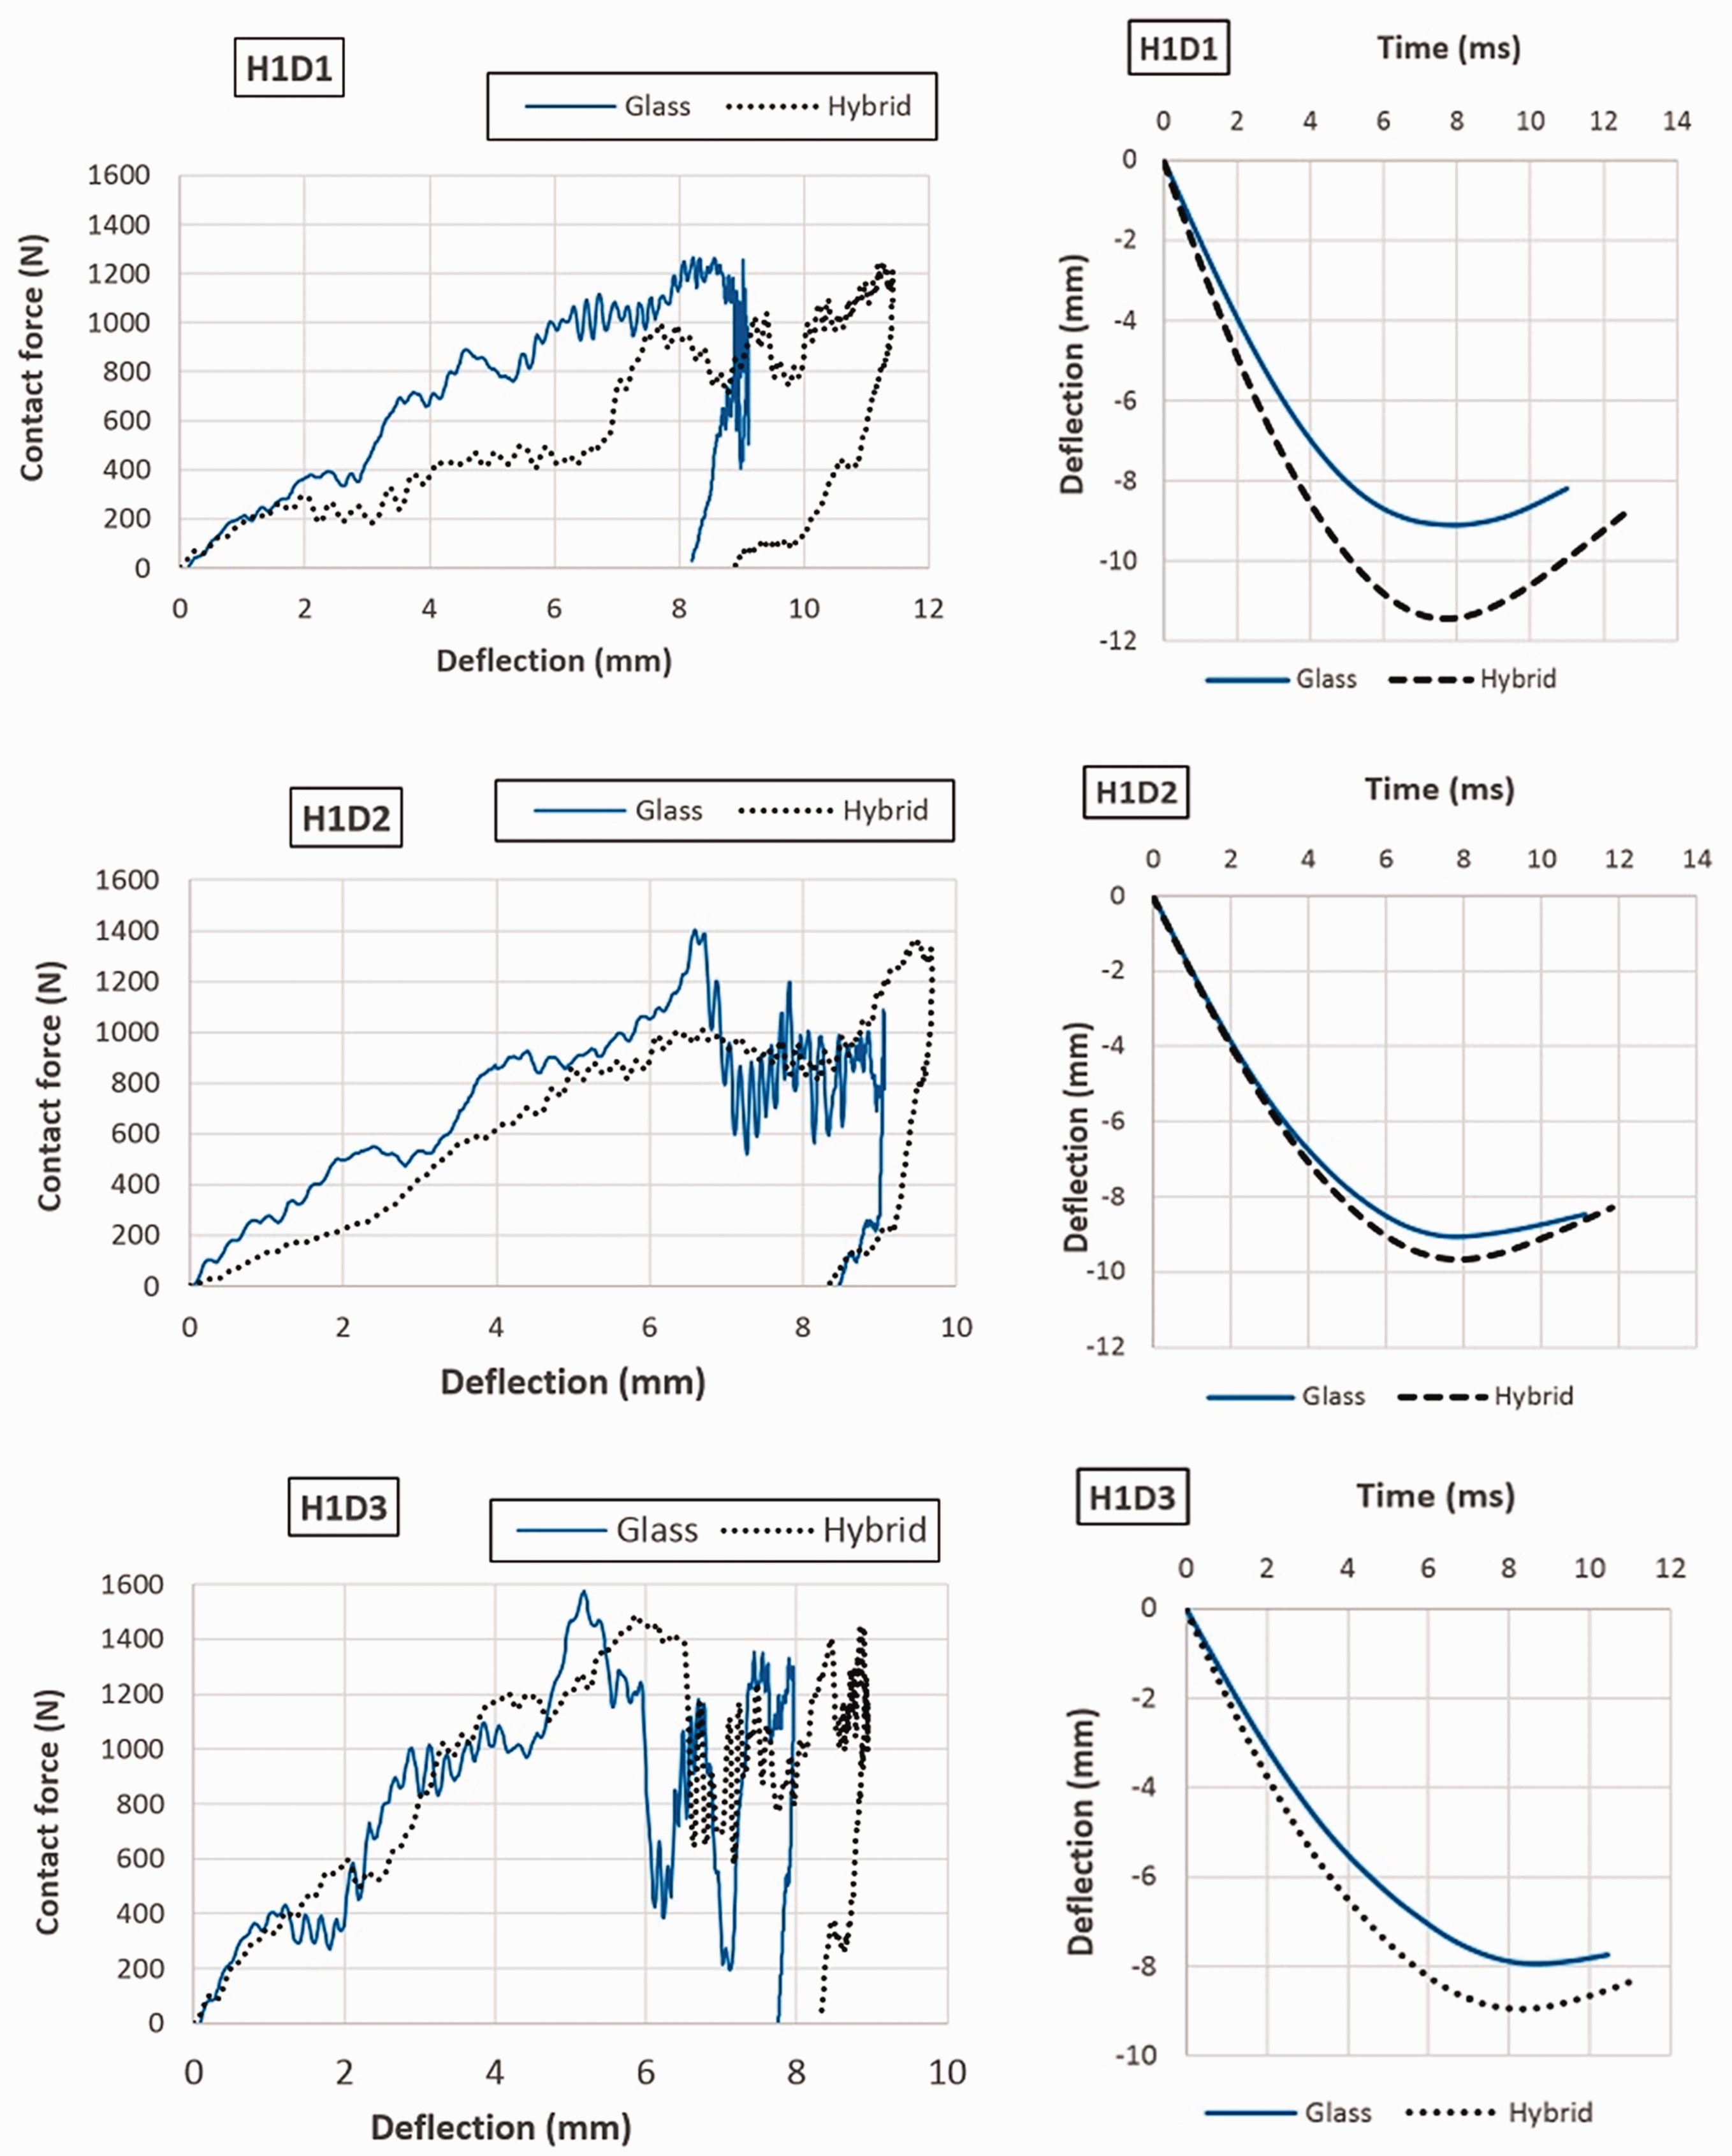
Typical contact force-deflection and deflection-time curves of glass and hybrid sandwich panels with 16 mm thickness.
It is remarkable that by increasing the panel thickness, the maximum deflection increased. Similar results have been reported in the literature [20,21]. In addition, it can be seen that by increasing the pile density, the amount of maximum deflection decreases. The results indicate that the maximum deflection of hybrid samples is higher than those of glass composites. As can be seen in Figures 9 and 10, the minimum and maximum deflection of the specimens is related to G-H1D3 and H-H2D1 samples, respectively.
As the core stiffness decreased, the piles are easily buckled, and the support of the top face-sheet will be reduced. Therefore, the greater flexibility of core results in larger deformation during the impact test.
Glass composites are more rigid and therefore offer small deflection. On the contrary, hybrid composites with a glass/polyester hybrid core pile become less stiff and exhibit large deflection. After the maximum load and at the rebounding section of load–displacement curves, the deflection decreases but as a result of permanent deflection, they do not reach zero value or initial position, and therefore resultant residual deflection will be observed.
The 16 mm composite samples have residual deflection around their maximum deflection. Although the hybrid samples have larger deflection, the difference between residual deflection of the glass and hybrid sample is not statistically meaningful. The H-H2D1 hybrid sample has maximum deflection and minimum residual deflection. Also, as for the G-H1D3 glass sample, perforation takes place during the impact test, and the face-sheet of the specimen tears up and does not return to its initial position. Hence, the maximum deflection of the composite remains nearly permanent. Also, the load–deflection curves of impact test give important information in terms of absorbed energy, which is the area under the load–deflection curves and will be discussed in the next section.
The obtained results have been statistically evaluated with the ANOVA test at a 95% confidence interval. The findings indicate that the changes in panel thickness and pile densities and the use of hybrid pile in the core section have a statistically significant effect on the changes of maximum deflection.
Impact damage evaluation
Figures 12 and 13 represented the view of damage regions on top face-sheet at the point of impact for all hybrid and glass panels. The photographs of the surface damage were taken using a digital camera. Although the bottom face-sheet contributes to impact load bearing, no visible damage took place in the bottom face-sheet of all sandwich panels at 8 J energy level. The types of damage in all samples are approximately identical and in the form of matrix cracking, with the fibre breakage on the top face-sheet and core pile yarn buckling and breakages below the impact point. The top face-sheet stiffness of all panels is the same. Therefore, the core strength and resistance to impact loading determine the type and size of composite damage.

Typical contact force-deflection and deflection-time curves of glass and hybrid sandwich panels with 26 mm thickness.
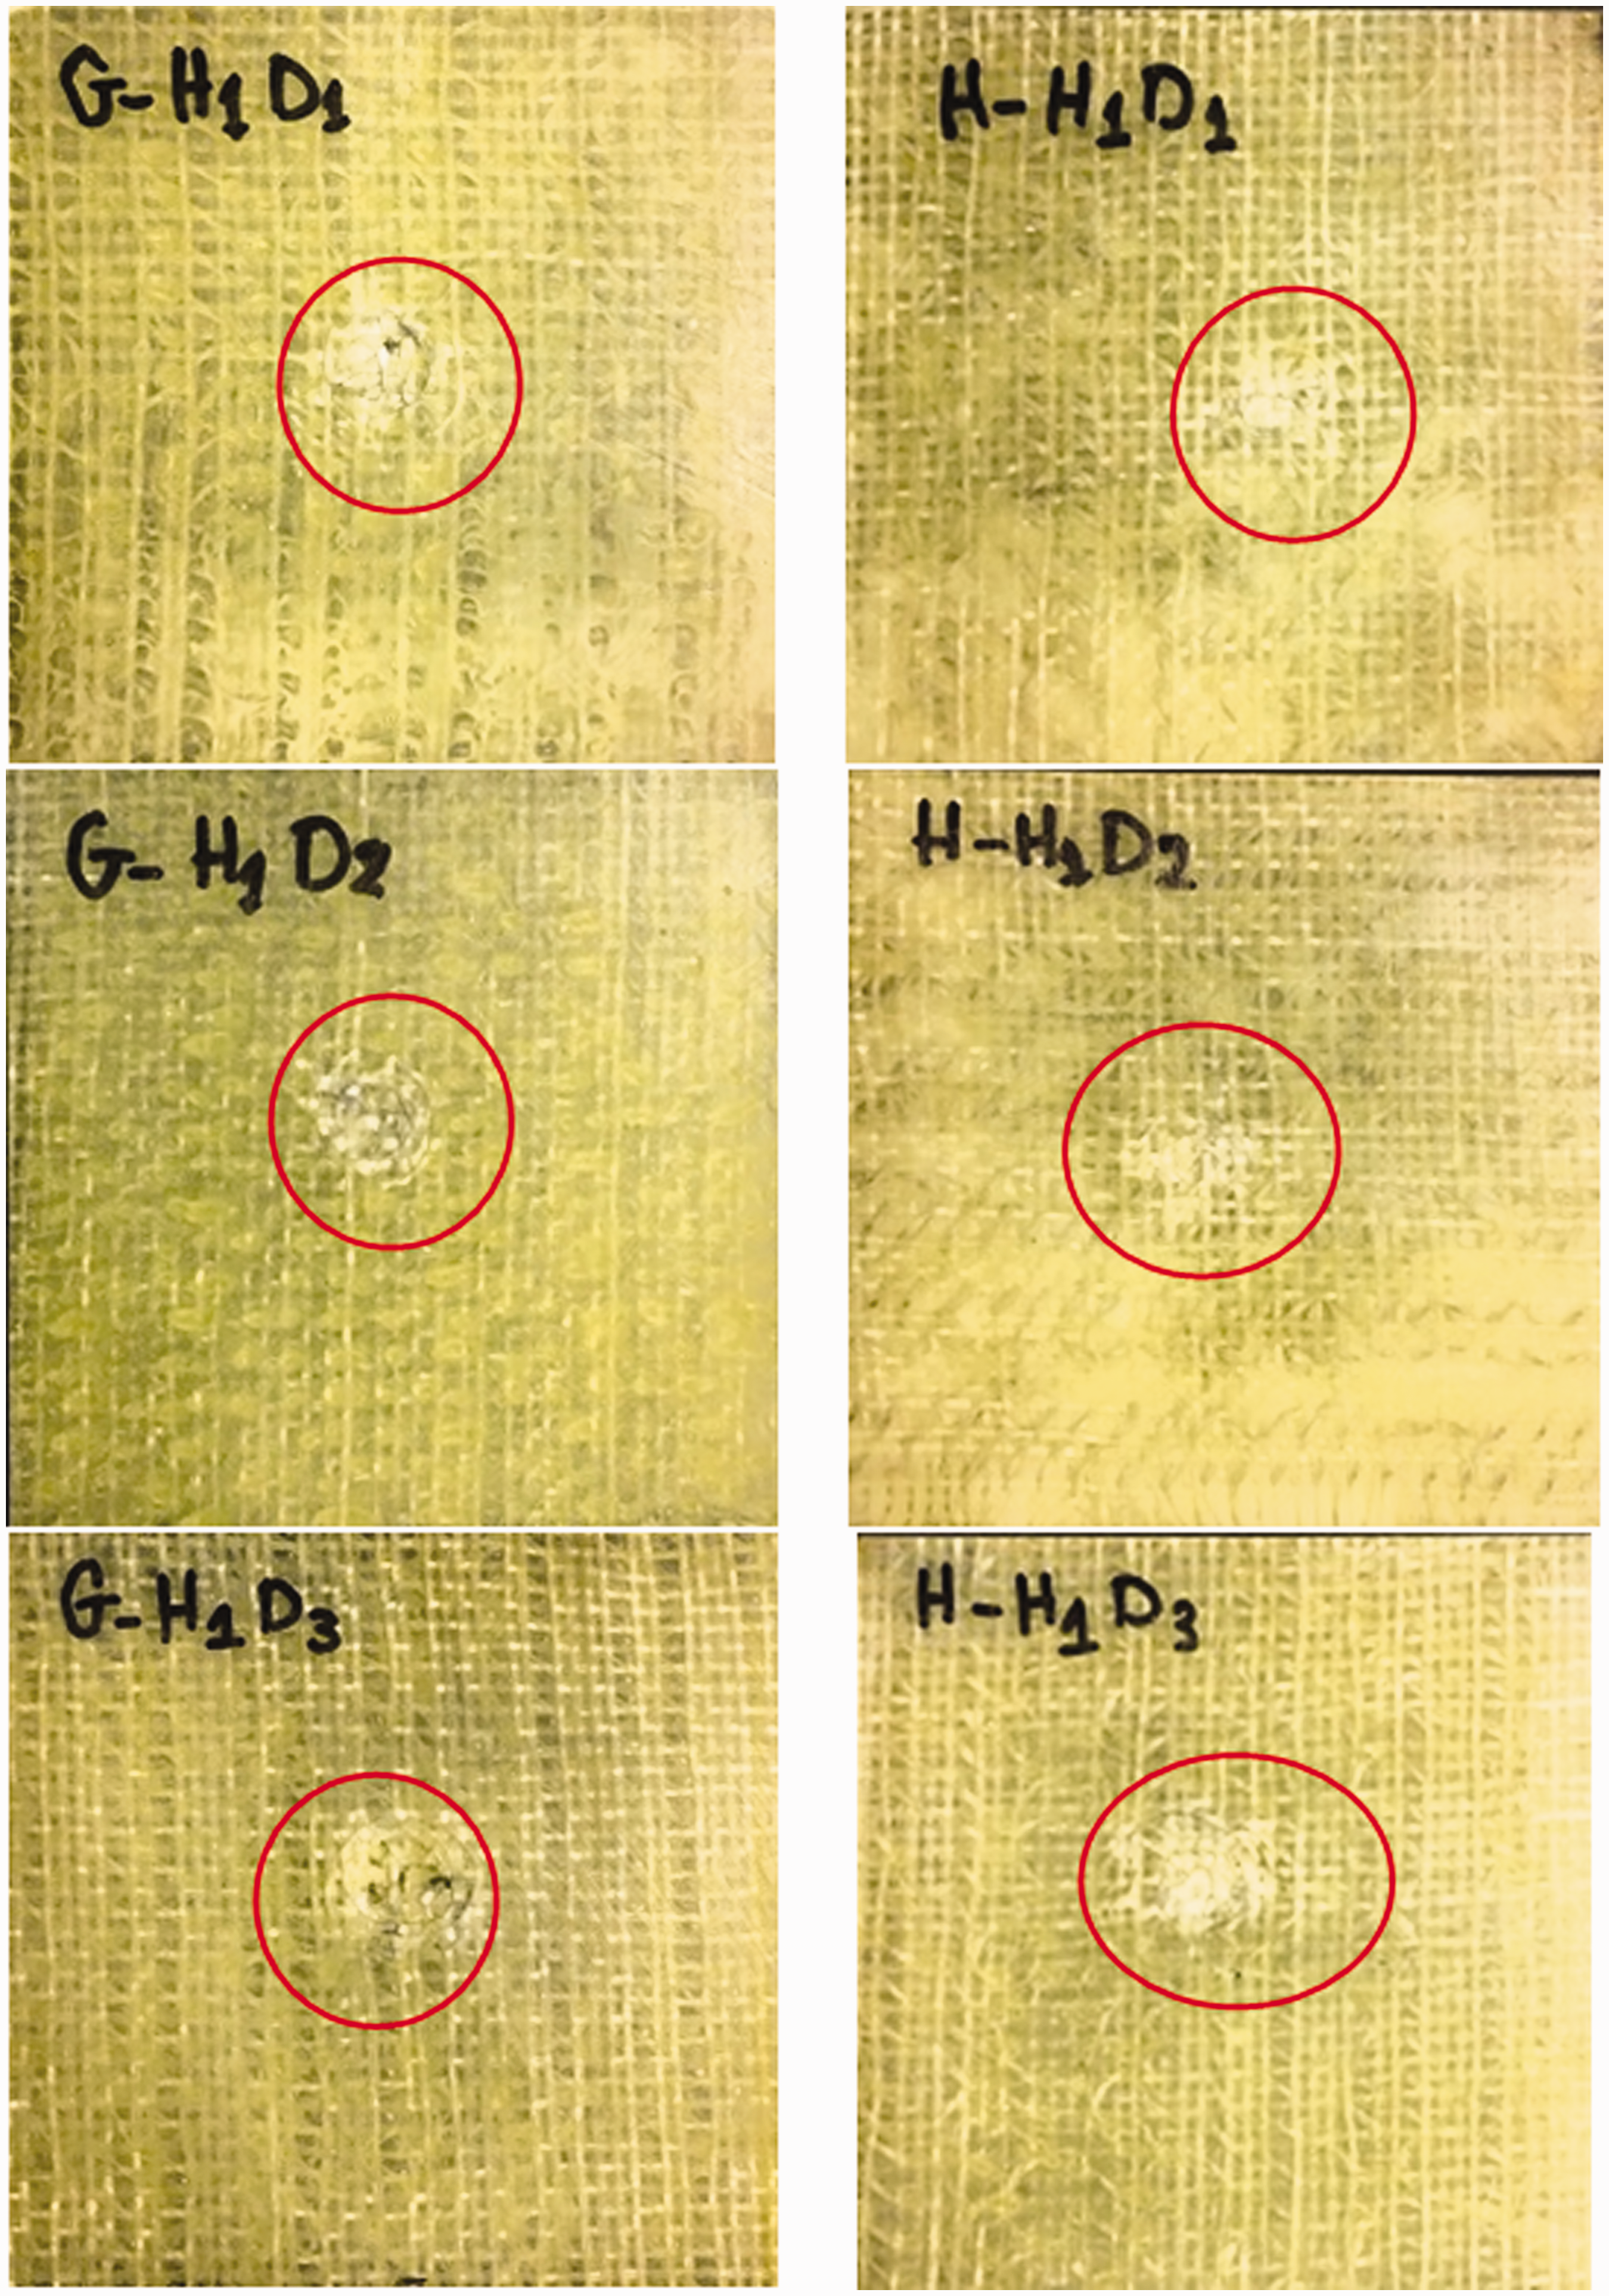
Damage region on 16 mm panel thickness of glass and hybrid composites.

Damage region on 26 mm panel thickness of glass and hybrid composites.
At each panel thickness, the damage characteristics of samples are almost the same. For 16 mm panel thickness, the impacted face-sheet shows severe local damage, and the damage area is slightly larger than the diameter of the impactor, which reduces the local stiffness of the sandwich panels. In these samples, as the core has higher stiffness and compression strength, the damage is localized under the impact point [18–20].
As can be seen in Figure 12, in sample G-H1D3, the top face-sheet has been completely torn up, but the impactor did not perforate through the top face-sheet and stopped by the rebound force.
For 26-mm sandwich panel thickness, there is no visible dent at the point of impact, and it only exhibits matrix cracking on the top face-sheet. It seems that this matter does not result in considerable top face-skin stiffness reduction.
As was discussed in the previous sections, by increasing the panel thickness, the core stiffness is decreased. These features resulted in the composite to bear the applied impact load up to a higher deflection. In this state, more piles are incorporated in load bearing and damage spreads on the top face-sheet. Therefore, the damaged area increased with the panel thickness increment. On the other hand, although residual deformation took place (see Figure 11), no penetration was found, and the impactor easily rebound back from the skin surface. These results were similar to what has been reported by other researchers [18–20].
As the distance between the pile yarns in the weft direction is larger than the warp direction, when the panel is impacted, the damage on the top face-sheet took place along the warp direction.
In the glass sample, the core is brittle, and due to the strain rate dependency of GF, the extent of occurred damage was higher than that of hybrid composites. While the polyester fibre increased in the hybrid composite, the energy dissipation and ductile properties of core section and damage spread over the top face-sheet. Thus, in hybrid samples, the penetration will occur at a high energy level.
Although hybrid composites performed better than the glass composites in terms of impact damage, as was discussed in ‘Peak force’ section, the maximum bearing load by glass composites was a little more than that of the hybrid composites. Due to the elastic properties of core piles, after the impact loading, the core piles of 26 mm IWSC panels spring back to their initial position. Details of failure modes of specimens under impact loading are summarized in Table 4.
Failure modes of specimens under impact loading.

Symbol ‘
Symbol ‘–’ indicate that mode of failure was not seen.
Energy absorption
As was discussed in ‘Impact parameters’ section, elastic energy is the amount of impact energy which remains unchanged and returns back to the impactor, so is responsible for returning the impactor from the specimen. As it can be deduced from Table 3, with an increase in panel thickness and a decrease in the pile distribution densities as well as pile hybridization, the elastic energy is increased. As no perfectly elastic bounce back occurred for any of the samples, therefore, in all the specimens, a part of the impactor energy was spend to creation of damage.
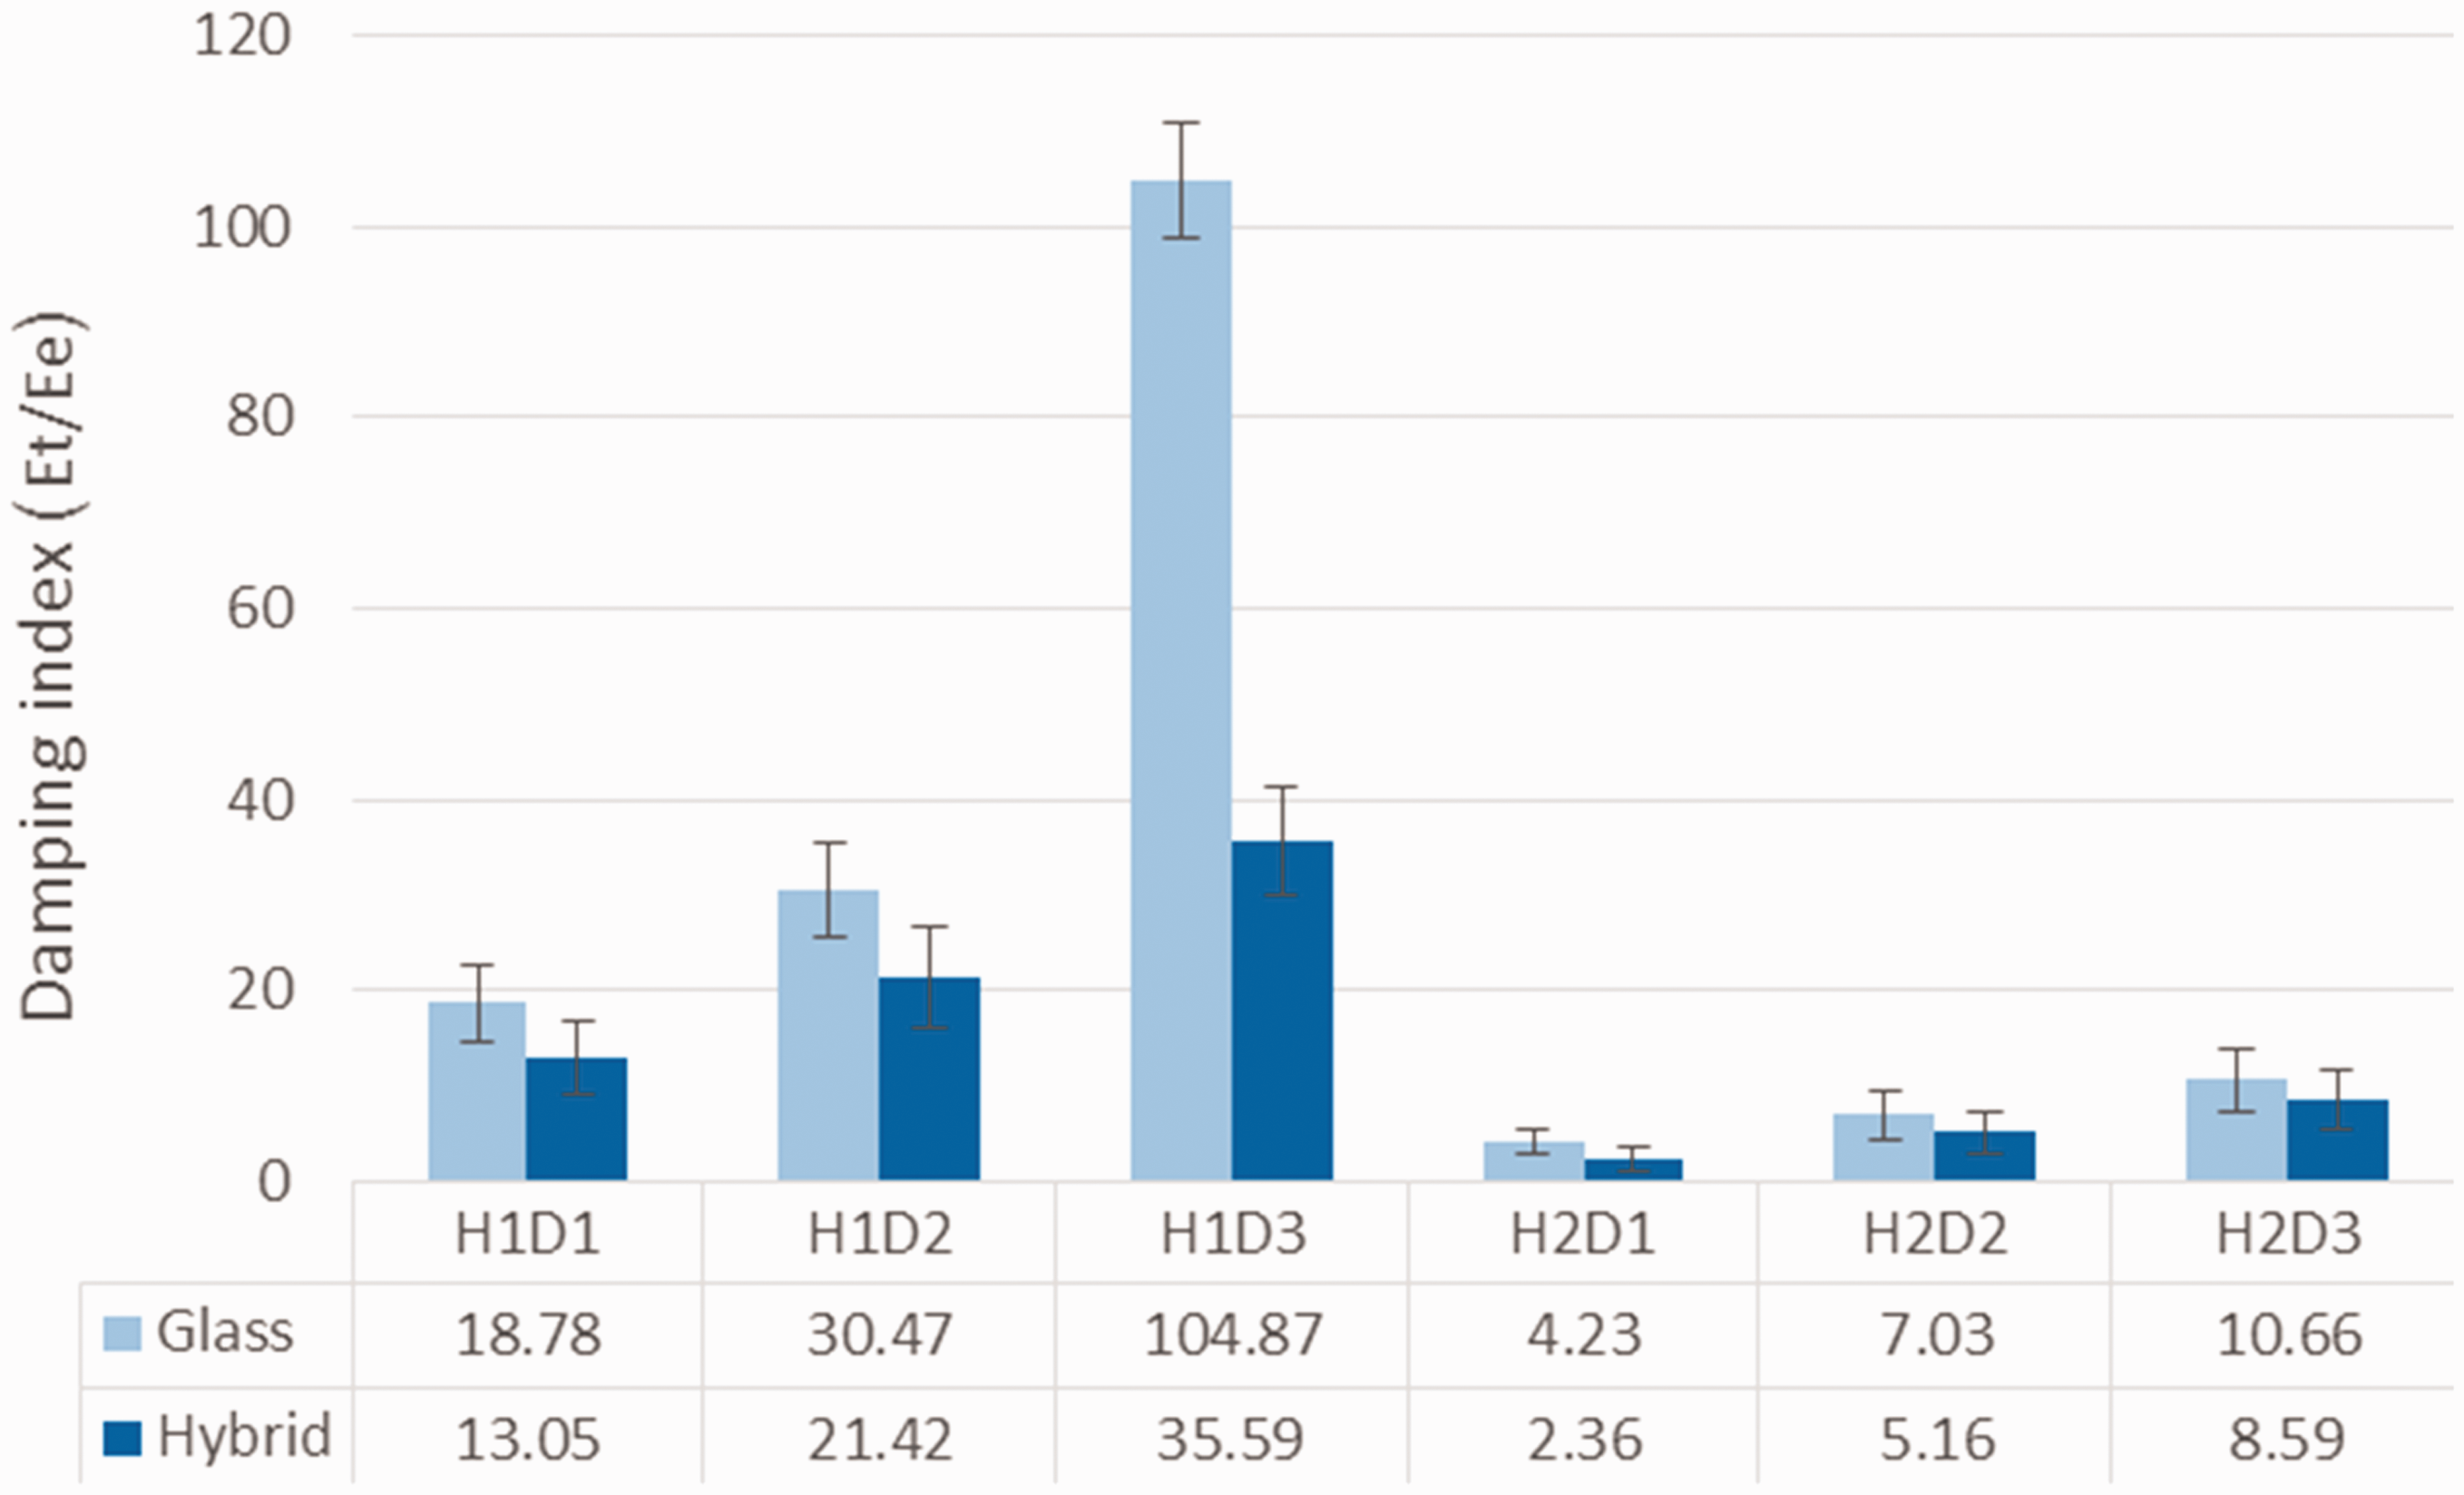
The absorbed energy which is responsible for the generation of damage in the composite samples is contrary to the elastic energy. These two parameters simultaneously demonstrate the extent of created damage. For qualifying the response of different materials subject to impact loading, the DI is determined by Et/Ee [33]. From Figure 14 (see also Table 3), it can be seen that the values of DI increased considerably by decreasing the panel thickness.
DI of glass and hybrid composites.
Sample G-H1D3 shows the maximum absorbed energy, so the DI of this specimen is very large. This means that almost all of the impactor energy is used for composite deformation, and there is a small elastic energy that returns back to the sticker; therefore, this sample has the worst impact performance. The DI of the current sample is very large (104.87). Also, the lowest total absorbed energy and the minimum DI is related to the H-H2D1 sample, which means that this specimen has the best impact performance. In addition, the results indicate that by increasing the core pile density, the values of the DI are increased.
The hybrid composites have a lower total absorbed energy and DI than the glass ones. This indictes that as a result of plastic deformation of piles, the required energy for damage creation of hybrid samples is higher than those of glass composites. On the other hand, the damping properties of hybrid composites are better than those of the glass samples. In addition, in terms of DI, the difference between the results of hybrid and glass composites for 16 mm panel thickness is significantly higher than 26 mm panel thickness.
The obtained results have been statistically evaluated with the ANOVA test at a 95% confidence interval. The findings indicate that the changes in panel thickness and pile densities and the use of hybrid pile in the core section have a statistically significant effect on the variation of the DI.
Residual mechanical properties
The CAI test was used to evaluate the extent of damage and residual compression properties of composites [34,37]. As the 3D IWSC panels have a core layer, some of the internal impact damage is not visible on the outer face-sheets of the composite. However, the produced damage can result in reduction of the edgewise compression strength of the specimens.
Due to the anisotropic behaviour of IWSC composite structures, the mechanical properties of these types of composites are different in the weft and warp directions [6]. Therefore, in order to assess the residual compression properties, an edgewise compression test in the warp and weft direction was carried out.
Figures 15 and 16 compare the results of edgewise compression properties of glass and hybrid composites in the warp and weft directions, before and after the impact test. The results showed that the impact damage noticeably affected the residual compressive properties of the composites. In this case, the reduction of compression properties in the glass samples is higher than the hybrid samples.

Edgewise compression properties of glass composites before and after impact: (a) warp direction; (b) weft direction.

Edgewise compression properties of hybrid composites before and after impact: (a) warp direction; (b) weft direction.
In glass composite samples, it can be seen that the range of load drop was 15–32% in the warp direction, 18–36% in the weft direction for 16 mm panel thickness, 11–13% in the warp direction and 13–15% in the weft direction for 26 mm panel thickness.
In hybrid composite samples, it is revealed that the range of load drop was 11–21% in the warp direction, 15–23% in the weft direction for 16 mm panel thickness, 8–11% in the warp direction and 11–14% in the weft direction for 26 mm panel thickness.
As can be seen in Figures 15 and 16, it is concluded that for samples with 16 mm panel thickness, the amount of lost compression properties is larger than 26 mm panel thickness.
The obtained results have been statistically evaluated with the ANOVA test at a 95% confidence interval. The findings indicate that the changes in panel thickness and the use of hybrid pile yarn in the core section have a statistically significant effect on the variation of the compression strength after impact. Also, there is no evident relationship between the pile density and the compression strength after impact.
Conclusion
In the present study, the effects of composite thickness, pile density and the use of hybrid pile yarn on the low-velocity impact behaviour of IWSC panels at an energy level of 8 J were investigated. Based on the results, it can be concluded that: By increasing the panel thickness, the amount of maximum impact force was decreased. Also, the results showed that increasing the pile density increases the peak load values. In the hybrid samples, pile hybridization causes reduction of the core stiffness, and as a result, the maximum impact force decreased. It is remarkable that by increasing the panel thickness, the maximum deflection and contact time values are increased. In addition, it can be seen that by increasing the pile density, the amount of maximum deflection and contact duration decreases. Furthermore, the results indicate that the maximum deflection as well as contact duration of hybrid samples is higher than those of glass composites. It is concluded that as the core stiffness decreased, the piles are easily buckled, and the support of the top face-sheet will be reduced. Therefore, the greater flexibility of the core section results in larger deformation and higher contact duration time during the impact test. Based on the results, as the core thickness decreased and the pile density increased, the extent of damage is increased. In glass samples, the core is brittle, and due to the strain rate sensitivity of GF, the extent of occurred damage is higher than that of hybrid composites. It can be deduced that with increasing the panel thickness and decreasing the pile distribution density as well as pile hybridization, the elastic energy increased and the absorbed energy and therefore, the DI are decreased. The CAI test results showed that the impact damage noticeably affected the residual compressive properties of the composites. In this case, the reduction of compression properties in glass samples is higher than the hybrid samples. Also, as the panel thickness decreased and the pile densities increased, the reduction of compression property is noticeable.
Footnotes
Acknowledgements
The authors would like to acknowledge the Noavaran Sanate Sialk Kashan Co. for their technical assistance and production of fabric preforms and sandwich composite panels. The authors would also like to extend their thanks to Nafis Nakh Co. for providing the polyester filament yarns.
Declaration of conflicting interests
The author(s) declared no potential conflicts of interest with respect to the research, authorship, and/or publication of this article.
Funding
The author(s) received no financial support for the research, authorship, and/or publication of this article.