
Abstract
This study proposes a methodology that enables the comparison of textile materials from the point of view of corresponding comfort. Although this study focuses on textile materials used for the construction of car seats, the approach can be used more broadly. First, different aspects, which are more or less closely connected with our problem, are discussed. Among them, two characteristics, i.e. temperature conductivity and breathability, are important. Second, we discuss why it is important to have conclusions about comfort based not only on the subjective feelings of evaluators, but also on objective measurements. To that purpose, an experiment and a questionnaire summarising subjective feelings are proposed and concisely described. Furthermore, the choice of sensors, their placement in a car seat and the manner of recording data are discussed. Finally, the choice of appropriate statistical methods suitable for the analysis of collected data is discussed. The approach is illustrated via real experiments. Our findings support the current trend that the use of 3D spacer fabrics improves both breathability and sitting comfort in general.
Introduction
The reliability and standards of the car industry have reached high levels around the world. Most manufacturers use similar parts or technologies for the engines, brakes, suspension and electronics. However, aside from technical progress, there is considerable demand for driving controls, safety and comfort. Most car users focus on sitting comfort, which is closely related to the heat and moisture transport through car seats. Sweat on the driver’s back makes the ride uncomfortable especially after a few hours of driving.
Car seat comfort has many aspects, such as the aesthetic look of the car seat, correct pressure distribution to spread the mass of the driver evenly, sensory comfort and thermophysiological comfort. Car seat comfort is an important factor that affects not only the driver’s feeling, but also driver’s performance, and focus on the vehicle’s driving control process. Car seat comfort is also an important aspect of the safety of overloaded vehicle and the overall comfort of the driver himself/herself. The quality of car seats has many aspects, namely, the correct distribution of pressure on the driver’s lower body and back, the car’s rigidity in terms of deformations, the sensory comfort of the car seat that covers the correct seating position of the driver (especially the back rest) and the steering wheel and the control pedals. One of the decisive factors of car seat comfort is thermophysiological comfort, which involves the proper transport of heat and moisture from the skin towards the car seat. Heat and moisture transport should ensure the optimal conditions for the body surface sitting on the car seat. Thermophysiological comfort in luxury cars is ensured by in-blowing or out-blowing fans, including built-in air conditioning. However, the vast majority of cars use passive car seats as standard, which is the subject of the study.
The main goal of our research is to compare the driver’s subjective and objective thermophysiological comfort of different materials used to construct car seats. In our research, one classical material and one high-standard material were used. To fulfil such a task, we developed a new and unique measurement technology of both heat and moisture transport and transfer in car seats and proposed data analytical tools that will help us answer the question: Is the new textile material used for the construction of car seats more comfortable than the previous textile material? Our ideas and the technologies used are concisely described in the remainder of the paper. More precisely, the Experimental samples and Measuring system sections describe the samples, sensors and arrangement of sensors in the car seat and the measuring system and data registration, respectively. The Data analysis of objective measurements and Data analysis of subjective measurements sections are devoted to the statistical analysis of the measurements and summarise the results of both ‘objective’ and ‘subjective’ analyses. Finally, Conclusions section summarises the most important findings of this study.
Aspects of human comfort in a specific car’s cabin environment
Despite the fact that comfort is a basic and universal necessity of human beings, it is difficult to define. Several authors [1,2] define comfort as a pleasant state of psychological, physiological, neurophysiological and physical harmony between the environment and human beings. To achieve the feeling of comfort, the human body requires a fairly narrow range of environmental conditions compared with the full scope that can be found in a car cabin. Moreover, the activity and concentration of human beings is directly affected by comfort [2]. The human micro-climate is an important factor in maintaining and preserving the optimal driving ability. Metabolic activity and/or oxidation of foods cause the production of heat [2]. Crew in a car cabin usually does not have to work hard but is exposed to changes of environmental conditions that are sometimes quite fast. The main determinants of the response to thermophysiological comfort of crew sitting in a car cabin are air temperature, relative humidity (RH), heat (thermal) radiation from the sun, air movement, activity level and clothing [3–6]. The secondary determinants are personal characteristics, such as age, sex, health or stress. The body core temperature of human beings is 36.5°C with the tolerance of ±0.5°C under different climatic conditions. Any change in the ambient conditions leads to a response from the body [7]. The transdermal moisture diffusion is approximately 100–150 ml/day/m2 of skin surface, representing a heat loss of 6%, which is similar to that of evaporation from a fully wetted surface. Psychological stress is another driving force of the sweating mechanism [1]. Humans under stress sweat profusely as a result of emotional excitement and strong mental activity [7].
Automotive textiles for car seats
The car seat is the most important part of the interior of a car cabin, because car seat comfort is one of the most valuable criteria for the customer. Modern car seats have to have not only an attractive design but must also meet specific design criteria for safety reasons and provide ‘optimum comfort properties’. Automotive textiles have to fulfil some additional specific technical requirements according to the purpose of their use and application. A middle-sized vehicle uses between 12 and 14 kg of textile products, with car seat upholstery weighing between 350 and 450 g/m2 for the car seats upholstery [8]. The design, aesthetics, feel and comfort are important considerations for automotive textiles. The textiles for interior furnishing are primarily made of woven, weft knitted, warp knitted, tufted, laminated and nonwoven fabrics [9]. The future trend for car seats is to replace foam with new textile materials that are able to match various constraints such as resilience and resistance to fatigue and have better comfort properties. Generally, car seats are composed of the following elements: metal structure, filling cushion and car seat cover. The car seat cover consists of exterior fabric, foam (interlining) and support material (reinforcement material). Polyurethane (PUR) foam is commonly used as padding in car seats. The new trend of using 3D spacer fabrics improves the breathability of car seat materials and enhances the sitting comfort. In contrast to regular 2D fabrics, spacer uses two separate fabrics joined by microfilament yarn to create a breathable 3D free space between layers [10]. Spacer structures have an elastic pressure behaviour. For the car seat cover on top of the cushion part of the car seat, many manufacturers observed that a three-layer composite fabric is most appropriate upholstering or trimming material for the car seat because of its good performance and affordable cost. The most commonly used three layers are composed of a top layer of polyester (PL), a middle layer of PUR foam and a bottom layer of knit scrim material, which provide dimensional stability to the sandwich structure. Several authors [11] investigated the performance of car seat fabrics according to their compression and recovery properties, which affect the sitting comfort. They also mentioned other properties, such as air permeability, water vapour resistance and thermal resistance, that also affect the physiological comfort of sitting. Their results showed that the 3D spacer fabric is currently one of the best options for automotive car seat covers.
Thermal characteristics of textiles
The thermal characteristics of textile fabrics can be defined by three basic properties, namely, thermal conductivity λ (A m−1 K−1), thermal resistance Rct (m2 K W−1) and thermal effusivity e (W S1/2 m−2 K−1). With some simplification, we can say that thermal conductivity represents the capability of the material, i.e. textile fabric, to conduct heat. Thermal resistance depends on the ratio of the thickness and thermal conductivity of the fabric. Thermal effusivity is an important property because it mediates the warm or cool feeling from touching the fabric. Immediately after the first contact between human skin and textile fabric, heat exchange starts between human skin and textile fabric under the condition that there is a difference in temperature. These characteristics depend on other properties, such as textile structure, fabric density, mass density, specific heat capacity, thickness of the fabric and other material properties and ambient conditions. All of the previously mentioned factors have an effect on comfort. The standard [12] describes an interpretation of the conditions of thermal comfort, which expresses a satisfactory thermal environment. This means that thermal comfort is a state of balance, in which heat loss is the same as heat gain. We can write the heat balance equation as follows [13]

The metabolic rate is always positive because the human body always produces heat. However, for a person sitting in a car seat, the last parameter Qk is the most important because it represents the direct transfer of heat from the human body to the car seat. It is worth to note that approximately 35% of the body surface is in direct contact with the car seat. Therefore, the thermal properties of the car seat layers (textile or leather) have an important influence on seating comfort, as confirms also [14], and this study is focused on transferring heat by conduction. The heat loss of passengers via heat conduction to the car seat has an important role in the heat balance of passengers. Thus, observing the changes of temperature in the interlayer of textile cover seat is important.
Liquid and moisture transfer in car seat covers
Particles of water vapour move through textiles because of the difference between water vapour concentration and pressure. Textiles and fibres absorb water vapour because of their internal chemical compositions and structures. The flow of liquid moisture through textiles is caused by the fibre liquid molecular attraction at the surface of fibre materials, which is determined mainly by surface tension and effective capillary pore distribution and pathways. The temperature and humidity distributions depend on the progress of evaporation or condensation [15].
Liquid and moisture transfer mechanisms in fibrous textiles include [16] vapour diffusion in the void space, absorption, transmission and desorption of water vapour by the fibres, adsorption and migration of water vapour along the fibre surface, transmission of water vapour by forced convection.
All of the previously mentioned factors of heat and mass transfer have an effect on comfort and are affected by fabric parameters. Recall that liquid transfer through textile medium happens when the fibre surface becomes wet and later transported through the internal pores by means of capillary action.
Experimental samples
Description of the samples
For the evaluation, we used two car seats with the same internal construction and design. The first car seat (driver’s seat), called ‘Standard’, was covered with a sandwich structure consisting of PL twill fabric on top, PUR reticulated foam (approximately 7 mm thick) in the middle and jersey knitted layer at the bottom. The second car seat (co-driver’s seat), called ‘Standard+’, was covered with a sandwich structure consisting of PL twill fabric on top, nonwoven layer (approximately 3 mm thick) in the middle and spacer warp-knitted fabric (approximately 4 mm thick) at the bottom. The specifications are summarised in Table 1, and the cross sections of both sandwich structures are displayed in Figure 1.
Technical specifications of the textile sandwich of car seat covers.


Cross sections of the textile sandwich of car seat covers: (a) Standard and (b) Standard+.
Arrangement of sensors in the car seat
The objective measurement of the thermophysiological comfort of car seats during long-term sitting was realised by integrating the temperature and humidity sensors directly into the textile sandwich of the car seat cover. The sensors were placed in the back seat cover, so that their presence did not affect the transfer of heat and moisture from the human body to the car seat and did not negatively affect the subjective sitting comfort of the test subjects. The active side of the sensors was directed towards the human body, and the active humidity holes of the sensors were oriented in the expected direction of heat and moisture transfer from the human body to the car seat.
The position of the sensors integrated into the car seat is selected in such a way that there is no free space between the human body and the car seat (there is only a layer of clothing and car seat cover). The sensors are located in the individual rows in the back rest as shown in Figure 2, including their spacing in the individual layers of the back rest. The sensors integrated into two different layers enable to obtain data and monitor the speed and amount of heat and moisture transferred to the other parts of the car seat.

(a) Schematic representation of the location of the sensors in the textile sandwich of the car seat cover (view from the side of the cover). (b) Schematic representation of the position of the sensors in the area of the cover surface (view from the back of the car seat cover). (c) Position of the sensors in the real car seat cover before it is assembled (view from the backside of the car seat Standard+).
Description of the sensors
For each seat, the sensor SHT21 has been deployed in five sequences of three sensors in each row. One additional sensor for each car was placed separately and reserved for measuring the ambient conditions in the cabin. A real view of the integrated sensors is shown in Figure 3.
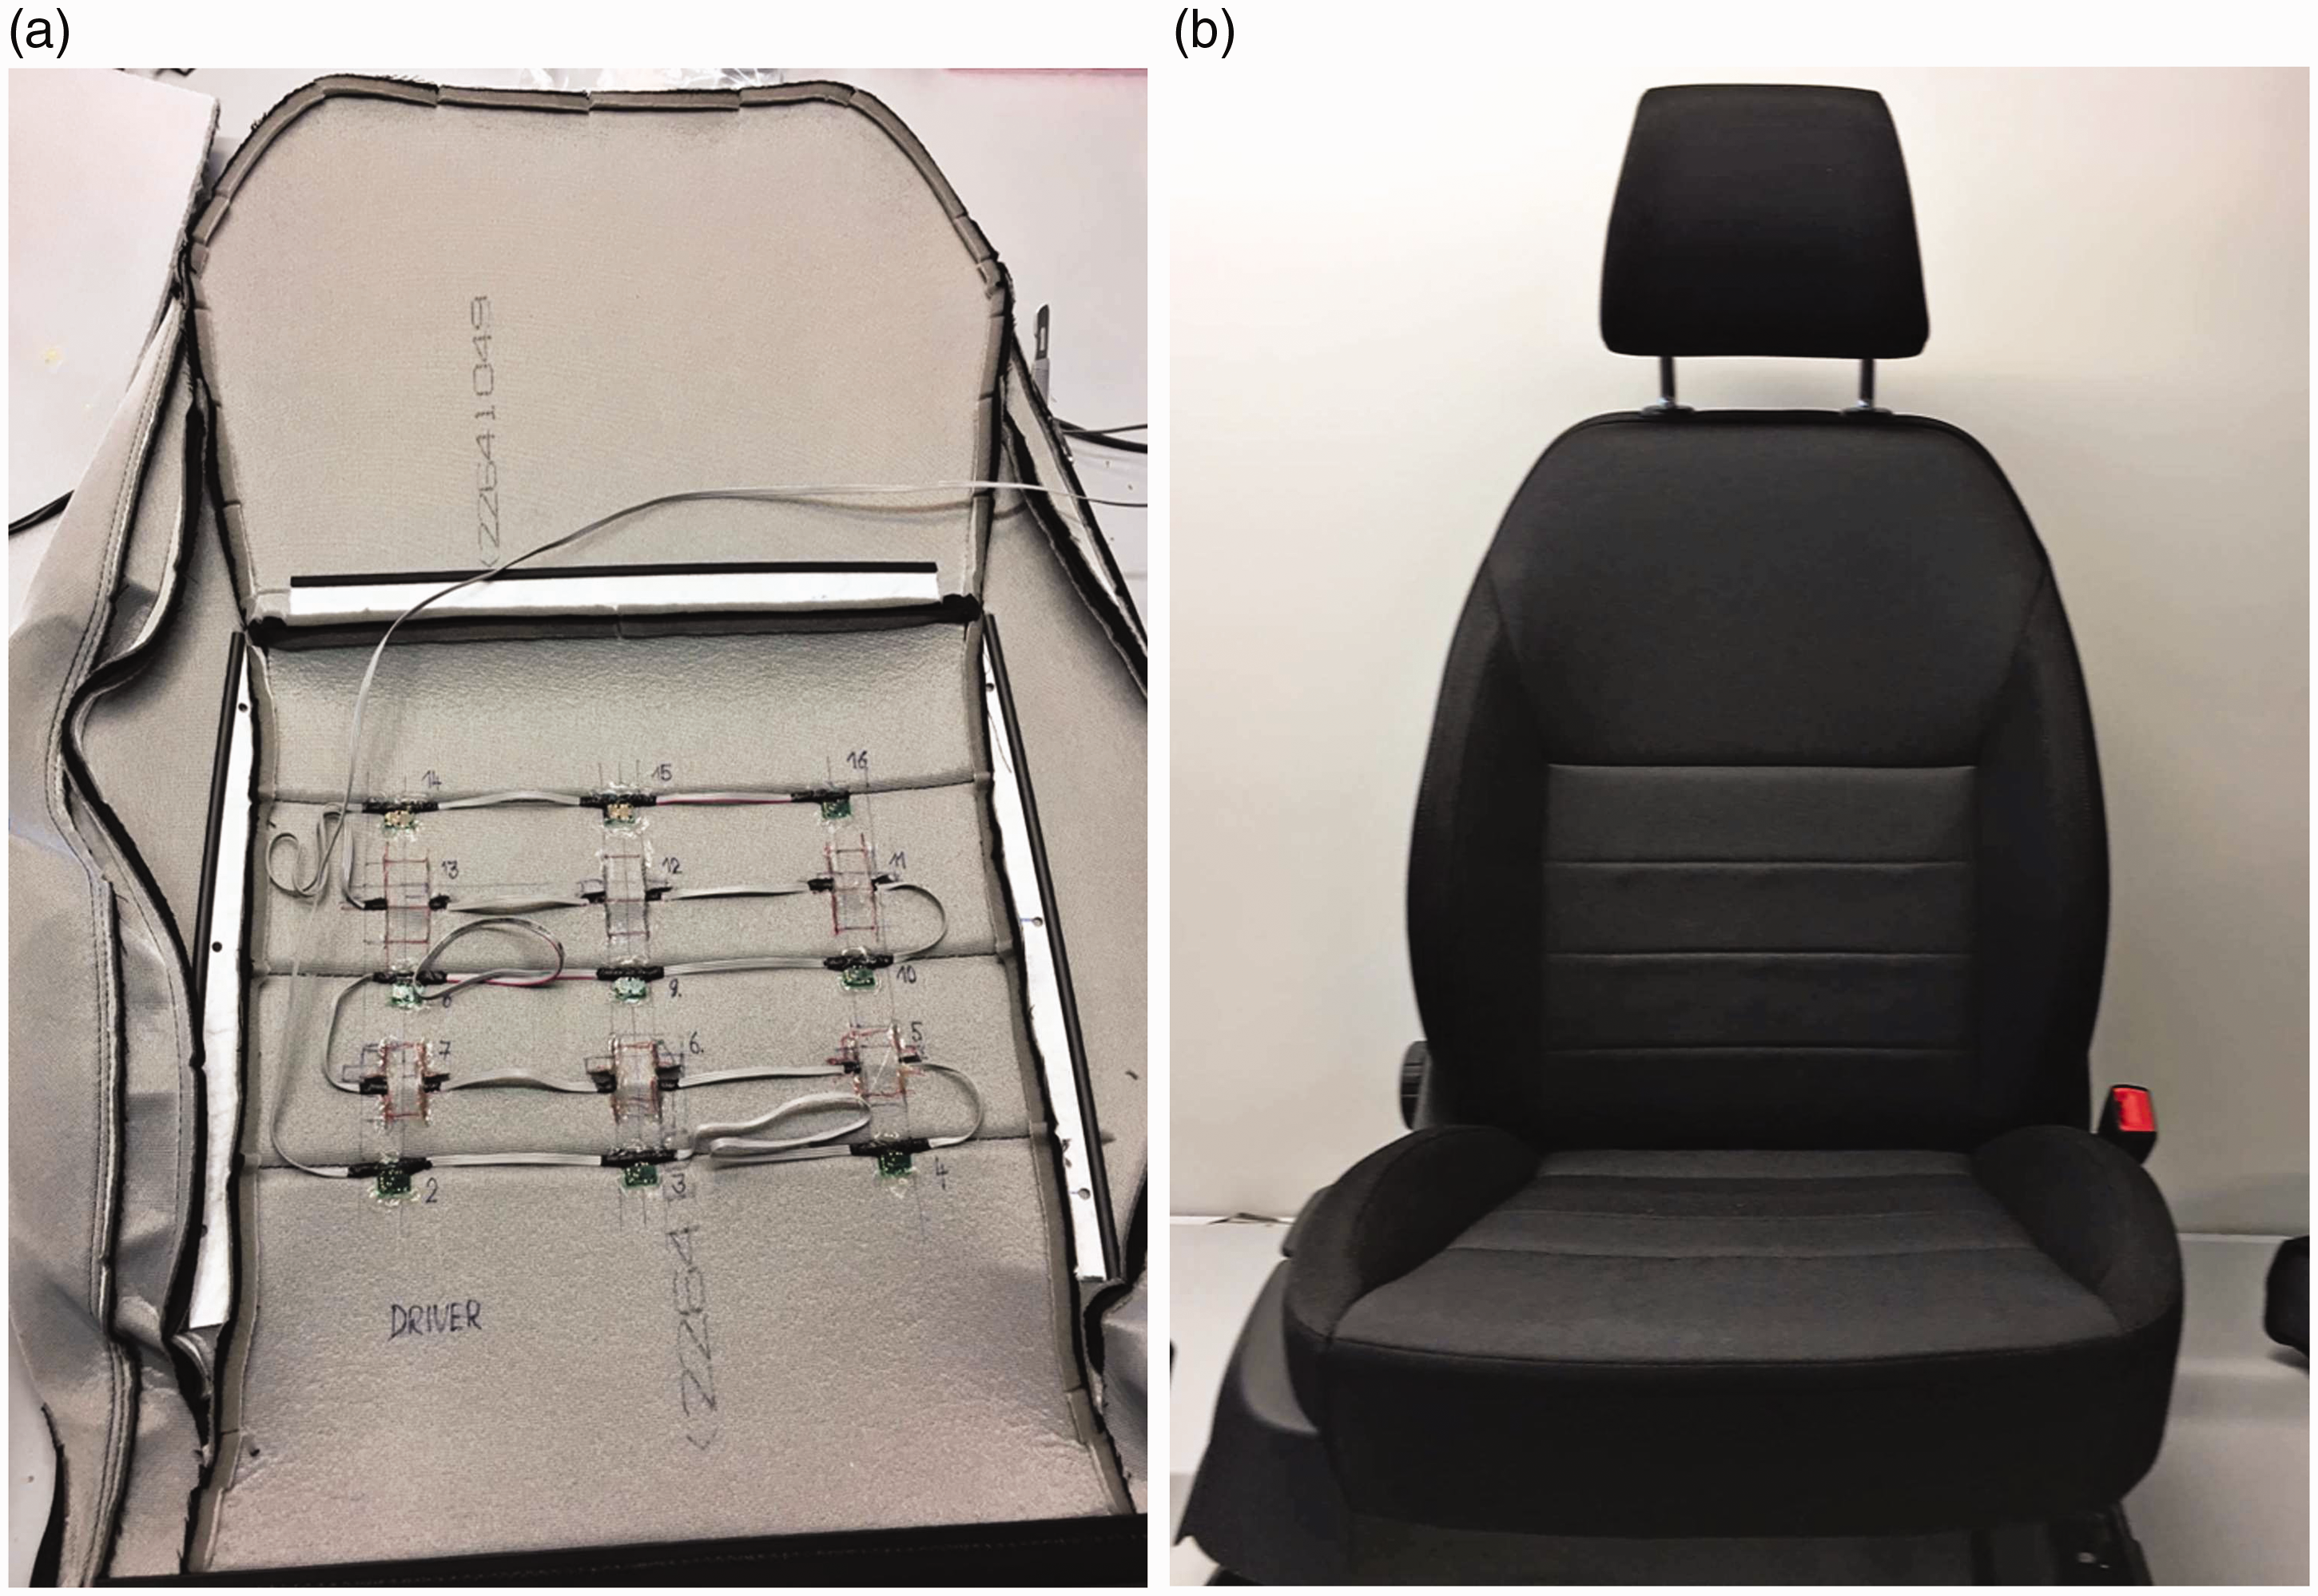
View of the car seat cover (a) before and (b) after assembly of the car seat.
The physical dimensions of the sensors used in this study are 3 mm × 3 mm × 1.1 mm, enabling their full integration into the car seat cover without affecting its functionality and comfort; see Figure 4. The sensors were protected against liquid moisture with a vapour-permeable membrane filter, which did not have a negative effect on the measurement results even with the long-time interval of sampling during the testing process. The measuring system, developed by the Technical University in Liberec, consists of sensors of both temperature (T) and relative humidity (RH), connecting cables, measuring field with a data converter and computer with a control programme.

(a) Temperature and humidity sensor SHT21 (source: www.sensirion.com); (b) tolerances for temperature measurement (T [°C]); (c) tolerances for RH measurement (RH [%]).
Measuring system
Detailed description of one experiment
The methodology for the testing procedure has been designed on the basis of the specified and defined goals. The detailed description of the experiments is as follows: to obtain relevant objective data and measurement results, each individual crew of the test vehicle was required to adhere to the same test conditions as much as possible and follow the same procedure during the test. More precisely, all car crews had to comply with the following minimal requirements during each experiment: Members of the crew had to keep the same regimen of physical activity before and during each experiment. The crew had to have the similar type of clothes. Wearing of one layer of cotton clothing was recommended (the one-layer cotton clothing was preferred for the experiment to keep it simple and easy to compare finally). The crew adjusted the car to the same driving regime and set the temperature to 22°C.
The measuring system registered for each sensor the mean value of the monitored characteristic recorded during the last minute instead of recording data continuously. Data from one experiment were written into a spreadsheet schematically described in Table 2. Each experiment consisted of the phases schematically displayed in Figure 5 and described in detail in Table 3.
Schematic description of the measurements obtained during one experiment by the kth sensor used on seat
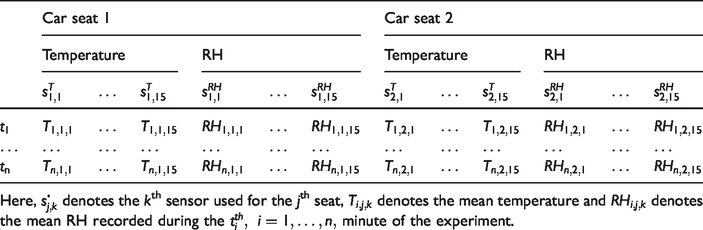
Here,

Schematic representation of the time-course of car seat comfort testing.
Schematic description of one experiment.

When preparing the experiment, we also discussed the possibility to place sensors directly on the human skin. However, being much more interested in the comfort feeling than in measuring the speed of the temperature changes and/or humidity transport through the materials used for the construction of seat covers, we decided to mimic as much as possible the real life, in which both drivers and passengers wear clothing. The role of passengers played co-drivers. Moreover, to collect comparable data which must be statistically processable, it was necessary to use similar clothing. On the other hand, the usage of the same clothing might lead to the undesirable overall uniformization 1 of responses and/or measurements and deteriorate the conclusions because in real life, people use very different clothing. Therefore, we decided ‘to stay somewhere in the middle’.
Overall, we had measurements from 16 experiments. Thirteen corresponding questionnaires describing subjective feeling were completed: the questionnaires were not filled in for the first three drives. Typical measurements of registered temperature and RH from one experiment (drive 16) are presented in Figure 6. Figure 7 presents the measurements of temperature and RH from another experiment (drive 9), where two unplanned short breaks were made at approximately the second and sixth hour of the schedule (in Figure 7, we present only the information about the seat 1 to keep size of the paper reasonable). We immediately observe that:
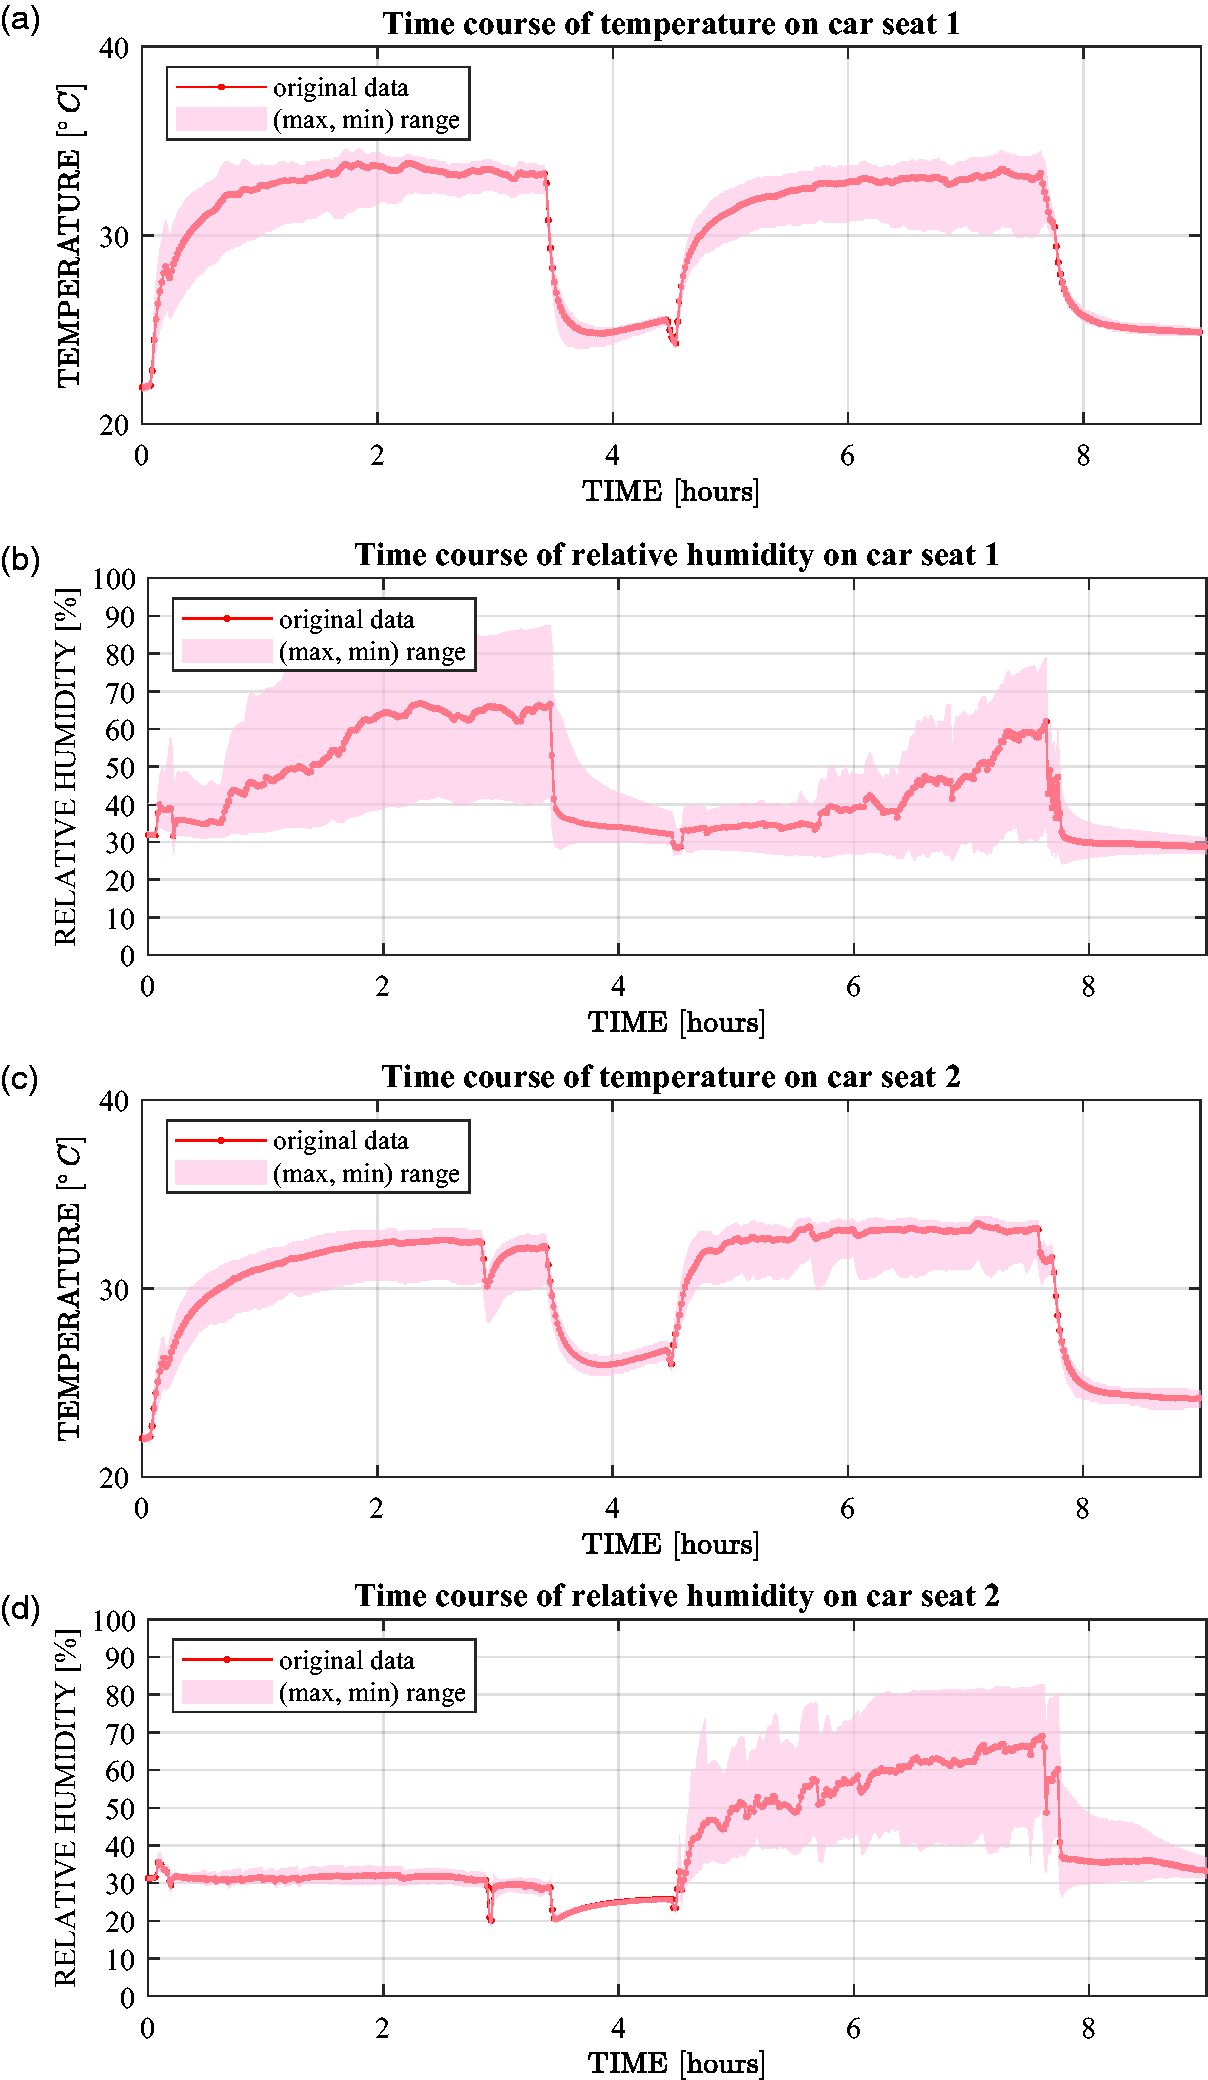
Typical measurements of (a) temperature and (b) RH on car seat 1; (c) temperature; (d) RH on car seat 2 (drive 16).

Typical measurements of (a) temperature and (b) RH on car seat 1 (drive 9).
The temperature measurements are, at least optically, more regular than the moisture transport measurements.
During each drive, the crew had several short stops, typically one to three. These short stops are usually connected with the task to complete a questionnaire describing subjective feeling every 30 min. Sometimes, but less often, these stops can be due to some unexpected and unplanned technical reasons.
Both measurements of temperature and humidity can be segmented into several more homogeneous segments, which we will concentrate on in more detail in the subsequent sections.
The cooling phase is shorter than the warming phase.
Thus, one experiment can be more precisely described as shown in Table 4.
Detailed schematic segmentation of one experiment.

Objective measurements – Description of the data
We illustrate our approach by testing whether there is a statistically significant difference between the mean temperatures registered on individual car seats during one experiment. The main reason, aside from keeping the size of the study moderate, is that people are used to making conclusions globally. Note that, for the analysis of moisture transfer and the analysis of individual sensors or subsets of sensors, we can proceed analogously.
Data segmentation
We let
First, we fit the subsets of observations locally using the locally estimated scatterplot smoother (LOESS: for the details refer to Cleveland [17]). More precisely, we fit a straight line using the classical least squares method for each local contiguous subsets of data. The slopes of the fitted straight lines indicate the speed of the increase and/or decrease of the analysed characteristic. The selection of local subsets is done using a moving window of the width
FOR
{
• select the local data subset
• fit the straight line
• store estimate
}
The results of this scheme are schematically represented in Figure 8(a). The scheme for
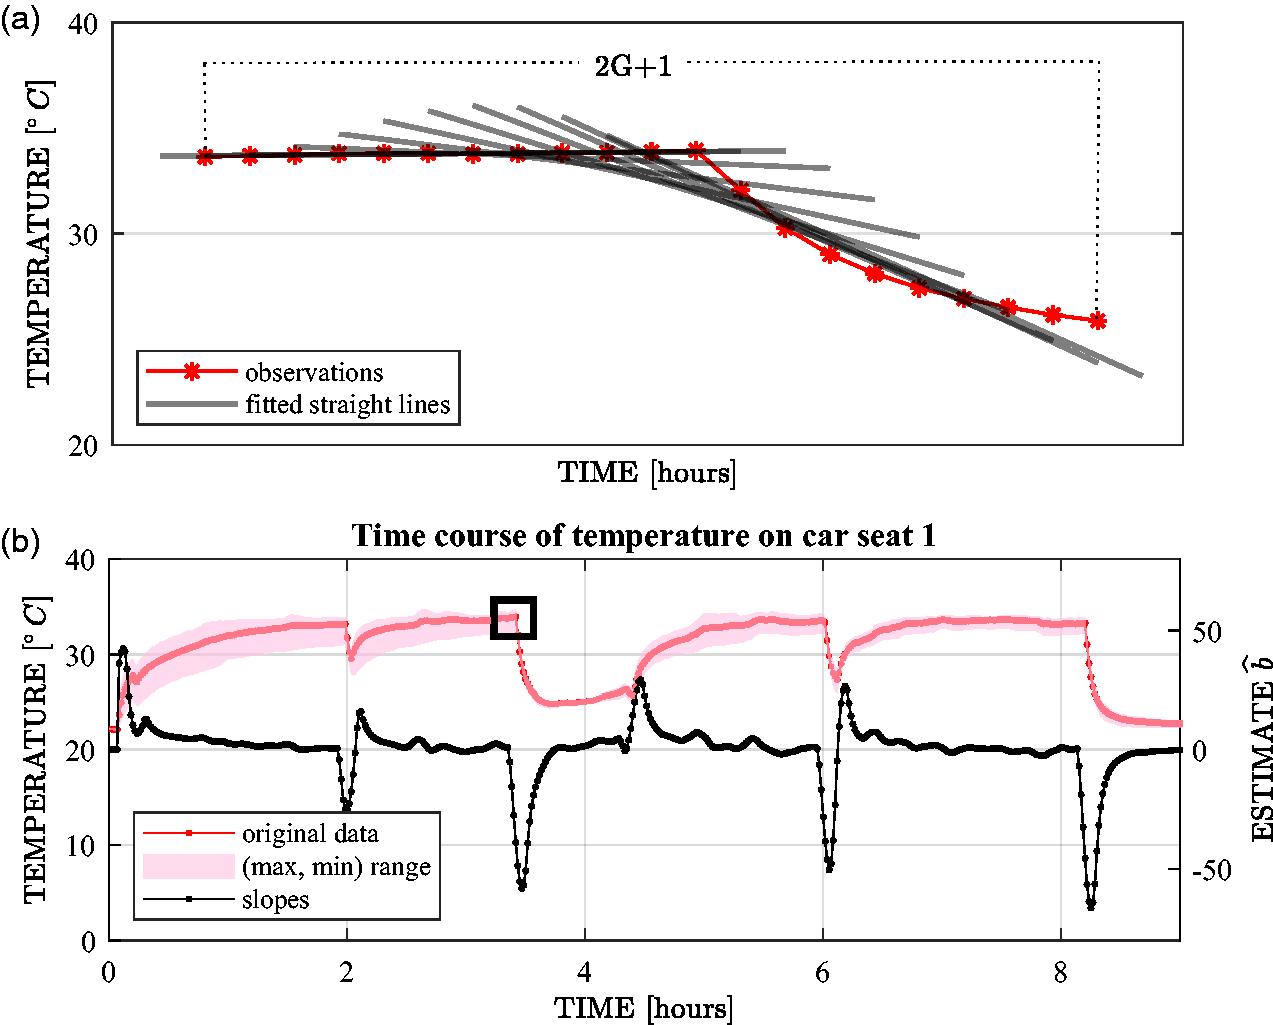
(a) Subset of temperature data from drive 9 (bounded by a black rectangle in Figure 7(a) and 8(b)) together with the fitted straight lines and the corresponding course of estimated slopes. (b) Complete temperature data for seat 1 in drive 9 and the corresponding course of estimated slopes indicating the eventual changes.
Let us concentrate in more detail on data segmentation. We suppose that the series of observations 
The alternative corresponds to the appearance of a gradual linear trend arising at an unknown moment of time, the so-called ice hockey stick model, i.e.
If the break point is known, fixed and equal to 
If the location of the break point is unknown, then we can use so-called maximum-type statistic, i.e.
In the situation where data do not have the same variance or are dependent and form a linear process,
The desired break point, i.e. the place (or time) where the behaviour of
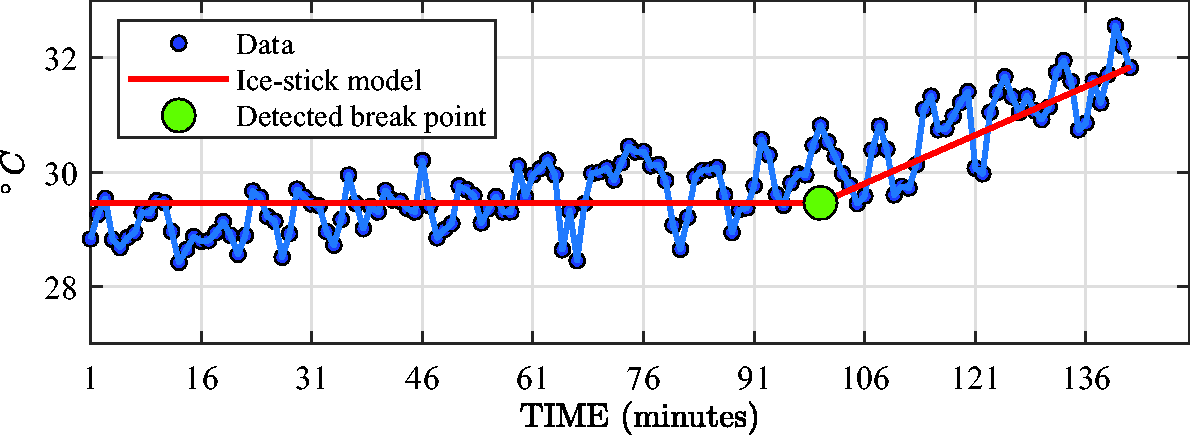
‘Optimal’ ice hockey stick model.
Characterisation of sitting comfort
Another author [23] investigated the sweating patterns of humans and produced the body sweat map of aerobically trained men and women during mild exercise. They observed similar patterns of distribution of sweating between both sexes. Given that sitting in the car does not represent a physically over-demanding activity for a person, we can rely on the placement of sweat zones, and the formation of sweat in humans is shown in Figure 10. Moreover, no significant differences between men and women in regional temperature of the skin were observed. The deployment of sensors in the car seat cover was proposed on that basis.
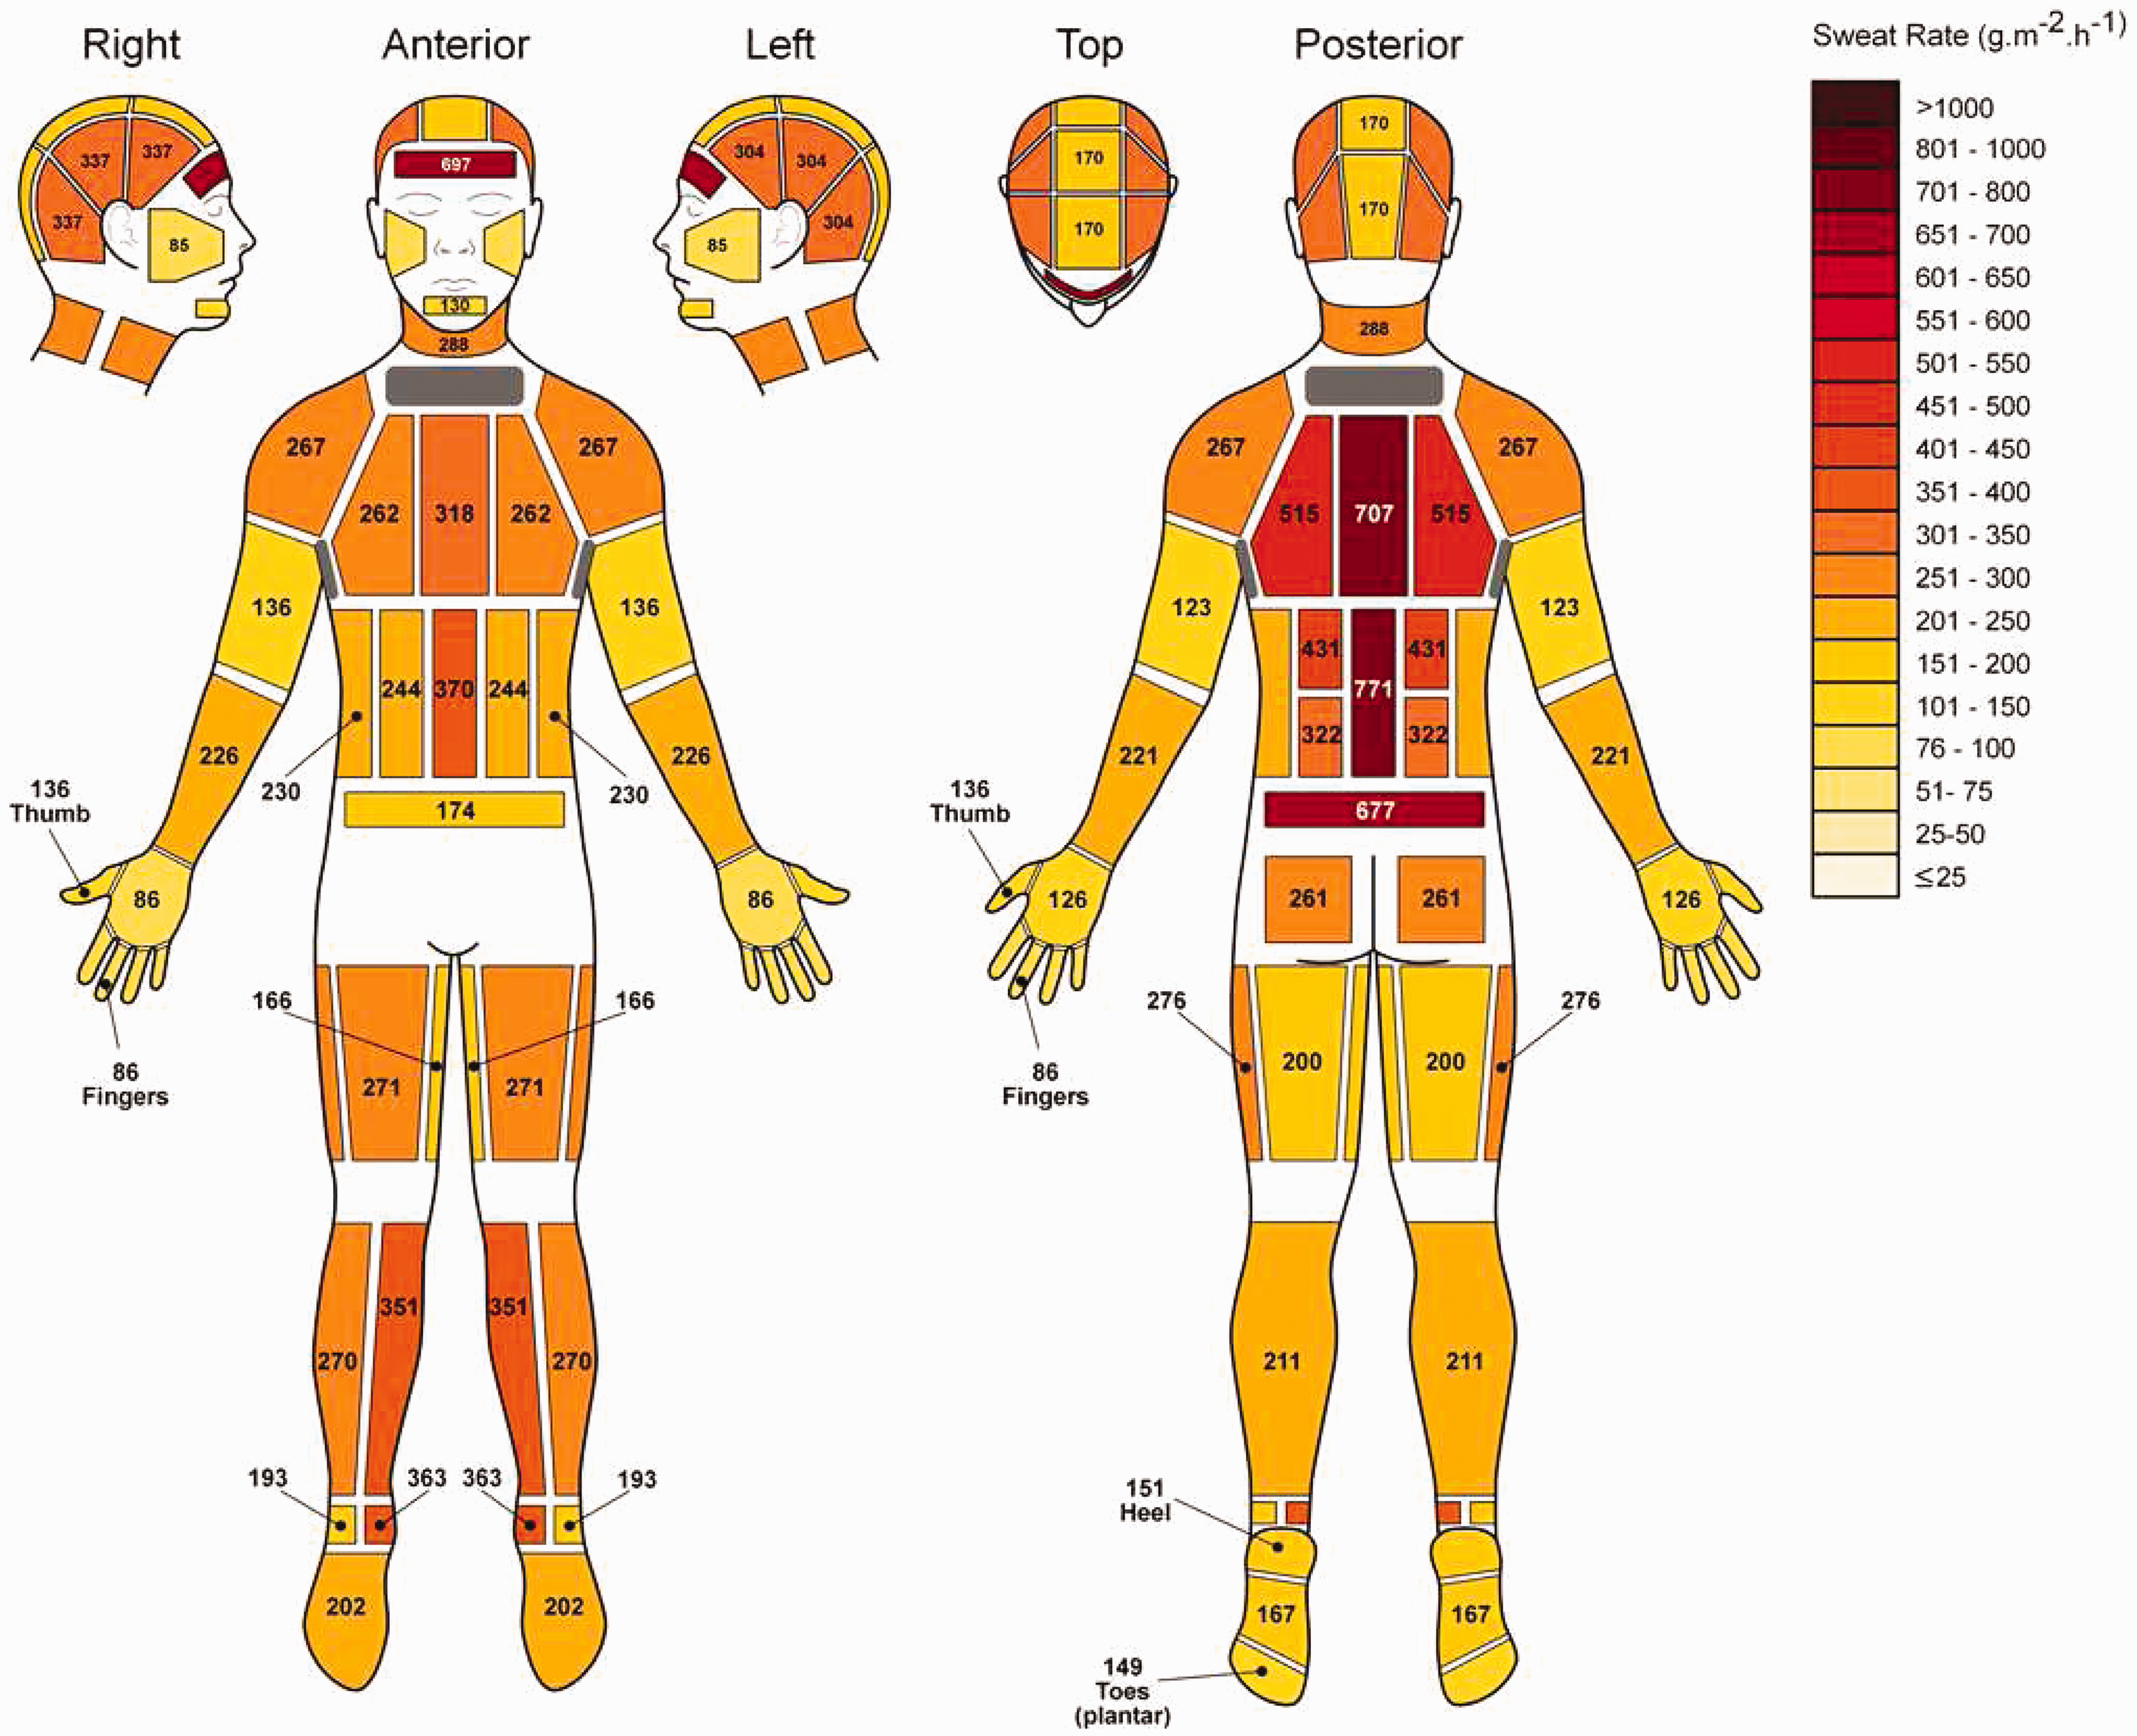
Sweat rates of athletes during exercise. Image taken from Smith and Havenith [23].
As explained previously, we used 15 sensors placed in two layers to measure both temperature and humidity. Evidently, the data returned by different sensors differ in terms of their placement and the physiology of the human body that emits different amounts of energy from different zones, resulting in differences in perspiration intensity in different zones. The comparison of the sweat rates of the human body is depicted in Figure 10. The ‘spread of measurements’ registered by different sensors during one experiment is denoted by the red zone in Figures 6(a) to (d), 7(a) and (b), and 8(b).
Evidently, we can separately analyse the measurements from different sensors to compare the measurements in the upper and lower layer. However, for the purpose of this study, we decided to analyse only the course of the average (mean) of the registered temperature and relative humidity measurements obtained from all sensors. The main reason, aside from keeping the size of the study moderate, is that people are used to making the final conclusions globally.
We segmented the data first, as described in Table 4. Three main phases are worthy of interest and require detailed statistical analysis, i.e. warming phase … mean increase of temperature/humidity per minute; stable phase … mean temperature/humidity during this phase; cooling phase … mean decrease of temperature/humidity per minute.
The scheme of the measurement results in any phase is in Table 5.
Scheme of the measurement results of stable phase during Phase

Data analysis of objective measurements
We start with the temperature measurements. First, the data from each experiment were pre-segmented into the subsegments characterised in Table 4 using the modified LOESS described previously. Then, these initial subsegments were ‘precised’ using the methods described in Jarušková [19] and Antoch and Jarušková [24,25]. For the analysis, we focused on the following three phases: warming, cooling and stable phases. More precisely: When analysing the warming phase (segments S2 and S6) and cooling phase (segments S4 and S8), we concentrated on the question of whether the length of the warming (cooling) phase is ‘the same’ for both seats or not. In practice, this corresponds to the question of whether the speed of temperature stabilisation is the same for both materials. When analysing the stable phase (segments S3 and S7), we concentrated on the question whether there is a significant difference between the attained mean temperatures on car seats 1 and 2. In practice, existence of such a difference reflects the difference between both materials used for the construction of individual seats and the possible difference in the feeling of comfort.
As concerns point 1, the time needed to reach the stable phase from the relaxation phase was, on average, the same for both seats. The same holds, on average, for the time needed to reach the relaxation temperature during the cooling phase. However, we need to point out the fact that the speed of cooling is faster (approximately 2.5 times on both seats) than the speed of warming. This pattern is highly appreciated by clients because even a short break can considerably improve the sitting comfort.
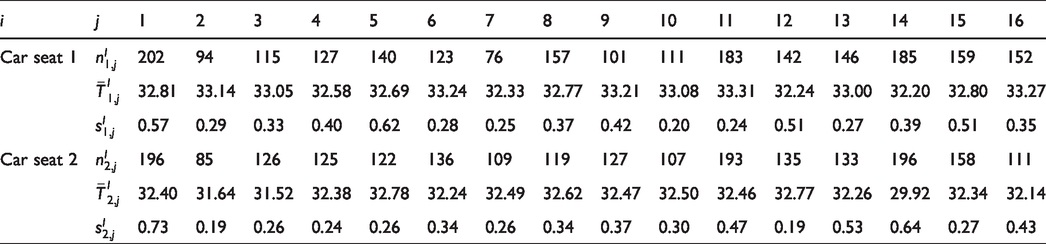
As concerns point 2, for the analysis, we used the available paired data, where the pairs corresponded to the measurements on individual seats during various experiments and their phases. More precisely, we considered paired data of the following form
Results of the measurements for stable phase during Phase I of the drive for car seat
Results of the measurements of stable phase during Phase II of the drive for car seat
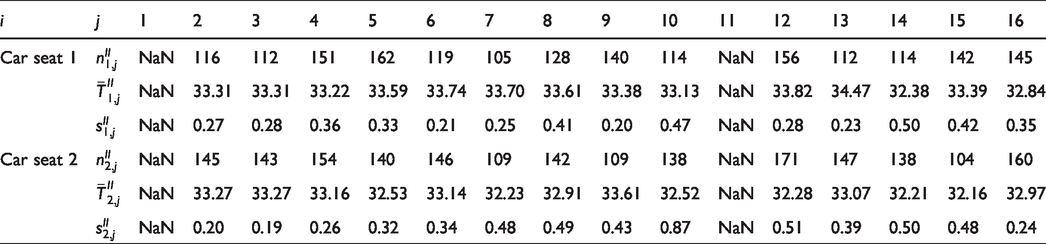

Mean temperatures and corresponding standard deviations during the stable phase for both seats and both phases of the experiment.

Differences in the mean temperatures during the stable phase.
Although the normality of the analysed data is, at least partially, guaranteed by the central limit theorem, the equality of their variances is violated, and the classical t-test cannot be used. Therefore, we applied the non-parametric Wilcoxon test to the differences between paired data to test the null hypothesis of no shift of distributions describing individual measurements against the alternative of a shift. This test, described in detail in Šidák et al. [26], rejects the null hypothesis of no shift with the p-value of 0.0003 for Phase I and p-value of 0.0007 for Phase II. This finding indicates that it is statistically highly significant that the mean temperatures attained on individual seats during the stable phase differ substantially. The mean difference between the temperatures of seat 1 and 2 is approximately 1°C, on average, which is a value that can considerably affect the sitting comfort.
As concerns the measurements of humidity transfer, the analysis was more complicated because the data did not show general patterns that would hold ‘uniformly’ for all experiments. In any case, the main conclusion is that humidity transport by the material Standard+ is better than that by the material Standard. This finding has been also confirmed by the subjective evaluation of probands. For details, see the Data analysis of subjective measurements section.
Data analysis of subjective measurements
As explained in detail in the Experimental samples section, during each experiment, the car crew (i.e. driver and co-driver) made a stopover every 30 min and rated their satisfaction with temperature and humidity transport as well as their global satisfaction. (Note that we have focused on evaluating thermal and humidity properties, because the stiffness and softness parameters are much more problematic for the comfort evaluation). In the middle of the experiment, the driver and co-driver switched roles, so that each crew member was able to evaluate both seats, i.e. both materials used for their construction. The results of their ratings (evaluations) form the so-called paired-type data. More precisely, from each experiment, we have 2 × 7 × 3 = 42 pairs of evaluations corresponding to: two halves of the experiment, i.e. before and after the driver and co-driver switched roles (Phase I and Phase II); seven stopovers during each half of the experiment; three evaluated features (satisfaction with temperature and humidity transport as well as global satisfaction).
All drivers involved in our experiments were well trained professional drivers. They were instructed in detail about the goals of the testing, so that their understanding of the interim evaluation has been coherent. On the other hand, they did not know which material is used where, what is his composition, etc., so that from this point of view, it has been blinded experiment. Both male and female drivers were used to cover eventual differences between the genders.
For coding of responses, we used five-level Likert-type scale, which is the most widely used psychometric scales commonly involved in research that employs questionnaires. The question whether the ‘distance’ between each successive item category should be equidistant is never-ending discussion point in the psychometric literature. However, to distinguish more strongly the lowest two classes, i.e. insufferable and unpleasant, we decided to use the scores {1, 4, 6, 8, 10} instead of the more traditional {1, 2, 3, 4, 5
Schematic description of the categories used for the subjective evaluation.

We cross tabulated the scores according to the evaluation of the driver and co-driver. The results are summarised in Table 9. Each element of this table is the overall number of ratings by the driver and co-driver recorded simultaneously during individual stopovers. For example, how many times the driver used the score 6 and how many times the co-driver used the score 8 when evaluating the same feature at the same moment. Marginal totals are also supplied. In the field of mathematical statistics, such a table is called a contingency table, and a considerable amount of literature is devoted to their analysis. For details, see the monograph [27].
Cross tabulation of the individual ratings during individual stopovers.

The results of the cross tabulation clearly show that the tables are asymmetric. Recall that symmetry (of the contingency table) in our context means that there is no difference in the evaluation of the features, whereas asymmetry reflects the preference for one of the monitored features.
We assume that a squared 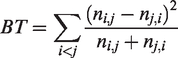
For the features’ humidity transport and global satisfaction, we rejected the null hypothesis of symmetry with very small
Attained p-values of the applied tests.

Note that the test of symmetry aims to compare the differences between pairs of scores attributed by the driver and co-driver during individual stopovers in all experiments. Aside from that, we were also interested in the evaluation of ‘average satisfiability’. To that purpose, we separately averaged the scores attributed by both the driver and co-driver during each experiment for each monitored feature. The average scores are plotted in Figures 13 to 15. We immediately observed that, in most experiments, the mean score of satisfiability attributed by the co-driver (corresponding to the material Standard+) is higher than the mean score of satisfiability attributed by the driver (corresponding to the material Standard). To confirm this observation objectively, we applied a paired t-test and a two-sample t-test to the averaged values of satisfiability attributed during individual experiments to the considered features. Both tests rejected the null hypothesis of no difference in the mean score attributed by the driver in favour of the alternative that the mean score attributed by the co-driver is higher. The corresponding p-values are presented in Table 10. These findings were also confirmed by Mann–Whitney’s test applied to the signs of the differences between the averaged values. Recall that t-tests were originally suggested for normally distributed data. In our application, however, we apply them to the discrete data, where the normality is, at least partially, guaranteed by the central limit theorem. To be sure about our conclusions, we also calculated in parallel nonparametric Mann–Whitney test, which is distribution free.

Global satisfaction: (a) mean scores of individual experiments for each phase and (b) difference between the mean scores of the co-driver and driver.
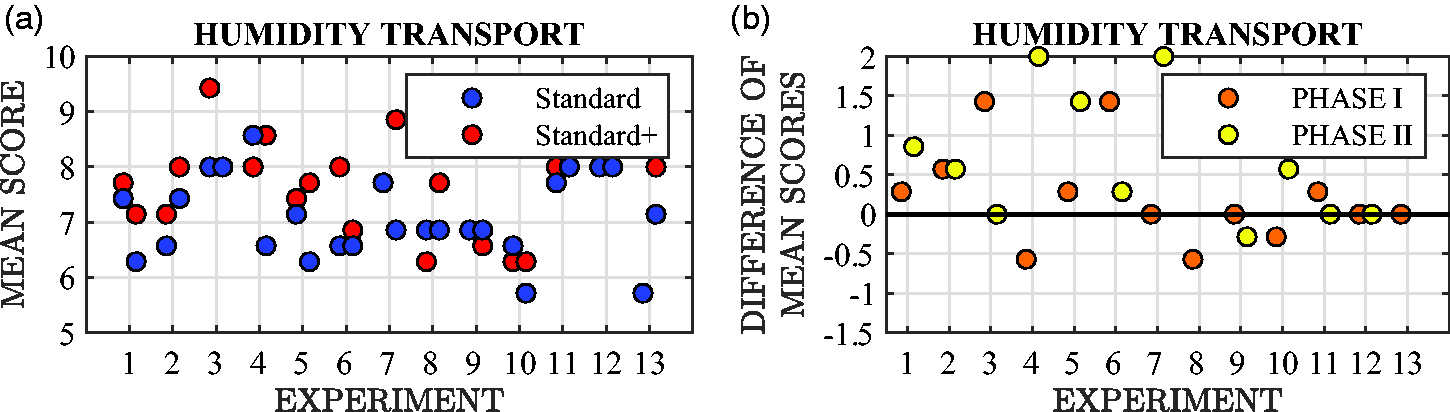
Humidity transport: (a) mean scores of individual experiments for each phase and (b) difference between the mean scores of the co-driver and driver.

Temperature transport: (a) mean scores of individual experiments for each phase and (b) difference between the mean scores of the co-driver and driver.
All of the previously presented findings enable us to conclude unambiguously that the new material Standard+ is preferable to the old material Standard. The subjective preference is higher for the features’ global satisfaction and humidity transport than for the feature temperature transport. This conclusion is consistent with the findings of the data analysis of objective measurements, see Data analysis of objective measurements section.
Finally, point out that objective and subjective evaluations are two different approaches, often applied in parallel, and routinely used in statistics, medical and pharmaceutical surveys, or sensometrical comparisons, among other fields. Despite the fact that formally, it is impossible to provide exact mathematical description of possible dependence, this approach is well established and if conclusions from both objective and subjective approaches coincide, the hypothesis is considered to be much more strongly supported. As concerns comfort, we believe in combining both the objective measurements with the human feeling.
Conclusions
This study proposed a new methodology that enable us to address the question: ‘Which textile material used for the construction of car seats is more comfortable?’ In the first part, the entire experiment is concisely presented, including its length, phases and detailed conditions under which it is run. The selection of appropriate sensors, their placement and their manner of recording data is also discussed. In the second part, the results of the objective measurements of temperature and relative humidity transport for two different materials are provided. The findings are compared with the results of the analysis of the subjective rating of comfort provided by the car crew in individual experiments. As concerns the analysed materials, we conclude on the basis of the subjective and objective measurements that one of the considered materials (i.e. Standard+) is highly preferable. These findings support the current trend that the use of 3D spacer fabrics improve both breathability and sitting comfort in general.
Footnotes
Acknowledgements
We thank the editor and four anonymous referees for their careful reading and valuable comments that helped us to improve considerably the paper.
Declaration of conflicting interests
The author(s) declared no potential conflicts of interest with respect to the research, authorship, and/or publication of this article.
Funding
The author(s) disclosed receipt of the following financial support for the research, authorship, and/or publication of this article: This project was supported by the Ministry of Education, Youth and Sports of the Czech Republic and the European Union – European Structural and Investment Funds in the frames of Operational Programme Research, Development and Education – project Hybrid Materials for Hierarchical Structures (HyHi, Reg. No. CZ.02.1.01/0.0/0.0/16 019/0000843). The work of J Antoch has been supported by grant GACR 18-08888S.