
Abstract
Nanofibrous media have a low basis weight, high permeability and small pore size that make them appropriate for a wide range of filtration applications, particularly for smaller particles. In contrast to electrostatic filter media, nanofibers' filtration efficiencies depend on the mechanical filtration mechanism and do not degrade with time. In this study, the National Institute for Occupational Safety and Health (NIOSH) requirements for the N95 particulate filtering half mask were achieved using electrospun cellulose acetate (CA) and polyvinylidene fluoride (PVDF) nanofiber coated polypropylene spunbond layers. Specifically, 16 and 15% (w/v), and 14, 12 and 10% (w/w) polymer concentrations were selected for CA nanofibers and PVDF nanofibers, respectively, to adjust the nanofiber diameters. The diameters of CA and PVDF nanofibers were decreased with decreasing polymer concentration for both CA (319.02 to 264.02 nm) and PVDF (236.50 to 142.59 nm) nanofibers. The thickness of the electrospun 16CA, 15CA and 14PVDF, 12PVDF, 10PVDF mats was adjusted by varying the collection period (15 min, 30 min, 60 min). The effects of electrospun CA and PVDF nanofiber diameter on the pore size and the thickness of the mats were compared in terms of filtration performance. 16CA with a nanofiber diameter of 319.02 nm had the largest first bubble point of 26.5 µm and mean flow pore size of 5.71 µm at 15 min with a thickness of 0.019 mm. The smallest first bubble point and mean flow pore values and the smallest pore size were achieved with the finest nanofibers of 10PVDF. Filtration performances were given as initial penetration and air flow resistance (ΔP). 16CA-60 min and 15CA-30 min mats both met the NIOSH requirements with their bulky structure. For PVDF, thinner nanofibers with smaller pores were produced compared to the CA nanofibers, and the NIOSH requirements were only achieved using double-layered, face-to-face 10PVDF-15 min nanofiber mats with the penetration of 1.85% and ΔP of 33.87 mmH2O.
Introduction
Filtering facepiece particulate respirators and facemasks are widely utilized for reducing the inhalation of airborne particles that cause various health effects [1–3]. A simple definition of a facemask is “a loose-fitting, disposable mask that composes a physical set between the mouth and nose of the wearer and potential pollutants in the immediate environment” [4]. A conventional facemask usually includes one, two or three layers of three-ply material attached to the head with ear loops [5,6]. On the other hand, a respirator (filtering device) refers to a facepiece with higher filtering efficiency and provides a better fit than a conventional mask [5]. It is generally pre-molded, fits tightly, adheres to the head with a single elastic band and uses filters to remove harmful substances from the air that is being breathed in [5,7]. Respirators help to reduce the wearer's respiratory exposure to airborne contaminants such as particles that are small enough to be inhaled with the size of less than 100 microns (μm) [8] and are essential safety equipment in many dust-generating industrial applications [9].
NIOSH 42 CFR Part 84 particle filter classifications [8].

This filter material can provide high protection to a face mask or a respirator. As an important part of this emerging technology, nanofibers and nanofiber webs in filter medias are the key elements for improving the filtration efficiency [6,19,20]. Because of its relative ease of use and ability to fabricate nanofibers, electrospinning is one of the most commonly used methods for the production of nanofibers. In this approach, a high voltage power source, a nozzle and a collector are used [21]. The produced nanofiber media have a low basis weight, high permeability and small pore size that make them appropriate for use in a wide range of filtration applications, particularly for smaller particles. Nanofibers offer unique properties such as high specific surface area (ranging from 1 to 100 m2/g depending on the diameter of the fibers and intrafiber porosity) and good interconnectivity of pores. Nanofibers are fragile, are usually not used alone in filtration, and generally are produced onto a nonwoven fabric [6,20]. Some supports showing good conductivity, permeability and adhesion to the cellulose acetate (CA) nanofiber to create a multilayer were tested to examine the feasibility of an efficient air filter based on CA nanofibers [22]. The results showed that the support has a major influence on the final product and the air filtration performance and that the pore size distribution is closer for the membrane electrospun on a nylon grid because of its more pronounced two-dimensional structure. According to the test results, the substrate must have a relatively even surface and a low thickness. A composite material alone could show a quality factor of 0.055 ± 0.040 Pa−1 at 100 nm and 0.080 ± 0.050 Pa−1 at 300 nm, when tested at the filtration velocity of 5.3 cm s−1 with neutralized NaCl aerosol particles [22].
Nanofiber filter media have enabled new levels of filtration performance in several diverse applications within a broad range of environments. There are many applications of nanofibrous filters that are already commercialized in addition to the applications that are still under development [23]. One of these is the use of nanofibers in facemasks and respirators. Studies and some patents for nanofibers in various facemask applications have been reported [24–32]. Li et al. produced electrospun polysulfone nanofibers for mask filtration and compared the produced nanofibrous mats for PM2.5 (particulate matter with a diameter of 2.5 μm or less) with disposable nonwoven face mask, nonwoven mask for use in the operating room, Ito PM2.5, and N95 and R95 respirators. The thickness of the electrospun fiber mats was varied with the collecting period (15 min < 30 min < 60 min). It was reported that the produced nanofiber mask materials could efficiently filter out the PM2.5 particles and simultaneously preserve a good breathability [26]. Skaria and Smaldone compared a prototype-fitted facemask with a nanofiber filter media (PT) with an N95 filtering facepiece respirator. It was observed that PT with a nanofiber filter showed more efficient filtration than the commercial masks, and in contrast to the commercial face masks, the nanofiber prototype retained its low resistance. In addition, the nanofiber media significantly reduced the mask air flow resistance (ΔP) [27]. Wang et al. prepared an ultralight weight (2.94 g/m2) PA6 and PAN nanofiber filter medium by the accumulation of nanofibers/nets via multi-jet spinning. Their N6-PAN nanofiber media showed a filtration efficiency of 99.99% for PM2.5 [24]. Ramaseshan et al. studied a functionalized polymer nanofiber membrane for capturing chemical warfare agents. A catalyst synthesized from β-cyclodextrin and o-iodosobenzoic acid to detoxify nerve agents was used, and PVC nanofiber membranes were produced [28]. It was found that when tested against the decontamination of a nerve agent stimulant (paraoxon), the stimulant became hydrolyzed. It was reported that functionalized nanofibers with different catalysts can also degrade other types of chemical and biological warfare agents and that various nanofiber layers can be combined together with a substrate to form protective garments [28,32,33]. Faccini et al. also developed an efficient protective clothing using PA6 nanofibers against nanoparticulate aerosols [34]. Yang et al. designed a multifunctional face mask with 99.6% filtration efficiency for PM2.5 and with effective radiative cooling [31]. In US 2016/0015098 A1, methods for utilizing nanofibers in facemasks are described [30], and US 2008/0264259 A1 defines a composite filter media including a nanofiber layer [29]. Thus, the survey of the abovementioned literature demonstrates that a nanofiber filter media for an N95 respirator has not been developed. Only Skaria and Smaldone compared a nanofiber media with a commercial N95, but the structure of the nanofiber mask used in their study was not described. The requirement of at least 95% efficiency along with maximum 35 mmH2O of ΔP at 0.3–0.4 µm is difficult to achieve even with nanofibers. This study clearly defines the diameters and the amount of nanofibers that are necessary for achieving the N95 requirements.
In this study, cellulose acetate (CA) and a polyvinylidene fluoride (PVDF) nanofiber layer for a facemask or a respirator were developed with 100% mechanical filtration that could meet the requirements of N95 respirators. There are many reports in the literature related to the use of nanofibers in filtration [24,26–28,31,32]; however, the requirements for their use in facemasks and in particulate filtering differ [12,13]. There are very few studies on the nanofibers in facemasks, and most of these are focused on the capture of chemical vapors [28,32,33]; to the best of author's knowledge, the CA and PVDF nanofibers are investigated in this work as a layer for N95 respirators for the first time. The proposed nanofiber layers show high mechanical filtration efficiency compared to the conventional facemask layers. PVDF was chosen because of its hydrophobicity, high thermal and chemical resistance, and excellent mechanical properties [35–38]. It is also widely used in ultrafiltration, microfiltration, membrane distillation and some other membrane processes [37–39] such as affinity membranes. Nanopressure sensors [40,41], polymer electrolytes or separators [42], proton exchange membranes in fuel cells [43] and thin film composite membranes for forward osmosis [44] are some other applications of PVDF nanofibers.
On the other hand, CA is a derivative of the naturally occurring raw material and is an alternative to synthetic polymers produced from petroleum [22]. CA nanofibers could be utilized for various applications ranging from affinity membranes [45] to tissue engineering [46] and sensors [47]. CA was chosen because of its filtration efficiency [20], high hydrophilicity, good liquid permeability, biodegradability and water absorption capacity [22,48]. CA is stable to water and has good solubility in organic solvents [20,49] and has also been applied in filtration, particularly in cigarette smoke filters [20,50] because of its significant filtration selectivity to low-level organic compounds [51]. In addition, it is possible to obtain smooth and fine nanofibers from both PVDF and CA via electrospinning that could lead to high filtration efficiency.
PVDF and CA nanofiber layers were produced onto a spunbond polypropylene media, and the effects of the nanofiber diameter, pore size and the thickness of the nanofiber mats on their filtration performances were compared. The diameters of the produced CA and PVDF nanofibers were decreased by decreasing the polymer concentration, and the thickness of the electrospun CA and PVDF mats was adjusted by changing the collection period (15 min, 30 min, 60 min). Both the nanofiber diameter and the collection period significantly affect the pore size of the nanofiber layers that finally determine the filtration efficiency of the nanofiber layers.
Experımental section
Materials
CA with the average molecular weight (Mn) of ∼30,000 g/mol and acetylation degree of 39.8 %wt, acetone and dimethylacetamide (DMAc) were purchased from Sigma-Aldrich Chemical Company. PVDF (Kynar 761A) was provided from Abalıoglu Teknoloji.
Electrospinning
Polymer concentrations of 16 and 15% for CA and 14, 12 and 10% for PVDF were selected after screening studies. Homogeneous CA solutions were prepared by dissolving 16 and 15% (w/v) of CA powder in acetone/DMAc (2:1 v/v), and electrospun CA solutions were coded with 16CA and 15CA and with their collection periods. Homogeneous PVDF solutions were prepared by dissolving 14, 12 and 10% (w/w) PVDF powder in acetone/DMAc (1:4 v/v), and tetraethylammonium bromide (TEAB 0.015 g) was added to each PVDF solution (30 g) to improve the electrospinnability and the fiber uniformity [37,52–54]. Electrospun PVDF solutions were coded as 14PVDF, 12PVDF and 10PVDF with their collection periods.
The polymer concentrations, fiber diameters for CA and PVDF nanofibers and their electrospinning conditions.

Scanning electron microscope analysis
The scanning electron microscope (SEM) images of CA and PVDF nanofibers were obtained using a Phenom G2pro instrument at an acceleration voltage of 5 kV. Prior to SEM observation, electrospun nanofibers were sputtered with a thin layer of gold for 30 s using a Quorum Q150R S ion sputtering device.
Measurement of nanofiber diameters, weight and thickness
The mean diameters of the electrospun PVDF and CA nanofibers were calculated from 50 measurements using the ImageJ program. The weight of the nanofibers was calculated from an area of 10 cm2. The thicknesses of the nanofiber mats were measured using a digital micrometer (Mitutoyo) with a precision of 0.01 mm. The values of the mean fiber diameter, weight and thickness measurements are expressed as the mean ± SD. Data were analyzed by one-way analysis of variance (ANOVA) followed by the Tukey HSD post hoc test. Differences with p < 0.05 were considered statistically significant.
Pore size and pore size distribution measurements
The first bubble point (FBP, maximum pore size), the mean flow pore size (MFP, average pore size), the smallest pore size (SPS) and the pore size distribution of the CA and PVDF nanofibers were measured using a Porolux 1000 instrument (Germany) carrying out capillary flow porometry measurements. The mean pore sizes of the nanofiber layers were calculated from wet, dry and half dry conditions and were measured by the wet-up/dry-up method and analysis. All the samples were wetted by Galpore 16 (a wetting liquid with a low surface tension of 16 dyne/cm) and tested. The Automated Capillary Flow Porometer system software calculated the pore sizes according to the ASTM F316-03 (2011) [55].
Evaluation of the filtration performance
According to NIOSH 42 CFR 84, the efficiency level of 95% was tested at a flow rate of 85 L/min at the most penetrating particle size (MPPS) (generally approximately 0.1–0.3 μm) [2,3,10,56]. A TSI Model 8130 Automated Filter Tester (TSI, Inc., St Paul, MN, Figure 1) was used to measure the filter flow resistance (pressure drop in mmH2O column height pressure) and percent filter penetration. The TSI 8130 delivers a solid polydisperse sodium chloride (NaCl) aerosol that meets the particle size distribution criteria set forth in 42 CFR 84 for NIOSH certification. The NaCl aerosol has a count median diameter of 0.075 ± 0.020 µm and a geometric standard deviation not exceeding 1.86. The TSI 8130 uses a photometer to measure the flux of light scattering from aerosol particles. All the tests were conducted at room temperature with a continuous airflow of 85 ± 2 L/min as a short initial efficiency test [57,58]. According to NIOSH requirements, to determine the filtration efficiency of an N95 filtering facepiece, NaCl aerosol loading tests were performed [15]. In our case, the initial penetration is the maximum value of a loading test. This is the level close to the efficiency range limit, and thus, filtration performances were given as initial penetration and resistance. The tests were performed in the filter test mode. Particle penetration P is defined as
(a) Schematic representation of TSI 8130 and (b) filter holder [59].


Results and discussion
The surface morphologies of the electrospun nanofibers of the CA and PVDF nanofibers were investigated by SEM imaging. The representative SEM images of CA and PVDF nanofibers are given in Figures 2 and 3, respectively, according to their polymer concentration at two magnifications. In all cases, uniform CA and PVDF nanofibers were produced. While PVDF nanofibers were more uniform with small polymer splashes, some thicker regions were observed in the SEM images of the CA nanofibers with 1000 × magnification, which also led to a bulkier structure of the CA nanofibers. Fiber distribution histograms are shown in Figure 4. The mean fiber diameters of the produced CA nanofibers were in the range of 319.02 and 264.02 nm, and PVDF nanofibers were produced in the range of 236.50 and 142.50 nm. Differences in the fiber diameters were analyzed by one-way ANOVA followed by a Tukey test for pairwise comparison, and p < 0.05 was considered statistically significant. It was observed that the difference between CA and PVDF nanofiber diameters was statistically important. PVDF nanofibers were thinner than CA nanofibers. It was observed that for both CA and PVDF nanofibers, polymer concentration had a significant effect on fiber diameters. The mean fiber diameter of 16CA nanofibers was significantly larger than that of 15CA nanofibers. The Tukey HSD post hoc test revealed that the mean fiber diameters of 14PVDF, 12PVDF and 10PVDF were significantly different from each other (p < 0.05).
SEM images at 1000 × and 10,000 × magnification of (a) 16CA and (b) 15CA. SEM images at 1000 × and 10,000 × magnification of (a) 14PVDF, (b) 12PVDF and (c) 10PVDF nanofibers. Fiber distribution histograms for CA and PVDF nanofibers.


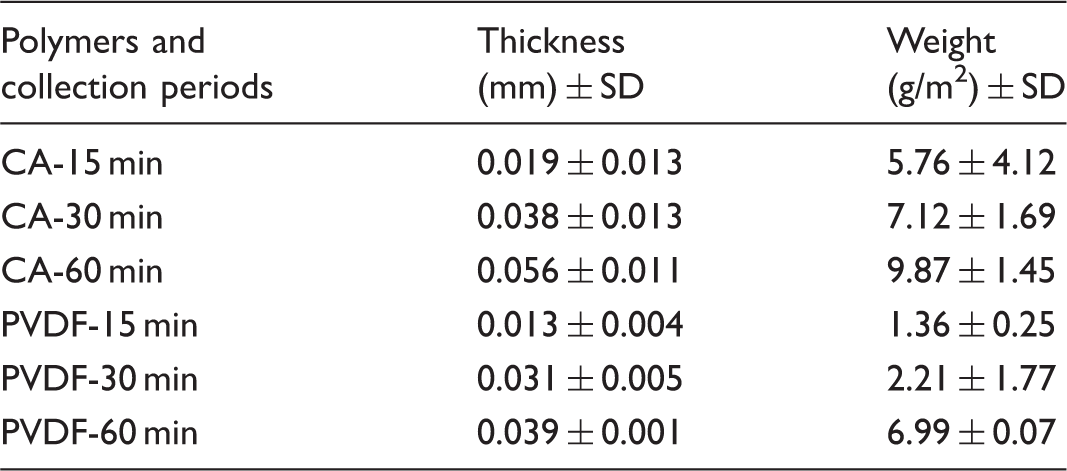
Thickness and weight of CA and PVDF nanofibers.
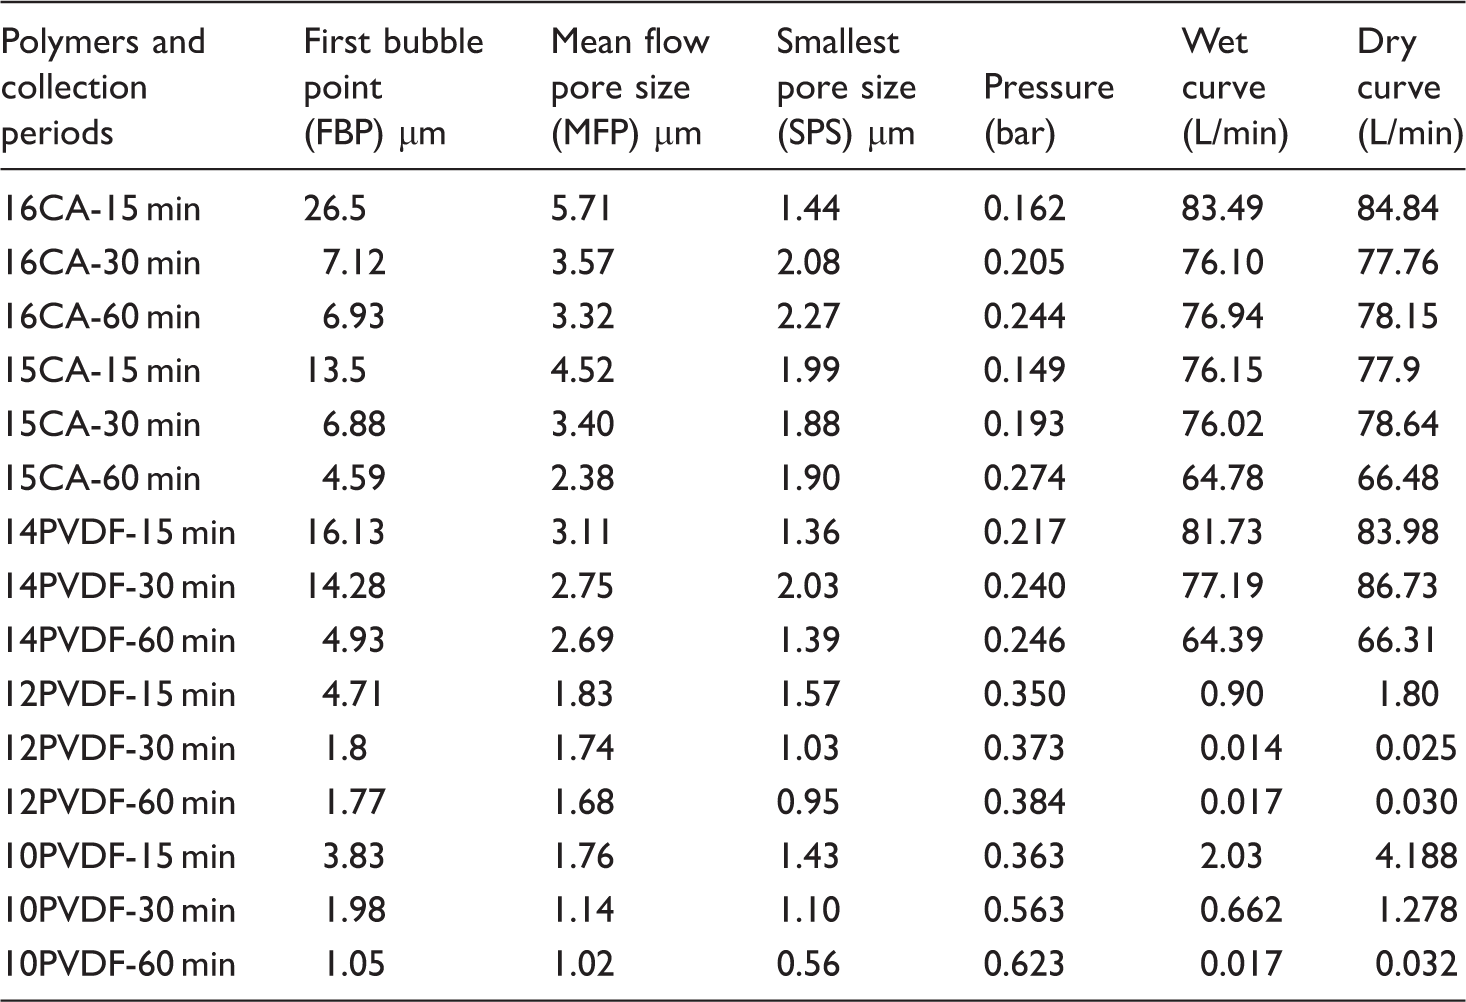
FBP, MFP and pore size distribution are important parameters for determining the arrestment capability of the nanofiber layer [60,61]. FBP, MFP and SPS are given for 16CA and 15CA, 14PVDF, 12PVDF and 10PVDF nanofiber layers in Table 4. Liquid (Galpore 16) flow and air flow values at the relevant pressures (at the closest point of MFP pressure) are also included in Table 4. During the porometry run, the wet and dry curves meet at higher pressures, indicating that all the pores within the membranes have been completely “opened” [62]. Pore size distributions are shown in Figure 2(a) and (b), according to their collection period. It is observed that the pore size of the nanofibers was directly related to the nanofiber diameter and the collection period. 16CA with a nanofiber diameter of 319.02 nm had the highest FBP of 26.5 and MFP of 5.71 µm at 15 min with the thickness of 0.019 mm. FBP and MFP decreased to 7.12 and 6.93, and 3.57 and 3.32 µm, respectively, with increasing thickness. When the nanofiber diameter of 15CA decreased to 264.02 nm, at 60 min with the thickness of 0.056 mm, FBP and MFP decreased to 4.59 and 2.38 µm, respectively. With the increasing collection period, 16CA and 15CA nanofiber mats showed greater resistance to both Galpore 16 and air at the given pressures. Compared to 16CA-60 min and 15CA-60 min mats, the required pressure increased to 0.274 bar for 66.48 L/min of permeability. For PVDF nanofiber mats, 14PVDF-60 min showed similar permeability at 0.246 bar to that of 15CA-60 min. However, with a decreasing polymer concentration, for 12PVDF and 10PVDF nanofiber mats, a dramatic decrease in the permeability was observed. Due to the smaller pore sizes, even at a higher pressure such as 0.623 bar, 0.032 L/min air permeability was observed for the dry curve of 10PVDF-60 min. The smallest FBP, MFP and SPS values were achieved with the finest nanofibers of 10PVDF. The mean nanofiber diameter of the 10PVDF nanofibers was 142.59 nm, and at 30 and 60 min collection periods with the thickness of 0.031 and 0.039 mm, it was possible to achieve FBP and MFP values of approximately 1 µm. Figure 5(a) shows the pore size distributions, and it was observed that the thicknesses of the nanofibers due to the collection period had a significant effect. The picks of the pore size distribution curves were close to each other at each collection period. In Figure 5(b), the pore size distribution curves of 14 PVDF were farther than the pore size distribution curves of 12PVDF and 10 PVDF due to the significantly thicker nanofiber diameter (236 nm). The results also showed that 10PVDF-60 min, 10PVDF-30 min, 12PVDF-60 min and 12PVDF-30 min had the SPSs and narrower pore size distribution curves.
Pore size distributions of (a) 16CA and 15CA and (b) 14PVDF, 12PVDF and 10PVDF nanofibers according to the collection period. Pore size measurements of 16CA, 15CA, 14PVDF, 12PVDF and 10PVDF nanofiber mats according to the collection period.
Filtration performance of blank polypropylene spunbond media and CA and PVDF nanofıbers at 85 L/min.

Bold values met the requirement of at least 95% efficiency with maximum 35 mmH2O of ΔP.
When the collection period was increased, the thickness of the mat increased and penetration decreased. Particles were captured by diffusion, interception and by slip-flow effect. However, it was also observed that an increase in the thickness of the nanofiber mats resulted in an undesired increase in the resistance. The initial penetration of 16CA nanofibers was 22.30, 8.88 and 4.9% for 15, 30 and 60 min, respectively. The NIOSH certification requirements of 95% efficiency and ≤35 mm water column height pressure (mmH2O) were achieved with 16CA-60 min.
It is known that the filter efficiency is improved when the fiber diameter of the filter media decreases [65]. The efficiency curves have a “V” shape, and the deepest point of the “V” indicates MPPS. The MPPS decreases and the capture efficiency of the MPPS increases with decreasing fiber diameter [6,24,65,66]. Finer nanofibers generally enable greater filtration efficiency, particularly for the MPPS. When the polymer concentration of CA decreased to 15%, the mean diameter of CA nanofibers decreased from 319.02 nm to 264.02 nm. It was observed that the NIOSH requirements were achieved with a shorter collection period (30 min) due to the finer fibers. 15CA-30 min nanofiber mats showed a penetration of 4.67% with ΔP of 30.42 mmH2O. In nanofiber production, the nanofiber thickness is controlled by the production period or speed, so that a smaller thickness implies higher production speeds. By using finer nanofibers, it is possible to use higher production speeds to achieve sufficient filtration efficiency.
In the second part of the study, three concentrations of PVDF were used to produce nanofibers. The mean diameter of the electrospun 14PVDF nanofibers was 236.50 nm, and these nanofibers were significantly thinner than both the 16CA and 15CA nanofibers. However, none of the 14PVDF nanofiber mats met the NIOSH requirements. While the 14PVDF-60 min nanofiber mat showed 2.08% penetration, as a result of long collection and finer pores of approximately 2.6 µm, ΔP of 60.43 mmH2O was observed, which was far higher than the requirement. When the polymer concentration decreased to 12% and 10%, fiber diameters decreased to 177.55 and 142.59 nm, respectively. Penetration of 9.41% with ΔP of 23.28 mmH2O for 12PVDF-15 min and penetration of 8.12% with ΔP of 29.44 mmH2O for 10PVDF-15 min were achieved.
The resistance at initial penetration (differential pressure, ΔP, mmH2O), initial penetration (%) and MFP (µm) of 16CA, 15CA, 14PVDF, 12PVDF and 10PVDF nanofibers along with their collection period are shown in Figure 6 to examine the correlation between the pore size, ΔP and penetration (%). It was observed that ΔP increased with decreasing pore size and that decreasing pore size significantly affected the penetration (%). When the collection period was increased, the penetration percentages decreased with the pore sizes, providing better filtration efficiencies.
Resistance at initial penetration (mmH2O), initial penetration (%) and mean flow pore size (MFP) µm of 16CA, 15CA, 14PVDF, 12PVDF and 10PVDF nanofibers together with their collection period.
Filtration performance of PVDF-20 min and double layer of 16CA-15 min+30 min, 15CA-15 min+30 min and 15CA-15 min+15 min, 10PVDF-15 min+15 min nanofıbers.

Bold values met the requirement of at least 95% efficiency with maximum 35 mmH2O of ΔP.
For CA nanofibers, measurements of the face-to-face configuration were performed for 16CA-15 min+30 min, 15CA-15 min+30 min and 15CA-15 min+15 min in order to examine whether it was possible to achieve better results (Table 6). Penetration of 2.36% and ΔP of 32.34 mmH2O were measured for 16CA-15 min+30 min, which are better than the results obtained for 16CA-60 min and 15CA-30 min. However, due to the smaller pore size and thicker and bulkier nanofiber mats, 15CA-15 min+30 min and 15CA-15 min+15 min showed ΔP values higher than 35 mmH2O.
Although PVDF mats had thinner fibers, CA nanofiber mats were bulkier and were more efficient than PVDF nanofiber mats, showing not only that the fiber diameter has a significant effect but also that the thickness of the nanofiber mats has a significant effect on filtration performance. Smaller pore sizes of 12PVDF and 10 PVDF nanofibers compared to that of the CA nanofibers led to higher ΔP values. The results also showed that the weight of approximately 7.12 g/m2 CA nanofiber mat with a mean diameter of 264 nm was sufficient to achieve a penetration of approximately 5% with resistance of approximately 30 mmH2O at a flow rate of 85 L/min. For PVDF nanofibers, two face-to-face PVDF nanofiber mats with a weight of approximately 1.36 g/m2 and a mean diameter of approximately 142 nm can be used to achieve the required penetration and ΔP values.
Conclusion
Most of the commercial filtering facepiece respirators generally use electrostatic filter media that may degrade with time or due to several different factors, whereas an unused nanofiber supported mask will not lose its efficiency with time or due to several different factors because of its mechanical filtration efficiency protection by the layers of the mask. In this study, CA and PVDF nanofiber layers were developed for N95 respirators for the first time. Mean fiber diameters of CA nanofibers were obtained in the range of 319.02–264.02 nm, and PVDF nanofibers were produced with diameters in the range of 236.50–142.50 nm. It was observed that PVDF nanofibers were statistically thinner than CA nanofibers. Polymer concentration had a significant effect on fiber diameter, the mean fiber diameter of 16CA nanofibers was significantly larger than that of the 15CA nanofibers, and the mean fiber diameters of 14PVDF, 12PVDF and 10PVDF were significantly different from each other.
CA and PVDF nanofibers were produced on spunbond polypropylene media. As expected, the thicknesses of the CA and PVDF nanofibers were significantly affected by the collection period and the thicknesses were in the order of 15 min < 30 min < 60 min. However, the polymer concentration did not significantly change the thickness values of the CA and PVDF nanofibers for each collection period. CA and PVDF nanofibers were produced with thicknesses in the range of 0.0191–0.056 mm and of 0.003–0.038 mm, respectively. Since pore size and pore size distribution are important parameters for determining the arrestment capability of a nanofiber layer, FBP, MFP and SPS were measured for CA and PVDF nanofibers. It was observed that 16CA-15 min with a nanofiber diameter of 319.02 nm had the highest FBP and MFP values of 26.5 and 5.71 µm, respectively, with a thickness of 0.019 mm. It was possible to decrease the MFP to 2.38 µm by decreasing the polymer concentration to 15% (15CA) and increasing the collection period to 60 min. According to liquid and air permeability results obtained from wet and dry curves of pore size measurements, the required pressure was increased to 0.274 bar for 66.48 L/min of air permeability for 15CA-60 min mats. On the other hand, due to smaller nanofiber diameters, the liquid and air permeability of 12PVDF and 10PVDF nanofiber mats showed a dramatic decrease. The mean nanofiber diameter of 10PVDF nanofibers was 142.59 nm, and at 30 and 60 min collection periods with mat thicknesses of 0.031 and 0.039 mm, respectively, it was possible to achieve FBP and MFP of approximately 1 µm. Even at a higher pressure such as 0.623 bar, 0.032 L/min of air permeability was observed for the dry curve of 10PVDF-60 min.
The filtration efficiencies (initial penetration, %) and resistance at initial penetration (differential pressure, ΔP, mmH2O) of CA and PVDF nanofibers were compared for different polymer concentrations and collection periods. The initial penetration of 16CA nanofibers was 22.30, 8.88 and 4.9% for 15, 30 and 60 min, respectively. The NIOSH certification requirements of 95% efficiency and ≤35 mm water column height pressure (mmH2O) were achieved only with 16CA-60 min. 15CA-30 min nanofiber mats showed a penetration of 4.67% with ΔP of 30.42 mmH2O. Because of the finer fibers, the NIOSH requirements were achieved with a shorter collection period for 15CA-30 min nanofiber mats.
The mean diameter of 14PVDF nanofibers was 236.50 nm and was significantly smaller than the diameters of both 16CA and 15CA nanofibers. However, none of the 14PVDF nanofiber mats met the NIOSH requirements. Penetration of 9.41% with ΔP of 23.28 mmH2O for 12PVDF-15 min and penetration of 8.12% with ΔP of 29.44 mmH2O for 10PVDF-15 min were achieved with finer nanofibers, but these values were still unsatisfactory. Smaller pores resulted in lower penetration percentages with undesired higher resistances for 30 and 60 min collected 10PVDF and 12PVDF nanofibers. To simulate depth filtration and increase the filtration efficiency, two 10PVDF-15 min nanofiber mats were placed in a face-to-face configuration and measured. Penetration of 1.85% and ΔP of 33.87 mmH2O were achieved. This approach was also attempted for CA nanofibers, but due to the smaller pore size and thicker and bulkier nanofiber mats, 15CA-15 min+30 min and 15CA-15 min+15 min showed ΔP values higher than 35 mmH2O.
Although PVDF mats had thinner fibers compared to CA nanofibers, CA nanofiber mats were bulkier and were more efficient than PVDF nanofiber mats, showing not only that the fiber diameter has a significant effect but also that the thickness of the nanofiber mats has a significant effect on filtration performance.
This study demonstrates that the NIOSH requirements for the N95 particulate filtering half mask of at least 5% of penetration and ΔP of 35 mmH2O can be achieved with CA and PVDF nanofibers with 100% mechanical filtration. A single layer of 16CA-60 min or 15CA-30 min can meet the NIOSH requirements because of their bulky structure using not only surface filtration but also interception and diffusion effects. For PVDF, thinner nanofibers were produced compared to the CA nanofibers, but the N95 requirements could only be achieved with double-layered face-to-face 10PVDF-15 min nanofiber mats. For single layer, CA nanofibers showed better filtration efficiency without increasing the differential pressure at initial penetration.
Footnotes
Acknowledgement
The author would like to thank HIFYBER-Abalıoǧlu Teknoloji for the support given.
Declaration of conflicting interests
The author(s) declared no potential conflicts of interest with respect to the research, authorship, and/or publication of this article.
Funding
The author(s) received no financial support for the research, authorship, and/or publication of this article.