
Abstract
One of the most important characteristics that a filter must possess is high air permeability. A good filter fabric must be able to capture the dust particles while maintaining a good airflow through it in order to reduce high pressure drop. Therefore, producing a filter fabric with the desired air permeability can be challenging as several process parameters such as fiber types, area weight and water jet pressure will interact with each other during spunlacing process and influence the fabric air permeability. To study the effects of these independent variables on the air permeability of three different types of spunlaced fabrics, the Box–Behnken design was used to model their effects. The fibers used were polyacrylonitrile, polyphenylene sulfide and blend of polyphenylene sulfide/polyimide. In addition, filtration properties of some of the filter samples were also evaluated. Based on the effects of the fiber types, area weight and water jet pressure on the fabric air permeability, the optimum conditions for achieving higher air permeability were fiber types (+1 level), area weight (0 level) and pressure (−1 level), respectively. The air permeability of the fabrics decreased with increasing water jet pressure for all fiber types and increasing area weight decreased the air permeability. It was observed that the independent variables had a significant effect on the air permeability. Filtration efficiency of the selected filters samples were ≥95%. Among the selected samples, polyphenylene sulfide/polyimide (440 g/m2) fabric has the lowest pressure drop whereas polyacrylonitrile (560 g/m2) has the highest pressure drop.
Keywords
Introduction
Nonwoven filter fabrics are widely used for air filtration application in order to capture harmful dust particles that can cause harm to humans and the environment. Polyacrylonitrile (PAN), polyphenylene sulfide (PPS) and polyimide (PI) fibers are generally used to manufacture filter fabrics (in the form of filter bags) for coal fired power plants, where the filters are exposed to higher temperatures and harsher chemical environment. These fibers have good thermal and chemical resistances, therefore, they are widely used in coal fired power plants [1].
Air permeability is one of the important factors need to be considered when designing a filter fabric. It determines how efficient the fabric will be when a particular volume of air flows through it. In other words, it determines the pressure drop of a filter fabric. A good filter fabric must have high filtration efficiency whilst maintaining a reasonable higher air permeability [1]. The air permeability can be used to determine lifetime of the filter bags since it is related to the pressure drop. Once a fabric reaches its optimum high pressure drop that it must not exceed during operation and this optimum pressure cannot be reduced by cleaning, the filter is assumed to have reached its lifetime and must be replaced.
Needle-punching technique is the historical inexpensive method of producing filter fabrics with good structural and filtration properties. Nevertheless, the needles it uses to entangle the fibers can cause damage to the fibers by piercing them when fibers are pushed downwards [2]. Because of the damage to the fibers, the fabric structure is compromised and during actual operation when the fabric bags are subjected to external forces, the fabric properties such as tensile strength, dust collection efficiency and air permeability can be adversely affected, thereby necessitating the need to remove the fabric bags [3]. It is on this basis that an alternative fabric manufacturing technique such as spunlacing technique has been explored to produce fabrics without damaging the fibers. The spunlacing web bonding technique uses high pressure water jets as opposed to the needles to entangle the fibers [3,4]. It must be noted that the use of extreme water jet pressure is known to cause fiber damage but such high pressures are rarely required to entangle fibers. Another advantage of the spunlacing is that it is able to produce fabrics which are lighter in weight than that of the needle-punching. As a result, the produced spunlaced fabrics tend to have higher air permeability, an important filtration performance property for filter bags. The lighter fabrics require less fiber materials to produce and this reduces the raw material cost as PAN, PPS, PI are expensive as compared to regular fibers such as polypropylene (PP), polyester, nylon, etc.
In assessing the filtration of the fabrics, it is observed that there is a linear relationship between the porosity and air permeability of the fabric. When porosity of the filter fabric increases, it is accompanied by an increase in air permeability. The same linear relationship is observed when the opposite occurs [5–7]. A filter fabric with smaller pore sizes generally has lower air permeability due to reduced porosity. During filtration operation such fabric will be quickly clogged by the dust particles and thereby experiences shorter filtration cycles which will increase the energy cost of operating the baghouse due to frequent cleaning cycles [8]. Filter fabrics that can maintain high air permeability during filtration are inexpensive to maintain and tend to have longer lifetime as they are subjected to fewer cleaning cycles in a given period of time thereby minimizing the external forces that the fabrics are subjected to during cleaning phase [9].
Depending on the desired fabric air permeability required, the spunlacing water jet pressures can be varied to produce fabrics with a low or high air permeability. The use of lower water jet pressures produces filter fabrics with high air permeability whereas the higher water jet pressures produce the opposite results. The higher air permeability of the fabrics produced at lower water jet pressures is due to less entanglement of fibers since less energy being transferred to the fibers. In the case of higher water jet pressure, more energy is transferred to the fibers and thereby increasing movement of fibers which increases fiber entanglement and such filter fabrics are more compact with reduced air permeability [6,10].
During the production of nonwoven filter fabrics, woven fabric scrims are incorporated in between the web layers in order to further enhance the fabric strength, however this result in decreased air permeability due to increase fiber entanglement between the nonwoven and woven structures, making the fabric more compact with reduced pore sizes, hence resulting in decreased air permeability [11].
During operation, the air permeability of the filter fabric bags gradually decreases due to the residual dust particles that remain attached to the fibers even though the bags are continuously cleaned. When the filter bags reach a stage in their lifetime when cleaning cannot remove sufficient dust that will make sure that the desired operating air flow rate is maintained, the bags are replaced with new ones. The replacement of bags is very costly and it is one of the disadvantages of using filter fabric bags [9,12,13]. The conventional lifetime of the bags is around 3–5 years [14].
The traditional method of optimizing experimental responses was performed by changing one variable at a time. This technique was referred to as univariate technique. It does not show the simultaneous interactions of the different variables being studied. The univariate is time consuming and expensive to run as the number of experimental runs are increased in order to study the interactions effects of different variables [15]. In order to overcome the disadvantages of the univariate, multivariable techniques such as response surface methodology (RSM) are often used as they are faster, more economical and effective. They allow for the interaction effects of different variables to be investigated simultaneously. It is based on the fit of a polynomial equation to the experimental data with the aim of making a statistical prediction. The objective of the RSM is to optimize simultaneously all variables in order to ensure that the system runs at an optimal level. In the design of the experiments, the parameters are varied to find their optimum levels that can help to achieve maximum outputs. The maximum or minimum outputs can be achieved by finding the optimum conditions of the parameters. The chosen experimental methodology should be economical in terms of time and material cost [16].
RSM such as the Box–Behnken design is economical to use due to the fact that it requires only 15 runs in order to study the effects and interaction of the independent variables being studied. It ensures that all the points are within the safe operating zone, i.e. minimum and maximum. Each independent variable is specified at three levels, i.e. low, medium and high [15,17]. The aim of this study was to investigate the effects of the fiber type, area weight and water jet pressure on the air permeability of spunlaced fabrics using the Box–Behnken experimental design. Three different fibers PAN, PPS and PPS/PI blends were selected and their air permeability properties were studied. Furthermore, filtration properties (filtration efficiency, dust holding capacity and pressure drop) of some of the developed filter samples were also evaluated.
Experimental
Sample preparation
The specifications of three types of fabrics (PAN, PPS and blended PPS/PI) are discussed in Table 2 (see supporting Table 2). Each fabric type was composed of three web layers. The webs were prepared on the carding machine. The first layers were composed of 1.7 dtex fibers whereas the two remaining layers, the second and third layers were composed of 2.2 dtex fibers. For the blended PPS/PI fabric, the 1.7 dtex PI fibers were used to produce the first layers with the second and third layers comprising only of 100% 2.2 dtex PPS fibers (see supporting Table 3). The webs were pre-needled in order to stabilize their fragile structure and then the woven fabric scrims were incorporated between the second and third layers.
The carded webs with the incorporated scrims were spunlaced on the Fleissner Aquajet hydroentanglement machine with three manifolds. The first manifold is used for pre-wetting, whereas the second and third used for spunlacing at three higher water jet pressure of 60, 80 and 100 bar. The pre-wetting pressure was kept constant at 10 bar for all types of fabrics. The weights of the fabrics were 440, 500 and 560 g/m2, respectively. The samples were allowed to dry for 48 hours and then conditioned in a standard laboratory testing conditions of 21 ± 2℃ and a relative humidity of 65 ± 2% for 24 hours prior to testing.
Box–Behnken experimental design
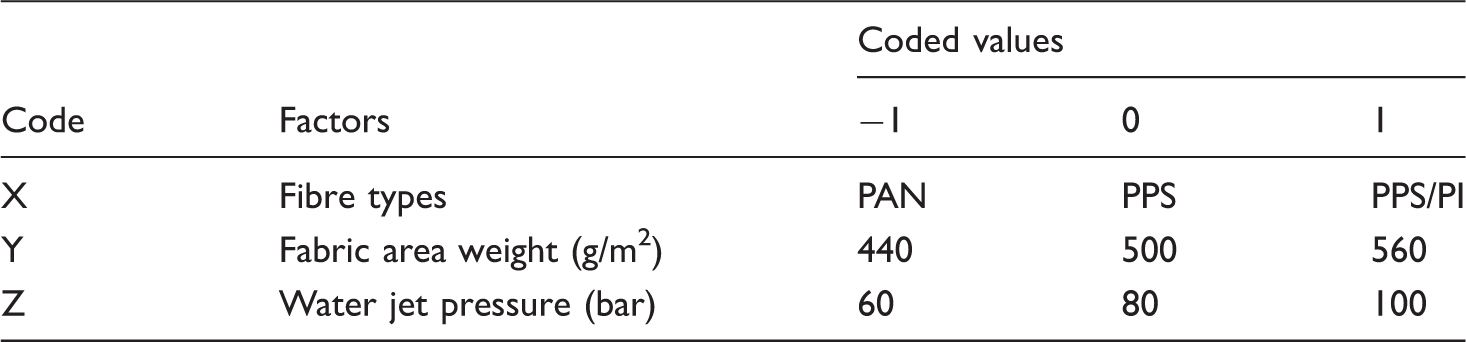
In this study, a 3×3 Box–Behnken experimental design (BBD) was used to optimize the independent variables using Systat 10, Systat Software, Inc., USA. The three independent variables studied were fabric area weight, fiber types and water jet pressure, respectively. They were varied at three levels as low (−1), center (0) and high (+1) as shown in Table 3 (see supporting Table 3). In the BBD method, 15 experimental runs were conducted. The statistical significance of the predicted model was evaluated by using the analysis of variance (ANOVA) and least squares technique. The ANOVA determines which independent variables have a significant influence on the output variable, with those having a p-value greater than 0.05% being regarded as residual errors and they are not used in the further analysis [17]. The coefficient of determination (R2) is used to express quality of fit of the polynomial model equation [18].
Air permeability measurement
Air permeability was measured using a FX 3300 machine from Textest AG, Switzerland; according to ASTM D737-18 standard method [19]. Five samples were taken randomly across the fabric and measured. Each sample was tested using an air pressure of 125 Pa over an area of 20 cm2. The air permeability was expressed in l/m2/s.
Filtration parameters
The dust filtration apparatus was used to evaluate filtration parameters, namely filtration efficiency, dust holding capacity and pressure drop according to the ASHRAE standard 52.2 [20]. Dust particles in the range of 0.6–180 µm were fed at a constant rate to the filtration device and deposited on the samples having an area of 0.0095 m2. The other test parameters were: air temperature: 21℃, air humidity: 66% and flow velocity: 4 m/s. The pressure drop (differential pressure at end) was variable depending upon the sample types. It ranges from 1.02 bar to 0.65 bar.
Results and discussion
Statistical analysis of parameters on air permeability
The results indicate that BBD is a very effective and powerful tool for optimizing individual variables in a process. Its model was used to describe the relationship between the independent variables which can predict the dependent variable (air permeability). The polynomial equation generated by this experimental design was used to model the relationship between the three experimental variables and air permeability as shown in equation (1):

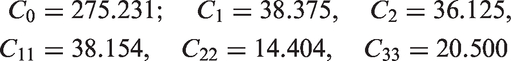
After substituting the coefficients in equation (1) the following equation was obtained

The coded and uncoded symbols of variables and values of air permeability.

PAN: polyacrylonitrile; PPS: polyphenylene sulfide; PI: polyimide.
Effects of tested independent variables on fabric air permeability
The relationships between air permeability and the three experimental variables are shown in Figures 2 to 4, with each plot showing the relationship between two of the experimental variables on the air permeability, while the other experimental variable was kept constant at −1, 0 or 1 levels. The two variables are within a range of −1 to 1 levels. The elliptical contour plots shows the interactions between the independent and dependent variables.
The differences in air permeability of the different types of fabrics can be attributed to their different fiber shapes and densities. The densities of PAN, PPS and PI fibers are 1.18 g/cm3, 1.44 g/cm3 and 1.41 g/cm3, respectively. Due to the lower density of the PAN fibers, the PAN fabrics contained more fibers per area than the PPS and PPS/PI fabrics with the same area weight. More number of fibers per unit area increases air flow resistance, hence the lower air permeability of the PAN fabrics than that of both PPS and PPS/PI fabrics. Another factor that is known to influence the air permeability is the shapes of fibers. Fibers that have irregular shape have lower air permeabilities due to the increase contact between the fibers and air particles. The shapes also influence the fiber to fiber contact and increases inter-fiber friction leading to an increase in compactness of the fabric and decreasing air permeability. A typical SEM images of the PAN and PPS filters are shown in Figure 1(a) and (b). As shown in Figure 1(a), PAN fibers have lower air permeabilities as compared to the PPS fibers as shown in Figure 1(b), due to their irregular shape and more fibers were present in a given area as compared to the PPS fibers, thereby increasing fiber compactness and decreasing air permeability.
(a) A typical cross-section of the PAN fibers (440 g/m2, 80 bar, Expt. no. 1). (b) A typical cross-section of the PPS fibers (500 g/m2, 80 bar, Expt. no. 13).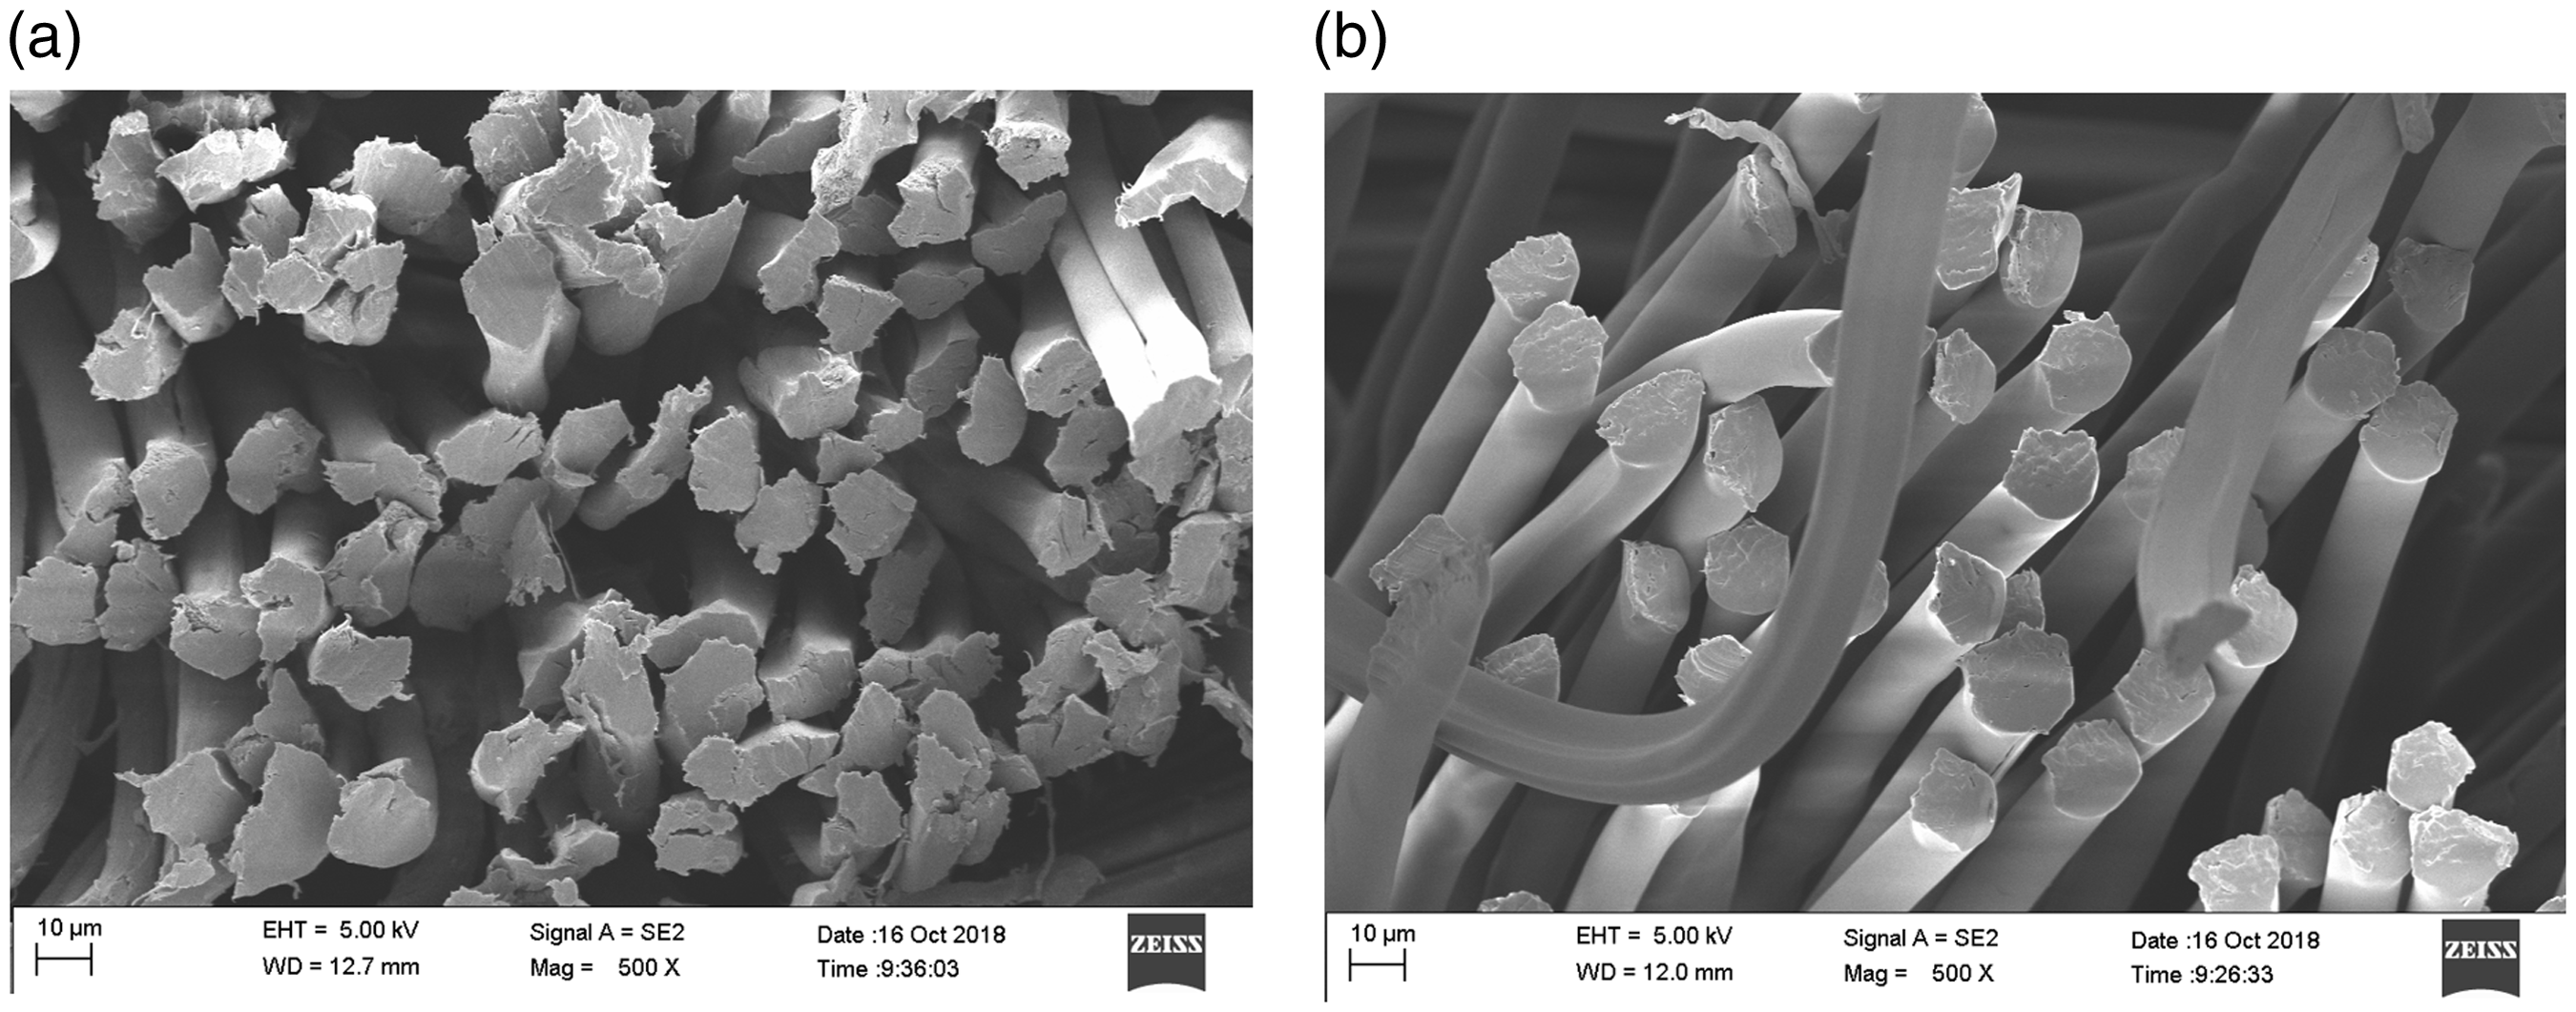
Effects of pressure, fiber types and area weight on the air permeability
Figure 2(a) to (c) shows the contour plots of water jet pressure (or pressure) and area weight on the air permeability, with the different fabric types −1 (PAN), 0 (PPS) or 1 (PPS/PI) being kept constant. When water jet pressure was increased from 60 (−1) to 80 (0) and then to 100 (1) bar, the air permeability decreased for all types of fabrics. On the other hand, when the area weight was increased from 440 (−1) to 500 (0) g/m2, there was an increase in air permeability, however, with further increases from 500 to 560 (1) g/m2, it started to decrease. The decrease in air permeability can be attributed to both an increase in fiber entanglement at higher water jet pressures and an increase in fabric area weight.
Some of the SEM images of PAN filter fabrics at 80 bar and 100 bar is shown in Figure 2(d) and (e), supporting the above findings by showing increasing entanglement of fibers at higher water jet pressure. Patanaik et al. [6] reported that fabrics spunlaced at lower water jet pressure tend to have a less compact fabric structure, i.e. a more opened structure than those spunlaced at higher water jet pressure, and as a result, have higher air permeability. According to Midha and Mukhopadyay [11] and Kumar [22] another contributing factor to the decrease in air permeability can be an increase in area weight due to increase number of fibers per unit area which increase the resistance between the fibers and air particles.
(a) The contour plots of pressure and area weight on PAN fabric air permeability. (b) The contour plots of pressure and area weight on PPS fabric air permeability. (c) The contour plots of pressure and area weight on PPS/PI fabric air permeability. (d) A typical SEM images of PAN fabric at 80 bar (440 g/m2, 80 bar, Expt. no. 1). (e) A typical SEM images of PAN fabric at 100 bar (500 g/m2, 100 bar, Expt. no. 7). (a) The contour plots of fiber types and pressure on fabric air permeability at 440 g/m2. (b) The contour plots fiber types and pressure on fabric air permeability at 500 g/m2. (c) The contour plots of fiber types and pressure on fabric air permeability at 560 g/m2. (a) The contour plots of fiber types and area weight on air permeability at a pressure of 60 bar. (b) The contour plots of fiber types and area weight on air permeability at a pressure of 80 bar. (c) The contour plots of fiber types and area weight on air permeability at a pressure of 100 bar.

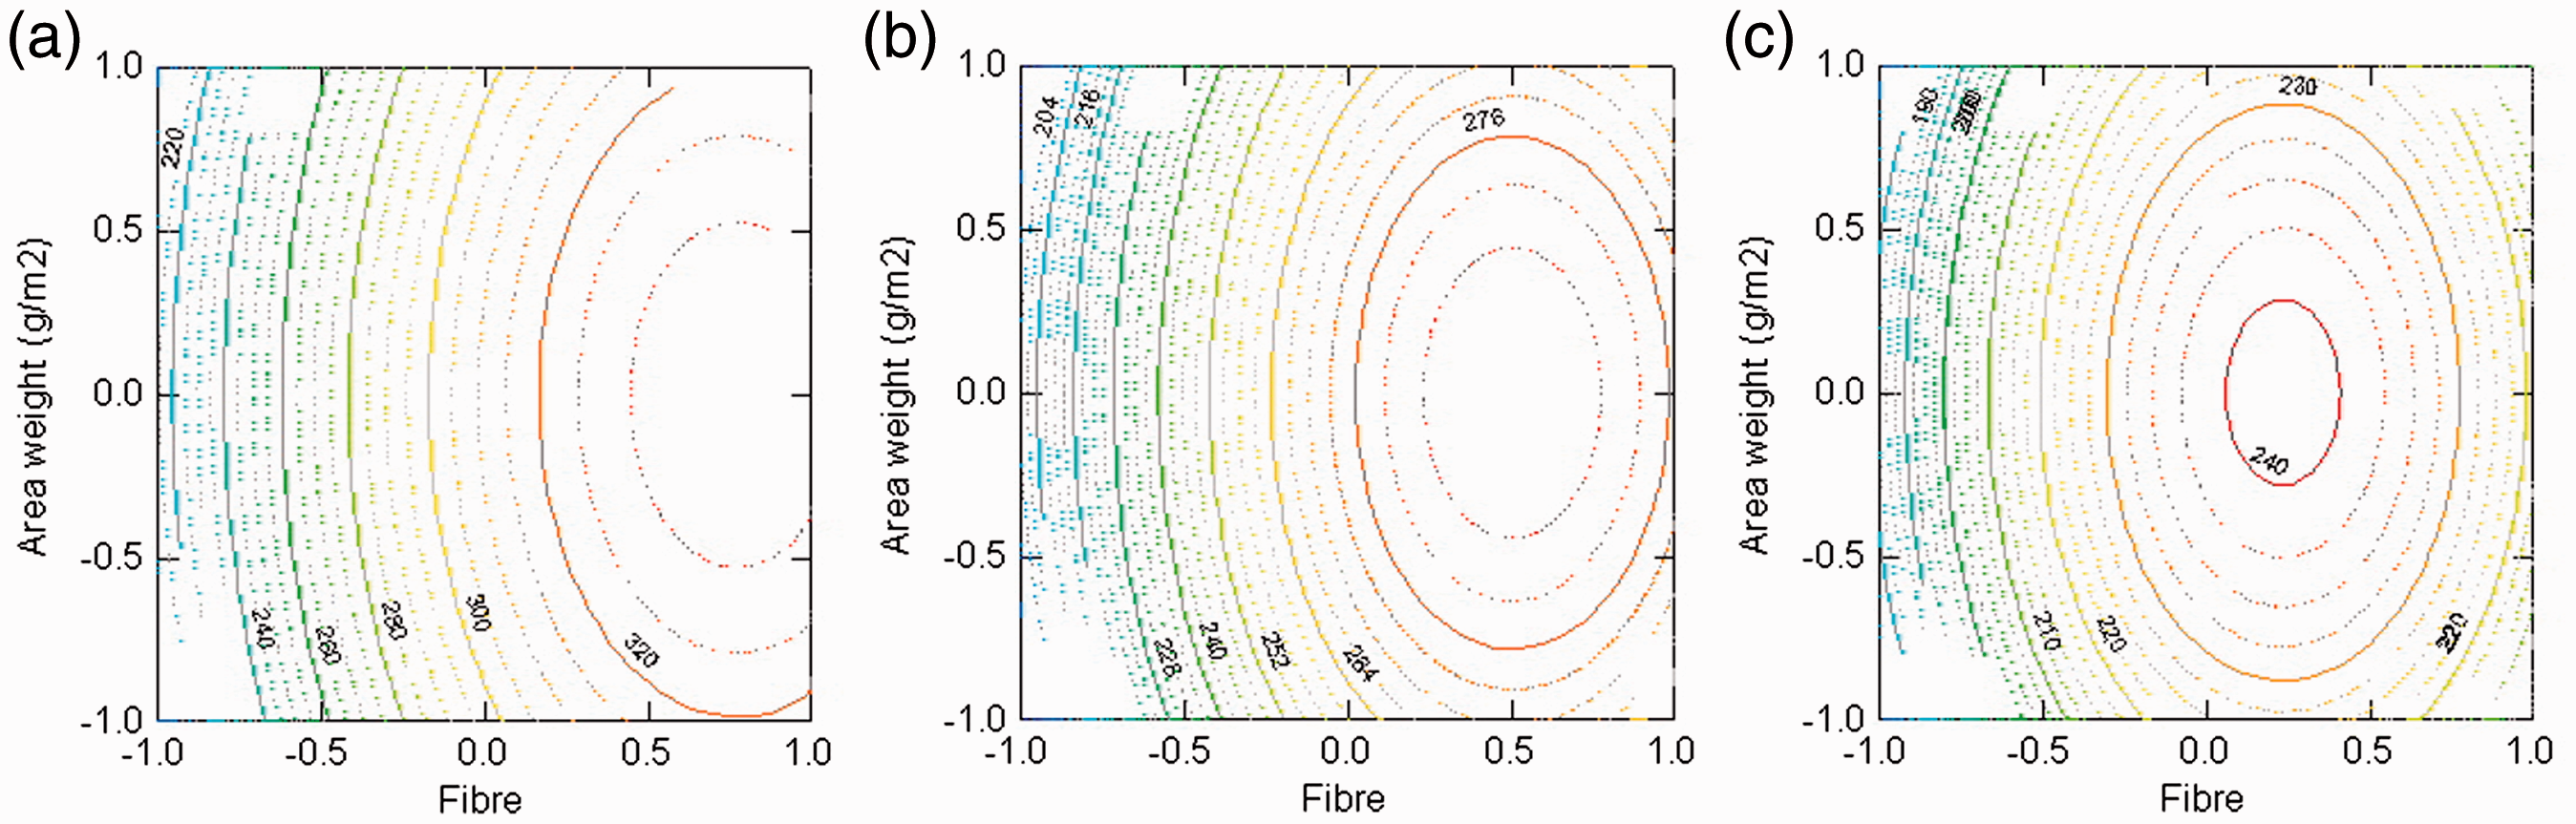
As it can be seen in Figure 2(a) an increase in water jet pressure from 60 to 80 bar resulted in decreasing air permeability by 8% from about 200 to 184 l/m2/s and when the pressure was increased from 80 to 100 bar, it also decreased by 8% from 184 to 169 l/m2/s. The overall decrease in air permeability from 60 to 100 bar was double at 16%. When the area weight was increased from 440 to 500 g/m2 there was 7% increase from 200 to 214 l/m2/s and then afterwards it also decreased by 7% from 214 to 200 l/m2/s when the weight was increased from 500 to 560 g/m2. The air permeability of the 500 g/m2 was higher than that of 440 g/m2 even though it had a higher area weight, and this was due to the fact that the 440 g/m2 was more compact due to its higher entanglement of fibers than 500 g/m2 at the same water jet pressure, making the latter to have a more opened structure even though it had more fibers per unit area. As more fibers are added to the fabric the influence of the water jet pressure decrease with number of fibers contained per area having a more dominant impact on fabric air permeability, resulting in increased resistance between high number of fibers and air particles. This reasoning explains why air permeability decreased when the area weight was increased from 500 to 560 g/m2.
In contrast to this reasoning, an increase in air permeability that was observed when area weight was increased from 440 to 500 g/m2, can be attributed to less entanglement of fibers at about 0 level and as a result the fabric was less compact at 500 g/m2 than at 440 g/m2, hence, the higher air permeability of 500 g/m2. At the same water jet pressure, a fabric that contains less number of fibers per unit area will absorb more energy and be more entangled, making the fabric more compact than a fabric which has a higher area weight.
Similar behaviors were in observed in Figure 2(b) and (c). In Figure 2(b), the air permeability decreased by 12% from 297 to 261 l/m2/s, when the water jet pressure was increased from 60 to 80 bar and thereafter it decreased 14% from 261 to 225 l/m2/s when water jet pressure was increased to 100 bar. When the area weight was increased from 440 to 500 g/m2, the air permeability increased by 5% from 297 to 311 l/m2/s and increasing further from 500 to 560g/m2 resulted in 5% 311 to 297 l/m2/s.
Effects of pressure and fiber types on the air permeability at different area weight
In Figure 3(a) to (c) changing the fabrics (fibers) from PAN (−1) to PPS (0) and then to PPS/PI (1), resulted in an increase in air permeability. The high air permeability of the PPS/PI than PPS can be attributed to the different shapes of the PPS and PI fibers, since blending of PPS and PI should have resulted in a decrease due to lower density of PI fibers. Different shapes can lead to poor entanglement of fibers, thereby creating a more opened fabric structure. When the water jet pressure was increased from 60 to 80 bar and then to 100 bar, there was a decrease in fabric air permeability. The decrease as the water jet pressure was being increased can be attributed to the higher entanglement of fibers, making the fabric more compact with reduced porosity. At the same water jet pressure, a fabric that contains fewer fibers per unit area will absorb more energy and thereby have a greater fiber entanglement, resulting in a more compact structure and therefore a lower air permeability.
In Figure 3(a) when the fabric was changed from PAN to PPS, there was an increase in air permeability from about 220 to 297 l/m2/s which was an increase of about 49% and changing from PPS to PPS/PI, resulted in an increase from 297 to 318 which was about 7%. As earlier indicated these differences can be attributed to the densities and different shapes of fibers used to make the fabrics. On the other hand, when the water jet pressure was increased from 60 to 80 bar, there was 8% decreased from 200 to 184 l/m2/s and further increases from 80 to 100 bar decreased air permeability by 9%.
In Figure 3(b) and (c), the same trend as in Figure 3(a) was observed. Both Figure 3(b) and (c) have similar performance with air permeability increasing by 45%, from 214 to 311 l/m2/s, when the fabric was changed from PAN to PPS and from PPS to PPS/PI it increased by 7% from 311 to 332 l/m2/s. When the water jet pressure was increased, it decreased by 7% and then decreased by 8%.
Effects of area weight and fiber types on the air permeability of fabrics at different water jet pressure
Figure 4(a) to (c) shows the effects of fabric type and area weight on air permeability at different water jet pressure levels −1, 0 and 1 (60, 80 and 100) bar. When the area weight was increased from 440 to 500 g/m2, it resulted an increase in air permeability, but, when the area weight was changed from 500 to 560 g/m2, it resulted in a decrease in air permeability. The increase and decrease were due to decrease compactness and more number of fibers contained per area as previously discussed. As seen previously changing fabrics from PAN to PPS and then to PPS/PI resulted in increased fabric air permeability. At these conditions, an increase water jet pressure from 60 to 100 bar was accompanied by a decrease in air permeability.
Based on the effects of the fiber type, area weight and water jet pressure on the fabric air permeability, the optimum conditions for achieving higher air permeability were fiber types (+1 level), area weight (0 level) and pressure (−1 level), respectively. The optimum condition correspondence to PPS/PI fibers, 500 g/m2 area weight and 60 bar water jet amongst the selected process spunlaced parameters (Expt. no. 6, Table 1). The air permeability of the fabric decreased with increasing water jet pressure for all fiber types and area weight decreases the air permeability.
Filtration properties
Some samples, namely PAN (440 g/m2), PAN (560 g/m2), PPS (500 g/m2) and PPS/PI (440 g/m2) were evaluated for filtration properties (Tables 6 and 9). The reason for choosing these samples were based on the fact that selection of spunlacing parameters for producing good fabric properties and at the same it should be time cost effective as we were dealing with water jet pressure. Any increase in water pressure will add to the fabric production cost. There is no point in producing fabrics with higher pressure if similar or comparable properties can be achieved at a lower pressure. Three samples, namely PAN (440 g/m2-Expt. No. 1), PPS (500 g/m2-Expt. no. 13), PPS/PI (440 g/m2-Expt. no. 2) were chosen, based on the fact that the optimized fabrics produced at 80 bar possessed good filter fabric properties and were cost effective to produce them. The other sample PAN (560 g/m2-Expt. no. 3) were also chosen for comparison purpose.
All the filter fabrics that were tested were found to have ≥95% filtration efficiency (Table 6). This was attributed to the ability of fibrous filter fabrics to capture dust particles that were even smaller than the fabric pores. Among the selected samples, PPS/PI fabric has the lowest pressure drop, whereas PAN (560 g/m2) has the highest pressure drop. The lowest pressure drop of PPS/PI fabric can be attributed to the presence of finer PI fibers on the surface. Furthermore, the thickness of the samples were also playing a role in determining the pressure drop property. The thickness of the samples was 1.9 mm for PAN (440 g/m2), 2.13 mm for PAN (560 g/m2), 1.97 mm for PPS (500 g/m2) and 1.86 mm for PPS/PI (440 g/m2). The lowest pressure drop of PPS/PI (440 g/m2) as compared to the PAN (560 g/m2) can be attributed to the difference in the thickness values [6]. There was not much difference in the pressure drop values for other samples.
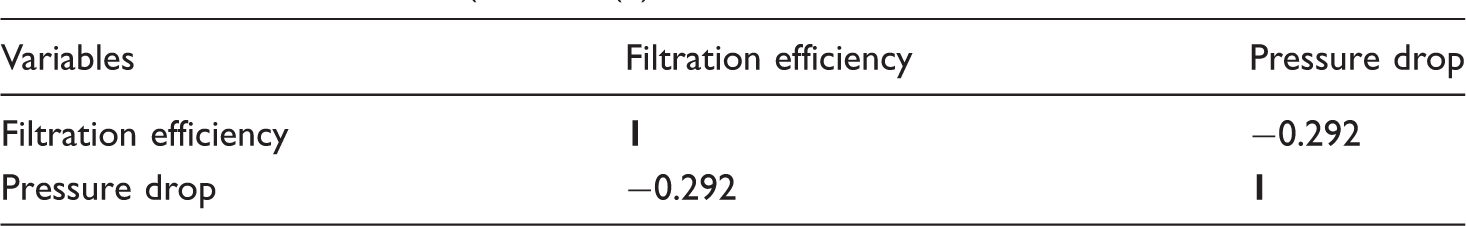
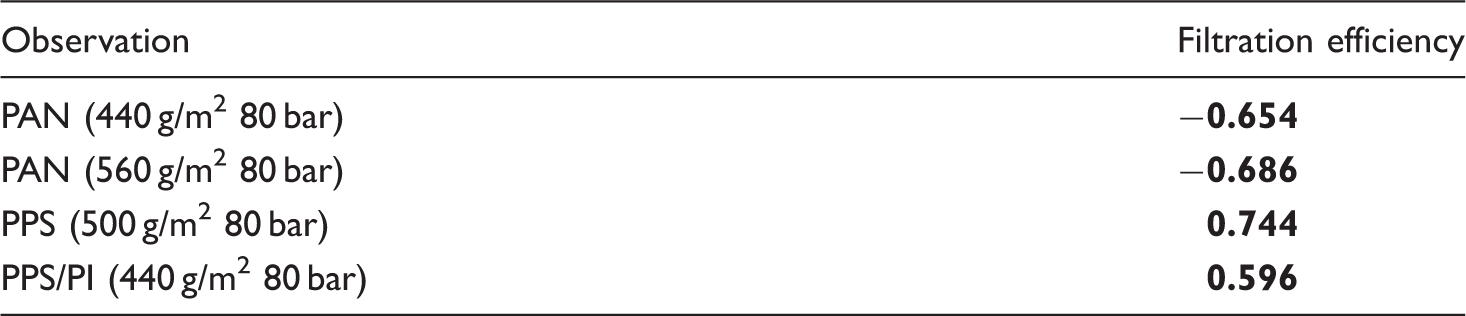
Quality factor analysis has been applied for filtration efficiency and pressure drop properties. Filtration efficiency has the highest correlation as compared to the pressure drop (Tables 7). Among the fabrics samples, PPS (500 g/m2 80 bar) and PPS/PI (440 g/m2 80 bar) showed the highest filtration efficiency and quality factor (Table 8).
From Table 9, it can be seen that there was a linear relationship between the filtration efficiency and dust holding capacity. Morris and Allen [23] reported that as more dust particles were collected by the filter fabric, they form a cake layer which serves as a filtration media, thereby further enhancing the fabric filtration efficiency. The higher dust capacity of the PPS 500 g/m2 fabric was attributed to the amount of dust particles it captured and thicker cake layer formed on its surface. There was not much differences in the filtration efficiency of other types, it ranged from 94.9 to 96%.
For the dust holding capacity, a quality factor analysis has been done to find the weighted quality factor (cumulative) and maximize quality factor index (cumulative %) as shown in Table 9 and Figure 5. The PPS (500 g/m2 80 bar) has the highest dust holding capacity followed by PPS/PI (440 g/m2 80 bar).
Dust holding capacity and cumulative dust holding capacity (%) of the fabrics.
Average diameters of the fibers were PAN: 15.13 µm, PPS: 15.28 µm, PPS/PI: 15.61 µm and PI: 15.02, respectively. As indicated previously, finer fiber diameters in case of PAN resulted in lowest air permeability and comparatively coarser diameters of PPS/PI showed highest air permeability. In terms of filtration efficiency, PPS has the highest followed by PPS/PI. Although PAN has the lowest diameter, it values for filtration efficiency was close to that of the PPS and PPS/PI. Another factor may be the range of fiber fineness selected for the studies were very close to each other. These ranges were currently used by the power plants for filtration fabrics due to several concurrent technical requirements such as filtration, air permeability, tensile, shrinkage, acid and chemical resistance.
Conclusion
Fabric specification.

Box-Behnken experimental design.
ANOVA of the relationship between independent variables on the dependent variable (air permeability).

ANOVA for air permeability.

Filtration efficiency and pressure drop properties of the fabrics.

Correlation matrix (Pearson (n).
Factor scores.
The coded and uncoded symbols of variables and values of air permeability.

Footnotes
Acknowledgements
The authors acknowledge that opinions, findings, and conclusions expressed in any publication generated by the supported research are those of the authors, and that the sponsors accept no liability in this regard.
Declaration of conflicting interests
The author(s) declared no potential conflicts of interest with respect to the research, authorship, and/or publication of this article.
Funding
The author(s) disclosed receipt of the following financial support for the research, authorship, and/or publication of this article: This work is based on the research supported in part by the National Research Foundation of South Africa (grant-specific unique reference numbers (UID) 96714 and 104840).