
Abstract
Oriented fibres and materials based on orientated fibres have great potential for use in tissue engineering for tissues, where the arrangement of extracellular matrix is fundamental. The drawing method is based on mechanical pulling of a polymer solution out of its base droplet, resulting in a solidified fibre of determined geometrical characteristics. A new machine designed for lab scale drawing was invented enabling a repeatable quality of drawing conditions. The results demonstrate that it is possible to influence and define the fibre diameter and its distribution. From the in vitro experiments, it is evident that the aligned fibres guide the cell growth in the direction of the fibres. Moreover, the prepared fibres were functionalised with polypyrrole as an example of their versatility. These features make drawing an easy and suitable tool for the fabrication of scaffolds with a precise structure for tissues, e.g. nerve tissue.
Keywords
Introduction
Nowadays, there are nonwoven technologies, e.g. electrospinning, forcespinning, melt-blown and others, used for the fabrication of micro- or nanofibres from various types of polymers [1]. They are reasonably productive; nevertheless, their big disadvantage is that the fibrous structure is rather random. Moreover, there is a relatively high consumption of the polymer used. In contrast, drawing has lower fibre productivity, but is able to produce highly oriented structures and patterns. This is enabled due to the manipulation of a single fibre that can be prepared from a very small amount of polymer. Even though electrospinning with a rotational collector provides aligned fibres as well [2], there is no possibility to manipulate the single fibres for the preparation of more sophisticated fibrous structures.
Mechanical drawing of fibres can be divided into two categories: drawing from a melt [3] or a solution [4–6]. The first attempt to draw a fibre was already accomplished in the 19th century. The fibre was prepared by shooting an arrow from a droplet of a melted polymer by a crossbow [7]. In 1998, a modern experiment on a microscopic scale was conducted by Ondarcuhu and and Joachim. They were able to draw a single nanofibre from a droplet of a polymer solution using a retracting tip of STM (scanning tunnelling microscope) [8]. Drawing was also used to produce fibres mainly for optical devices: optical sensing, nanophotonic fibres in the range of tens of nanometres in diameter and up to tens of centimetres in length [3,6,9,10]. In 2004, Harfenist et al. [11] conducted a study where they were able to draw fibres several micrometres in length and down to 130 nm in diameter using a nanometre resolution positioning micromill or atomic force microscopy and up to several centimetres in length when puling the fibre by hand. Nevertheless, they described the fibre drawing process as not-well controlled since the fibre drawing can be done in a very limited period of time before the polymer droplet solidifies. They also described that the polymer droplet needed to be allowed to dry for up to 1 min before starting the drawing process and suggested some improvements such as a dosing system for the polymer.
As it was proved previously, aligned fibres can be beneficial for the cell growth in specific applications for tissue engineering [12–14]. The most pronounced field of the use of the oriented fibres is probably the neural tissue engineering, where the aligned fibres guide the axonal outgrowth better than the randomly ordered fibres [15]. Very often, neural tissue implants are modified by conductive polymers, mostly polypyrrole, since it has been proven to improve the cell adhesion, proliferation and neurite extension [16,17]. That is why we used the aligned drawn fibres for further functionalisation with polypyrrole and its subsequent in vitro testing. However, drawing could find its use for other medical applications as well. Very promising fields are hernia meshes or tendons [16].
Herein we present an automated tabletop manipulator developed for the lab scale drawing from polymer solutions. The influence of various conditions (solution viscosity, speed and trajectory of drawing, solvent evaporation etc.) on the properties of the fibres was studied on an example of poly-ɛ-caprolactone (PCL). Moreover, the prepared fibres were modified with polypyrrole to show the further possibilities of the drawn samples and the cell culturing was carried out on the scaffolds to prove their biocompatibility.
Experimental
Manipulator construction
The manipulator is a universal machine with an extendable manner of design (Figure 1). The core of the machine is a high precision positioning system. The machine is extendable due to an aluminium-profile building system. It is equipped with a polymer dosing device and lighting and it is possible to equip the manipulator with additional modules, such as twisting, a protective cover, etc. The machine is built on an ITEM24 construction system. To ensure its fluent motion, professional positioning axes (BAHR Modultechnik GmbH, Germany) with a synchronous belt were used. Three axes are set up to a Cartesian coordinate system, where X-Z is connected to a gantry X-shape (ELZI, Czech Republic) system, and axis Y is doubled and joined with a synchronizing rod. Pulleys are connected to a servomotor through an elastic clutch. The servomotors possess 2 × 0.45 Nm and 0.84 Nm, at 4500 r/min nominal. The machine is controlled by isiMotion system, connected to a panel PC. The workspace dimensions are 1 × 0.2 × 0.2 m and the repeating accuracy of this system is ±0.1 mm. A digital dispenser (OKI International, Germany) connected to a standard air compressor with an air accumulator is used as a polymer dosing device. The dispenser is connected to the syringe with an exchangeable tip (different size of the tip can be used).
The manipulator: the dosing system (a); the professional positioning axes (b, c and d) representing the X, Y and Z axes, respectively; the computer with the controlling system (e); digital dispenser (f), servomotors (g), workplace (h) and detail of workplace (upper right corner).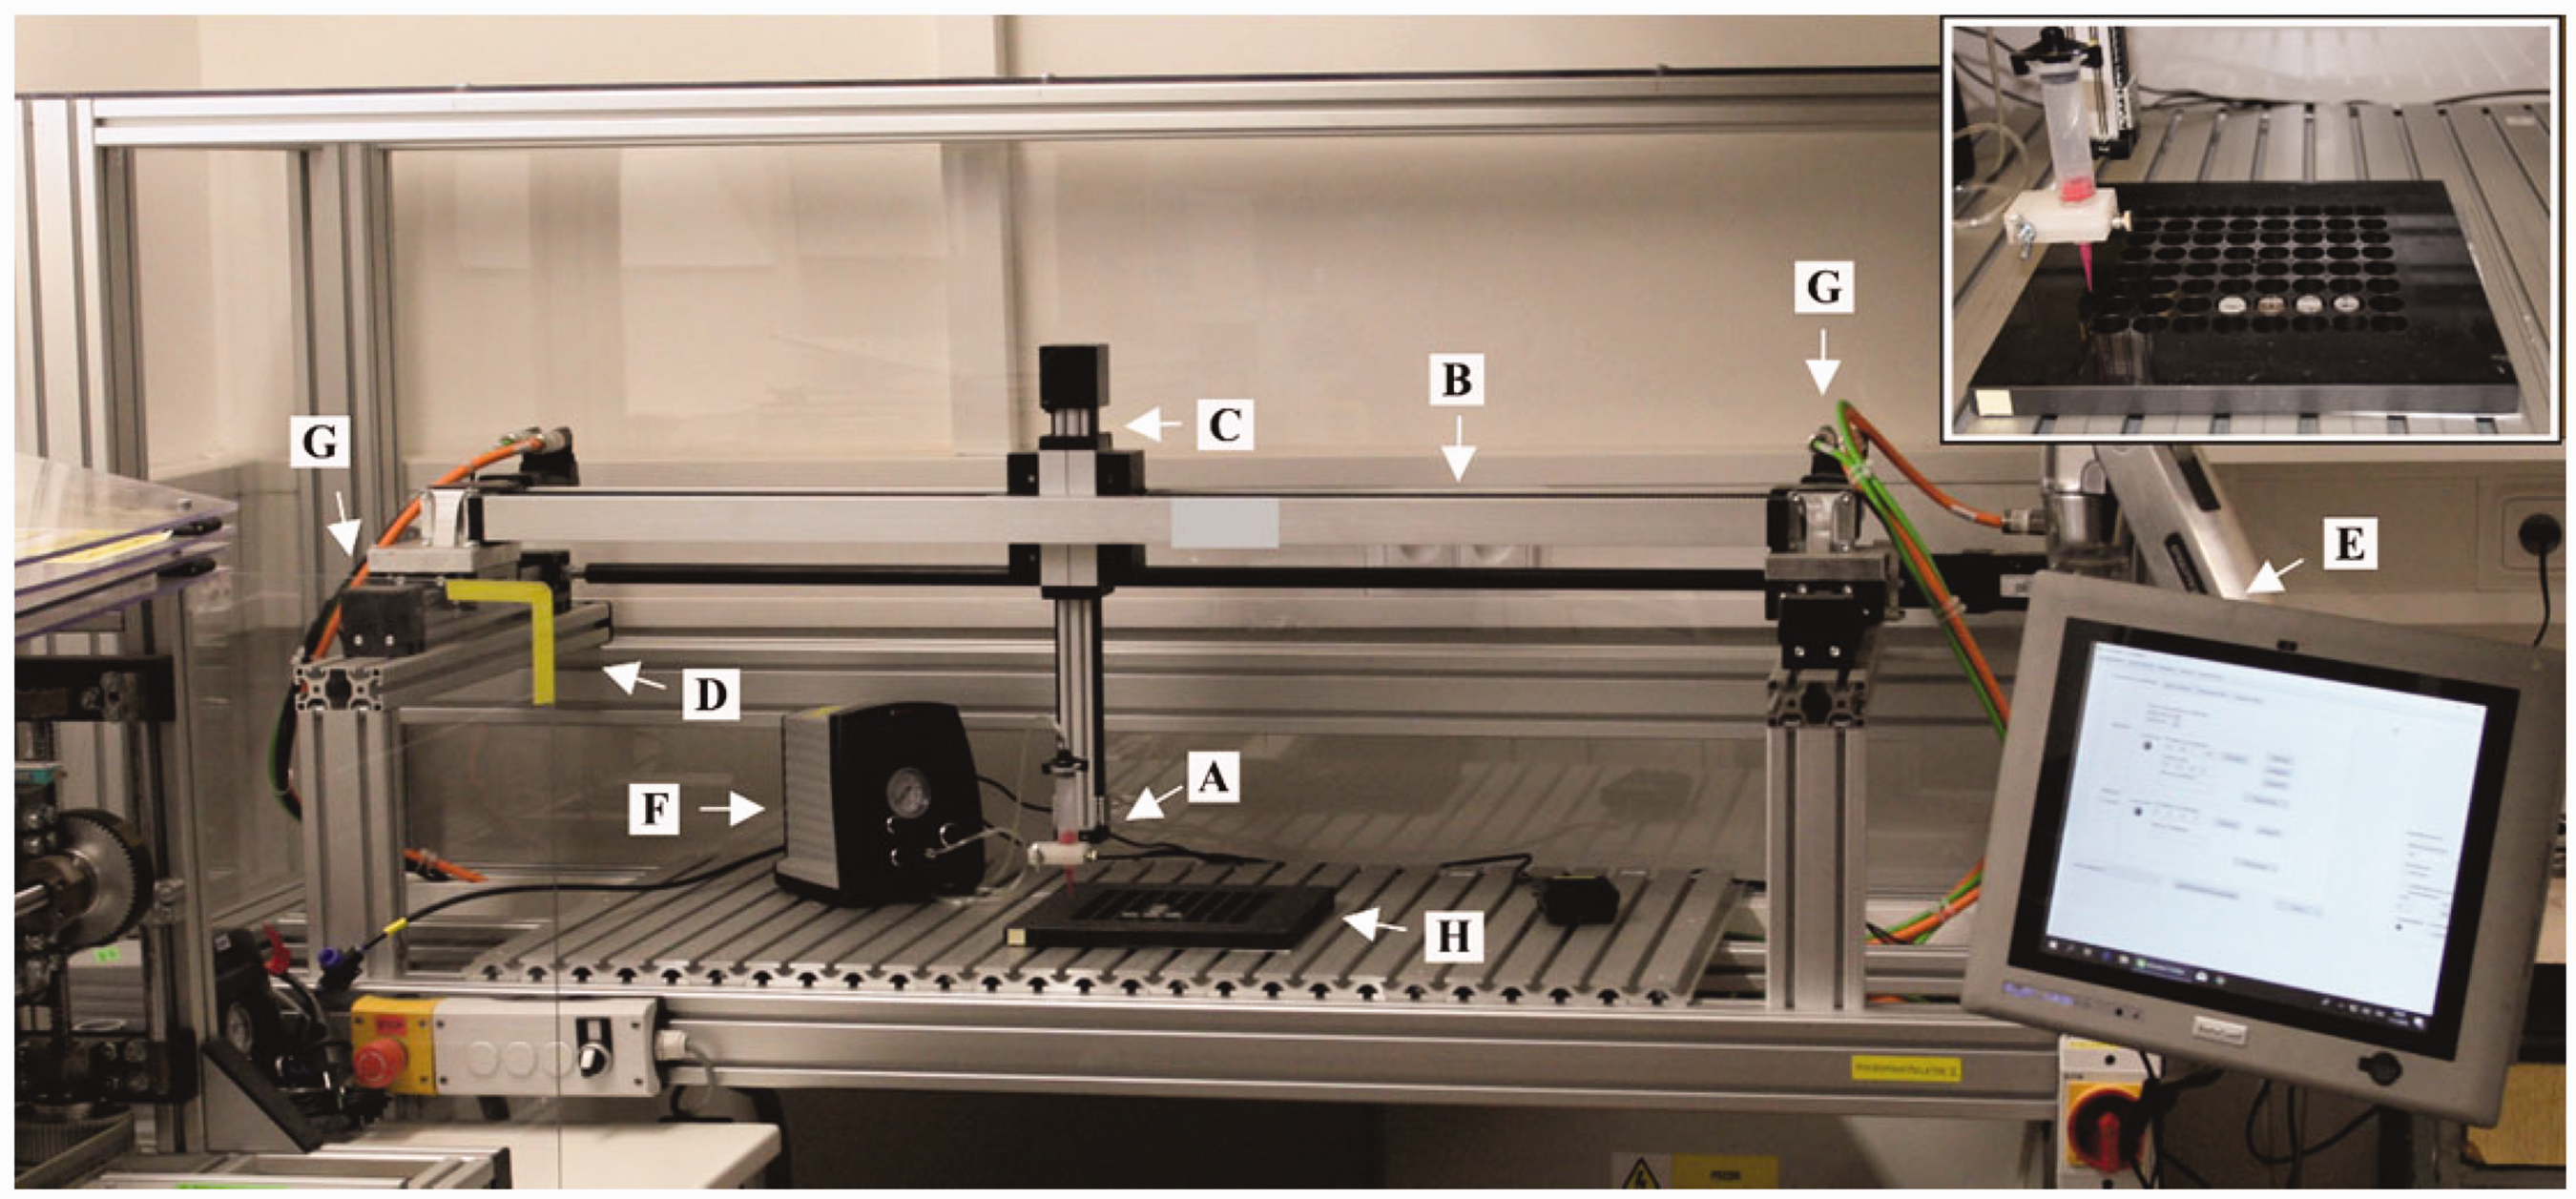
Polymer solutions
The PCL (Mn 80 000, Sigma Aldrich, Czech Republic) solutions were prepared with the concentrations of 4%, 6%, 8%, 12%, 16% and 20% by weight in chloroform (Penta, Czech Republic), depending on the type of the experiment. All solutions were analysed by rotational viscometer (HAAKE RotoVisco 1, Thermo Scientific, Czech Republic) and by surface tensiometer (PocketDyne, Krüss, Germany). The viscosity was measured using the 35/1 Ti L plate at the linearly increasing shear rate (10–60 s−1).
Drawing fibres
All fibrous samples were drawn by the manipulator using a plastic 25 G tip (OKI International, Germany). The polymer solution was dosed once per cycle (on both sides) at a constant pressure (60 kPa) and time (0.6 s) just before the tip touched the surface. The syringe with the tip was attached to the moving element perpendicular to the underlay. The motion program consisted of the circular interpolation with a 0.1 s break at the dead point. The influence of the velocity and solution concentration on the fibre diameter was further studied and evaluated. For the evaluation of the impact of the drawing conditions on the fibre morphology, all solutions of PCL (4%, 6%, 8%, 12%, 16% and 20%) were drawn using the established velocities, i.e. 0.1, 0.5, 1, 2 and 3 m/s. All samples were prepared using 400 repeats per 0.01 m (Y). The length of the fibre was set to 0.18 m. Fibre drawing was carried out under ambient conditions: room temperature 20–25℃, relative humidity 30–35%.
Functionalisation of fibres
The prepared PCL scaffolds were subsequently functionalised by a thin conductive polypyrrole (PPy) layer. The polymerisation reaction of pyrrole (10 mM; Sigma-Aldrich, Czech Republic) was maintained for three days at room temperature in the presence of FeCl3 (23 mM; Sigma-Aldrich, Czech Republic) and p-toluene sulfonic acid (11 mM; Sigma-Aldrich, Czech Republic) under constant stirring. After the polymerisation, samples were washed and sonicated in methanol and deionised water. Samples were dried and stored in vacuum desiccator at RT.
Fibre characterisation and image analysis
For the fibre morphology analysis, the samples were observed by SEM (Tescan Vega3 SB Easy Probe TESCAN, Czech Republic) or FEI Nova 200 Nanolab (TSS Microscopy, Austria). For the image analysis on the Tescan SEM, the samples were sputter coated with gold (7 nm). The cross-section of the fibres was done either in the liquid nitrogen with a scalpel or by the SEM (FEI Nova 200 Nanolab), where a thin layer of platinum was deposited on the side of the cut and the fibres were subsequently cut by a laser. Fibre diameter was measured by NIS Elements software (Nikon, Czech Republic). Other image analyses were done in Image J. The water contact angle (WCA) was measured using a portable computer-based instrument with software following ISO 27448:2009 test method (See System E, Advex Instruments, Czech Republic).
In vitro experiments
The in vitro samples were prepared from the 12% PCL using the velocity of 2 m·s−1. Two sets of experiments were carried out. The first experiments were focused on the direction of cell growth. For these experiments, two types of scaffolds were prepared varying in the orientation of fibres. Fibres were arranged either in one or in two directions (Fib I, Fib II). Fib I and Fib II samples were prepared using 1000 repeats per 0.01 m (Y) or twice 500 repeats per 0.01 m (X and Y), respectively. Fib I samples were further used for the functionalisation experiments. The second set of experiments was focused on the evaluation of biocompatibility of the functionalised fibres. For these experiments, two types of scaffolds were prepared, which differed in the surface modification. The prepared structures were fixed within a supporting ring (Figure 2). The size of the fixation ring is designed to fit in a 24-well cultivation plate and allows better manipulation with the fibres as well as keeping the scaffold in the designed pattern. The fixation ring was made by injection moulding from PMMA at the University (TUL, Czech Republic).
Macroscopic picture of in vitro samples fixed with a supporting ring – (a) fibres ordered in one (Fib I) or (b) two directions (Fib II). (c) In vitro sample ordered in one direction functionalised by polypyrrole. Scale bar: 1 cm.
Sample preparation
The prepared scaffolds were sterilised in 70% ethanol for 30 min and washed several times in phosphate buffer saline (PBS, pH 7.4), followed by one wash with complete DMEM medium prior to cell seeding.
Cell culturing
3T3 mice fibroblasts (3T3 Swiss Albino, ATCC, Czech Republic) were used for the in vitro experiments. Cells were seeded at the concentration of 1 × 10⁵ per well in 24-well plates and were maintained in Dulbecco’s Modified Eagle’s Medium (DMEM, Lonza, Czech Republic) supplemented with 10% (v/v) fetal bovine serum (FBS) and 1% (v/v) penicillin/streptomycin/amphotericin B (Lonza, Czech Republic). Cells were cultured in an incubator (37℃, 5% CO2). The medium was changed three times a week and the second passage was used for the in vitro experiments.
In vitro testing
Cell viability and proliferation were measured by MTT assay on days 1, 3, 7, 14 and 21 after cell seeding; 50 µl of MTT solution and 150 µl of DMEM were added to all the samples and the samples were incubated for 3 h at 37℃, 5% CO2. The formazan crystals were dissolved in 200 µl of acidic isopropyl alcohol and the absorbance was measured at 570 nm with the reference wavelength at 650 nm. The solutions were diluted prior to the measurement when the absorbance exceeded 1. The final absorbance is related to the dilution. During all testing days, the samples were analysed by fluorescent and scanning electron microscopy. All the samples were washed with PBS prior to fixation to remove the unattached cells. The scaffolds processed for SEM and fluorescent microscopy were fixed with 2.5% glutaraldehyde or ice-cold methanol, respectively. After the fixation, the samples for SEM were dried up with upgrading concentration of ethanol (60%, 70%, 80%, 90%, 95% and 100%). After the drying step, the samples were sputter-coated with gold and were analysed by the scanning electron microscopy (Tescan, VEGA3 SB easy probe). For fluorescent microscopy, the samples were rinsed with PBS after fixation. Next, the samples were either stained with DAPI or with DAPI together with phalloidin-FITC, depending on the experiment. The Fib I and Fib II samples tested for the direction of cell growth were stained with DAPI only and were incubated for 15 min with DAPI at room temperature in the dark. The Fib I samples functionalised with polypyrrole were stained with phalloidin-FITC and DAPI. First, the cells were permeabilised in 0.1% Triton for 5 min at room temperature (RT). After permeabilisation, the samples were washed with PBS and stained with phalloidin-FITC (1 mg/ml stock solution diluted 1:1000 in PBS) for 30 min at RT. Then the samples were washed with PBS and stained with DAPI for 5 min at RT. After the incubation period, the samples were rinsed with PBS and analysed by the fluorescent microscope (NICON Eclipse Ti-e).
Data analysis
The obtained data were processed by Microsoft Excel. Statistical analysis was performed using the GraphPad Prism 7 software. Fibre diameters were analysed by multiple comparison analysis using one-way analysis of variance (ANOVA) and Scheffe post hoc analysis with a p-value < 0.05 defined as significant. Results from MTT assay were analysed by t-test and Scheffe post hoc analysis with a p-value < 0.05 defined as significant.
Results and discussion
Manipulator construction
To improve the drawing technology, we designed and constructed a lab-scale manipulator for drawing fibres from a polymer droplet or a surface of polymer solution. The mobile drawing element of the manipulator moves from one side to another in a repeating manner and produces single fibres one by one, laying them separately on an underlay. A basic production scheme can be seen in Figure 3.
The manipulator representing the drawing movement, fibre drawing in detail (picture in upper right corner).
The resulting fibres are in hundreds of nanometres up to tens of micrometres in diameter and up to tens of centimetres in length. The manipulator is able to move in a wide range of velocities (up to 3 m·s−1) and consists of three axes, which enables us to program the trajectory of a drawing element and arrangement of fibres. The dosing system is able to dose an exact amount of a polymer on both sides, resulting in continuous fibre production. In comparison with other spinning methods, such as electrospinning or forcespinning, the manipulator is designed to draw a single fibre, which can be further manipulated to produce different patterns. This is completely impossible to do with the above-mentioned techniques.
Fibre morphology evaluation
For the experiments, a high-molecular weight poly-ɛ-caprolactone was chosen since it is an FDA-approved biocompatible and biodegradable polymer, widely used in tissue engineering and suitable for the fabrication of scaffolds for tissue engineering by means of drawing. Two basic parameters (drawing speed and solution concentration) that influence the fibre diameter were examined. Furthermore, the viscosity and surface tension of the polymer solution, which also affect the spinning (fibre forming process) [18], were monitored (Supplementary data Figure S1, S4). The viscosity of the prepared solutions grows exponentially, whereas the surface tension grows almost linearly. Despite the distinctly growing viscosity, it was possible to draw the fibres from all the prepared solutions.
The PCL fibres were drawn using the manipulator at established velocities (0.1, 0.5, 1, 2 and 3 m·s−1) and concentrations (4%, 6%, 8%, 12%, 16% and 20% by weight) (Figure 4). The results show that it is possible to control the diameter of the fibres and the distribution of the fibre diameters by adjusting the selected drawing parameters. It is evident that under the ambient conditions, the fibre diameter decreases with an increasing speed of drawing and a decreasing polymer solution concentration. Also, the fibre diameter distribution decreases with an increasing speed of drawing (Supplementary data Figure S1, S2), which is consistent with the results published by Nain et al. [5]. Moreover, with a decreasing polymer concentration, a higher speed of drawing is necessary to prepare the fibres. The SEM analysis did not reveal any significant changes of the fibre diameter over the entire fibre’s length when prepared under the tested parameters (fibre length did not exceed 30 cm).
Diagram of the fibres’ morphology depending on the speed of drawing and the polymer concentration. The fibre diameters are presented as mean in µm ± standard error of the mean. Scale bar: 50 µm.
Two types of defects were observed on the prepared fibres: fibre narrowing (Figure 5) and a nanostructured surface (see below). The formation of thinner regions is significantly less frequent for fibres prepared from polymer solutions at a concentration of 12% and 16%. Moreover, the fibres prepared from 12% solution have the lowest fibre diameters distribution, especially at drawing speeds above 1 m·s−1. The fibres prepared at these conditions were therefore used for cell culturing experiments.
Electron microphotographs of the 8% PCL solution drawn at a speed of 1 m·s−1, one of the defects (fibre necks) are indicated by arrowheads, Scale bar: 50 µm.
SEM examinations of nanofibres, as shown in Figure 5, reveal that the fiber diameter is in some cases contracted from 1000 nm to nearly 100 nm in the so-called neck regions. The necks are not evenly spaced along the nanofibres. This phenomenon is similar to the necking and crazing of electrospun nanofibres described previously as the failure mode [19]. According to Zussman et al., we hypothesize that a neck structure on a drawn fibre appears to be resulting from a fast solvent evaporation and strong stretching of solidified nanofibres during micro- or nanofibre drawing.
The 6% PCL solution drawn at a speed of 3 m·s−1 resulted in the significantly smallest mean value of a fibre diameter (2.51 ± 2.01 µm). The lowest measured diameter was 190 nm for the 6% PCL and a speed of 2 m·s−1, whereas the 20% PCL solution drawn at a speed of 0.1 m·s−1 resulted in the significantly highest mean value of fibre diameter (9.56 ± 6.25 µm). The 6% PCL solution was also the lowest concentration capable of fibre drawing, although only at a drawing speed of 1 m·s−1 and higher.
Unlike the other processes using drawing to produce fibres (e.g. manual drawing), the fibres drawn by micromanipulator possess nanostructured surface pattern (Figure 6). The pores are hundreds of nanometres wide and deep. The pores are formed by the solvent evaporation and their structure is influenced by the polymer and the solvent system used. Similar structures were described previously on electrospun fibres [20,21] and are known to be beneficial for the cell–fibre interaction and to enhance the cell adhesion [22].
SEM images showing the morphology of the fibres. (a) A uniform circular cross-section, (b) nanostructured porous surface and (c) a cross-section and pore depth indicated by arrowheads (c).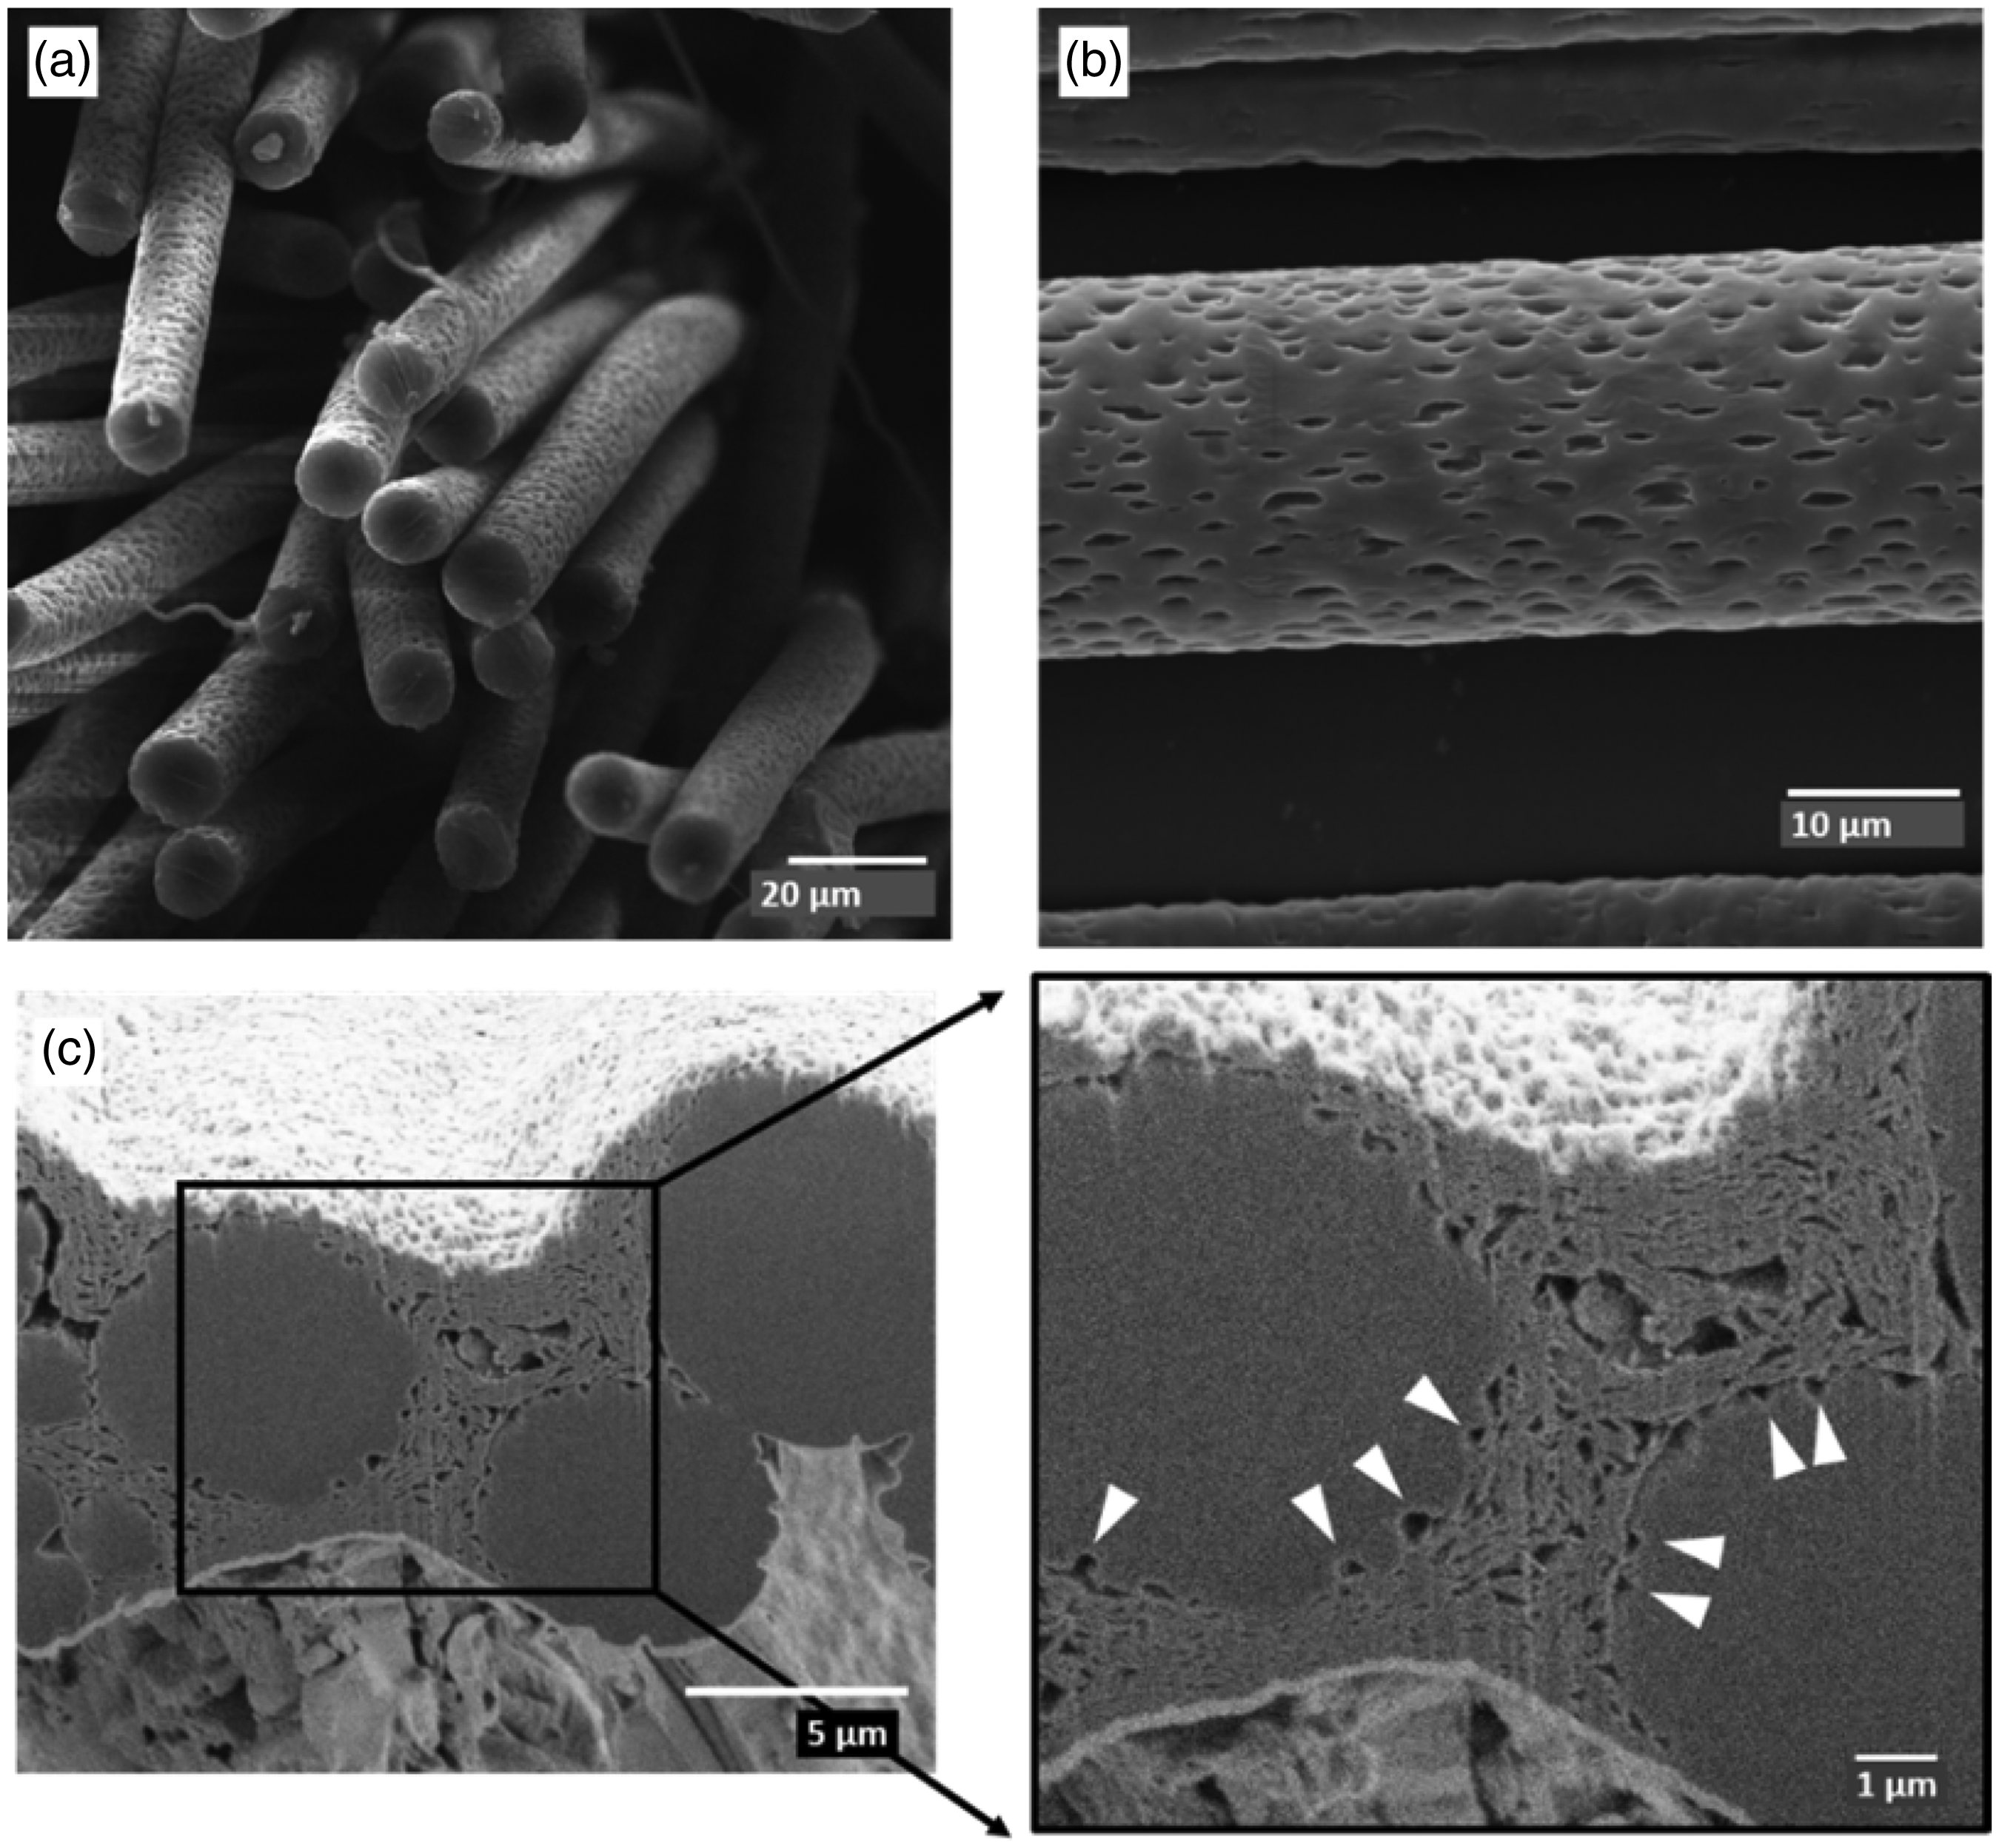
Fibre functionalisation
Among the other conductive polymers in tissue engineering, PPy is the most investigated in detail due to its very good electrical conductivity, easy modification of various surfaces, excellent stability in the environment, biocompatibility, and its ability to promote adhesion and growth of various types of cells [23]. Therefore, PPy was chosen as an example for the functionalisation of the drawn fibres to show further possibilities of the drawn samples. The PPy layer was deposited on the drawn fibres under standard conditions by chemical oxidation using FeCl3 [24]. Even after the functionalisation, the PPy-covered fibres retained the pores in their structure. The layer of PPy is homogeneous and is 50–100 nm thick (Figure 7). Moreover, the coating was much thinner and smoother than those reported in the literature [25,26]. Functionalisation did not significantly influence the WCA of the scaffolds – WCA of pristine PCL was measured to be 122° and WCA of PPy functionalised PCL was measured to be 123°. This finding is similar to the previously published results [27].
SEM images showing the PPy-modified PCL fibres. (a) The coating of PPy is uniform and retains porous structure of the fibres. (b) The cross-section of the fibre with detailed image of the PPy layer thickness (c).
In vitro experiments
Cell guidance
During the in vitro experiment, the planar scaffolds were used with fibres arranged either in one (Fib I) or in two (Fib II) directions (Figure 2). The scaffolds were tested for cell adhesion and proliferation on days 1, 3, 7, 14 and 21 after cell seeding by MTT assay, fluorescent and scanning electron microscopy. The results from the microscopy analysis (Figure 8) as well as from the MTT assay (Supplementary data Figure S3) show that the micromanipulator-made scaffolds are capable of supporting cellular attachment and proliferation during the in vitro tests. Moreover, the cells prefer growth in the direction of the fibres. The data from the MTT assay reveal similar rates of cell adhesion (day 1) in both types of scaffolds. During the longer cultivation period, it is evident (especially from the SEM) that the cells are capable of growing over the holes between the fibres and often of micrometres in diameter (Supplementary data Figure S4).
Images of the fibrous samples oriented in one and two directions seeded with 3T3 mice fibroblasts 14 days after cell seeding [28]. Nuclei stained with DAPI. Scale bar: 100 µm.
Polypyrrole biocompatibility
The in vitro results from the cell adhesion and proliferation tests of PPy modified nanostructured PCL fibres show that the functionalised fibres support the cell adhesion better than the plain PCL fibres (Figure 9). The data also show higher cell proliferation on the PCL-PPy fibres within the testing days (Supplementary data Figure S5). Due to the similarity of the hydrophilicity of the material, we believe that the positive influence of polypyrrole on the test materials can be attributed rather to other polypyrrole properties, e.g. surface morphology and surface charge [29]. As it was shown before [30–33], in combination with the stimulation of oriented cell growth by using oriented microfibres, such material can be a promising candidate for nerve tissue engineering.
Fluorescent microscopy of cells seeded on aligned PCL or PCL-PPy fibres 1, 7 and 14 days after cell seeding. Staining: Phalloidin-DAPI. Scale bars: 100 µm.
Conclusions
To ensure stable drawing conditions, a new drawing machine was constructed. The results presented herein indicate that it is able to influence the fibre diameter by the speed of drawing and polymer solution concentration. The fibre diameter decreases with an increasing speed of drawing and a decreasing polymer solution concentration. The unique features of drawing enable us to prepare scaffolds for tissue engineering with a precisely oriented manner and a nanostructured surface. This is a novel and promising approach to prepare scaffolds capable of fulfilling the needs of tissue engineering, where the aligned fibres can be beneficial for cell growth.
With respect to the possible use of such fibres in neural tissue engineering, the fibres were functionalised with polypyrrole to show further possibilities of the drawn samples. The in vitro experiments show that the drawn-oriented fibres (both plain and modified) are capable of cell adhesion and proliferation and the cells grow in the orientation of fibres. Moreover, PPy functionalisation of the fibres led to better cell adhesion and proliferation of the cells in vitro compared with the plain PCL fibres.
Supplemental Material
Supplemental material for Drawn aligned polymer microfibres for tissue engineering
Supplemental Material for Drawn aligned polymer microfibres for tissue engineering by Kateřina Strnadová, Lukáš Stanislav, Ilona Krabicová, Filip Sabol, Jan Lukášek, Michal Řezanka, David Lukáš and Věra Jenčová in Journal of Industrial Textiles
Footnotes
Declaration of conflicting interests
The author(s) declared no potential conflicts of interest with respect to the research, authorship, and/or publication of this article.
Funding
The author(s) disclosed receipt of the following financial support for the research, authorship, and/or publication of this article: This work was supported by the Czech Science Foundation (Grant Number 16-02316Y); and by the European Social Fund and the state budget of the Czech Republic (Grant Number CZ.1.05/3.1.00/14.0308).
Supplemental Material
Supplemental material is available for this article online.
References
Supplementary Material
Please find the following supplemental material available below.
For Open Access articles published under a Creative Commons License, all supplemental material carries the same license as the article it is associated with.
For non-Open Access articles published, all supplemental material carries a non-exclusive license, and permission requests for re-use of supplemental material or any part of supplemental material shall be sent directly to the copyright owner as specified in the copyright notice associated with the article.