
Abstract
Composite nanofibers of polyacrylonitrile/fluorescent core–shell silica particles were fabricated. Two different sizes of fluorescent core–shell silica particles were synthesized. The first one consisted of particles with the diameter of about 310 nm (Bigger size fluorescent core-shell silica particles [BFSPs]) and the other one had the diameter of about 166 nm (smaller size fluorescent core-shell silica particles [SFSPs]). The images obtained by scanning and transmission electron microscopy confirmed the synthesis of spherical and nearly uniform particles. However, some clusters of smaller unformed silica particles were observed, especially in SFSPs. The results of Fourier transform infrared spectra spectroscopy confirmed the linkage between silica and fluorescein isothiocyanate. Scanning electron microscopy images of the composite nanofibers showed that the shell had a uniform morphology; however, there were some points having a higher diameter, where the core–shell particles were located. The fluorescence microscopy images of the composite nanofibers also showed the fluorescence property of the composite nanofibers with bright spots on them, where the particles were located. The fluorescence intensity of the composite nanofibers was significantly increased with the enhancement of the pH value in the range of 4.00–8.00. The observed pattern of composite nanofibers under ultraviolet radiation suggested that these composite nanofibers could be applied as anticounterfeiting markers for special clothes as well as pH-sensitive parts in smart clothing.
Keywords
Introduction
Fluorescent materials are widely used in fields such as biology, information technology, etc. [1], as well as in the textile industry as fluorescent dyes and coatings for fabrics [2]. They are ideally suitable for the nanoscale investigation because of their spatial and temporal resolution, as well as the high signal-to-noise ratios and ease of application [3]. Today, the most common fluorescent probe is the fluorescein dye. It has very high molar absorptivity, high photostability, and large fluorescence quantum yield [4]. These properties have proved it as a very sensitive and useful fluorescent label. On the other hand, fluorescent dye molecules have been used in solution to impart fluorescence properties to the textile fabrics [2]. However, the dye molecules can leak to the environment. In addition, due to the exposure to certain wavelengths of light, they lose their fluorescent strength. Therefore, the escape of the molecules from fibers can cause some health problems and environmental concerns.
In recent years, many studies have been focused on fluorescent core-shell silica nanoparticles (FSPs) [5]. FSPs encapsulate a large number of dye molecules inside silica nanoparticles (NPs) and have many benefits like strong emission signal, high sensitivity, high photostability, narrow particle size distribution, efficient and flexible conjugation with many biomolecules, and easy manufacturing process [5–7]. Some NPs have been synthesized with fluorescence properties for a wide range of medically significant goals, such as selective optical labeling of DNA sequences, cancer cells, proteins, and bacteria [2,8–11]. Tsou et al. [12] reported the synthesis of hollow core–shell NPs with a higher surface area and sensitivity to the pH of the medium. Korzeniowska et al. [13] also applied these NPs to detect pH changes inside a living kidney cell.
There are two principal approaches for the production of FSPs: one is on the basis of the reverse microemulsion [14] method, and the other is the Stöber synthesis. Stöber et al. [15] established a synthetic procedure for producing monodisperse spherical silica NPs on the basis of the sol–gel chemistry of silicon alkoxides. In this method, the hydrolysis and condensation of tetraethyl orthosilicate (TEOS) take place in the ethanol solution and in the presence of water with ammonia as a catalyst to produce monodisperse, spherical, and electrostatically stabilized particles. Van Blaaderen and Vrij [16] first described the covalent incorporation of organic fluorescent dyes into colloidal silica by the Stöber method and the synthesis of FSPs. The effects of several components on the size, reaction kinetics, sphericity, and monodispersity of the particles have also been studied by several researchers [17]. The advantage of the Stöber method is that it can be easily scaled up for commercial applications and it also provides the possibility to readily transfer the NPs into aqueous solutions [17].
By the incorporation of FSPs into textile fibers/nanofibers, higher fluorescence intensity can be obtained from them. In addition, the fluorescent fibers or nanofibers can be used in counterfeiting applications in textiles and clothing brands. They can also be used as pH probes in some parts of the clothes in contact with skin. Composition and pH of sweat are vital for understanding the nutritional replacement in the human body, as well as changes in the extracellular fluid [18]. Hendrick et al. [18] studied cellulose acetate fibers with fluorescing NPs for anticounterfeiting and pH-sensing applications. The current study focused on the production of composite nanofibers of polyacrylonitrile (PAN) containing FSPs in order to obtain unique fluorescence properties. These nanofibers could be potentially applied in some parts of the clothes for anticounterfeiting purposes in the textile industry [7]; they can also be used for sensing the pH of the sweat of the skin. These applications will be investigated in the future works.
Materials and methods
Materials
Fluorescein isothiocyanate (FITC) and N-(2-aminoethyl)-3-aminopropyltrimethoxysilane (APTES) were purchased from Sigma-Aldrich. Tetraethyl orthosilicate (TEOS), ammonium hydroxide (25 wt%), ethanol, phosphate buffer saline, hydrochloric acid 37%, ammonium hydroxide, phosphoric acid, and dimethyl formaldehyde (DMF) were purchased from Merck. PAN (Mw = 100,000 g/mol) was obtained from Polyacryl Co., Isfahan.
Preparation of fluorescent core-shell silica particles (FSPs)
FITC molecules must be covalently attached to the silane coupling agent (APTES). On the other hand, a reaction between the amine groups of APTES and the thioisocyanate groups of the FITC molecules should take place. One milligram of FITC molecules was dissolved in 1 ml ethanol and dispersed by ultrasonic treatment. Then, 5 µl of APTES was added to the solution. The mixture was stirred mildly for 24 h in the dark. As a result, the covalently attached FITC–APTES was obtained (Figure 1). In the next step, 3 ml of TEOS, 2 ml of H2O, 4.8 ml of ammonium hydroxide, and FITC–APTES ethanol solution were added to 50 ml of ethanol and stirred for 3 h at 40℃. So, the core of FSPs was formed. To further stabilize the FITC molecules in the silica particles, 0.3 ml of TEOS was added to the solution and stirred for 3 h at 40℃. Finally, the solution was centrifuged at 6000 r/min for 30 min to collect the particles. To remove unreacted chemicals, washing with ethanol, centrifuging, and decantating were carried out for the collected FSPs several times [20]. These FSPs were named “BFSPs.” Another set of FSPs was obtained by the same procedure described above, except that in the second step (after preparing FITC–APTES), 3 ml of TEOS, 2 ml of H2O, and 4.8 ml of ammonium hydroxide and FITC–APTES ethanol solution were added to the 50 ml ethanol. Also, the pH of the solution was reduced from 11.30 to 7.7 by adding hydrochloric acid to it. The next steps were the same as the procedure described above. These FSPs were called “SFSPs.” This procedure was used for the production of FSPs with a smaller size on the basis of Matsoukas and Gulari [8] and Canton et al. [21] discussing the effect of the solution pH on the size of the particles.
The reaction for the preparation of FITC–APTES. APTES: N-(2-aminoethyl)-3-aminopropyltrimethoxysilane; FITC: fluorescein isothiocyanate.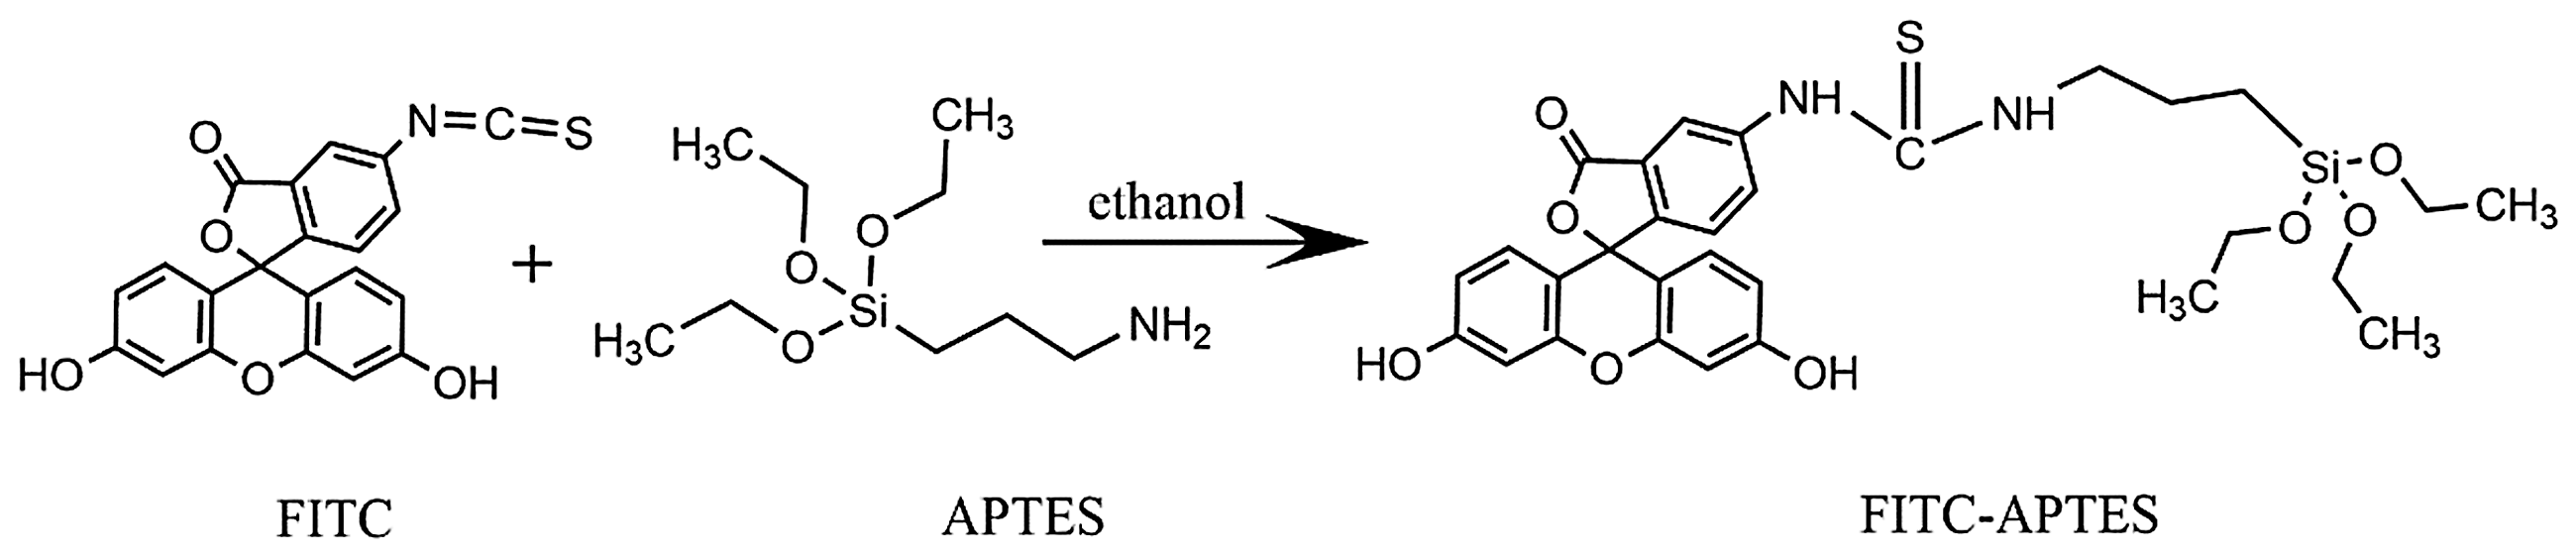
Electrospinning of the composite PAN/FSPs nanofibers
PAN (12 wt%) was dissolved in DMF at room temperature. It has been reported that the optimum concentration of PAN in DMF to obtain a spinnable solution and to produce bead-free PAN nanofibers is from 11 to 15 wt% [9]. Core–shell particles (1.6 wt%) were added to the solution while stirring. The mixture was sonicated using a Fisher Scientific, ultrasonic generator, Model 550, at room temperature for 1 h to disperse the core–shell particles in the PAN/DMF solution. Then, 1 ml of DMF/PAN/FSPs dispersion was inserted in a 1 ml syringe equipped with a stainless steel hypodermic needle (gauge 23). The syringe needle was connected to a high voltage generator operating in the positive DC mode with an applied voltage of 10 kV. The needle acted as the electrode for the electrospinning process. The dispersions were injected from the syringe pump with a feed rate of 7 ml/h and at room temperature for 3 h. Electrospun nanofibers were collected on the rotating drums with the diameter of 15 cm and the rotation speed of 70 r/min. The temperature and relative humidity were 25℃ and 35%, respectively. The distance between the spinneret tip and the collector was 15 cm. Samples of pure PAN and PAN/FITC nanofibers were also produced using the abovementioned procedure. PAN/FITC nanofibers were produced by adding 1.5 wt% FITC to the PAN/DMF solution. This sample was used for the comparison of the fluorescent images of the composite nanofibers.
Characterization
The morphology of the composite nanofibers was investigated using a scanning electron microscope (Philips XL30, Netherlands). A field emission scanning electron microscope (TESCAN model MIRA3, Czech Republic) was also used to obtain the images from the FSPs. Transmission electron microscopic (TEM) images of the FSPs were obtained using a Philips CM30 TEM at the voltage of 150 KV. Fourier transform infrared spectra (FTIR) from the FSPs were obtained by a Bomem spectrophotometer (MB100, Canada). Fluorescence images were recorded by a fluorescence microscope (Olympus BX51, Japan), and fluorescence emission spectra were recorded using a Carry Eclipse (Varian FL0906-M003, Australia) spectrophotometer. Thermogravimetry and differential thermal analysis (TGA/DTA) of the nanofibers were carried out in a nitrogen atmosphere, at a heating rate of 20℃/min and between 25 and 400℃, using a STA (model L81, Linseis, Germany) instrument.
Results and discussion
FTIR spectroscopy
Figure 2 shows the FTIR spectra of FITC and the FSPs. The FITC molecules had an adsorption band at 2067 cm−1 due to the stretching vibration of the isothiocyanate bond [22]. The spectrum of FSPs showed the characteristic absorption bands for the symmetric vibration of Si–O (795 cm−1) and the asymmetric vibration of Si–O (1099 cm−1) [23]. Based on the comparison of the spectrum of FITC with that of the FSPs, it was revealed that the band related to the isothiocyanate group N=C=S (at 2067 cm−1) disappeared due to the coupling with amine [22]. This indicated that the thioisocyanate groups of FITC had established a successful covalent linkage to the amino groups of APTES.
FTIR spectra of (a) BFSPs and (b) FITC.
Morphology of FSPs
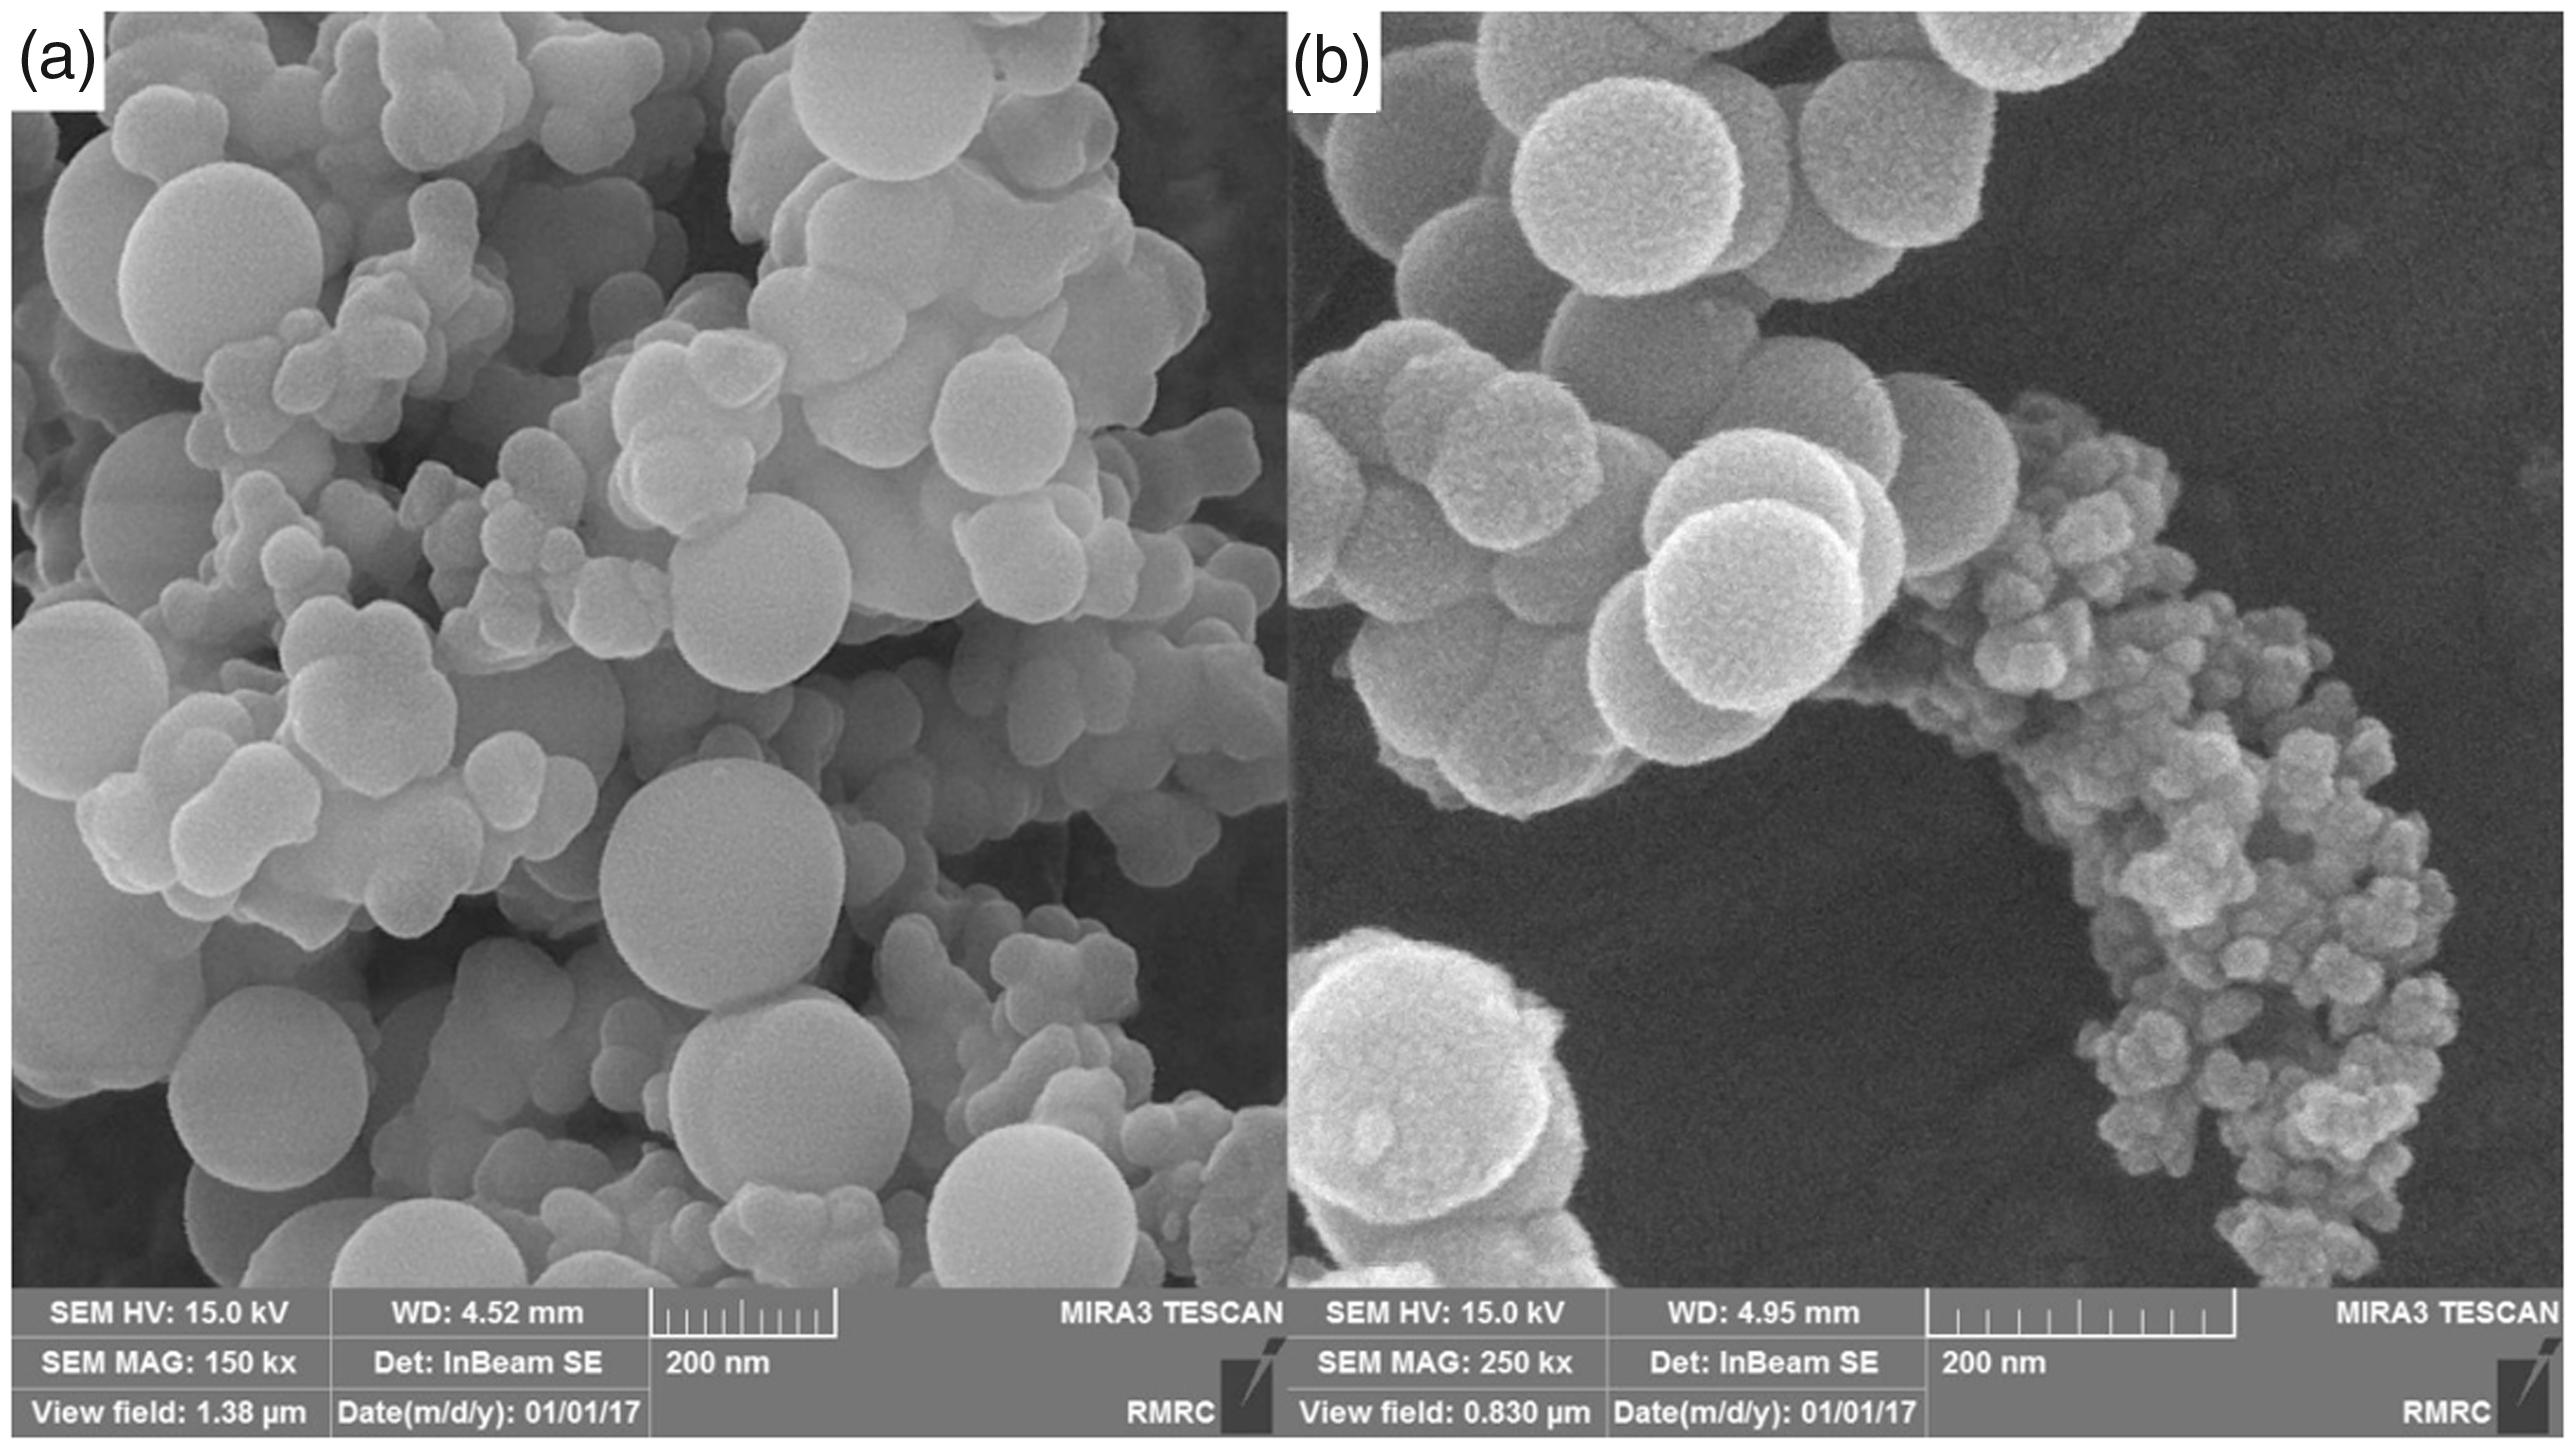
Figure 3 shows the SEM micrographs and size distribution diagrams of core–shell FSPs. As shown in Figure 3(a), the spherical core–shell particles with the average diameter of 310 ± 23 nm for BFSPs could be observed. In addition to the almost uniform size of the spherical particles, some clusters of small particles were formed. The average diameter of SFSPs, which was smaller than that of BFSPs, was about 166 ± 14 nm. Similar to BFSPs, in SFSPs, some clusters of smaller NPs with the average diameter of 28 ± 5 nm (Figure 3(b)) were observed. Therefore, in SFSPs, the diameter of the produced particles was reduced by changing the reaction conditions, i.e. adding HCl, which lowered the pH of the reaction bath. As illustrated in FESEM micrographs of Figure 4, in addition to the synthesized bigger particles, some clusters of smaller unformed silica particles were formed, especially for SFSPs.
SEM micrographs and diagrams of the size distribution of fluorescent core-shell particles. (a) BFSPs and (b) SFSPs. FESEM micrographs of fluorescent core-shell particles. (a) BFSPs and (b) SFSPs.
TEM micrographs of the FSPs are shown in Figure 5. These micrographs illustrate the spherical structure of the FSPs with high monodispersion. However, the size of SFSPs was smaller and some smaller unformed particles and clusters could be seen in the images. From the comparison of BFSPs and SFSPs, it appeared that lowering the pH in the synthesis of FSPs dropped the size of particles. As indicated in Matsoukas and Gulari [8], surface stabilization and the competing nucleation and growth can be considered for the formation of a stable sol of spherical and relatively monodisperse silica particles. At high pH, the particle surface attains a negative charge, stabilizing the sol against aggregation. The low spread of the distribution is indicative of a process in which nucleation is limited to the early stages and the “monomer” reacts preferentially with the existing particles, instead of nucleating. However, the existence of small unformed particles which could be silica small particles suggested that lowering the pH was not a good approach to produce smaller particles. It appeared that for fabricating smaller size particles, it would be better to use a higher rpm in the centrifuge stage. The effects of the synthesis parameters on the size, reaction kinetics, monodispersity, and sphericity of the particles have been investigated by many researchers. This can be used to tailor the particle size for particular needs [1]. Therefore, the next step for this research could be to work on the FSPs synthesis parameters and obtain FSPs with the desired sizes to be used in different clothes as anticounterfeiting agents.
TEM micrographs of (a) and (b) BFSPs, and (c) and (d) SFSPs.
Morphology of the composite PAN/FSPs nanofibers
The SEM micrographs of the composite PAN/FSPs nanofibers are shown in Figure 6. SEM micrographs showed that the composite nanofibers were uniform without any beads; however, some variations in the diameter of the nanofibers were observed. For a more detailed view, the FESEM images in Figure 7 could be considered. The average diameter of PAN/FSPs nanofibers was about 440 nm; in some points, some beads that probably represented the location of FSPs were observed. On the whole, the SEM images showed that the composite nanofibers had consistent morphologies with the agglomeration of the particles in some points of the fibers. In other words, the composite nanofibers were smooth, with some variations in the fiber diameter. Therefore, it could be deduced that FSPs loading did not perturb the nanofiber production and nanofibers with a consistent morphology were obtained. The fluorescence microscopy images of the composite nanofibers (Figure 8) clearly showed the fluorescence property of the nanofibers. The bright spots on the nanofibers showed the location of the FSPs. This observation corresponded to the measurements of the diameter of the particles and the nanofibers obtained from electron microscopic experiments. In other words, the FSPs with a diameter almost equal to that of the nanofibers were located along the nanofibers alternately. The fluorescence property of the composite nanofibers with bright fluorescent spots on them could be used as anticounterfeiting elements for the identification of original brands in the textile industry. The structure and size of FSPs could be a special marker for special clothes.
SEM images of composite PAN/FSPs nanofibers. (a) BSFPs and (b) SFSPs. FESEM images of composite PAN/FSPs composite nanofibers. (a) BFSPs and (b) SFSPs. Fluorescence microscopic images of PAN/FSPs composite nanofibers containing (a) BSFPs, (b) SFSPs, and (c) FITC.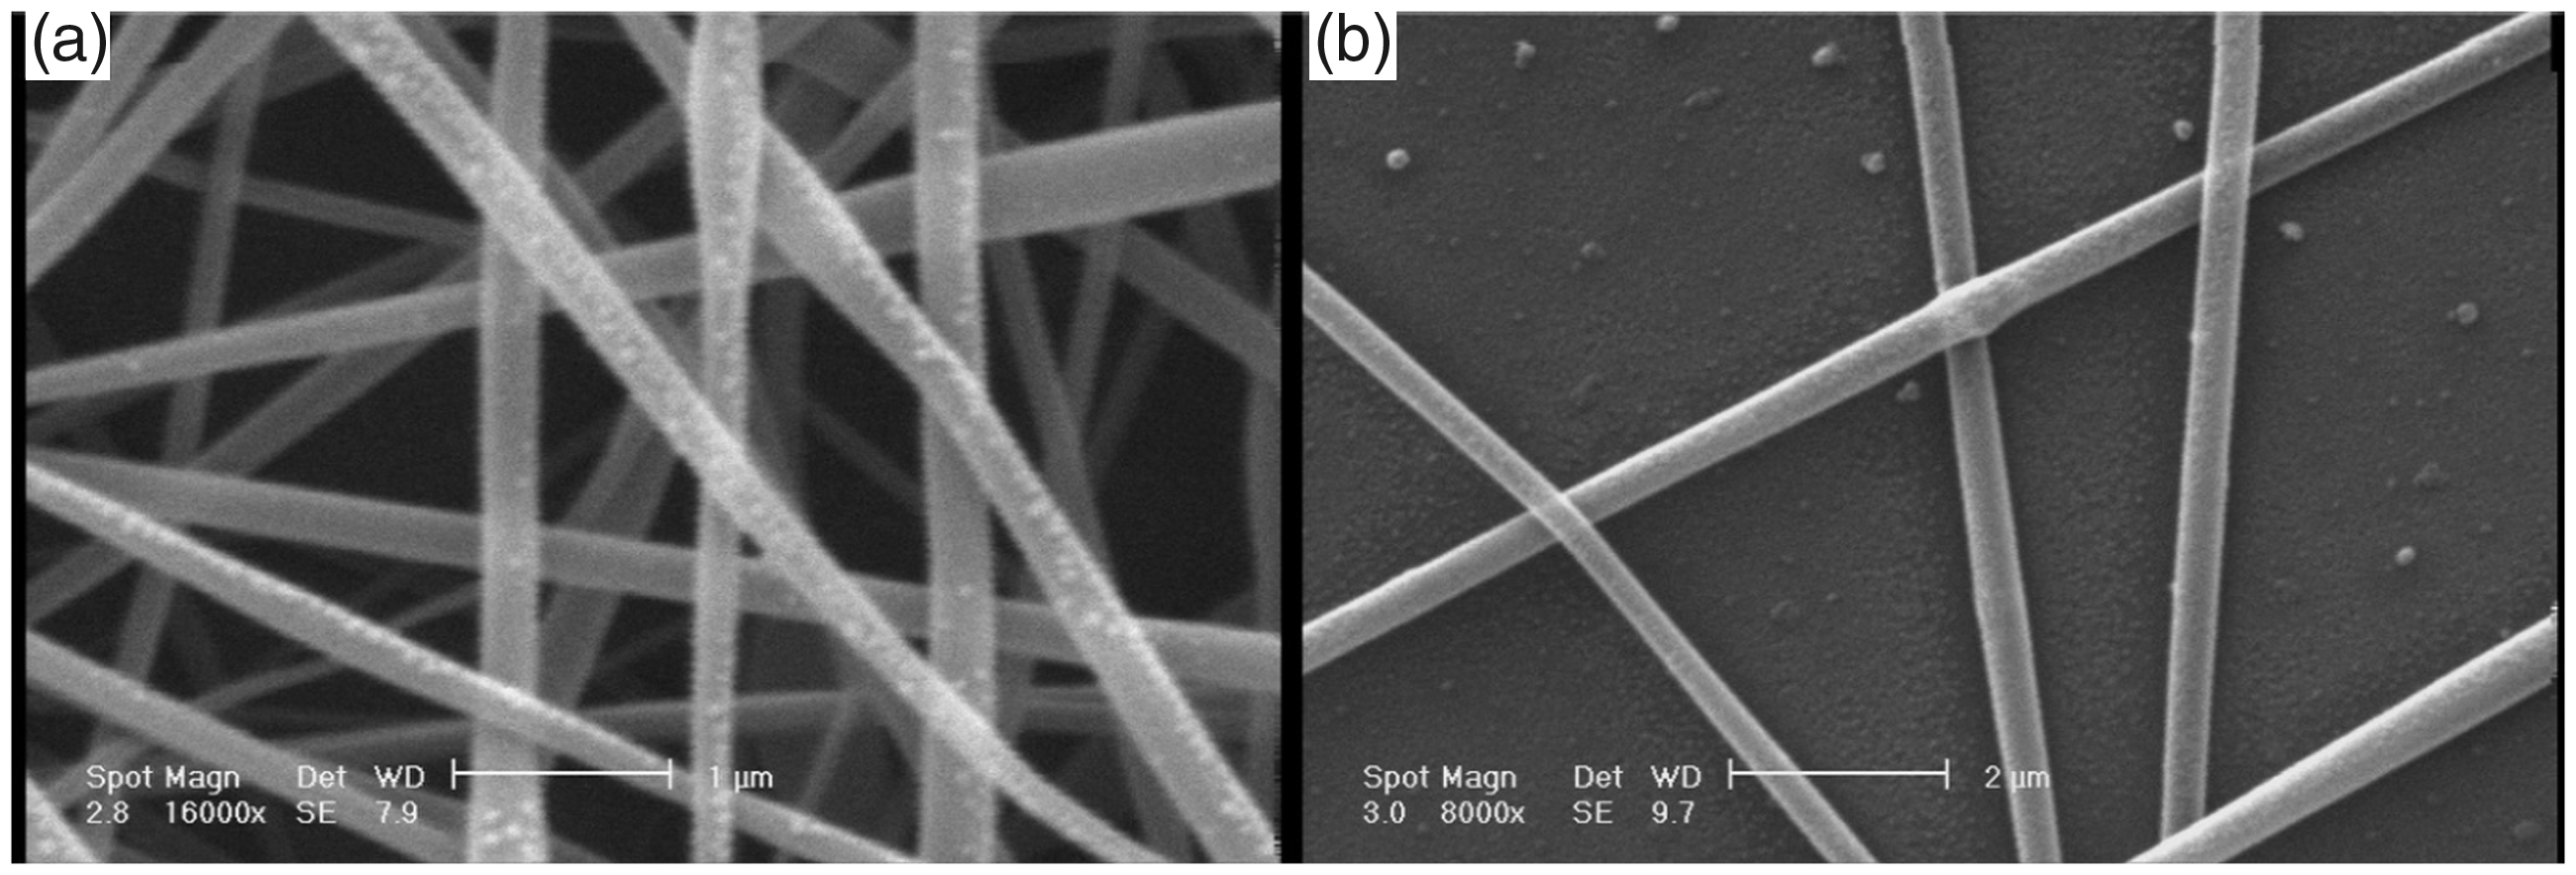


TGA/DTA analysis
Figure 9 shows the TGA/DTA thermograms of pure PAN, PAN/BFSPs, and BFSPs samples. The BFSPs thermogram showed a weight loss up to about 130℃; this was followed by a steady weight loss. This could be due to the elimination of moisture at the temperature below 130℃ [24,25]. The PAN/BFSPs nanofibers started to lose weight at about 180℃ and degradation was continued with a steady slope. In contrast, the weight loss and degradation in PAN nanofibers were started at about 280℃ and continued sharply. The lower temperature for the start of degradation as well as its lower slope in PAN/BFSPs nanofibers indicated that the incorporation of BFSPs into the PAN matrix reduced their thermal stability when compared with PAN nanofibers. In the DTA thermogram of PAN nanofibers, a sharp endothermic peak at the degradation temperature was observed. This endothermic peak was very smaller for PAN/BFSPs nanofibers, as compared with PAN nanofibers.
TGA/DTA thermograms of (a) PAN nanofibers, (b) PAN/BFSPs nanofibers, and (c) BFSPs.
Fluorescence emission spectra
Spectrofluorometric measurements were used to characterize BFSPs and SFSPs. The emission spectra of the pure FITC in ethanol and the FSPs in water were measured. FITC exhibited an emission at 543 nm when excited at 488 nm in the aqueous solution (Figure 10). Each FSP contained thousands of FITC molecules and exhibited a high signal amplification capability. This phenomenon could be attributed to the enhanced dye quantum yield due to a rise in the radiative rate and a reduction in the nonradiative decay rates for the dyes upon encapsulation in the core–shell architecture [1]. Besides, BFSPs exhibited more fluorescence intensity than SFSPs. This might be due to the existence of clusters of small silica agglomerated particles. According to Larson et al. [5], the number of fluorescent molecules per particle could affect the radiative properties of the particles. However, a blue shift in the emission of the FSPs was observed. It could be attributed to the effect of the solvent on the FITC molecules and the presence of silica in FSPs [26].
Fluorescence spectra of (a) FITC, (b) BFSPs, and (c) SFSPs.
Furthermore, the fluorescence emission intensity of the composite PAN/FSPs nanofibers was determined by spectrofluorometric measurements, as shown in Figure 11. The composite nanofibers containing FITC and BFSPs exhibited a very strong emission in the range of 460–550 nm when excited at the wavelength of 250 nm. However, the range of emission was from 560 to 600 nm for the nanofibers containing SFSPs when excited at the wavelength of 250 nm. Because of the very high intensity of the mentioned strong emission peak, we used the weaker emission peak at the wavelength range of about 370–450 nm for the comparison of the emission intensity of the samples. This comparison showed that the composite nanofibers containing BFSPs (as well as the nanofibers containing FITC) exhibited higher fluorescence intensity in comparison to the composite nanofibers containing SFSPs. As mentioned before, it seemed that due to the process conditions for the fabrication of SFSPs, many small unformed small silica particles were observed; these could be the reason for the lower emission intensity of the nanofibers containing SFSPs.
Fluorescence intensity of nanofibers containing (a) FITC, (b) BFSPs, and (c) SFSPs.
The relationship between fluorescence intensity and pH for the electrospun PAN/FSPs nanofibers
PAN/FSPs composite nanofibers were placed in phosphate buffers with different pH values ranging from 4.57 to 8.7, and the fluorescence emission intensity was measured at the excitation wavelength of 250 nm. As illustrated in Figure 12, the nanofibers containing SFSPs showed lower intensity, as compared to those containing BFSPs. Apart from this, the fluorescence intensity was significantly enhanced with the increase of the pH value in the range of 4.00–8.00. This increment could be explained by the existence of pH-sensitive fluorophores in FITC molecules. In addition, no visible shifts in the emission peak of the FSPs at 370 nm were observed.
Fluorescence intensity of PAN nanofibers containing (a) BFSPs and (b) SFSPs in phosphate buffers with the pH values of 8.24 (A), 7.35 (B), 6.41 (C), 5.24 (D), 4.23 (E), 8.70 (F), 7.10 (G), 6.25 (H), 5.45 (I), and 4.57 (J).
Conclusion
In this study, composite nanofibers of PAN/fluorescent core–shell silica particles were successfully fabricated. FSPs with two different sizes were synthesized. The FSPs synthesized at the pH of 11.3 had a bigger size than those synthesized at the pH of 7.7. However, for the smaller size FSPs (SFSPs), some unformed clusters of silica were observed. Therefore, it appeared that in these experiments, in order to lower the size of the FSPs, it would be better to use some modification in the process, such as increasing the centrifuge speed. SEM and TEM micrographs of FSPs also showed that almost uniform spherical particles were formed. Besides, the results of FTIR spectroscopy confirmed the linkage between silica and FITC. SEM images of the composite nanofibers confirmed that the particles’ incorporation into the nanofibers did not affect the overall morphology of the nanofibers. The fluorescence microscopy images of the composite nanofibers also revealed the fluorescence property of the nanofibers with bright spots on the nanofibers, where the particles were located. The fluorescence intensity emission of the nanofibers was significantly increased with the enhancement of the pH value in the range of 4.00–8.00. This phenomenon clearly showed the pH sensitivity of the composite nanofibers. The results suggested that these composite nanofibers had the potential to be used as novel anticounterfeiting devices in smart clothes.
Footnotes
Declaration of conflicting interests
The author(s) declared no potential conflicts of interest with respect to the research, authorship, and/or publication of this article.
Funding
The author(s) received no financial support for the research, authorship, and/or publication of this article.