
Abstract
There are several studies regarding polyacrylonitrile composite nanofibers with polyaniline doped with dodecylbenzene sulfonic acid and solved by N,N′-dimethyl formamide which were mostly performed to analyze the thermal and morphological properties. In this study, camphor sulfonic acid-doped polyaniline and polyacrylonitrile composite nanofibers were electrospun from solutions in dimethylsulfoxide and the effect of polyaniline content and the application of different dissolution methods on the morphology, chemical structure, conductivity, crystallinity, mechanical, and thermal properties of nanowebs were investigated. Morphology, nanofiber diameters, chemical structure, crystallinity, mechanical properties, and thermal properties of the nanofibers were all affected by the polyaniline addition. Compared to the conductivity of neat polyacrylonitrile nanofibers, the conductivity of the composite nanofibers was improved, reaching a value higher than 10−6 S/cm with 3 wt% polyaniline content which was in the range for electrostatic discharge applications (10−9 to 10−6 S/cm). Increase in dissolution time and application of ultrasonic homogenization affected the diameter, mechanical properties, crystallinity, and thermal properties of the nanofibers, while they had negligible effects on conductivity.
Introduction
Nanofibers of conducting polymers and their blends with conventional polymers have special properties which make them ideal for many potential applications such as electronic devices, biomedical materials, protective clothing, filtration media, etc [1]. Among conducting polymers, polyaniline (PANI) is the most widely investigated due to its novel properties and potential applications. It has unique electrical and electrochemical properties, low cost of raw material, and good compatibility with other polymer supports. It is easy to synthesize. Besides, it has wide application potential such as sensors, batteries, membranes for separation, electrochromic devices, smart fabrics, plastic microelectronics, etc [2–10]. Blending of PANI with insulating polymers makes it possible to produce conductive polymers while maintaining the special properties of the insulating polymer. In literature, there are many studies in which PANI is blended with classical polymers such as polystyrene, polyamide, cellulose acetate, etc. to form films with high electrical properties and good mechanical properties [11–14]. The conductivity of these blends depends mainly on the PANI content in the film besides some other factors such as the type of the dopant, type of the solvent, crystallinity, etc [15,16].
Although there are many studies in literature related to the production of PANI-incorporated polymer films [11–14], there are only a few studies related to polyacrylonitrile (PAN)/PANI nanofiber production which does not deal with the electrical conductivity properties and mechanical properties [17,18]. In one of the studies [17], dodecyl benzene sulfonic acid (DBSA)-doped PANI was incorporated into PAN using N,N′-dimethyl formamide (DMF) as the solvent to produce nanofibers and only the morphology (scanning electron microscopy [SEM]), chemical structure (Fourier transform infrared spectroscopy [FTIR]), and thermal properties (differential scanning calorimetry [DSC]) were investigated. In another study carried out by the same group [18], X-ray diffraction (XRD) patterns and thermal analysis (thermogravimetry) were also performed. But there was no information regarding the mechanical properties and conductivity of PAN/PANI composite nanofibers although PANI has important effects on the composite structure. In a study related with the electrical and structural properties of PAN and DBSA-doped PANI films, a conductivity of 10−7 S/cm for the PANI content of 2.5 wt% was reported [2]. Although DBSA is widely used as seen in the above literatures, camphor sulfonic acid (CSA) can also be used as dopant for PANI. Thus, in this study, CSA-doped PANI is incorporated into PAN at different percentages using dimethylsulfoxide (DMSO) as the solvent and besides the PANI content, the effect of dissolution process on the properties of the composite nanofibers was also investigated. In literature, there are no studies related with the effects of dissolution process of PANI which has difficulties regarding solubility. Thus, contribution to the literature is provided by this comprehensive study using mechanical property analysis, electrical conductivity analysis, XRD analysis, morphological analysis, thermal analysis (DSC) together with FTIR and UV–Visible spectroscopy for CSA-doped PANI/PAN composite nanofibers using DMSO as the solvent instead of DBSA-doped PANI which was generally solved by DMF or chloroform.
Experimental details
Materials
PAN (Sigma Aldrich, 181315, average molecular weight: 150,000 g/mol), PANI (Sigma Aldrich, 530689, average molecular weight: 65,000 g/mol), CSA, DMSO were used as received. CSA-doped PANI solution in DMSO was filtered using Sartorius Stedim filter paper (No. 389) before PAN addition.
Methods
Preparation of the solutions
The required amount of CSA (dopant) and PANI (equivalent molar ratio PANI:CSA = 1:2) were added to DMSO and mixed with magnetic stirrer at 40℃, 300 r/min for two days. The solution was filtered with Sartorius Stedim filter paper and then 7 wt% PAN (with respect to the weight of the solution) was added to the PANI/DMSO solution. The concentration of PANI was changed as 1, 3, 5, 7, 10, and 30 wt% (with respect to the weight of PAN). As reference, 100% PAN nanofibers with DMSO were produced.
For the investigation of the effect of dissolution process, two other samples were also prepared. For one of the samples, PANI solution was stirred for 10 days instead of 2 days before filtration to see the effect of PANI dissolution time and for the other sample, after two days dissolution of PANI with magnetic stirrer, the solution was homogenized with ultrasonic probe (homogenizer: Bandelin Sonopuls HD 2070, probe type: KE76) for 1.5 h and then was filtered.
List of the samples produced.
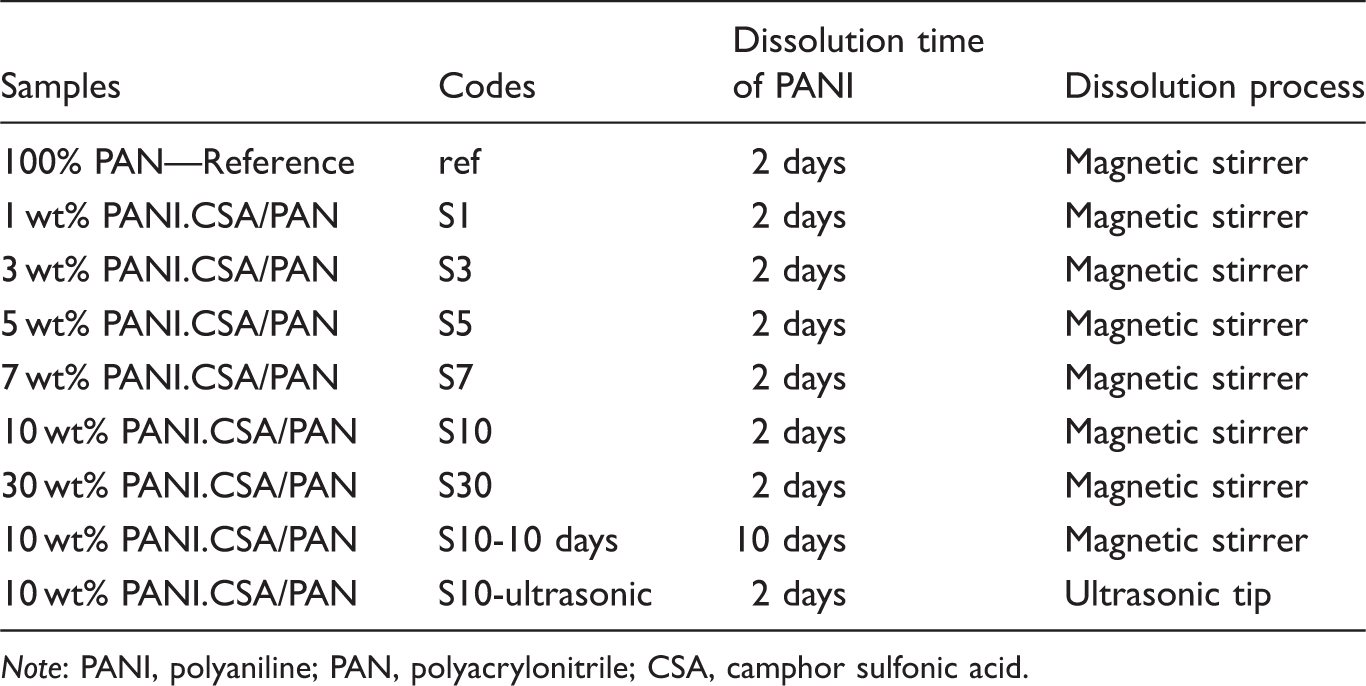
Note: PANI, polyaniline; PAN, polyacrylonitrile; CSA, camphor sulfonic acid.
Electrospinning
Horizontal electrospinning setup, a schematic of which is shown in Figure 1, was used in the production of the samples.
Schematic of the electrospinning setup used in the production of the nanofibers.
It contained a syringe pump, a high voltage power supply (0–50 kV), and a grounded rotating collector. Electrospinning solutions were fed through a metallic blunt tip needle (diameter = 1.25 mm), using a plastic syringe of 10 ml. During electrospinning, voltage of 15 kV was applied. The distance between the tip and the collector was set as 10 cm and the flow rate of the spinning solution as 1 ml/h.
Characterization
The viscosities of the electrospinning solutions were measured with Fungilab Smart Series using R6 spindle at 100 r/min.
Fourier transform infrared absorption spectra for pure PAN and PAN/PANI nanowebs were taken with Thermo Scientific Nicolet IS10 spectrometer. The scanning ranged from 4000 cm−1 to 400 cm−1.
SEM (EVO MA 10) was used to obtain SEM images of the samples. The samples were sputter coated with gold layer before SEM analysis. The diameters of at least 50 randomly selected nanofibers were measured on SEM photomicrographs and analyzed using Image Analysis Software to obtain the average fiber diameter.
UV–Vis spectroscopy was used to confirm the presence of PANI in PAN/PANI composite nanowebs and doped state of PANI. UV–Vis absorption spectra of PANI/DMSO, PANI.CSA/DMSO, and PAN–PANI.CSA/DMSO solutions were obtained with Shimadzu UVmini-1240 UV–Vis Spectrophotometer in the 300–1100 nm region.
Wide-angle X-ray diffraction traces were obtained using a Bruker® AXS D8 Advance X-ray diffractometer system using nickel-filtered CuKα radiation (λ, 0.154056 nm) with voltage and current settings of 40 kV and 40 mA, respectively. Counting was carried out at 10 steps per degree. The diffraction patterns of the reference and composite nanofibers were obtained by scanning the samples in the 5–40° 2θ range.
Tensile strength, breaking elongation, and E-modulus of the webs were obtained using a tensile tester with a 100 N load cell at a crosshead speed of 20 mm/min. Specimens were cut in 35 mm (length) × 5 mm (width) dimensions for tensile testing. The gage length was 15 mm, and at least 10 specimens were tested for each sample. The thicknesses of the specimens were measured with a Mitutoyo digital micrometer.
Resistance measurements were performed using a two-circular probe connected to Microtest 6370 LCR meter with four-wire system. Conductivity in S/cm was calculated using the volume resistance value measured and the geometric dimensions of the samples according to equations (1) and (2) [19,20]


The thicknesses of the samples were measured with the integrated thickness meter.
Thermal properties of nanofibers were evaluated using DSC (TA Q Series DSC Q10) from 30℃ to 400℃, at a heating rate of 20℃/min in nitrogen environment.
Statistics
All the data regarding the nanofiber diameter, breaking stress, elongation, E-modulus, and conductivity were expressed as the mean ± standard deviation. Statistical analysis was performed using Statistical Package for the Social Sciences 21.0. Differences between groups were analyzed by investigation of analysis of variance (ANOVA) and multiple comparisons were performed using the Least Significant Difference (LSD) post hoc test. Differences were considered significant when p < 0.05.
Results and discussion
After electrospinning, the nanowebs were dried under standard atmospheric conditions and tested for morphology, chemical structure, conductivity, crystallinity, mechanical, and thermal properties. The results obtained are discussed below with the relevant figures and tables.
FTIR
FTIR analysis was performed in order to confirm the presence of PANI in the composite structure by comparing the infrared absorption spectra of pure PAN nanofibers and PAN/PANI composite nanofibers.
The FTIR spectra of PAN nanofibers and PAN/PANI composite nanofibers are presented in Figure 2. It can be clearly seen that the pure PAN nanofibers displayed the characteristic absorption peaks of nitrile (–C ≡ N) group at around 2242 cm−1, besides a series of characteristic bands in the regions of 2930–2870 cm−1, 1460–1450 cm−1, 1380–1360 cm−1, and 1290–1260 cm−1 which are attributed to the vibrations of different modes in methylene group of PAN [21]. In the FTIR spectra of PAN/PANI composite nanofibers, in addition to the characteristic peaks of pure PAN, a wide peak was observed at around 3390 cm−1, which is due to the free imine (–NH) groups of PANI. Also a shoulder observed at around 3280 cm−1 showed the aromatic C–H strecthing [22]. Another peak at 1732 cm−1 was due to the –C = O groups in the CSA and confirmed the presence of the CSA component in the composite structure.
FTIR spectra of (a) reference (pure PAN) and (b) S30 composite nanofibers.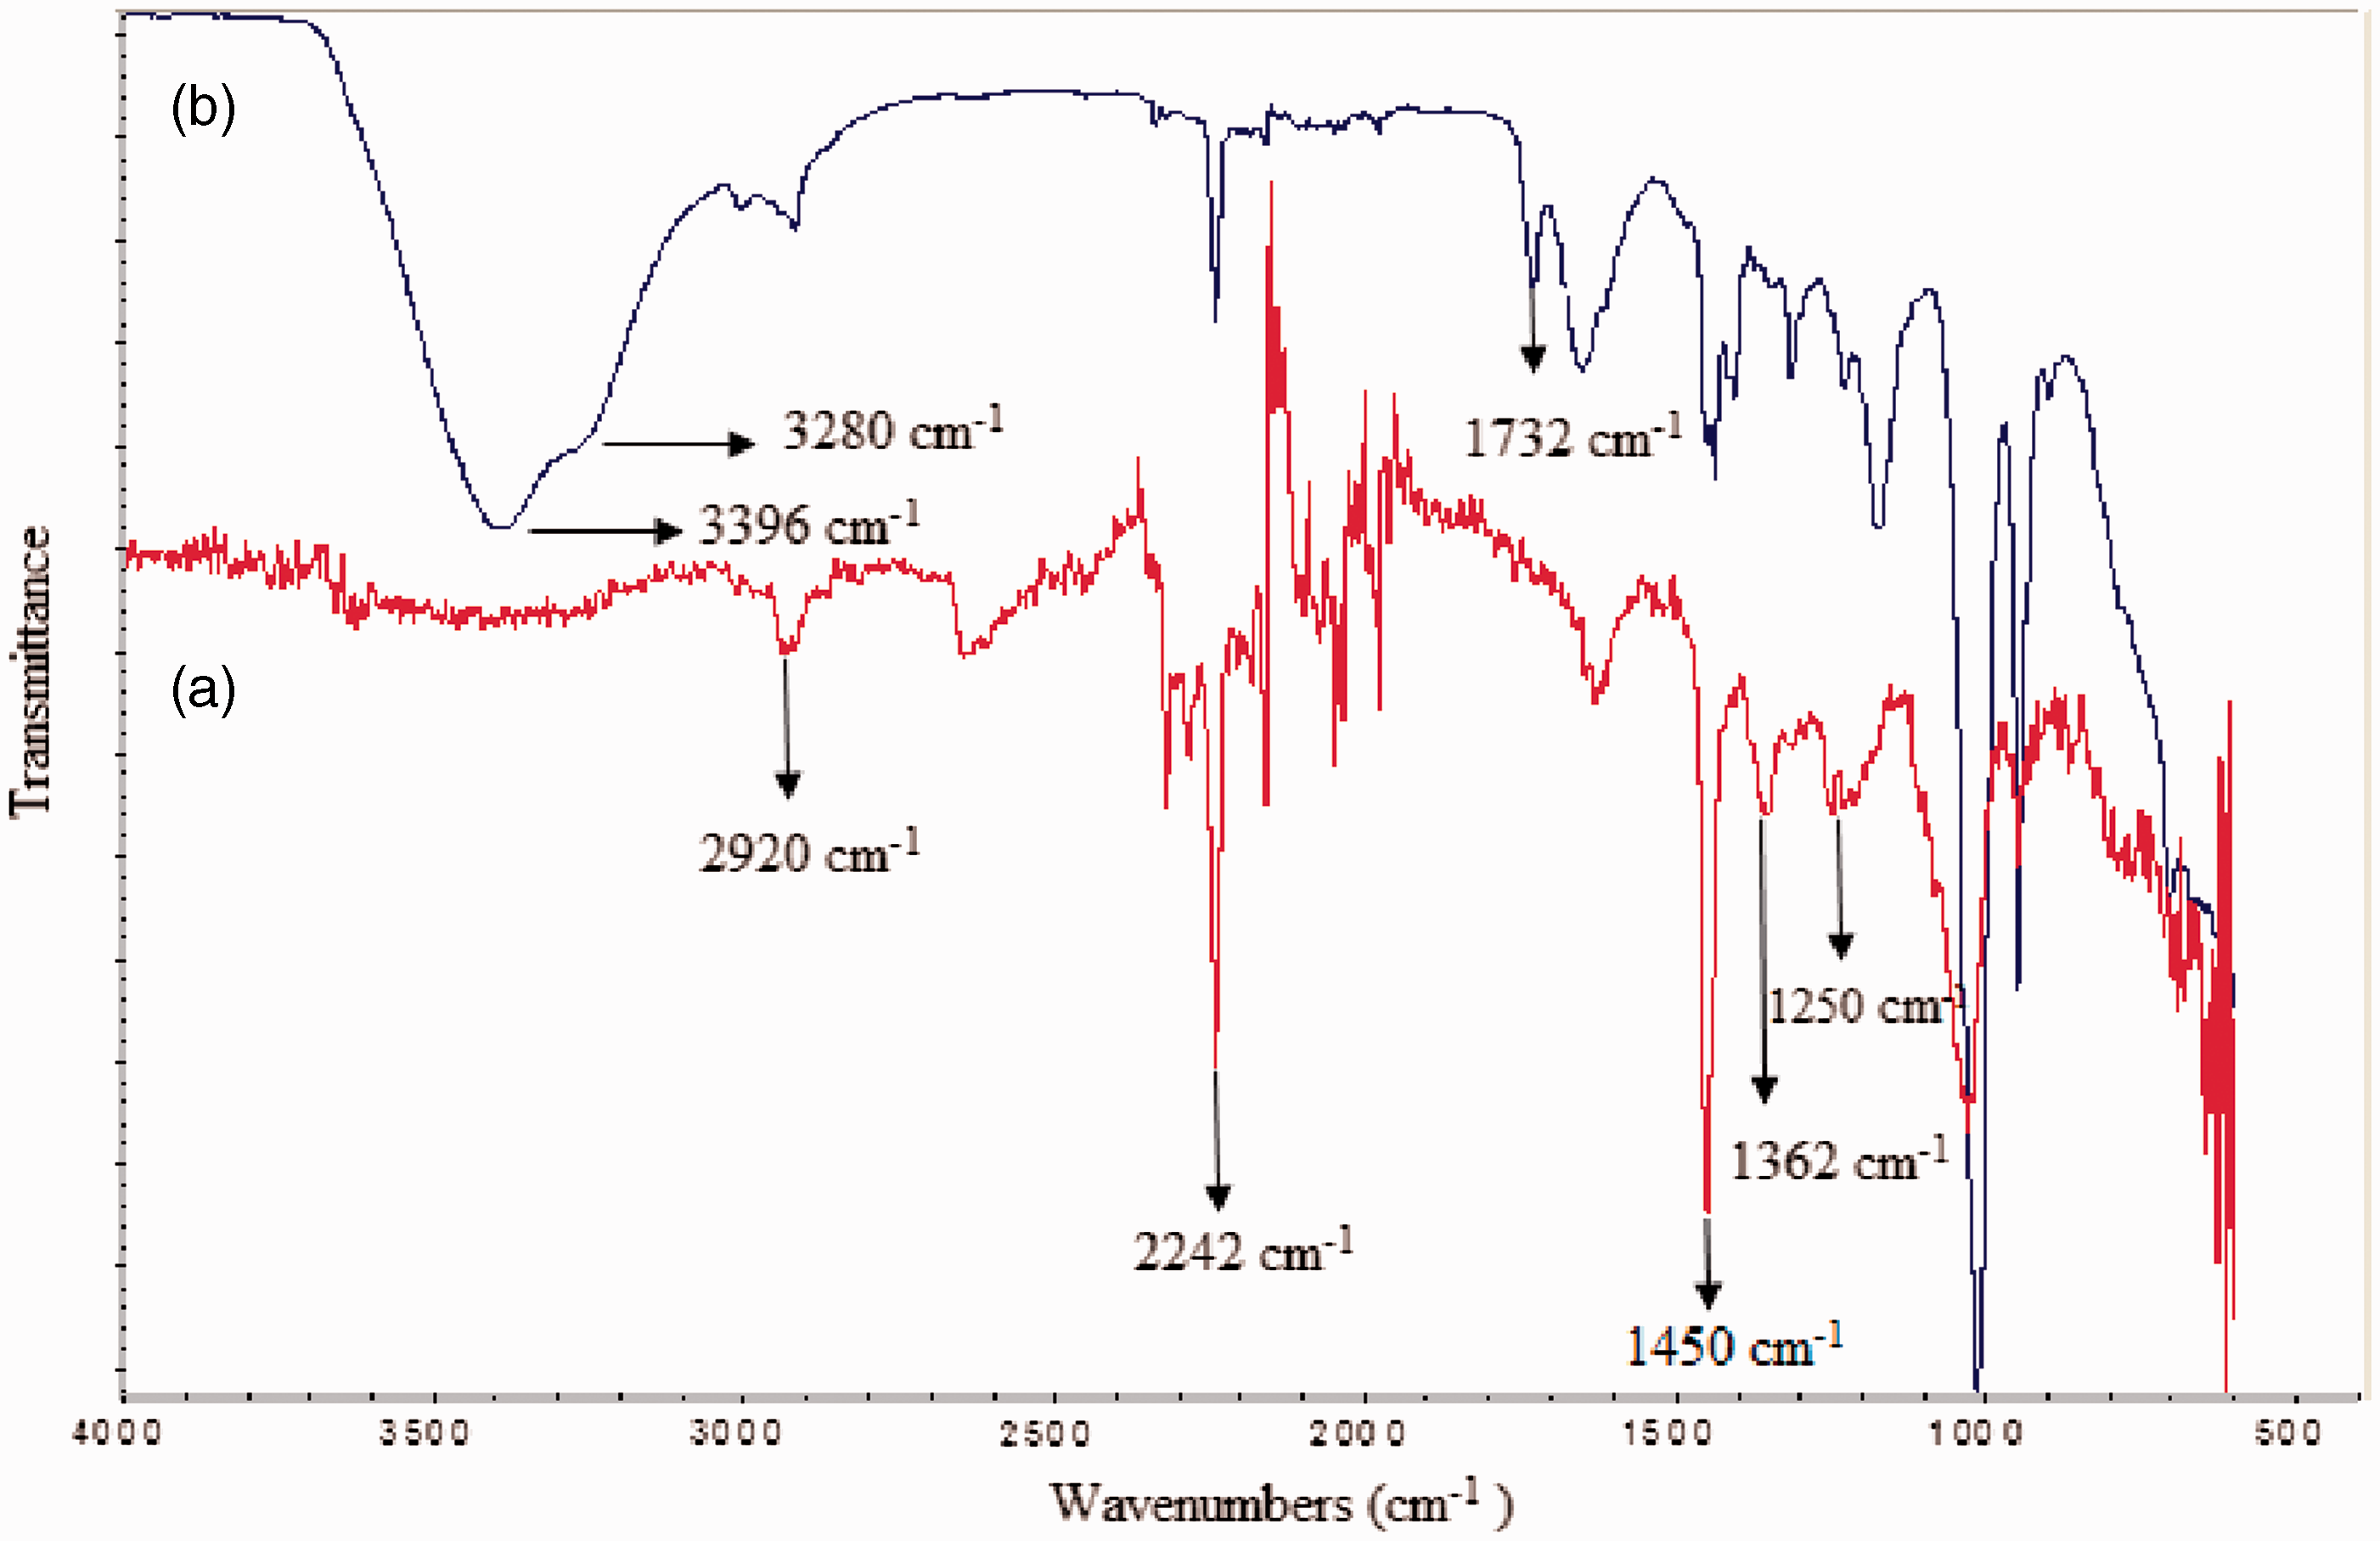
Morphology
Pictures, SEM images, and diameter information of nanofibers.

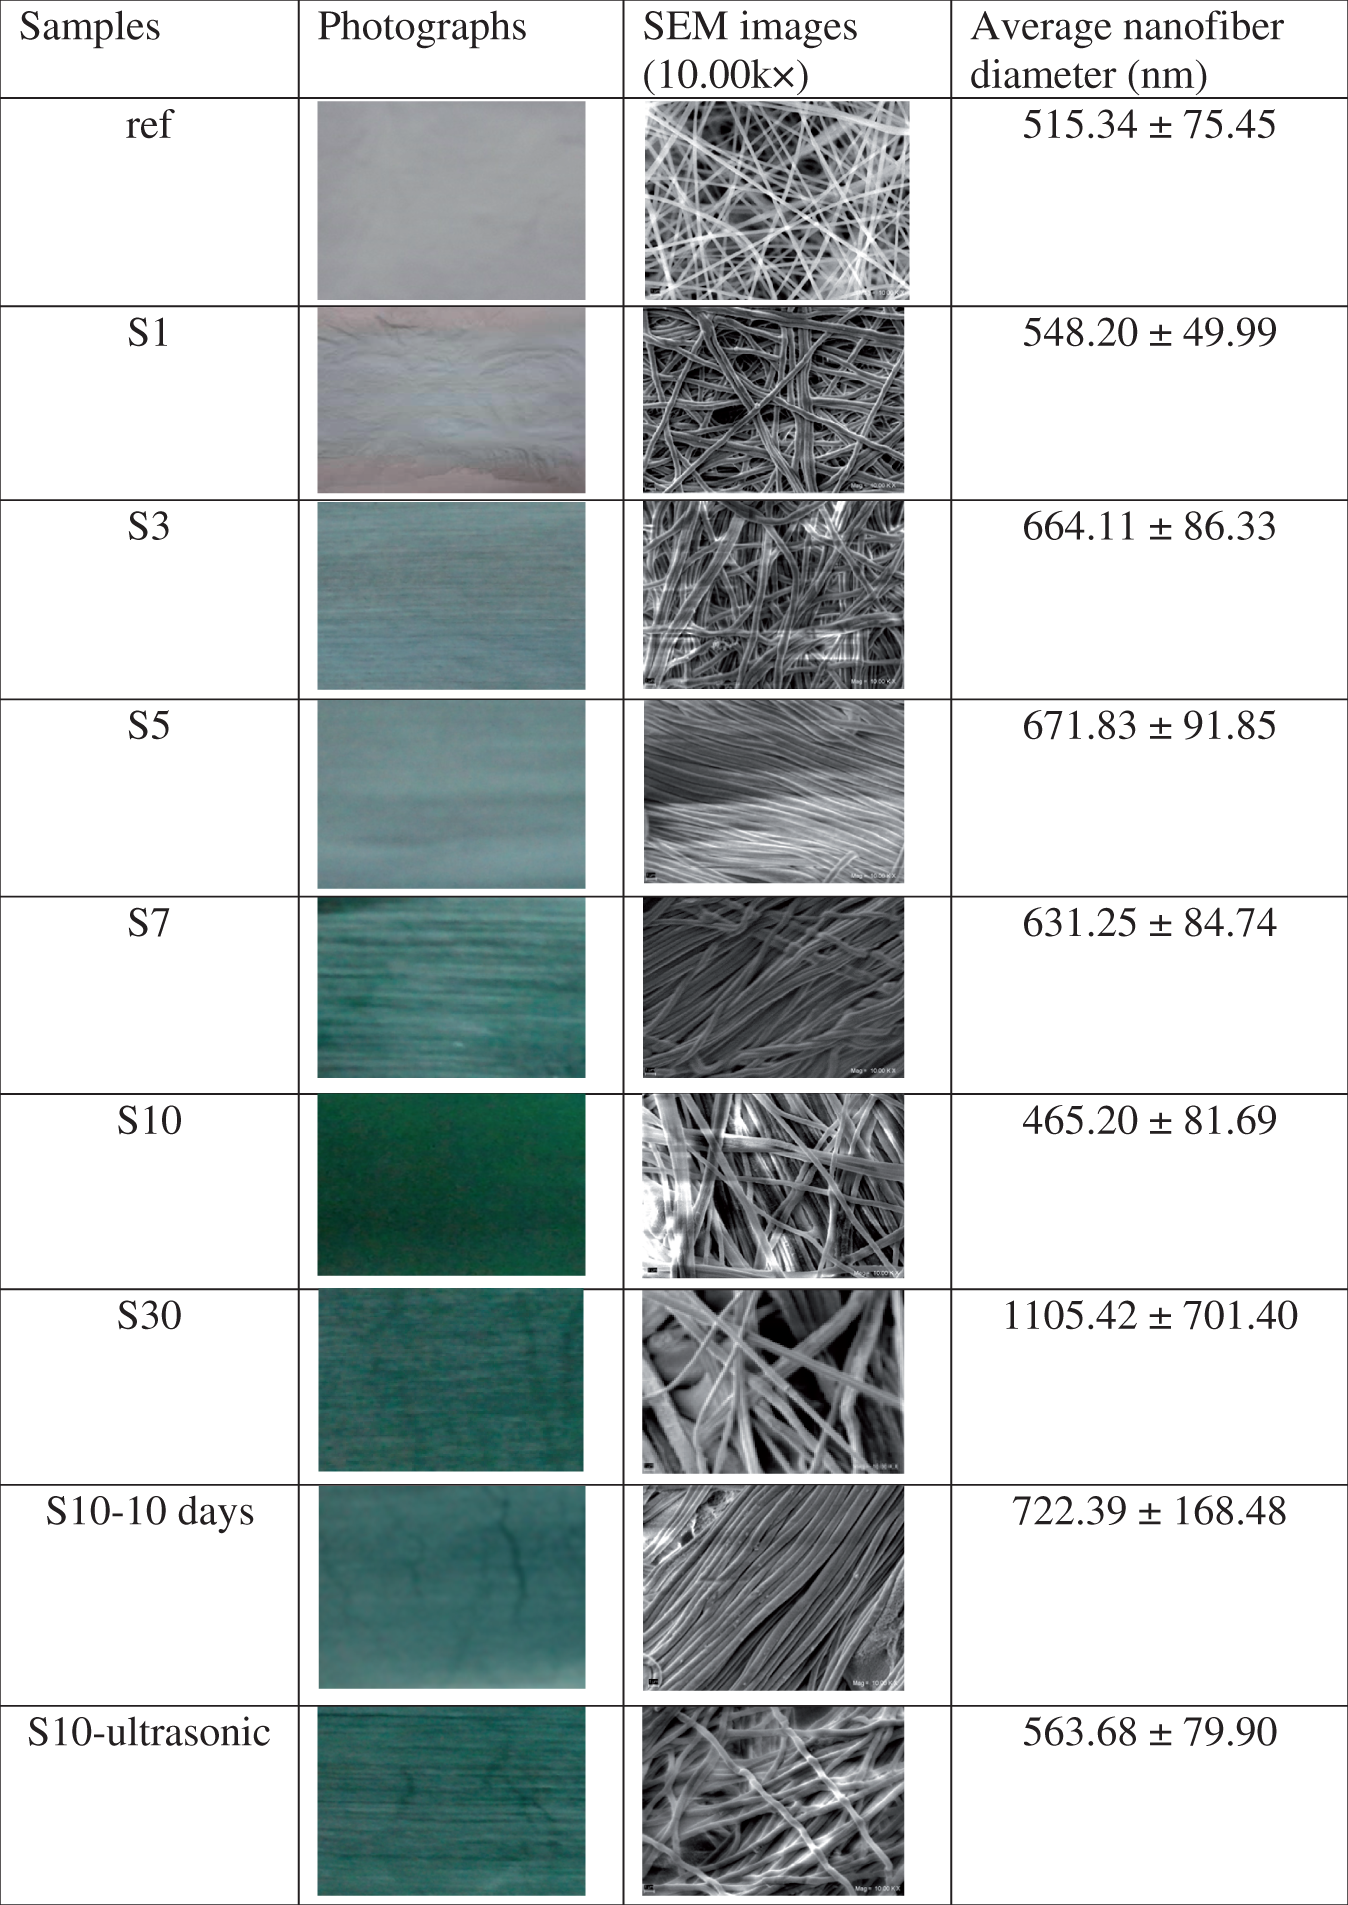
Note: SEM, scanning electron microscopy.
The white color of the reference sample turned into green with the addition of PANI. As the content of PANI increased, the color darkened. When PANI content was between 1 and 10 wt%, the nanofibers were beadless and uniform, while 30 wt% PANI addition resulted in a disordered structure with too many beads together with very thin and very coarse fibers. This disordered structure might have been due to the instabilities formed with the higher content of PANI which may have a tendency of agglomeration resulting in nonhomogeneous electrospinning.
SEM images showed that the diameters of the nanofibers as well as the morphology were affected by PANI content. The average diameters of the composite nanofibers produced were in the range of 450–1105 nm, while the neat PAN nanofibers electrospun with DMSO (reference) had an average diameter of 515.34 nm. An increase and then a decrease in diameters of the nanofibers were observed with the increase in PANI content as presented in Figure 3.
Diameter variation of nanofibers with PANI content (%).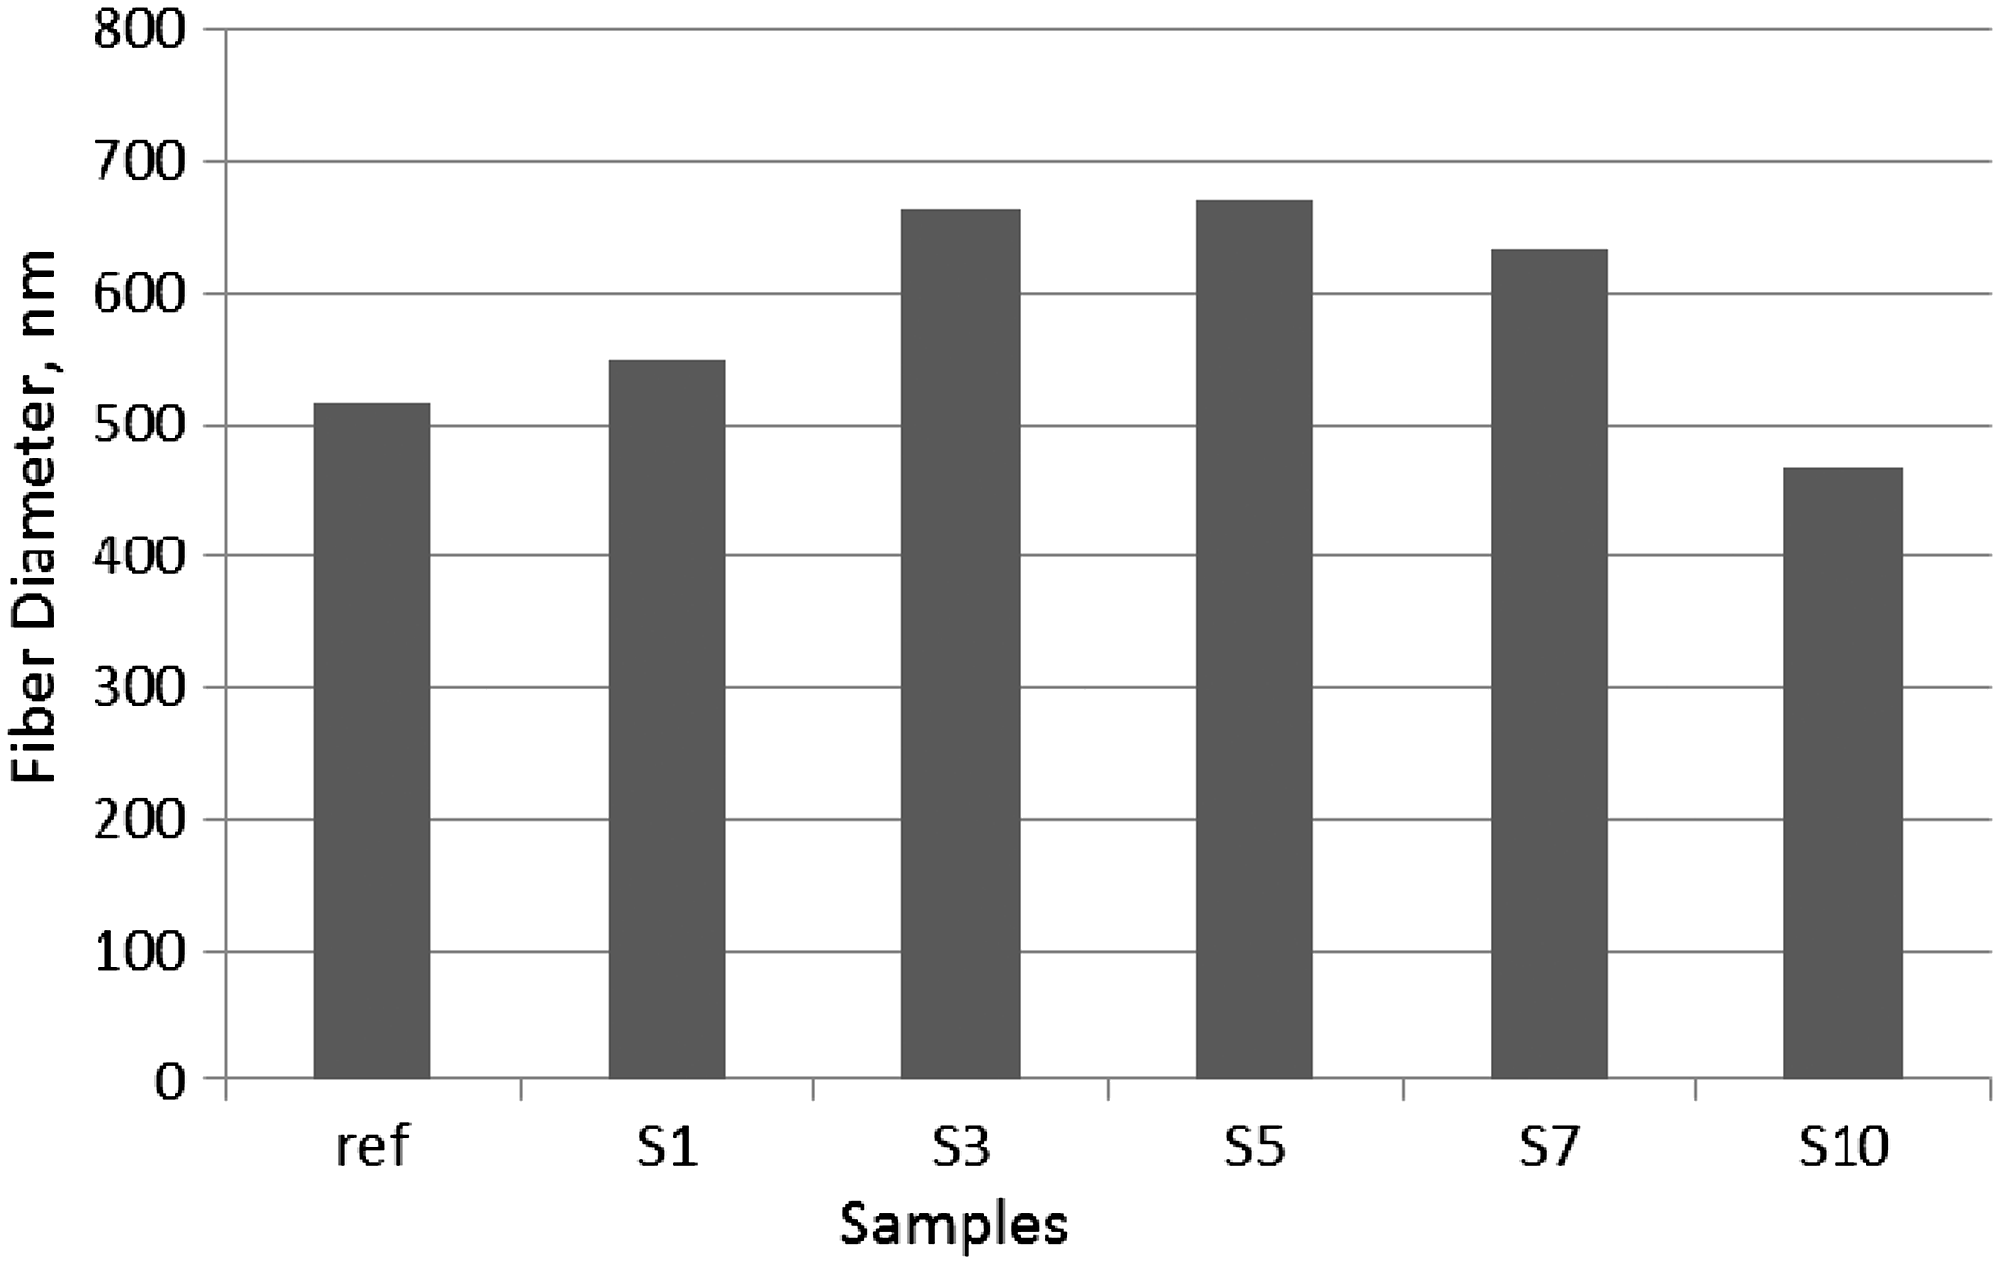
Viscosity values of electrospinning solutions.
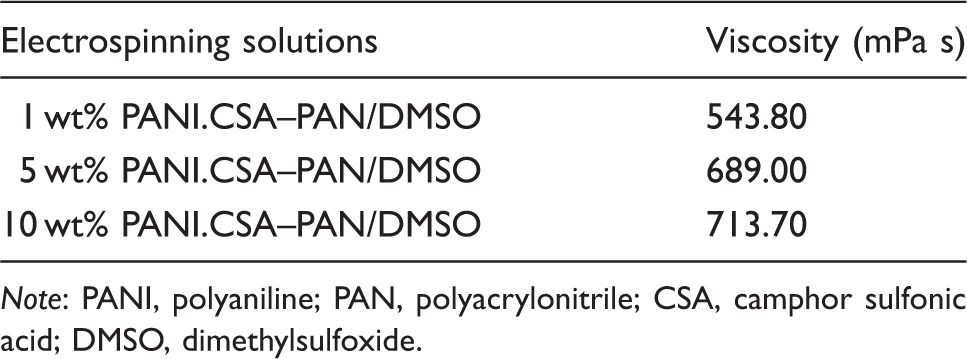
Note: PANI, polyaniline; PAN, polyacrylonitrile; CSA, camphor sulfonic acid; DMSO, dimethylsulfoxide.
Dissolution process also affected the diameter of the nanofibers. As presented in Figure 4, both, the increase in the dissolution time from 2 days to 10 days and ultrasonic application resulted in an increase in nanofiber diameter as a result of the increase in dissolved PANI amount. The effect of the increase in dissolution time was higher than the effect of the ultrasonic application.
Diameter variation of the nanofibers with the application of different dissolution processes.
ANOVA results showed that PANI content had significant effect on fiber diameter. The mean fiber diameters of the S3, S5, S7, and S30 nanofibers were significantly different from the mean fiber diameter of reference at 0.05 significance level. In addition, ANOVA carried out between the samples produced by the application of dissolution processes showed that the dissolution process significantly affected the mean fiber diameters at 0.05 significance level.
UV–Vis spectroscopy
The UV–Vis spectroscopy was used to confirm the conductive state of the solutions. The peaks at 330 nm and 630 nm are due to the π − π* transition of benzene ring and the excitation of the quinoid ring, respectively. After an effective doping, the peak at 330 nm remains, while the peak at 630 nm disappears, and two additional peaks at 450 and 800 nm occur, both stemming from the formation of delocalized polarons [26].
The UV–Vis spectra of PANI solutions with and without the dopant CSA is presented in Figure 5(a) and (b), while the UV–Vis spectrum of PAN-added electrospinning solution is presented in Figure 5(c). Two characteristic peaks at 330 nm and 630 nm which correspond to the excitation of benzene and quinoid rings, respectively, were observed for the undoped solution (Figure 5(a)). The absorption band at 635 nm disappeared, while the absorption band at 330 nm remained and two new absorption bands at 430 nm and 800 nm were observed due to the formation of the mid-gap state which showed the conductive nature of the solutions (Figure 5(b)). The conductive nature of the solution was maintained through the addition of PAN (Figure 5(c)).
UV–Vis spectroscopy of (a) 10 wt% PANI/DMSO, (b) 10 wt% PANI.CSA/DMSO, and (c) 10 wt% PANI.CSA–PAN/DMSO solutions.
Mechanical properties
The mechanical properties of PAN/PANI nanowebs with different PANI contents were tested and they are presented in Table 4 and Figure 6(a)–(c).
(a) Breaking stress, (b) breaking elongation, and (c) E-modulus of PAN/PANI composite nanofiber webs with different PANI contents. Mechanical properties of composite nanofiber webs with different PANI contents. Note: PANI, polyaniline.

PANI addition resulted in a decrease in breaking strength in parallel with the literature [21]. Ten weight percent and above of PANI resulted in a drastic decrease in strength of the composite nanofibers. The nanofibers produced with 30 wt% PANI showed nonhomogeneous fiber formation. There were many beads in the nanoweb structure and the variation of the fiber diameter was very high due to the formation of very thick and very thin fibers. This nonhomogeneous structure might have been one of the reasons for the lower breaking strength. The increase in agglomeration tendency and nonhomogeneous distribution of PANI in polymer matrix may be another reason of decrease of breaking strength.
Breaking elongation increased as PANI content increased until the content of 7 wt%, which may have been mainly due to the alignment of nanofibers. When the nanoweb is uniaxially strained, the fibers that lie in alignment with the axis of the strain start to slip over each other, which results in higher breaking elongations. Also the nonhomogeneous distribution of conductive polymer may have resulted in void (pore) formation around the agglomerated PANI clusters which may cause a yield of pore leading higher elongation until some critical elongation point.
Unlike with polymer films and other uniform materials, subjecting polymeric nanowebs to tensile deformation result in nonuniform stresses that result in rearrangement of nanofibers within the web to accommodate the strain [27]. Thus, breaking behavior of polymeric nanofiber is not as simple as metallic rod behavior during breaking, since there are many uncontrollable factors such as pores within the nanofiber web and nonuniform alignment of nanofibers in the web. Thus, it is usually very difficult to analyze the E-modulus values but from the Table 4, it can be said that there is a tendency of decrease in E-modulus values as the amount of PANI increases.
The effects of the dissolution process on the mechanical properties are presented in Table 5 and Figure 7(a)–(c).
(a) Breaking stress, (b) breaking elongation, and (c) E-modulus of PAN/PANI composite nanofiber webs produced with the application of different dissolution processes. Mechanical properties of the composite nanofiber webs produced with the application of different dissolution processes.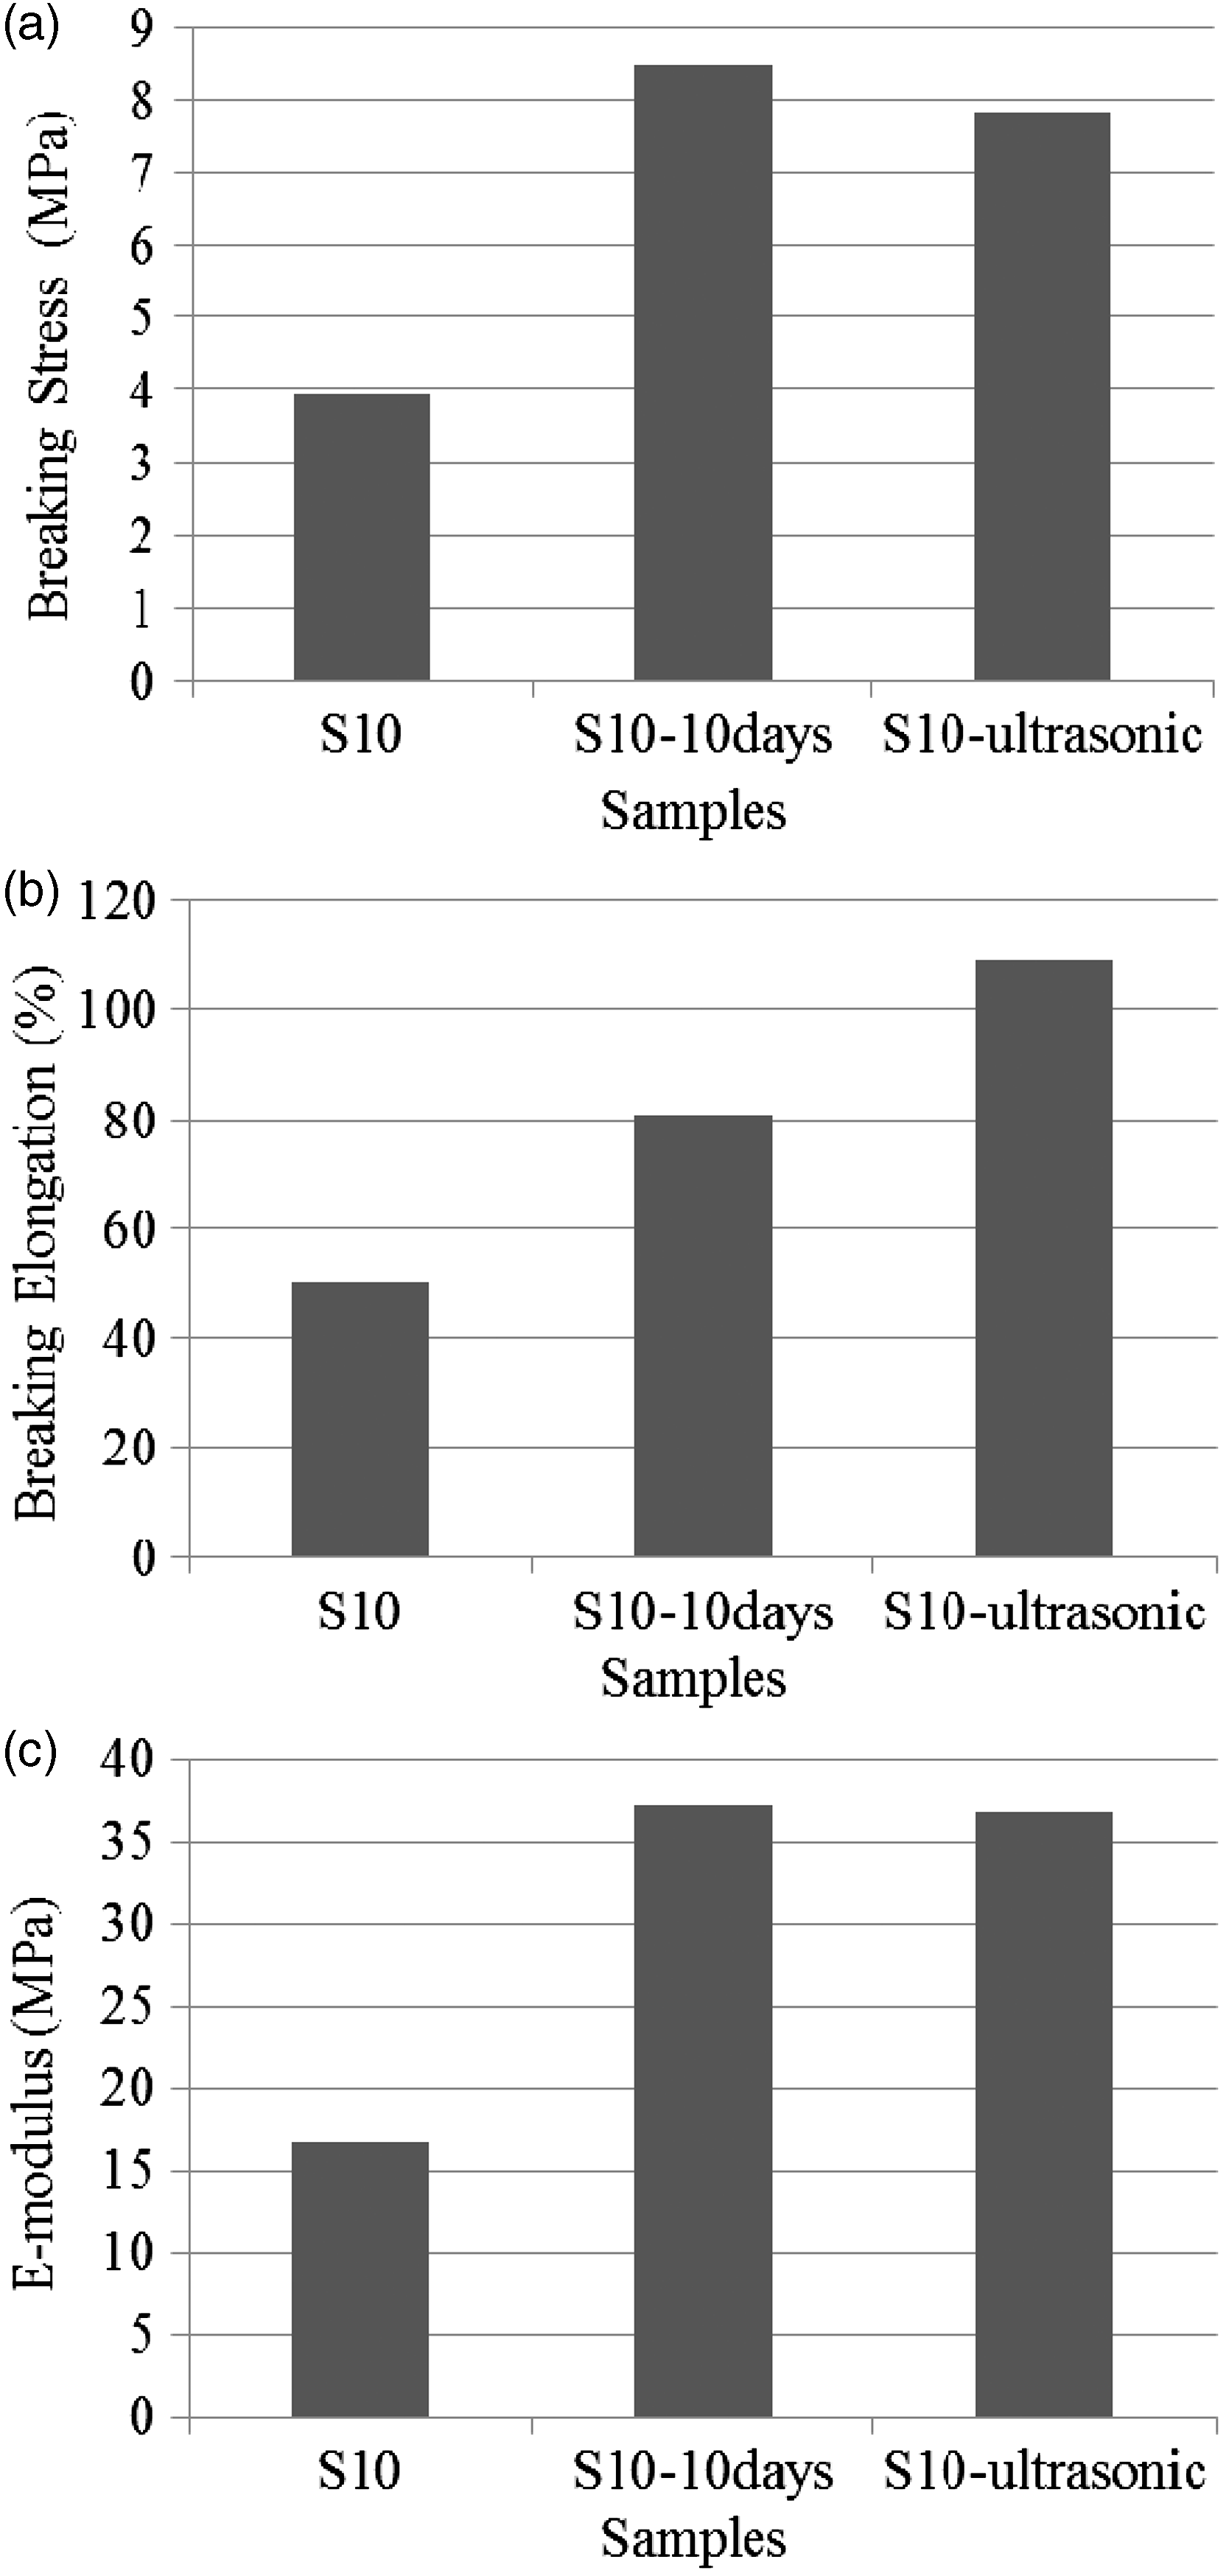

As a result of the increase in dissolution time and the application of ultrasonic dissolution, the breaking strength increased which is considered to be the result of the increase in the PANI content. The breaking elongation also increased with the improvement in dissolution due to increased strength.
ANOVA evaluation of the data revealed that PANI content affected the breaking stress and elongation of the composite nanofibers. No matter how much PANI was added, PANI addition significantly affected the breaking stress and elongation values when compared to neat PAN nanofibers at 0.05 significance level. Regarding the dissolution processes, ANOVA results demonstrated that the type of the dissolution process also significantly affected the breaking stress and breaking elongation at 0.05 significance level.
Conductivity
Conductivity values of the composite nanofiber webs with different PANI contents.

Note: PANI, polyaniline.
The conductivity of neat PAN nanofibers is reported as 10−12 S/cm in the literature [28]. On the other hand, emeraldine base form of PANI with the conductivity on the order of 10−12 S/cm in its neutral form is also insulating. Increase in conductivity is obtained by the protonation of the emeraldine base [29]. Conductivity was improved in all of the samples produced with the addition of PANI. The conductivity increased as the PANI content increased though the increase between the content of 3 wt% and 10 wt% was very slow. A network of doped PANI may have formed at the PANI content of 3 wt% so that the conductivity does not change more with the further increase in the PANI content due to distortion of network with an increase of nonuniform dispersed PANI within PAN polymer matrix. By the use of 3 wt% PANI, insulator PAN (10−12 S/cm) became semiconductive material (10−6 S/cm) which can be used as static electric discharge material.
Conductivity values of PAN/PANi composite nanofiber webs produced with the application of different dissolution processes.

Note: PANI, polyaniline.
X-ray diffraction
When the nanofibers are designed and produced for commercial use, their crystalline properties become important [30]. In order to investigate the crystalline structure of PAN/PANI composite nanofibers, XRD measurements were carried out. Electrospinnning being a fast process generally retards development of crystallinity. The duration of the whipping instability process is too short in most cases to allow crystallite growth during the spinning process [27]. Low levels of crystallinity for many different types of polymeric nanofibers are reported in many studies in literature [18,31–34]. Solvent properties, collector type, take-up speed of the rotating collectors, conductivity of the solution, stretching, applied voltage during electrospinning, polymer characteristics such as molecular weight, and concentration affect either the crystallinity of as-spun nanofibers or their tendency to crytallize in subsequent annealing [27].
Due to the atactic nature of PAN polymer chains, three-dimensional structure cannot be formed and only a two-dimensional network of chains can be developed. Wide-angle XRD patterns of oriented PAN-based nanofibers generally show the presence of highly oriented two-dimensional order perpendicular to the fiber axis and the absence of peridicity along the fiber axis direction. A typical equatiorial X-ray diffraction trace of PAN nanofibers shows two well-defined and sharp and one diffuse equatorial reflections at with d-spacings of 0.529 nm, 0.306 nm, and 0.34 nm, respectively. These reflections happen to have the scattering angles of 16.7°, 26.7°, and 29.2° 2θ, respectively. On the other hand, the main characteristic peaks of PANI are reported to occur at 2θ = 15.07°, 20.22°, and 25.18° [35].
Figure 8 shows the curve fitting of equatorial X-ray diffraction traces of pure PAN and PAN/PANI composite nanofibers. Qualitative examination of equatorial X-ray diffraction traces shows two prominent reflections with d-spacings of 0.52 and 0.3 nm which can be indexed as (1 0 0) and (1 1 0) reflections of hexagonal unit cell [36] with basal plane dimensions of a = b = 0.6 nm. The reflection located at 0.52 nm is the strongest in intensity and indexed as (1 0 0) reflection. The other sharp but less intense equatorial reflection has a d-spacing of 0.3 nm and indexed as (1 1 0) reflection. The diffuse equatorial reflection at 0.34 nm is very broad in nature and can be assigned to disordered material. As far as the structure of PANI chains is concerned, the breadth of the PANI peaks is found to be broad which represents highly disordered structure. Broad nature of PANI peaks indicated that the structure was highly amorphous in comparison to ordered PAN chain structure.
X-ray diffraction traces of (a) ref, (b) S1, (c) S5, and (d) S10 nanofiber webs.
Crystallinity values of pure PAN and PAN/PANI composite nanofiber webs.

Note: PANI, polyaniline; PAN, polyacrylonitrile.
The dissolution process also had an effect on the crystallinity of nanofibers. Figure 9 shows the X-ray diffraction traces of composite nanofibers, electrospinning solutions of which were prepared by the application of different dissolution processes. Being still higher than the crystallinity values of the neat PAN nanofibers, both the increase in the dissolution time and the application of the ultrasonic homogenization resulted in lower crystallinity values than that of the samples produced from the solutions magnetically stirred for two days. Compared to the samples in which PANI solution was stirred magnetically only for 2 days, increasing the dissolution time from 2 days to 10 days and applying ultrasonic homogenization for 1.5 h after magnetically stirring for 2 days, appeared to cause amorphization of PAN structure when 10 wt% PANI was incorporated. The degree of crystallinity of PAN is reduced to 16.3% when ultrasonication is employed during the preparation of polymer solution.
X-ray diffraction traces of (a) S10, (b) S10-10 days, and (c) S10-ultrasonic nanofiber webs.
Thermal properties
DSC thermograms of the samples produced with different contents of PANI are presented in Figure 10, while the temperature of cyclization (Tc) and enthalpy values are presented in Table 9.
DSC thermograms of (a) ref, (b) S1, (c) S5, and (d) S10 nanofiber webs. DSC results showing the Tc and ΔH. Note: DSC, differential scanning calorimetry.
All nanofiber samples exhibited a relatively large exothermic peak at around 310–340℃ which is attributed to intramolecular and intermolecular reactions mainly consisting of dehydrogenation, instantaneous cyclization, and crosslinking reactions. The nature of these reactions is known to be exothermic. Among these three reactions, the predominant process is the cyclization of the nitrile groups into an extended conjugated ring system [19,37–41]. It is well established that the homopolymer PAN (i.e. pure PAN) goes through the cyclization reactions via the radical mechanism. The cyclization of nitrile groups of pure PAN initiated through a free radical is considered to take place as the result of intra or intermolecular jumping of radicals. Free radicals are known to accept hydrogen atom from nearby polymer chains and propagate [42].
Due to the aromatic nature of PANI chains, the incorporation of PANI is expected to increase the temperature of cyclization (Tc) of PAN/PANI composite system. With the addition of varying amount of PANI, the position of the exothermic peak shifted to higher temperatures and broadened in comparison to pure PAN. The temperature of cyclization for the nanowebs was found to vary between 315 and 340℃ depending on the PANI incorporation and the applied dissolution process. The exothermic peak area intensity, which indicates the total heat of cyclization reactions, decreased with increasing amount of PANI incorporation between 1% and 5% (samples S1 and S5 in Table 9). The broadening of the exothermic peak in the presence of 1–5% PANI suggests the modification of the activity of free radicals involved in the cyclization reactions. The decreased cyclization heat is possibly caused by the interactions between PAN and PANI, which decrease the formation of free radicals on the nitrile groups and their recombinations.
The lowest value of heat release (ΔH), 302 J/g, indicates the degree of cyclization and the heat produced is the least for the sample containing 5% PANI. It seems that PANI incorporation between 1% and 5% accelerates the cyclization reaction the most.
The lower value of heat release may be due to the easy formation of free radicals on the nitrile groups and the subsequent recombination between intramolecular radicals [42]. It seems that 5% PANI incorporation is the optimum for cyclization reactions where the amount of heat release is minimum. When PANI incorporation is 10%, the values of Tc and heat release increase implying the inhibiting effect of large amount of PANI molecules which seems to be preventing the recombinations between free radicals. This behavior is likely to prevent the formation of intermolecular or intramolecular cross-linking reactions.
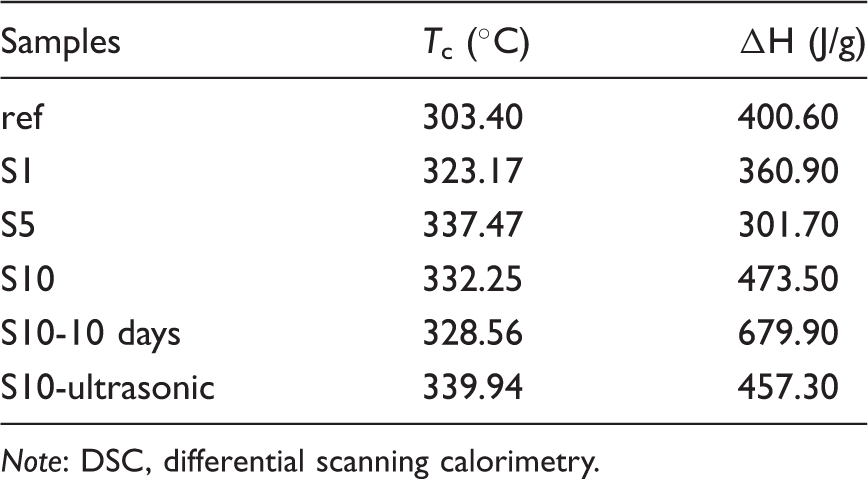
The results presented in Figure 11 and Table 9 showed that the dissolution processes also affected the cyclization process. DSC thermograms of the samples produced with different dissolution processes are presented in Figure 11, while the Tc values are presented in Table 9.
DSC thermograms of (a) ref, (b) S10, (c) S10-10 days, and (d) S10-ultrasonic.
The cyclization temperatures (Tc) and enthalpy values (i.e. the amount of heat released) (ΔH) for the samples containing 10% PANI are found to be higher than that of pure PAN. These results suggest that the cyclization reaction is more intense and is expected to release large amounts of volatile by-products. The shifting of the peak position of cyclization exotherm to higher temperatures is attributed to the inhibiting effect of PANI that hindered the recombinations between the radicals. Ten percent incorporation of PANI under magnetic stirring taking two days increased the temperature of cyclization from 303℃ for pure PAN to 332℃. However, extending the dissolution process time from 2 to 10 days using magnetic stirring technique for the sample containing 10% PANI, the temperature of cyclization decreased slightly from 332° to 328℃, while the heat release increased from 473 J/g to 680 J/g. The increase in heat release might have been due to the increased amount of PANI incorporated into the fiber structure preventing the recombinations between free radicals. On using ultrasonic stirring technique, it was observed that Tc increased to 340℃, but heat release decreased from 680 J/g to 457 J/g. Application of ultrasonic dissolution technique might have resulted in oligomer formation by damaging the macromolecular chains and this seems to have accelerated the cyclization process.
Conclusion
The PAN/PANI composite nanofibers with different PANI contents were successfully prepared via electrospinning method. SEM images showed that the composite nanofibers were generally uniform, while the 30 wt% PANI addition resulted in the formation of nonhomogeneous fiber structure. The average nanofiber diameter, mechanical properties, crystallinity, thermal properties were all affected by the PANI content. Breaking stress decreased with PANI addition, while breaking elongation increased as PANI content increased until the content of 7 wt% and then decreased. Compared to the conductivity of neat PAN nanofibers, the conductivity of the composite nanofibers was improved, reaching a value higher than 10−6 S/cm with 3 wt% PANI content which was in the range for electrostatic discharge (ESD) applications (10−9 to 10−6 S/cm). All the samples appeared to have improved crystallinity values in comparison to neat PAN nanofibers. In thermal anaylsis, the position of the exothermic peak shifted to higher temperatures and broadened with the addition of PANI. The lowest value of heat release (ΔH), 302 J/g, indicated the degree of cyclization and the heat produced was the least for the sample containing 5 wt% PANI. When PANI incorporation was 10%, the values of Tc and heat release increased implying the inhibiting effect of large amount of PANI molecules which seem to be preventing the recombinations between free radicals.
The increase in the dissolution time from 2 days to 10 days and the application of ultrasonic homogenization process in the preparation of PANI solution resulted in increases in nanofiber diameter, breaking stress, and breaking elongation while decrease was observed in crystallinity. The conductivity was not very much affected by the changes in the dissolution time and preparation process.
Considering all the results obtained in this study, 3 wt% is the optimum content of PANI for the highest conductivity, while the ultrasonic homogenization results in better mechanical properties. With the conductivity value on the level of 10−6 S/cm, these composite nanofibers may be used in ESD applications.
In future, the effects of different types of dopants and solvents on the properties of PANI-incorporated PAN nanofibers will be investigated.
Footnotes
Declaration of Conflicting Interests
The author(s) declared no potential conflicts of interest with respect to the research, authorship, and/or publication of this article.
Funding
The author(s) disclosed receipt of the following financial support for the research, authorship, and/or publication of this article: We would like to thank to TUBITAK for supporting this study with Project (112M877).