
Abstract
Nowadays, there is a large demand for smart textiles by consumers. Smart textiles have different functions, and can provide comfort, safety and protection. In this study, electro-conductive woven cotton fabric is prepared in two steps. The cotton fabric samples are first impregnated and padded with a polyvinyl alcohol solution of 5% for multiple cycles (1, 3, 5 and 7 cycles) and dried. Then, silver nanoparticles are deposited onto the fabric through magnetron sputtering technology. The coated samples are examined using a Fourier transform infrared spectrometer, scanning electron microscope and X-ray diffractometer. The ultraviolet blocking, infrared reflection, electromagnetic shielding, and antibacterial properties are evaluated, as well as the contact angle, light transmittance and electrical conductivity. The results show that a polyvinyl alcohol film is successfully formed and the cotton fabric fibers are stuck together through hydrogen bonds. The light transmittance is increased after the polyvinyl alcohol pretreatment. After undergoing seven cycles of coating with polyvinyl alcohol, the silver nanoparticles-coated samples show large contact angle of 127.6°, excellent ultraviolet blocking property, a high infrared reflectivity of 30%, electrical resistivity of 1.46 × 10⁻⁶ Ω·m, electromagnetic interference shielding effectiveness of −20 dB and antibacterial efficacy of >99.5%. Compared to the untreated and silver-coated cotton without impregnation of polyvinyl alcohol, the silver nanoparticles–polyvinyl alcohol-coated cotton fabric sample has excellent performance, which makes it a promising textile with a multitude of protective properties.
Keywords
Introduction
Smart textiles have different functions, and can provide comfort, safety and protection, such as ultraviolet (UV) protection [1], water repellency [2], antibacterial properties [3], infrared (IR) shielding [4] and electromagnetic interference (EMI) shielding [5]. Nowadays, there is a large demand for smart textiles by consumers. The fabrication of smart textiles requires the modification of textiles to produce a highly functional surface, which would impart dramatic property changes. Therefore, the modification of textiles into smart textiles has attracted a large amount of interests.
However, investigations on textiles modification have mainly focused on the post-treatment process, because the performances of a fabric are mostly impacted by the different coatings. One of the more popular treatments that are being investigated is anti-UV finishing of fabrics. Staneva et al. [6] modified cotton fabric with ZnO nanoparticles for anti-UV; Emam and Bechtold [7] coated cotton fabric with metal salts to resist UV; Montazer and Seifollahzadeh [8] treated textiles with TiO2 nanoparticles for self-cleaning and UV protection. However, these methods could not provide the fabrics with EMI shielding and IR shielding properties.
Electronic devices, such as mobile phones and computers, emit electromagnetic waves that can damage the health of living organisms. However, conductive materials, such as metals and conductive polymers, can provide shielding protection from electromagnetic radiation. Bian et al. [9] deposited reduced graphene oxide and nickel particles onto the surface of carbon fiber textile to produce a strong EMI shielding fabric. Han deposited copper onto polyester fabric by using an electroless plated method so that the fabric would be able to have EMI shielding ability [10]. Das et al [11] blended stainless-steel filaments and polyester yarns together to impart conductivity and fabricate EMI shielding textiles. There are also researchers who coated textiles with conductive polymers, such as polypyrrole [12] and poly (3-hexylthiophene) [13]. Nevertheless, these methods also have disadvantages, such as high weight gain, high costs or the inability of mass production, which limit further applications.
In addition, textile-based IR shielding materials have also been fabricated. Miao et al. [14–16] modified textiles with metal and ceramic materials such as silver (Ag), titanium, copper and aluminum-doped zinc oxide (AZO) through magnetron sputtering technology, and obtained fabrics with a high level of IR reflection rate. They also found that fabrics deposited with metal and conductive ceramics deposited onto fabric can provide excellent UV protection. However, the textiles coated with metals are still non-conductive [2] due to their unique fabric structure which leads to a discontinuous metal film on the surface.
Therefore, these issues have prompted researchers to find more effective methods to solve the problems. Polyvinyl alcohol (PVA) has been widely used due to its excellent properties, such as a polyhydroxy structure, easy formation of film and non-toxicity [17–19]. Cotton fabric is the most important natural fiber and is commonly used in textiles; moreover, cotton also possesses a polyhydroxy structure which may be well combined with PVA through hydrogen bond. Therefore, cotton fabric was selected as basic material in current study. On the other hand, Ag is a natural metal with good antibacterial, excellent conductivity and non-toxic properties. And Ag nanoparticles (Nps) are widely used in textiles modification as it can provide high levels of IR reflectivity, anti-UV and antibacterial properties [4,14,20].
In this study, cotton fabrics are first pretreated with PVA by using the padding method, and then coated with Ag Nps through magnetron sputtering. The Fourier transform infrared (FTIR) structure, surface morphology, crystal structure and light transmittance are investigated. In addition, the IR reflection, UV blocking, electrical conductivity, EMI shielding and antibacterial properties are also evaluated.
Experimental
Fabrication of samples
Plain woven cotton fabric samples (133 × 72 counts per square inch, 40 D × 40 D) were first cleaned in an ultrasonic bath with acetone, ethanol and deionized water, successively. The samples were pretreated with PVA by using the padding method, and then magnetron sputtering was carried out which deposited Ag Nps onto the samples. As shown in Figure 1, the cotton fabric samples are first immersed into a PVA (degree of hydrolysis: 99%, polymerization degree: 1700, Beijing Chemical Co., Ltd.) solution of 5% for 60 s with a material-to-liquor ratio of 1:50. The samples were subsequently padded with a pressure of 1 kg/m2 by using a laboratory dyeing padder (Model: 504, Fanyuan Instrument Co, Ltd) at room temperature, followed by a drying process at 50℃. This constituted as one pretreatment cycle. The samples were pretreated by using this process for 1, 3, 5 and 7 cycles and labeled as PC-1, PC-3, PC-5 and PC-7, respectively.
Schematic of PVA coating and silver sputtering process. PVA: polyvinyl alcohol.
After pretreatment with PVA, the samples were coated with Ag (99.99% purity) at a thickness of 200 nm by using a magnetron sputtering system (ZZG/JT-350; AOYI) equipped with an online film-thickness controller at room temperature. The coated samples were labeled as Ag-PC-1, Ag-PC-3, Ag-PC-5 and Ag-PC-7, respectively. Ag-coated cotton fabric without pretreatment of PVA, labeled as Ag-cotton, was also prepared for comparison. The deposition process was conducted under a base pressure of 5 × 10⁻⁴ Pa, working pressure of 0.25 Pa, argon (Ar) gas flow rate of 100 sccm and a target-substrate distance of 10 cm.
Characterization
The FTIR spectra of the samples were recorded by using an FTIR spectrometer (Perkin Elmer Spectrum 100) with a resolution of 2 cm–1 and a spectral range of 4000–400 cm–1.
The surface morphology of the untreated and coated samples was observed by field emission scanning electron microscope (FE SEM; JEOL-6335 F).
The crystal structure of the untreated and coated samples was examined through an X-ray diffractometer (XRD, Rigaku SmartLab). The XRD used Cu Ka radiation with a wavelength of 0.154 nm, at 45 kV and 200 mA. The spectra were recorded at diffraction angles that ranged from 30° to 80°, with a scanning speed of 5°/min.
The contact angle (CA) was determined by using a CA meter (model CAM-Moric; Tantec Inc.). Specimens (2.0 cm × 2.0 cm) were taken from the samples and placed onto the observation platform. A water drop of 5 µL was placed on the sample and the CA was measured manually by manipulating the protractor on the CA meter. The measurements were taken on the side of the water droplet 1 min after its placement. The results were assessed by conducting measurements on five different areas of five different fabric samples.
The light transmittance was measured to determine the change in porosity of the fabric samples before and after the treatment by using a spectrophotometer (UH5300, Hitachi) over a wavelength that ranged from 390 to 780 nm.
The electrical resistivity was measured by using a four-point probe resistivity measurement system (ST-2258 A).
The UV transmittance of the samples was recorded in accordance with the British Standard BS EN 13758-1:2002-10-01 by using a UV–visible spectrophotometer (Varian, Cary 300 Conc) over a wavelength from 280 to 400 nm.
The IR reflectivity of the samples was investigated with a Perkin Elmer Spectrum 100 spectrophotometer over a spectral range of 1.0–22 µm. The IR images were recorded with an FLIR-E33 thermal IR imaging device.
The electromagnetic interference shielding effectiveness (EMI SE) of the samples was evaluated at room temperature at a frequency range of 300 KHz ∼ 1.8 GHz (X band range) by using a vector network analyzer (Agilent E5063A ENA).
Resistance to bacteria was measured in accordance with AATCC 100-2002. The gram bacterium used was Staphylococcus aureus (S aureus), ATCC No. 6538; and the gram-negative bacterium used was Klebsiella pneumoniae (Kp), ATCC No. 4352. The samples were immersed into different bacteria suspensions for 12 h and then examined under the field emission SEM (JEOL-6335 F) to determine the adhesion and viability of the bacteria. The preparation process for viewing the samples under the SEM is as follows: the samples were first washed with a phosphate buffer saline (PBS), and then 3% vol. glutaraldehyde was added into the PBS and stored at 4 ℃ for 2 h for bacteria fixation. The samples were then taken out of the glutaraldehyde solution and rinsed with PBS. The bacterial dehydration process was conducted by successively immersing the samples into 25%, 50%, 70%, 95% and 100% ethanol for 10 min, respectively. Then the samples were dried under vacuum and used for SEM observation.
Results and discussion
Impregnation of cotton fabric with PVA
The cotton fabric was impregnated with PVA and the impregnation process is shown in Figure 2. Cotton ([C6H10O5] n) has polysaccharide compounds with a large number of free hydroxyl groups, while it is commonly known that PVA ([C2H4O]n) has a polyhydroxy structure. Therefore, these provide the opportunity for the formation of hydrogen bonds between the cotton fibers and PVA, which means that the cotton fibers could be stuck together during the impregnation process. Moreover, hydrogen bonds can also form among the PVA molecules, thus leading to the formation of a thin PVA film on the surface of the cotton fibers. In addition, the padding process provides the force which causes the cotton fibers to stick to each other more tightly.
Impregnation of cotton fabric with PVA. PVA: polyvinyl alcohol.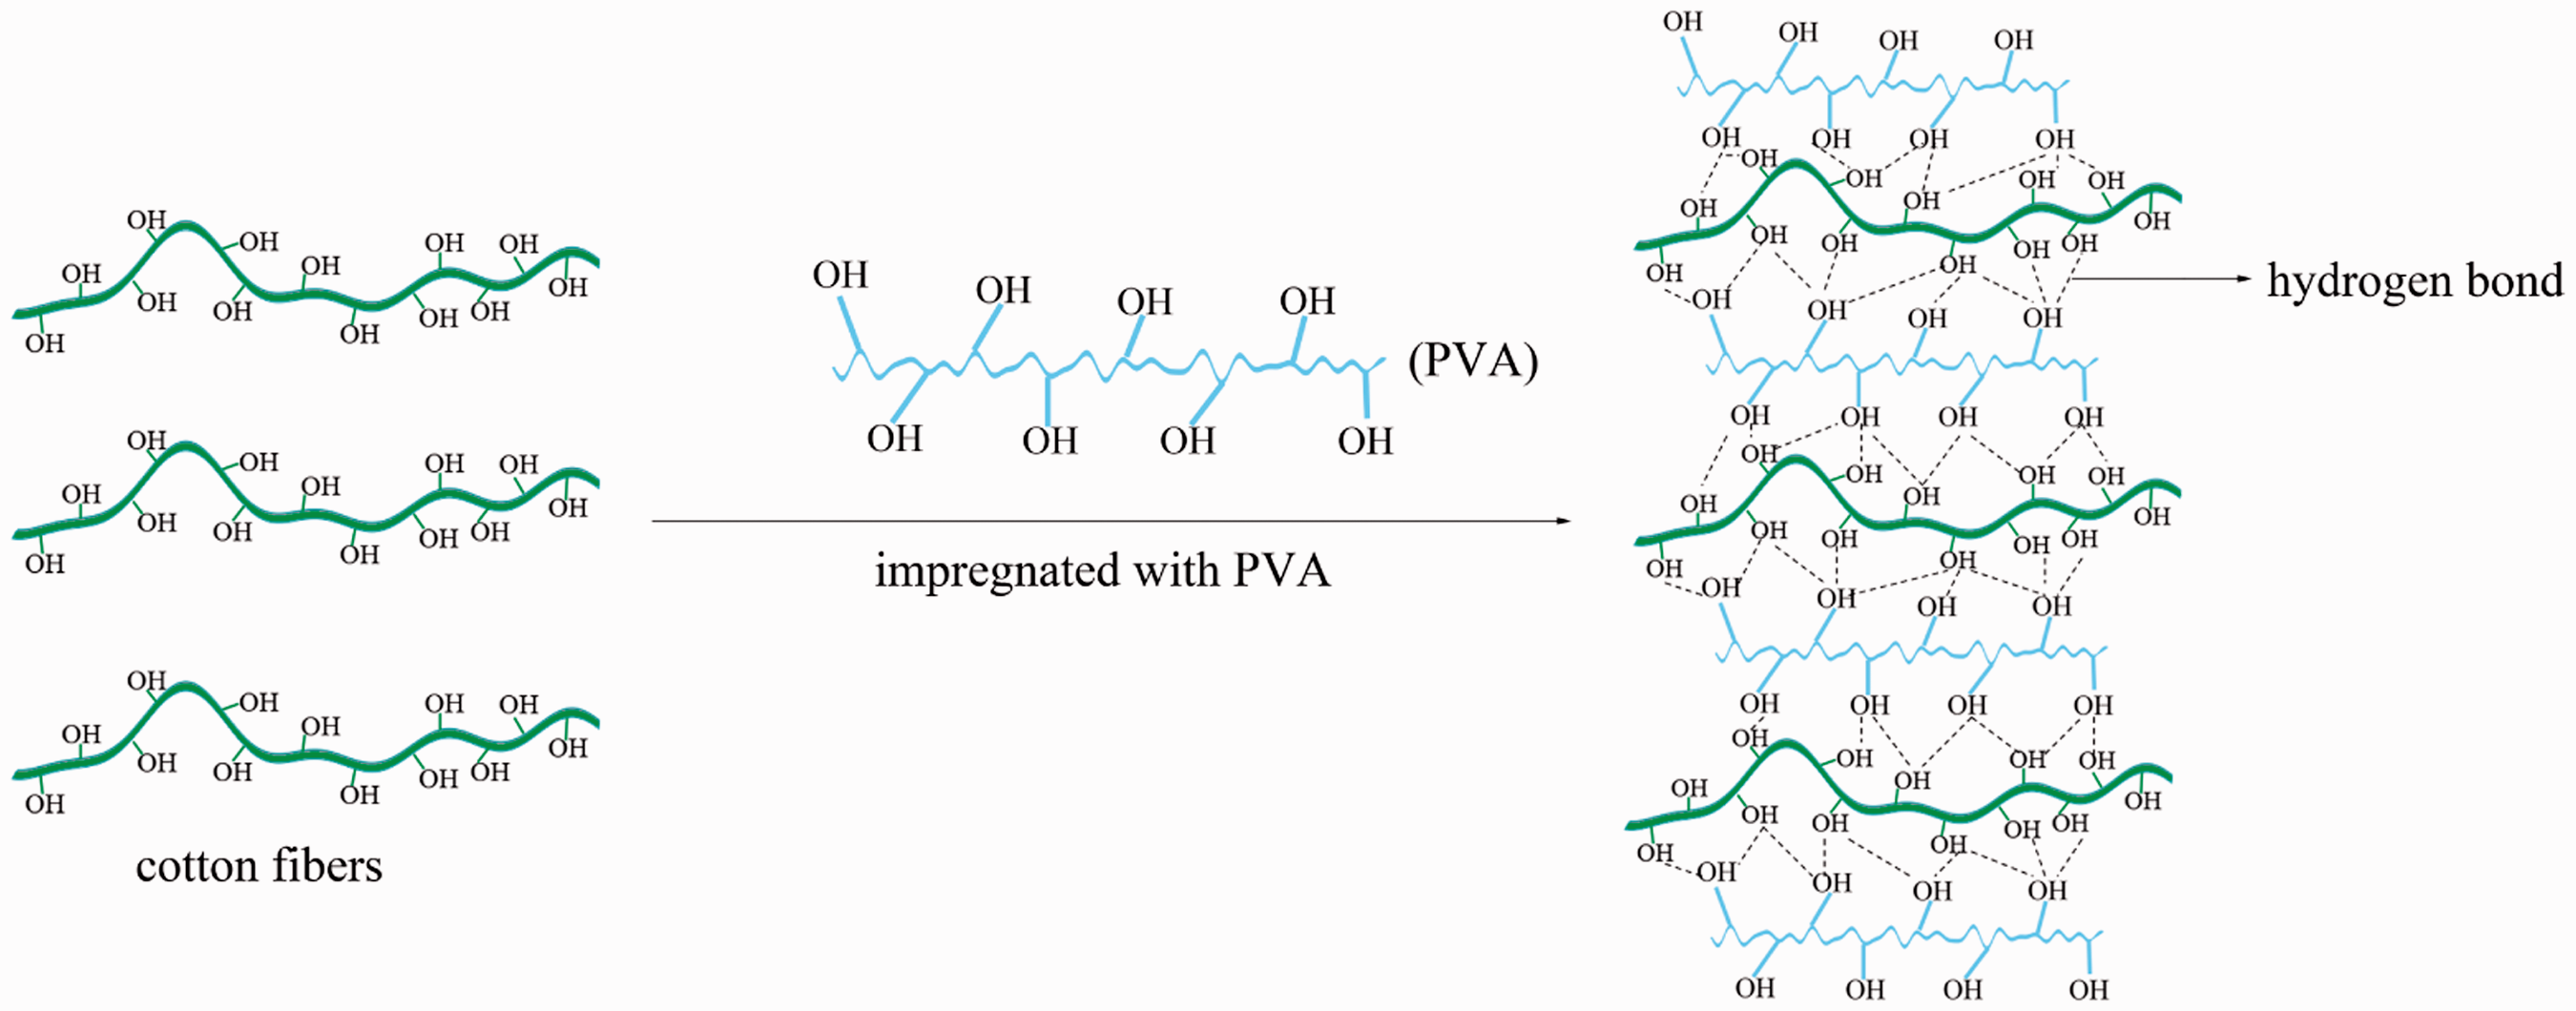
It is reported that the formation of hydrogen bonds can lead to the increase of intensity of the stretching vibration peak of hydroxyl radicals [21] in the FTIR spectrum. Therefore, the FTIR spectrum of PVA (Figure 3aa), untreated (Figure 3ab) and treated (Figure 3ac–f) cotton samples are recorded and presented in Figure 3a.
FTIR spectrum (a): a: PVA; b: untreated cotton; c: PC-1; d: PC-3; e: PC-5; f: PC-7; and peak height of the stretching vibration peak of hydroxyl radical and weight gain of samples (b). FTIR: Fourier transform infrared; PVA: polyvinyl alcohol.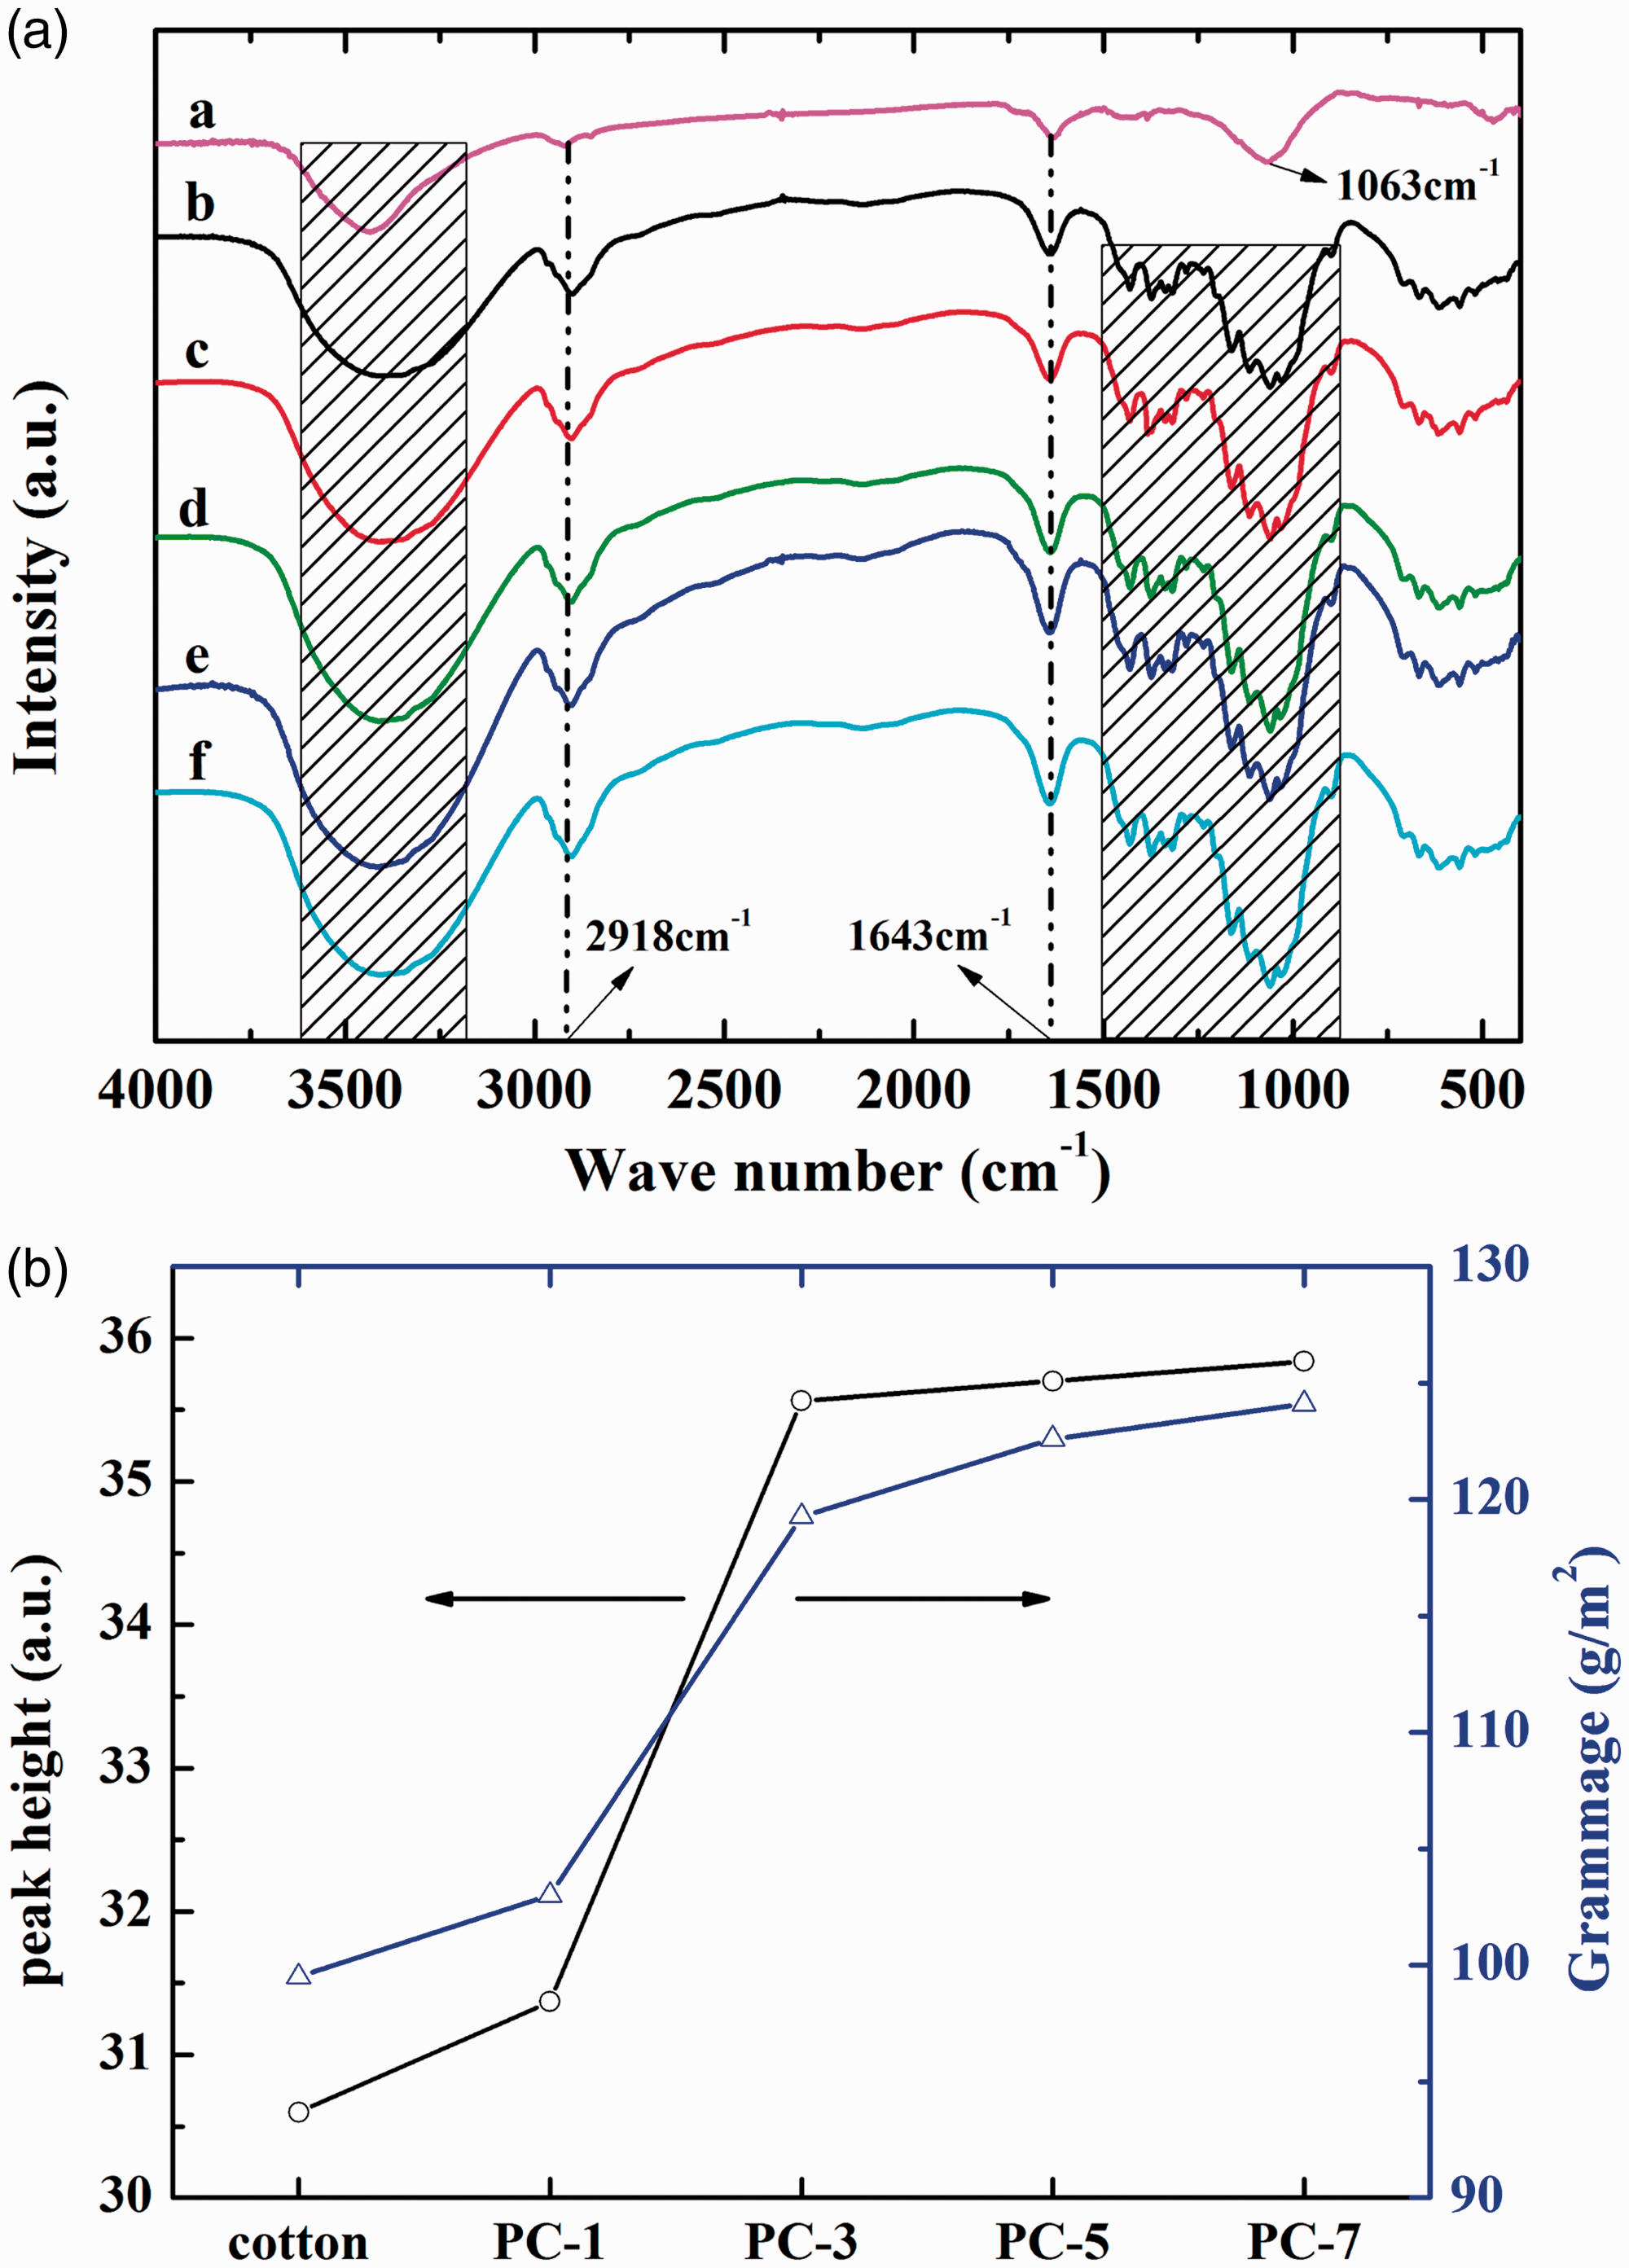
As shown, all of the spectra show a large band in the range of 3600–3200 cm–1, which is mainly caused by the stretching vibration of the –OH groups in the PVA and cotton. The band at 2918 cm–1 is attributed to the asymmetric stretching vibration of methylene (–CH2–).
The absorption band at 1643 cm–1 is due to the carbonyl stretching vibration. For PVA, the band at 1063 cm–1 is the result of the stretching vibration of carbon-carbon bonds (–C–C–). For the treated and untreated cotton samples, the peaks at 1500–850 cm–1 are typical characteristics of cotton, as reported by other researchers [22,23]. Moreover, there are no new characteristic peaks, thus indicating that the cotton fabric and PVA are physically combined.
Furthermore, the relative height of the peaks in the range of 3600–3200 cm–1 is calculated and shown in Figure 3b. Nevertheless, there is weight gain of the impregnated samples, which indicates that the amount of PVA could have also affected the result. Therefore, the weight gain is also presented in Figure 3. It is obvious that the height of the peak increases with more impregnation cycles, as well as the weight gain of the samples. However, the height of the peak slightly increases after three cycles, while the weight still increases at a large D-value. This shows that the PVA is combined with cotton fabric through hydrogen bonds; and the amount of hydrogen bond among cotton fabric and PVA is nearly saturated after three cycles, thus indicating that the cotton fibers may be fully covered with PVA molecules. Therefore, the result validates the hypothesis.
Surface morphology
SEM images of the untreated and PVA-coated cotton samples are shown in Figure 4. As shown in Figure 4a0 and b0, the untreated cotton fibers are characterized by a very smooth surface and slight ridges, which show the fibril structure of the cotton fibers. Moreover, it also can be observed that the surface of the untreated fabric samples is free of polymer or metal particles and the fibers are separated from each other. The morphology of the cotton fabric samples and that after 1, 3, 5 and 7 circles of coating with PVA are shown in Figure 4a1, a2, a3 and A4 as well as Figure 4b1, B2, B3 and B4, respectively. As evident, the coated fabric samples show variations in their morphology, which is related to the PVA coating process. It is obvious that the fibers stick to each other due to the PVA, as marked with arrows. With the increase of PVA coating cycles, the contact between fibers becomes more compact. PVA is a film-forming polymer as mentioned in the introduction. In Figure 4b4, the fibers are closely stuck together and a PVA film can be easily observed on the bottom of the warp or weft yarns. The SEM images show that the fibers are well connected to each other due to the PVA film.
SEM images of samples. SEM: scanning electron microscope.
The SEM images of Ag-coated samples are shown in Figure 4. For the sample of Ag-cotton, the cotton fibers are still separated, as shown in Figure 4a0, while cotton fibers are covered by PVA film after coating process for the samples impregnated with PVA shown in Figure 4a1, a2, a3 and a4, which provides the condition for the formation of continuous Ag film. However, the Ag Nps can be easily observed under high magnification. The Ag Nps grow tightly and cover the fabric surface. In addition, agglomerate Ag particles can be easily seen. For the sample of Ag-cotton, the fibril structure can still be observed except the Ag particles; and the surface roughness of the samples has increased with increased number of PVA coating cycles. This may be due to the influence of the different thicknesses of the PVA film.
Crystal structure
The XRD patterns of the untreated cotton, PVA-coated cotton, Ag-cotton, Ag-PC-1, Ag-PC-3, Ag-PC-5 and Ag-PC-7 samples are shown in Figure 5.
XRD spectrum of untreated and coated samples. (a: cotton; b: PVA/cotton; c: Ag-cotton; d: Ag-PC-1; e: Ag-PC-3; f: Ag-PC-5 and g: Ag-PC-7). XRD: X-ray diffractometer; PVA: polyvinyl alcohol; Ag: silver.
It can be seen that the diffraction peaks of the cotton sample before and after treatment are (101), (10
Contact angle analysis
The CA was measured to evaluate the property of water repellency. Cotton fabric is an intrinsically hydrophilic fabric and PVA is also a hydrophilic polymer with many hydroxyl groups. Therefore, the CA of the untreated cotton and PVA-coated cotton fabric samples is 0°. And the CA of Ag-cotton, Ag-PC-1, Ag-PC-3, Ag-PC-5 and Ag-PC-7 is 122°, 120°, 125.6°, 126.2° and 127.6°, respectively, as illustrated in Figure 6.
Images of contact angle of samples.
The CA of Ag-cotton is a little bit higher than that of Ag-PC-1; and the CA of the coated samples is slightly improved with increases in the number of PVA coating cycles. This may be due to the surface roughness. According to the Cassie theory [20], the air trapped in the spaces of a film coating with a rough surface and water droplet can significantly enhance the hydrophobicity, therefore, increasing the CA. The following is Cassie’s equation

For the same material, θ is the same, therefore, θ* is determined by the percentage of the surface in which the liquid droplet is in contact with the solid. Moreover, a rougher surface means a larger f value, thus indicating a larger CA. As observed in the SEM images, the surface increases in roughness with more PVA coating cycles, and, therefore, the CA is larger.
Light transmittance analysis
The relative light transmittance of the coated samples was measured to evaluate the porosity among the weft and warp yarns. The untreated cotton fabric sample was selected as the reference sample. The light transmittance signal of the untreated cotton samples was regarded as 100%; therefore, transmittance over 100% means that the porosity of the sample increased after treatment. When transmittance is under 100%, this means that the porosity of the sample decreased after treatment. Figure 7(A) shows the relative light transmittance of the Ag-coated samples. The light transmittance rate of Ag-coated cotton fabric is lower than 100%, this may be caused by that the deposited Ag particles on the surface and among the fibers block the light leading to the decrease of the light transmittance. And it is obvious that the transmittance is increased for all samples with increasing in cycles of PVA coating, thus showing that the porosity of the fabric has increased. This is because the PVA coating process allows the original loose fibers to stick together more tightly as shown in Figure 4, and therefore enhances the porosity of the fabric.
Relative light transmittance of PVA-coated samples (a); Electrical conductivity of Ag-coated samples (b); UV transmittance of untreated cotton and treated cotton samples (c); Infrared reflection spectrum of prepared samples (d) and EMI shielding effectiveness of prepared samples (E). PVA: Polyvinyl alcohol; Ag: silver; UV: ultraviolet; EMI: electromagnetic interference.
Electrical conductivity analysis
The electrical conductivity of the coated samples is shown in Figure 7(B); however, the conductivity of untreated cotton, PC-1, PC-3, PC-5, PC-7 and Ag-cotton is out of the range of current measurement equipment, therefore, they are considered as a non-conductive fabric. As described in the morphology analysis, the cotton fibers are stuck together by the PVA film; therefore, this provides a continuous surface for the growth of a conductive Ag film. As shown in the figure, the resistivity of the Ag-coated samples decreases as the number of PVA coating cycle increases. This is because a PVA film is formed with multiple cycles of PVA padding, thus increasing the continuity of the Ag film, and therefore improving the conductivity. Moreover, as analyzed in the crystal structure, the crystallization of Ag film was improved with the increasing cycle of PVA coating. This can also explain the improving conductivity, because excellent crystallinity means less crystal defects, further proving the improvement of conductivity [26].
Shielding properties
UV blocking analysis
Irritated to the skin by UV rays could result in severe skin diseases, such as aging, allergies, sunburns and skin cancer [7]. Therefore, the UV transmittance of a fabric is a significant factor for determining whether it has UV-protective properties.
The UV transmittance of the untreated and treated cotton samples is shown in Figure 7(C). The UV transmittance of all of the PVA-modified samples is higher than that of the untreated cotton fabric, which may be due to the greater porosity caused by the PVA-coating process. Nevertheless, the UV transmittance of the AgNps-PVA-coated cotton fabric samples is less than 8% at a wavelength that ranges from 280 to 380 nm, which is lower than that of the untreated cotton fabric, and caused by the Ag particles that reflect and scatter UV rays.
Infrared reflective analysis
The IR reflective properties of the samples are shown in Figure 7(D). The IR reflectivity of both the untreated cotton fabric and PVA-coated samples is poor. After the samples underwent multiple cycles of PVA coating, the reflectivity decreased slightly, which was caused by the larger interspaces between the warp and weft yarns. It is reported that IR reflection is caused by the interactions between the infrared electromagnetic waves and free electrons [27]. Therefore, the reflectivity largely increases with the deposition of Ag particles, compared to the untreated sample.
Furthermore, it is obvious that the AgNps-PVA-coated samples have a higher IR reflectivity of 30%–40%, compared to Ag-coated cotton fabric without impregnated with PVA, which has an IR reflection rate of about 25%. And the different number of PVA coating cycles presents different percentages of IR reflectivity. However, for the same thickness of Ag film, the amount of free electrons of the different samples is similar. Therefore, the main reason that has led up to this result may be the variation in porosity as mentioned in the light transmittance analysis.
EMI shielding analysis
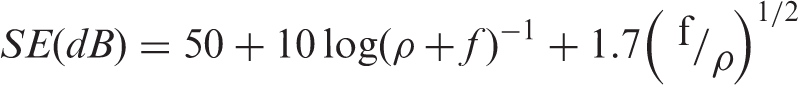
Figure 7(E) shows the frequency dependence of the EMI SE of the untreated cotton fabric, PVA-coated and Ag-coated samples. According to the Schelkunoff theory [28], the EMI SE is relative to the resistivity R of samples
As for the AgNps-PVA–coated cotton fabric sample, a bandwidth that corresponds to EMI SE values below –6 dB is obtained. Thus, it means that the Ag film could be considered as a filler for improving the EMI shielding effect. The Ag film deposited onto the PVA-modified cotton fabric samples has a large number of free electrons, which can interact with the EM field during EM radiation in order to enhance the EMI shielding effect [29]. Therefore, the coated cotton fabric samples obviously show an enhanced EMI shielding effect and the EMI SE is well improved with more PVA-coating cycles, after the Ag film is formed on the modified fabrics. Also, the EMI SE values increase with more PVA-coating cycles. This can be explained by the formula mentioned above; as shown in Figure 7(B), the electrical conductivity is reduced; under the same frequency, the SE is inversely proportional to the resistivity, and, therefore, the EMI SE is increased. Moreover, the maximum EMI SE value is less than –20 dB when Ag particles are deposited onto the cotton fabric sample after seven cycles of PVA padding. Thus, it can be concluded that PVA can modify the structure of woven fabrics to form a continuous Ag film for increased EMI shielding. Moreover, the method in this study, which combines pretreatment with PVA through the padding method, along with magnetron sputtering, is a promising means of fabricating EMI shielding textiles.
Antibacterial analysis
Antibacterial effect of untreated cotton, PVA/cotton and Ag-PC-7.

PVA: polyvinyl alcohol; Ag: silver.

Bacterial quantity under microscope: (A) S aureus and (B) Kp; SEM images of untreated cotton (a and d); PVA/cotton (b and e); Ag-PC-7 (c and f) after immersion in PBS suspension of S aureus at 2 × 10⁵ cells/mL for 12 h (a, b and c) and Kp at 1.5 × 10⁵ cells/mL for 12 h (e, d and f). S aureus: Staphylococcus aureus; Kp: Klebsiella pneumoniae; PBS: phosphate buffer saline; PVA: polyvinyl alcohol; Ag: silver.
For the Ag-coated fabric samples, there is a sharp reduction in the number of viable cells in the Kp suspensions, which indicates that they have high antibacterial efficacy for Kp with a reduction rate of 99.5% after 24 h. In comparison, the antibacterial efficacy for S aureus is 99.93% after 24 h, which is even higher than that for Kp. The mechanism behind the antibacterial activity of Ag Nps is only partially understood. There are two proposed mechanisms as follows: (1) the high affinity of Ag ions to sulfur or phosphor contributes to both the release of Ag+ from the Ag Nps and sulfur-containing proteins, therefore, disrupting the integrity of the cytoplasmic membrane and causing the death of the bacteria [30] and (2) the Ag ions catalyze the production of oxygen radicals that oxidizes the molecular structure of the bacteria and thus causing the death of the cell [31]. In these two mechanisms, the Ag ions first come into contact with or penetrate the bacteria, and then destroy the normal structure of the bacteria. Gram-negative bacteria, which have a multilayered envelope structure, are more resistant to the penetration of Ag+ [32]. Therefore, the difference in antibacterial efficacy is hypothesized as owing to the different cell membrane structures of Kp and S aureus.
Figure 8 shows the SEM images of different samples after immersion into bacteria suspensions for 12 h. The images shown in Figure 8(a), (b) and (c) are samples immersed into the S aureus suspensions. As shown in Figure 8(a) and (b), a large number of S aureus cells can be observed on the untreated and PVA-coated cotton samples. The number of the bacteria cells on the latter is significantly more than that on the former, which shows that the dipping treatment with PVA may contribute to the growth of bacteria. However, for the Ag-coated sample shown in Figure 8(c), no S aureus cells can be found. This shows that the Ag-coated samples provide excellent resistance to S aureus.
Figure 8(d), (e) and (f) shows the images of samples immersed into Kp suspensions. The untreated, PVA-coated and Ag-coated cotton samples are covered with cylindrical Kp cells. This can be explained by the analysis above in that Ag ions are less resistant to negative bacteria compared to the positive bacteria, because the negative bacteria used in the experiment has a multilayered envelope structure while the positive one only has one [33]. All in all, the analysis concludes that the Ag-coated sample can provide an excellent antibacterial effect.
Conclusion
Woven cotton fabric samples first undergo multiple cycles of impregnation of PVA through the padding process, and then coated with Ag particles through magnetron sputtering. The results indicate that PVA can stick cotton fibers together tightly by forming a continuous film. The AgNps-PVA–coated cotton fabric samples have an excellent resistivity of 1.46 × 10⁻⁶ Ω·m and EMI SE of –20 dB. They are also able to block UV rays, have an IR reflectivity of 30%, a large CA of 127.6° and an excellent antibacterial efficacy of >99.5%, when coated seven times with PVA. The Ag Nps samples after undergoing 1, 3 and 5 cycles of PVA also show an excellent and favorable performance, hence they can contribute to fabricating multifunctional textiles.
Footnotes
Declaration of conflicting interests
The author(s) declared no potential conflicts of interest with respect to the research, authorship, and/or publication of this article.
Funding
The author(s) received no financial support for the research, authorship, and/or publication of this article.