
Abstract
Over the years, researchers have made significant strides to incorporate the conductive materials into textile structures to develop the flexible and electrically conductive fabrics. However, the development of highly stretchable and durable electrothermal conductive fabrics remains a significant challenge. In present research, we introduced a simple and novel approach for the deposition of two types of carbon-based electrothermal conductive materials (carbon nanotubes CNTs and carbon nanoparticles CNPs) over the stretchable knitted fabric structure using solution dip-dry method. The electrical resistivities (surface and volume) as a function of different pH range (2.5 to 6.5) at different number of dipping cycles (1–4) were characterized. The pH 6.5 proved to be best for dispersion and maximum attachment of CNTs and CNPs on the surface of fabrics, showing lowest volume resistivity about 85 Ω·mm CNTs and 212 Ω·mm for CNPs coated fabrics. Secondly, the comparison between volume and surface resistivities at normal condition and at different stretching percentage of fabric was also analysed, where, negligible increase in electrical resistivity values was observed up to 70% stretch. Furthermore, the effect of the applied pH range was justified by Polydispersity Index (PDI), Zeta potential, particle size analysis and Dynamic Light Scattering (DLS). The coated fabrics were assessed for their morphology and geometric characteristics by Scanning Electron Microscopy (SEM), and optical microscopy (OM). The effectiveness of developed electrothermal conductive substrates for electromagnetic shielding was analysed over a frequency range of 30 MHz to 1.5 GHz. The sample produced at higher pH and maximum number of dips exhibited the maximum shielding ability against CNTs and CNPs coated fabric was about 16 dB and 13.5 dB, respectively. Additionally, the thermal properties were also assessed. The fabrics exhibited Ohmic heating range 30°C to 130°C at 10 V in 60 min. Moreover, the noted thermal conductivities were about 1.6 W/mK for CNTs coated fabric and 0.7 W/mK for CNPs coated textile.
Keywords
Introduction
Smart textiles are the key component of conductive fabrics, which deals with structures offer different types of behaviour and functionality. 1 Their potential applications include sensing, respond (concept of bio mimicry to replicate life systems), microelectronics and conducting electricity.2,3 E-smart fabric sensors can be used in biomedical and safe research.4,5 Fabrics coated with carbon electrodes can be utilize to detect various types of biomedical or environmental factors such as contaminants, salinity, oxygen and humidity level. 6 Additionally, the thermoelectric conductive textiles find application in domestic purpose,7,8 wearables integrated with communication technology and in interactive clubwears (which responds to music beats). 9 Instead of this, the conductive fabric sensors can be used in sports wear to monitor arm movements of player in multiple supports such as in cricket, tennis, boxing, basketball and hand ball etc. .10 In order to impart the electrical conductivity in fabrics various techniques can employed, including coating of conductive (metal based or carbon based) materials, surface metallization,5,11 impregnation with conductive polymers or producing the fabric by the interlacement of thin metallic yarns etc. 12 Jin et al. developed electrically conductive metal coated silk fibers. Where the surface of silk fibers were firstly sensitized and impregnated with silver salt then the silver ammonia solution was reduced by glucose to synthesize nano-silver to perform in situ deposition on the silk fabrics. Eventually, the fabricated textiles exhibited volume resistivity about 0.24 mΩ·cm (very close to present research). 13 Another technique is the blending of conductive material with textile fibers during spinning or weaving. Such as, Ying Lu et al. fabricated conductive textiles by using different blend ratio of silver nanowires during wet spinning of cotton based cellulosic yarns. They were able to achieve the 5670 S/cm of electrical conductivity at higher concentration of silver nanowire about 29.1 wt%. 14 Kyung et al. 15 fabricated the electrically conductive knitted textile (nylon-spandex) structures by in situ deposition of polypyrrole. The developed samples showed excellent electrical conductivity even under multiple stretch and recovery cycles. The conductive fabrics produced by impregnation with conductive polymers (polypyrrole, polyaniline, polytiophene), can produce a highly flexible and stretchable structures,16,17 however, the wash ability of these type of conductive polymers is very poor. 17 Although textiles coated with electrically conductive polymers showed higher flexibility and comfort properties but their electrical properties remained limited. 18 Additionally, the electrical conductivity of these polymers is influenced by their doping level (concentrating of conductive particles in solution), which changes drastically after washing. 19 As a result, their applications in smart sensing systems such as in conductive circuits, remains limited. Additionally, these polymers also showed low mechanical properties, which are more important for e-textile applications.20,21 This challenge can be addressed by the use of carbon-based fillers, which led substantial improvements in both mechanical and electronic properties. Moreover, some carbon fillers such as carbon nanotubes offers exceptional electrical conductivity, reaching up to 106 S/cm.21,22 Another approach is the use of electrically conductive ink, which is normally applied through screen printing process. However, the printing technique only performed a thin coating over the surface of textile, which makes it susceptible to cracking and adhesion issues. 23 Also, the conductive ink coated textiles showed poor washing and rubbing fastness. The same challenge is also associated with nanoparticles, in terms of their fixation and uniform distribution over the fabric structure. Additionally, they are prone to rubbing and washing durability. In some studies, metallic wires have been reported to use in conductive textiles. A study is available on the development of conductive yarn, by wrapping the metallic copper filament around the silk thread. 24 The interlacement of metallic wires (metal flakes and metal strands) along with synthetic filaments through co-weaving process, is an efficient method to achieve the conductivity. 23 Metal wires typically limit the flexibility and comfort for textiles. Additionally, creating a complex circuit using conductive yarns through weaving or knitting methods is not practical. Haisong et al. reported a novel technique for coating of multi-walled carbon nanotube (MWCNT) over the cotton fabric by using dip drying technique. 25 The MWCNT-coated cellulose fibers exhibited low electrical properties. In addition, the fabrics were used as sensor to detect the volatile compounds such as methanol, ethanol, acetone, chloroform and tetrahydrofuran. The findings demonstrated high sensitivity, and active response for detecting these chemical vapours. In another study, Negru et al. integrated the carbon black particles over the surface of cotton yarn. 26 CNT-coated textiles have demonstrated superior thermal conductivity (up to 2.9 W/m·K) and heating stability under repeated mechanical deformation. 27 With increasing focus on multifunctionality, studies now incorporate antimicrobial agents, UV shielding additives, or triboelectric nanogenerators into CNT-based systems to create all-in-one smart textiles. 28 Their electrical resistivities remained limited to kilo ohms and the samples exhibited limited durability. Previous research achieved optimal electrical conductivity but did not address thermal properties in conjunction with electrical performance. Therefore, integrating carbon nanotubes and carbon particles into stretchable textiles presents a promising solution to overcome the above mention research problems due to their unique properties like high electrical conductivity,21,22 excellent mechanical and thermal properties. 29 In present study, carbon-based particles (carbon nanotubes, carbon black) were homogeneously incorporated into knitted fabric structure (by solution metod). At different dipping cycles, varied pH and a range of temperature the particles were attached by a combination of physical, thermal and chemical bindings. As above 170°C, a fraction of nylon crystals begins to degrade and recrystallize. At this temperature, the chain transitions into nylon structure starts to occur from a glassy to a rubbery state, increasing its adaptability to CNT incorporation. 30 This study uniquely evaluates electrical resistivity behaviour during progressive stretching (up to 100%), showing stable performance up to 70%. Secondly, correlating the behaviour of electrical conductivity with EMI shielding, thermal conductivity and Ohmic heating addresses a critical knowledge gap. Moreover, the fabricated electrically conductive textiles exhibit excellent flexible and stretchable properties ensuring the demand of comfort. Additionally, the substrates are fully impregnated with conductive particles throughout the thickness, hence enabling volume conductivity. These fabrics also demonstrate high washing fastness and maintain structural integrity without developing cracks under stretching. Consequently, the objectives were (1) Structural modification of nylon knitted fabric for the attachment and bonding of carbon-based fillers, (2) Refining the conductive fillers by milling process and characterizing, (3) Study the effect of pH (in acidic range) and curing temperature over the concentration and fixing of conductive materials over the fabric, (4) Investigate the electrical and thermal properties under multiple stretching and recovery conditions and , (5) Analysing the durability under various mechanical and physical actions.
Materials and methods
Materials
The present research work utilized nylon–spandex stretchable fabrics with the composition of 85% nylon and 15% of spandex, with a denier (linear density) of 140. The structural parameters of fabric contained 184 warp threads and 256 weft insertions per 25 cm2; with twill weave pattern. The fabric was purchased from Taewoo Fabrics industry. The conductive component (1) Recycled carbon particles, (branded as Carbiso mil), with a particle size of 100 µm were purchased from Easy composites in the UK. The conductive component (2) Carbon nanotubes (having purity of 70%) were purchased from Nanocyl S. A. in Belgium. Acetic acid (>99%) was obtained from a Sigma-Aldrich. While, the dye direct orange three identified by Colour Index 40215, was obtained from Kemtex Education Supplies in the UK. The chemical structures of both the nylon fabric and the Direct Orange 39 dye are depicted in Figure 1 for further reference. Molecular structures of (a) Nylon and (b) direct orange 39.
Methods
The methodology involves the washing of fabric with an aqueous solution of scouring agent for 45 min at 50°C to remove waxes and oils used in the spinning and weaving process. Then the fabrics were completely rinsed and dried before use. Subsequently, the Surface of Nylon fabric was modified, the solutions of (Carbon nanotubes and Carbon particles) were made and conductive fabrics were made from these solutions.
Surface modification of nylon fabric
Nylon 6/Spandex knitted fabrics samples were treated first with an alkaline solution of sodium hydroxide. 31 The solution of 1 g/L CTAB and 5 g/L NaOH with 1:40 material to liquor ratio at 60°C for 1h was used. After that, the fabric was washed with distilled water continuously and then drying was done at 50°C. Following that in order to oxidize the polyamide chains, fabric was subjected to oxidization with potassium permanganate. In actuality, permanganate (MnO4-) is capable of oxidizing organic compounds as well as inorganic compounds under all favourable conditions like acidic, basic or neutral in any medium either aqueous or non-aqueous. However, acidic conditions are seen to be more preferred than basic conditions when employed in bleaching.32,33 Subsequently, the fabric was treated in ultrasound bath to assist the oxidation for saving processing and energy consumption. In general, the oxidation of polyamide chains primarily involves three key reactions, resulting in the formation of imide and carbonyl functional groups. 34 The resulting functional groups will serve as active sites for the attachment of carbon-based materials.
Preparation and characterization of carbon particles
Recycled carbon particles, (branded as Carbiso mil), with a particle size of 100 µm were purchased from Easy composites in the UK. The dimensions of micro particles were further refined to the micro/nano scale utilizing ball milling techniques, described already in previous experimental research.35,36 The process of dry pulverization was employed by using high energy planetary ball milling of Fritsch pulverisette 7, Germany. The sintered corundum container with 80 ml of capacity, along with zirconium balls measuring 10 mm in diameter, was selected for a duration of 30 min of dry milling. The adjusted ratio between balls to material ratio (BMR) was kept around 10:1, while the rotation speed was kept at 850 rpm. Subsequently, the micro/nano sized particles were analysed under scanning electron microscope and their size distribution was also studied.
Preparation of CNT and carbon particles solution
At first, dye solution was prepared by dissolving 0.10 g of reactive dye in 1 L of distilled water. Subsequently, 5 g of CNTs were added and stirred vigorously, this was termed as solution 1. The mixture was sonicated in (BANDLIN, SONOPULS) sonicator for 1 h. After each 1 h, beaker was taken out to check the conductivity of solution then put back after increasing the pH. The procedure was repeated until constant values of conductivity were achieved. The pH of solution was altered from 2.5, 3.5, 4.5, 5.5, 6.5 (with acetic acid) as recorded by pH meter. To prepare solution for carbon nanoparticles CNPs, 0.10 g of reactive dye is dissolved in 1 L of distilled water. 5 g of nano particles were added in 1 L of dye solution and sonicated for 1 h. To investigate the effect of conductivity, the same procedure of altering the pH of solution 2.5, 3.5, 4.5, 5.5, 6.5 was applied. This was termed as solution 2 (containing carbon nanoparticles). It is also possible to extend the sample pH beyond 6.5 to get a better idea of the most effective pH value. It could be done by adding a suitable dispersing material in the solution. A mild acidic to near-neutral pH range (approximately 5–7) is considered ideal for dispersing carbon-based materials in solution. Recently, new research was conducted to evaluate the dispersion of carbon-based nanotubes. The findings suggest that the carbon nanotubes exhibit greater dispersion stability at pH 5 compared to pH 7.4. Notably, pH levels above 7 tend to promote aggregation, which negatively impacts dispersion stability in certain systems. Consequently, the experiments in this study were carried out at an optimal point within the mild acidic pH range.37,38
Attachment of CNT and carbon nanoparticles over the fabric
Initially Solution 1 (containing CNT) was used as a base material for the preparation of conductive fabrics. 5 g of carbon nanotubes (CNTs) were dispersed in 1 L dye solution prepared in deionized water. The mixture was sonicated using a BANDLIN SONOPULS sonicator for 1 h to ensure uniform dispersion. At first, pH was kept at 2.5 in the solution. Consequently, the textile was immersed in the CNT dispersion and retained at room temperature for 30 min followed by post-cured in an oven at 180°C for 25 min. The high curing temperature was selected based on the thermal behaviour of nylon, as reported by Ge
30
indicating that above 170°C, a fraction of nylon crystals begins to degrade and recrystallize. At this temperature, the chain transitions into nylon structure starts to occur from a glassy to a rubbery state, increasing its adaptability to CNT incorporation. The dipping, drying and curing process was repeated for a total of four cycles to increase CNT loading on the textile. After each cycle (dip and cured) the electrical conductivity was checked which increased by increasing the number of dips but overall electrical conductivity was poor. So, we increased the pH of new solution from 2.5 to 3.5. Again, electrically conductivity of four samples was measured against four cycles of dip and cure. Now the conductivity was little bit improved. It concludes that by increasing pH conductivity of the sample was also increasing. At acidic range of pH, the nitrogen (amine group) in the majority of dye molecules exists in the form of protonated ammonium ion.
39
Thus, we continuously began to increase the pH of solution from 2.5 to 3.5, 4.5, 5.5 and 6.5. On each step of pH electrical conductivity of four samples was measured against four cycles of dip and dry. A total of 20 samples were prepared. Now the solution 2 (containing carbon particles) was taken. The same procedure of dipping and curing was adopted to develop the conductive fabrics at different pH ranges (2.5, 3.5, 4.5, 5.5 and 6.5). Hence, a total of 20 samples were developed with carbon nano particles CNPs coating over the fabric. The attachment of CNT and CNP over the nylon can be seen in Figure 2. The study explores the role of pH conditions on the dispersion stability, surface charge interactions, and adhesion of carbon-based fillers on stretchable textile substrates. Specifically, we examined that at near-neutral to mildly alkaline pH (around pH 8–9), the zeta potential and colloidal stability of CNTs and CNPs are optimized, facilitating uniform deposition without aggregation (results are shown in 4.2 section). This pH range also promotes stronger interaction between the negatively charged nanoparticles and the slightly cationic functional groups on the fabric surface, enhancing coating durability under mechanical strain.
The design of experiment of all developed samples.

Characterization
The characterization of these conductive fabrics was performed at a number of levels, including the investigation of CNT and CNPs, attachment and the durability of CNT and CNPs on the fabric, study the effect of electrical conductivity and electromagnetic shielding over the developed fabrics.
Surface characterization of CNT and CNPs coated fabrics
The dynamic light scattering theory of Brownian motion of particles was used to determine the particle size distribution of carbon nanotubes and dry-milled carbon particles. Deionised water was utilised as the dispersion medium and ultrasonically agitated (using a bandelin ultrasonic probe) for 5 minutes before characterisation. The resultant solution was subjected to ultrasonication for 20 min with an ultrasonic probe before testing. The structure of CNTs and CNPs on the surface of textile samples was examined using a TS5130-Tescan scanning electron microscope (SEM), operated at an accelerated voltage of 20 kV. Prior to testing, the samples were completely dried, followed by coating with a thin layer of gold using a sputter coater to enhance their electrical conductivity. While the percentage of weight gain of particles coated textile was examined according to the following equations:

In this case, w represents the percentage of total weight gain, m is the final mass and m0 stands for original mass of textile. Fibre Finder (FF) was used to measure the microstructures. This unique scanning device uses high-resolution CCD camera Imaging Source DFK 23U445 to detect microscopic objects. Special lighting is realized by a combination of scattered passing and reflected light.
Characterization of electrical properties
The volumetric and surface resistances of the sample set were assessed in accordance with the standard ASTM D257-07, employing a 100 V DC power supply, and by using concentric electrodes (refer to Figure 3, where a pressure of 2.3 kPa was applied), at a controlled temperature of T = 21°C and a relative humidity of RH = 54%. Prior to the experimental procedure, the samples were placed in the air-conditioned room for 24 h. The measurement of volume resistivity is conducted by applying a voltage potential across opposing sides of the sample, and measuring the resultant current travelling through the sample. The volumetric resistivity, ρV [Ω.mm], was derived from the following equation: Scheme and dimensions of concentric electrodes used for measurement of surface and volume resistance, where D1 = 50.4 mm, D2 = 69 mm.


Electromagnetic effectiveness evaluation
Electromagnetic shielding was evaluated by using the coaxial transmission line method, utilizing the insertion loss principle, in accordance with ASTM D4935-10. The calibrated frequency range was adjusted at 30 MHz to 1.5 GHz for analyzing the electromagnetic shielding effectiveness. The measurement set-up contains a sample holder, which is further connected to the network analyzer at both input and output terminals. The sample was characterized by a shielding effectiveness test fixture (Electro-Metrics, Inc., model EM-2107A). In fact, the network analyzer (Rohde & Schwarz ZN3) is the main component used to generate and receive the electromagnetic signals with acute accuracy. The shielding effectiveness (SE) of EMI in dB was measured as the ratio of incident to transmitted power of the electromagnetic wave, as described in equation (5).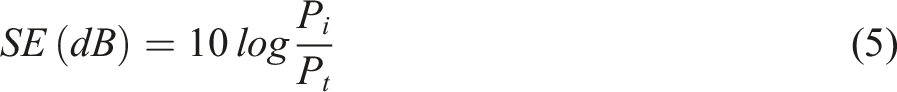
Ohmic heating performance of conductive fabrics
The heating efficiency of CNTs and CNPs coated textile was calculated by observing the surface temperature variation under an applied voltage across the textile ends (Figure 21). The heat generation is directly proportional to I2 as described in the given equation (6).
Here, R represents the resistance of the operating heater, P signifies the total power dissipation, and I refer to the current flowing through the conductive samples. The temperature of the CTs and CPs coated electrically conductive fabrics was recorded at the different times under an applied voltage fixed at 5 V, and thermal images were captured using a FLIR thermo-camera.
Results and discussion
Surface morphology analysis
Surface analysis was done at various stages: (a) after milling the carbon particles, (b) after the pre-treatment of fabric, (c) for CNPs coated fabric, and (d) for CNTs coated textile. To study the surface modification of fabric after alkali treatment; SEM images of untreated and treated samples were investigated. An image of the sample treated with alkali, shown in Figure 4 (a-b), provides detailed analysis of surface modification of fiber exhibiting some carved, etched and rough surface indicating the surface modification of the fiber. The reason for this inner rougher fabric surface is may be the intense hydrolysis leading to increased number of amino groups. On fabric’s surface, generation of more amino groups has been validated according to previous literature.
31
Figure 4 (c-d) displays SEM images of morphology of carbon particles assessed before and after 30 min of dry milling. The carbon particles were identified in a mixed configuration of both nano segments and nano particles. Because of shorter milling ratio, higher aspect ratio was observed in a few of the carbon particles. In order to further refine the uniformity of carbon particles to nanoscale, it is mandatory to overcome the temperature elevation of ball mill in order to pulverize them for extended period of time. SEM structure of Nylon fibers (a) before treatment, (b) after treatment with NaOH, and carbon particles (c) before milling and (d) after milling. Carbon particle coated textile (a) C 17, (b) C18, (c) C19 and (d) C20; and carbon nanotubes coated fabrics (e) T17, (f) T18, (g) T 19 and (h) T 20.

Moreover, the SEM structures of coated fabrics were also analysed. The SEM images for the samples were conducted to assess the CNTs and CNPs coating on the surface of fabric. The SEM images (Figure 5) show the deposition of conductive material on fabric’s surface on nanometer scale. As the number of dips increases, the adherence and deposition of the CNTs and CPs coatings on the surface of fiber became steadier and more compact. This trend demonstrates that setup of the percolated network of conductive material will increase with the number of increased dips. The microfibers attach and assimilate the CNPs and CNTs due to their physical interactions which make an effective electrically conductive network as shown in Figure 5(a)–(h) in SEM illustration. Moreover, the voids in microfiber were also filled with the CNTs and CNPs and their interstices were compiled one after another to make electrically conductive networks. The electrically conductive fibers become more electro-conductive due to these enhanced fiber network. The electrical resistivity had the direct relation with the electrically conductive pathways: the electrical resistance decreases with the increase of electrically conductive pathways. 41
Distribution of particle sizes, polydispersity index and zeta potential
The particle size distribution shown in Figure 6(a), represents the result of carbiso mil 100 µ particles after dry milling. The time of milling was adjusted for 30 min. The obtained graphs exhibit the multimodal peaks and size distributions. The large particles were converted into carbon micro/nano particles with multimodal distribution. The multimodal distribution indicated that the ball milling was effective in pulverizing some of the carbiso mil 100 µ particles to micro/nanoparticles under the action of ball milling. The milling process is totally based on mechanical actions (forces), exerted by small balls on inorganic materials. Hence, follows the principle of top-down nanoscience and leads to convert large particles to small ones. Due to increase in temperature of ball mill and subsequent cold welding of carbon particles on milling container, further pulverization of carbiso mil 100 µ particles was stopped. Although some peaks indicating the nano particles, the average size was noted between 3 and 4 μm. Likewise, the particle size distribution of carbon nanotubes (CNTs) was also analysed (Figure 6(b)). Among two red peak sets, the largest peak set was observed around 3000 nm (CNPs) and 700 nm (CNTs). The average size can be stated in this range. However, the green curve showed the cumulative undersize percentage, which confirms that the majority of particles fall below approximately 3000 nm. This indicates that majority of particles lie in the range of <3000 nm. The appearance of two sets (multimodal) of CNTs may have occurred due to a mixture of single-walled CNTs and due to an aggregation of CNTs into bundles. The aggregates may form due to the high aspect ratio and van der Waals forces between individual nanotubes. Particle size distribution of (a) carbiso mill particles after 30 min dry milling, (b) carbon nanotubes.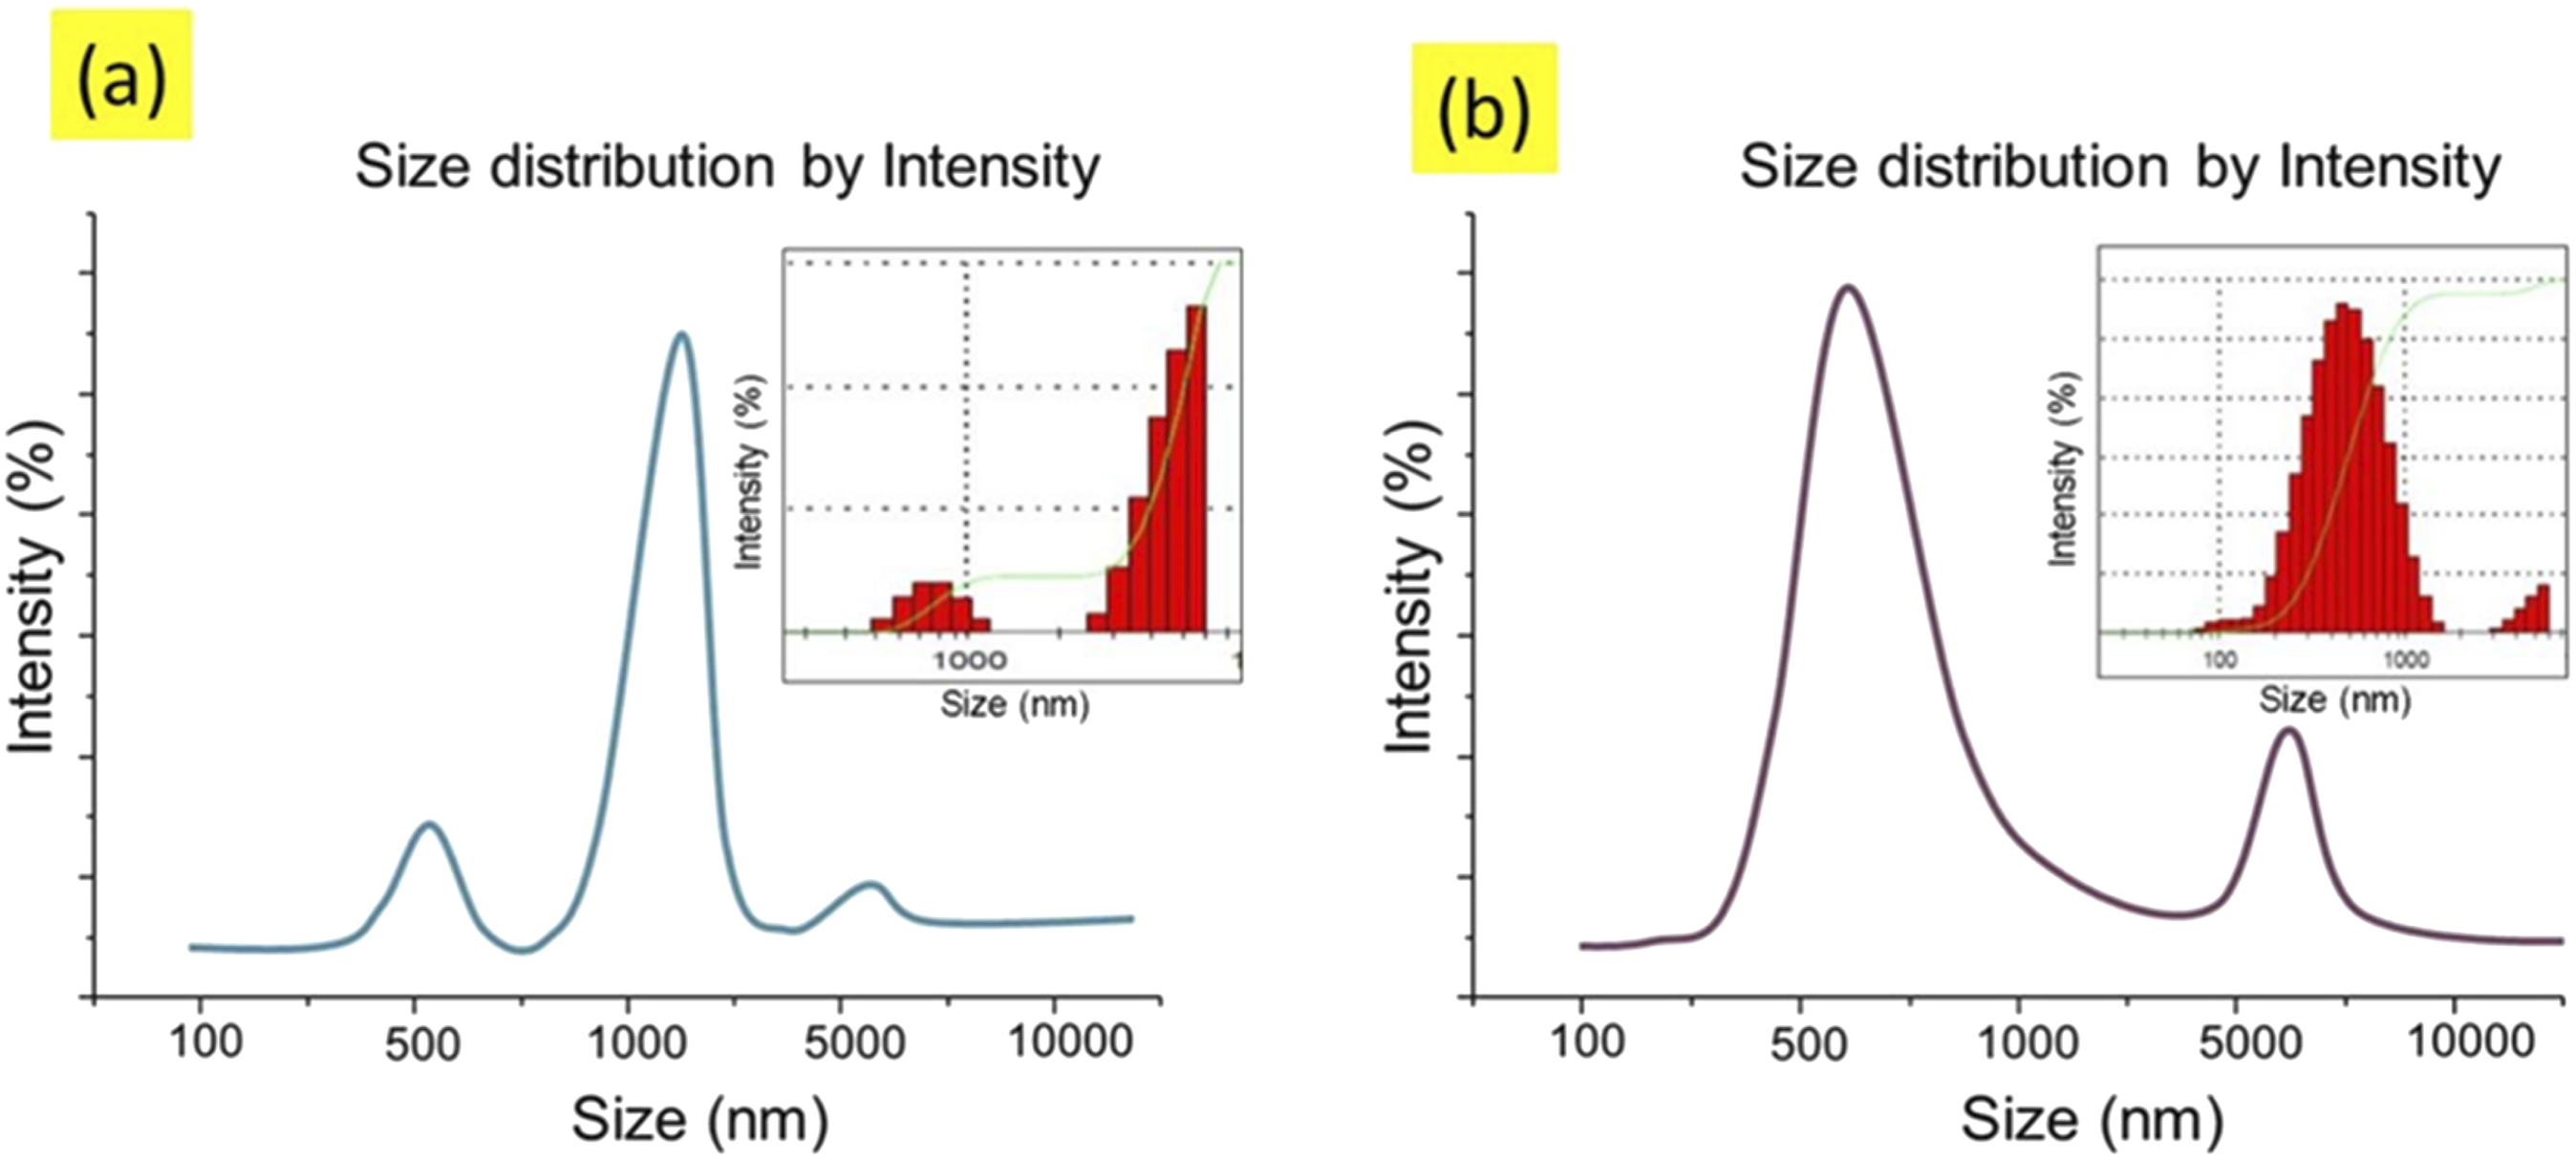
The molecule size distribution is already described in aforementioned section. Particle sizes were changing in a multimodal way, ranging from nano-meters to micro-meters. At a zeta potential of 96 mV and 87 mV, respectively, the average size of the CNPs and CNTs particles was approximately 3000 nm and 700 nm. The colloid stability of both types of nanoparticles was demonstrated by the Zeta potential values, which were > ± 30 mV.
42
This ensured that the particles had a highly negative potential from the nano-meter to the micro range and were dispersed uniformly throughout the mixture. Zeta potential provides a good analysis of particle stability, however, polydispersity index (PDI) values in nanoscience give a more articulate representation of the particle size distribution. CNPs and CNTs nanoparticles were shown to have a polydispersity index (PDI) of approximately 0.39 and 0.32, respectively. The values show that the particles are highly polydisperse before coating.
43
The graphs in Figure 7(a) and (b) represent the zeta potential and polydispersity index (PDI) of CNPs and CNTs nanoparticles against each variation of pH. Generally, the zeta potential indicates the stability or instability of particles within the solution. Zeta potential value of ±10 −20 mV, ±20 −30 mV and > ± 30 mV shows relatively, moderately and highly stable colloids respectively.
42
Figure 7(a) shows that the ZP of CNPs nanoparticles reached maximum stability (96 mV) with a pH of 6.6. While in the case of CNTs nanoparticles, the highest stable values of zeta potential around 87 mV were recorded at pH of 6.5. On the other hand, a linear increase in the polydispersity index of CNPs particles was noticed till 5.5 pH. The maximum PDI value recorded was observed about 0.39. The nanoparticles with PDI value <0.1 are considered as highly monodisperse, while PDI value >0.4 and that of between 0.1 and 0.4 are indicated as highly polydisperse and moderately dispersed. The ZP of CNTs increased with the increase in pH till 5.5 and it showed maximum value (0.34). At this stage, the particles of CNTs showed maximum stability and started to destabilize with increase in pH as indicated by the graph in Figure 7(b). The PDI value recorded at pH 5.5 reached 0.34, which is quite an acceptable range under polydispersity. Overall, with increase in pH, the PDI values and Zeta potential increase. Among both particles, CNPs are highly stable compared to CNTs. The reason can be attributed to the fact that least oxidation state and the least nucleation of silver ions as compared to copper and zinc. The statement can be further reinforced by a previous study conducted by Azam et al.,
44
in which a comparative analysis between silver and copper nanoparticles was studied. The sizes of copper particles were bigger and had more clusters as compared to silver. Hence, more nucleation means more agglomeration in structures and produces big-sized particles, which in turn causes less stability. At different concentrations of pH (a) zeta potential and PDI of CNPs, (b) zeta potential and PDI of CNTs.
Weight gain percentage for CNTs and CNPs coating
Moreover, the weight gain percentage of CNPs and CNTs coated nylon fabric was investigated. The effect of different applied pH ranges against weight gain of fabric was measured. It is clear from Figure 8 that the weight of the nylon fabric was increased in all three cases with an increase in pH during the application of CNPs and CNTs over the fabric structure. It was also observed that the trend of weight gain percentage against each pH level of CNPs and CNTs was almost the same. However, the weight gain percentage in case of CNTs coated fabric was slightly higher as compared to CNPs coated fabric. The same effect of higher weight gain percentage as compared to silver was noticed in a published work. There are multiple reasons for gaining more weight of fabric achieved by nanoparticles such as type and distribution of particles, fabric type and concentration. However, one main reason may be due to the difference in actual densities of CNTs and CNPs.
45
The percentage add on of CNPs and CNTs on fabric.
Electrical conductivity of carbon nanotubes and carbon nanoparticles coated nylon fabrics
The electrical resistivity is directly associated with the electrically conductive channels. The increase in the number of electrical channels including conductive fibers, particles, fillers, etc., leads to decrease the electrical resistivity.
46
To introduce the electrical conductivity into insulating matrix, fillers play a significant role. The conductivity may change by varying size of fillers, orientation, concentration, dispersion, filler-to-filler contacts and filler shape, etc.
47
The evaluation of electrical resistivity was analysed at different points of all the samples, in which 20 samples were developed by coating of CNTs and the other 20 by coating of CNPs as detailed in aforementioned section (design of experiments). Different types of electrical resistivity evaluations were made; including (1) evaluation of surface resistivity, (2) evaluation of volume resistivity, (3) comparison of volume and surface resistivity, (4) measurement of volume resistivity with increase in stretch percentages, and (5) evaluation of surface resistivity with increase in stretch percentages. Additionally, the visual validation for the development of electrical conductivity in fabric was also verified by the flow of electric current through sample, as illustrated in Figure 9. Flow of electricity in carbon nanotubes coated fabric.
Measurement of volume and surface resistivity
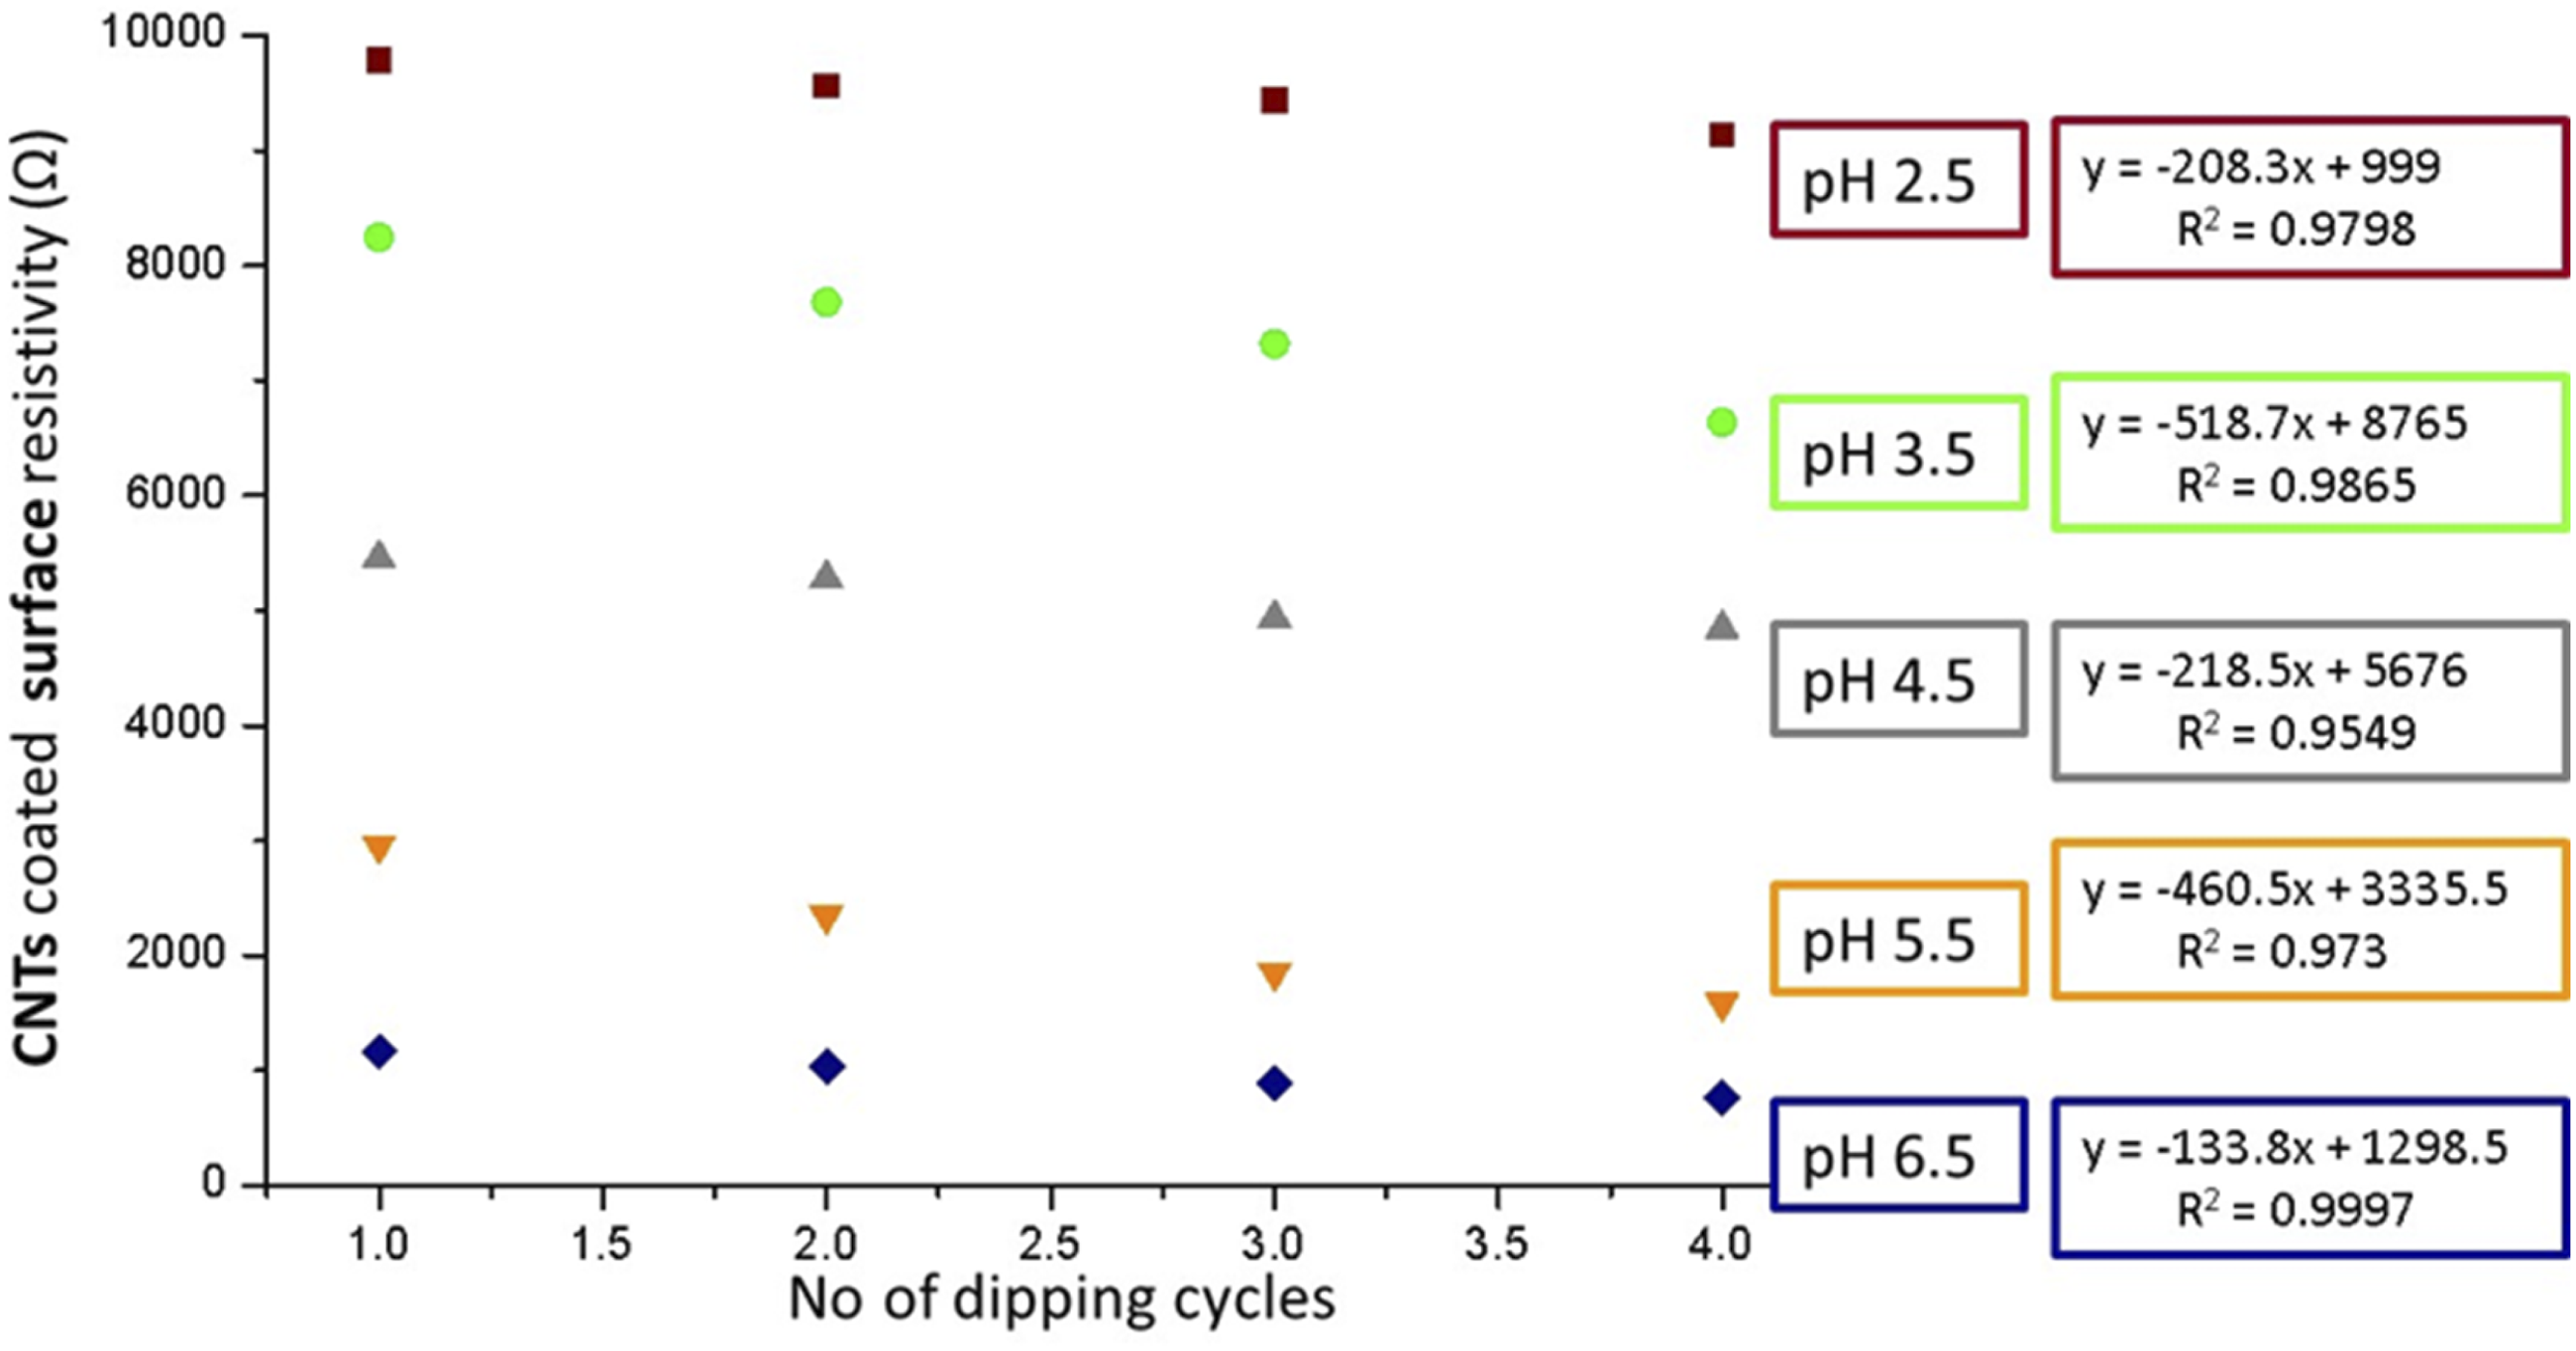
The electrical volume resistivities of CNTs and CNPs coated samples were evaluated by using concentric electrode methods. The effect of dipping cycles in CNTs and CNPs solution with change in pH level was analysed deeply. In fact, the resistivities were supposed to decrease with increase in the deposition of conductive materials (CNTs and CNPs) over the fabric samples. This assumed hypothesis was confirmed by analyzing the obtained results of electrical resistivities. As illustrated in Figures 10–13, with increase in pH, the results in a significant initial decrease in resistivity and then followed by a more gradual reduction. Reduces. This trend is also consistent for all the fabrics functionalized at varying dips. Variation in volume resistivity of CNTs coated fabric samples with number of dips for pH 2.5, 3.5, 4.5, 5.5 and 6.5. Variation in surface resistivity of CNTs coated fabric samples with number of dips for pH 2.5, 3.5, 4.5, 5.5 and 6.5. Variation in volume resistivity of CNPs coated fabric samples with number of dips for pH 2.5, 3.5, 4.5, 5.5 and 6.5. Variation in surface resistivity of CNPs coated fabric samples with number of dips for pH 2.5, 3.5, 4.5, 5.5 and 6.5.


Usually, such a process involves the incorporation of both CNTs and CNPs into the fabric surface which eventually leads to the formation of different pathways that are electrically conductive. Furthermore, in the case of water, the dispersion parameter of both CNTs as well as CNPs depends on the pH of the solution. Normally, to maintain the pH of the solution, acetic acid is introduced which leads to the generation of a dynamic equilibrium state among the weak acid that dissociates to create acetate ions. The resulting dissociation causes the discharge of various free moving protons that further react to protonate different amine or sulfonate groups. These interactions lead to smooth dispersion of both CNTs and CNPs in the water. These ions can also enhance the ionic strength of the solution. Moreover, both sulfonate free ions as well as un-dissociative sulfonic acid can be present in the solution at the same time despite their pH value which is 2.5 or 6.5. Additionally, in case of solution having acidic pH, the free terminal parts of the amino groups present in the nylon fibers go through the process of protonation causing the formed ammonium cation to react with sulfonate ions which eventually increases the affinity among CNTs, CNPs as well as fibres using ion-exchange process (Figure 2). Hence, both CNTs as well as CNPs adhere to the surface of nylon fabrics through merging various interactions such as hydrogen bonding and van der Waals interactions, etc.31,39,48–50
By considering the above theory based on previous communications and discussions, we started our experiments from highly acidic pH 2.5. At first eight samples were developed (4 with CNTs, 4 with CNPs) at 2.5 pH with 1, 2, three and four dips in solution and their electrical resistivity (surface and volume) were evaluated. The resulting trend justified our hypothesis that increasing the number of dips in solution results in the deposition of more conductive material on the surface of fabric. Hence resulting resistivity was reducing, but the overall values for resistivity were still very high. Actually, this may attribute the fact that at lower pH, fewer CNTs and CNPs are dispersed in water and more dye molecules are attached to the fabric. Therefore, the PH of next solutions (for CNTs and CNPs) was increased from 2.5 to 3.5 and again eight more samples were developed with 1, 2, three and four dips. Electrical resistivity (surface and volume) was significantly reduced but the overall results were not satisfactory. So, we further continue to increase the pH of new solutions (from 3.5 to 4.5 and 6.5) and develop eight samples (4 with CNTs, 4 with CNPs) on each step. Now a considerable reduction in the electrical resistivity was noticed for both CNTs and CNPs coated fabrics. Hence, pH 6.5 proved to be best for dispersion and maximum attachment of CNTs and CNPs on the surface of fabrics. Conductive materials are present in sufficient quantity to develop a continuously conductive network.
Furthermore, we also cannot neglect the effect of the number of dips in solutions at each pH level. This trend is also clear from Figures 10–13. We can observe that on each pH level resistivity is decreasing with increasing number of dips, and trying to get stable between dip number three and 4. However, the sample T20 (composed of CNTs) and sample C20 (composed of CNPs) showed the minimum resistivity (surface and volume) than all developed samples. This is because these samples were developed under the advantages of both parameters, (1) pH at 6.5 (2) having more no of dips, say four dips. The trend of electrical resistivity (surface and volume) for CNTs and CNPs coated fabrics against each pH level at number of dips are given in below graphs.
In comparison between resistivity (surface and volume) values between CNTs coated fabrics and CNPs coated fabric samples. It is noticeable from the trend lines of all the above graphs that fabric samples treated with CNTs have lowest value of resistivity (surface and volume) as compared to CNPs treated fabric samples. The reason is that CNTs have high aspect ratio and more contact points as compared to CNPs. So CNTs can make easily conductive network. As found from the literature review a comparative study was conducted between CNPs, SWCNTs and MWCNTs (multiwalled carbon nano tubes) regarding their efficiency for electrical conductivity in composites. The value of resistivity of the matrix with SWCNTs is approximately three orders of magnitude lower.
51
Furthermore, it is also clear from the previous study work that CNTs can contact a number of ways as shown in Figure 14.
52
Contact points between CNTs.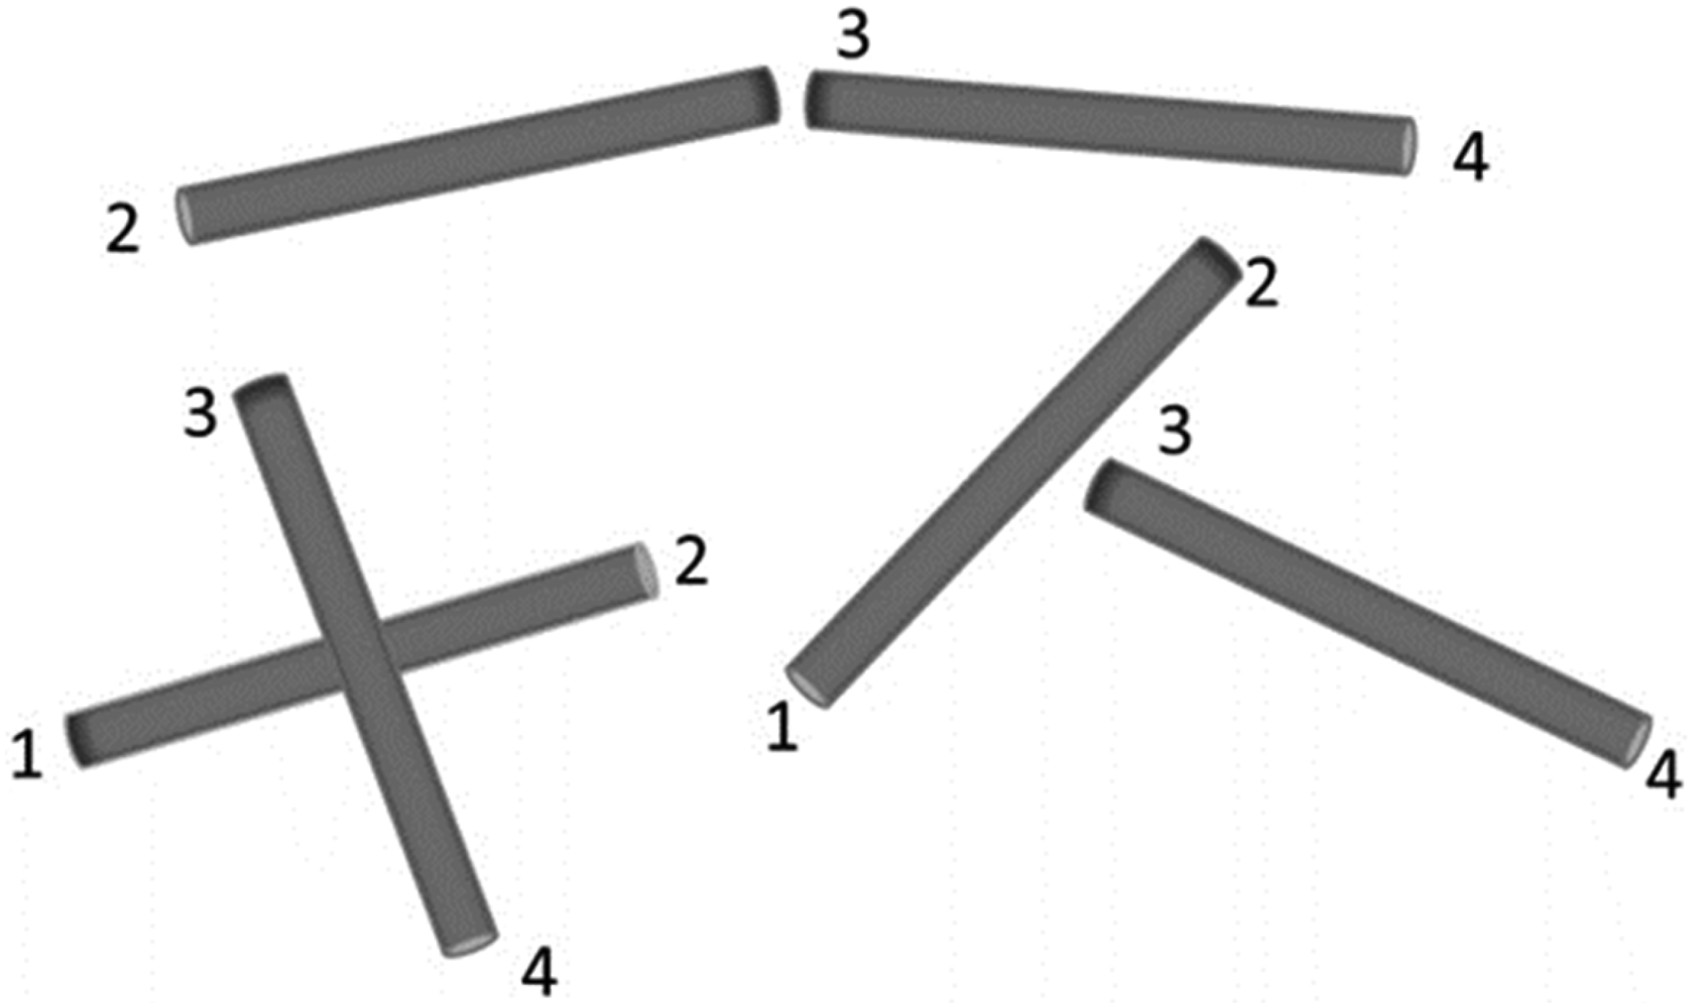
Comparison of surface and volume resistivity
Surface resistivity refers to the resistance encountered by an electric current as it travels across the surface of a material. In our study, both surface and volume resistivities were analysed against all developed samples (CNTs and CNPs coated all fabrics). Figures 15 and 16 show comparative analysis between volume and surface resistivity along C1 to C20 and T1 to T20 all samples. We can see as the surface resistivity for the samples C1 to C20 is increasing, their volume resistivity from C1 to C20 is also decreasing. So, there is a streamlined and direct trend between both resistivities. It is observed that as the surface resistivity of samples C1 to C20 decreases, their volume resistivity also follows a similar decreasing trend. This indicates a consistent and direct correlation between both resistivity measurements. The same analysis was also observed for carbon nanotubes coated on all samples. In all measurements, the volume resistivity is decreased like that of the surface resistivity. This demonstrates clearly that the coating is consistent throughout the fabric’s mass and not only over the surface. Consequently, both surface and volume conductivities of the fabric has been increased due to the impregnated coating of conductive materials. Comparison of surface and volume resistivity for CNTs coated fabrics (T1 to T20) at 2.5, 3.5, 4.5, 5.5 and 6.5 pH. Comparison of surface and volume resistivity for CNPs coated fabrics (T1 to T20) at 2.5, 3.5, 4.5, 5.5 and 6.5 pH.

Surface and volume resistivity at different extension percentage
The fabric samples named as T17, T18, T19 and T20 (coated with CNTs at 1, 2, three and four dips with 6.5 pH) show lowest values of both surface resistivity and volume resistivity, so they were selected for further experiments and testing. Their initial values for volume and surface resistivity (at 0% of stretch) were 278, 212, 109, 85 Ω·mm and 1164,1034, 893, 765 Ω respectively. This statement can also be cleared from the trend lines of graphs given in Figures 10 and 11. Correspondingly, the same trend was investigated for CNPs imparted fabrics. The CNPs coated fabric samples named as C17, C18, C19 and C20 at the pH, showed lowest values in volume and surface resistivities. The samples C17, C18, C19 and C20 at 0 % of stretch (at normal condition of fabric sample) showed the volume resistivities value around 423, 386, 244 and 212 Ω.mm respectively, while their corresponding surface resistivity values were 1873, 1698, 1632, and 1534 Ω. Aforementioned Figures 12 and 13 gave a clear idea of the above-mentioned statement through the trend line mentioned in graphs.
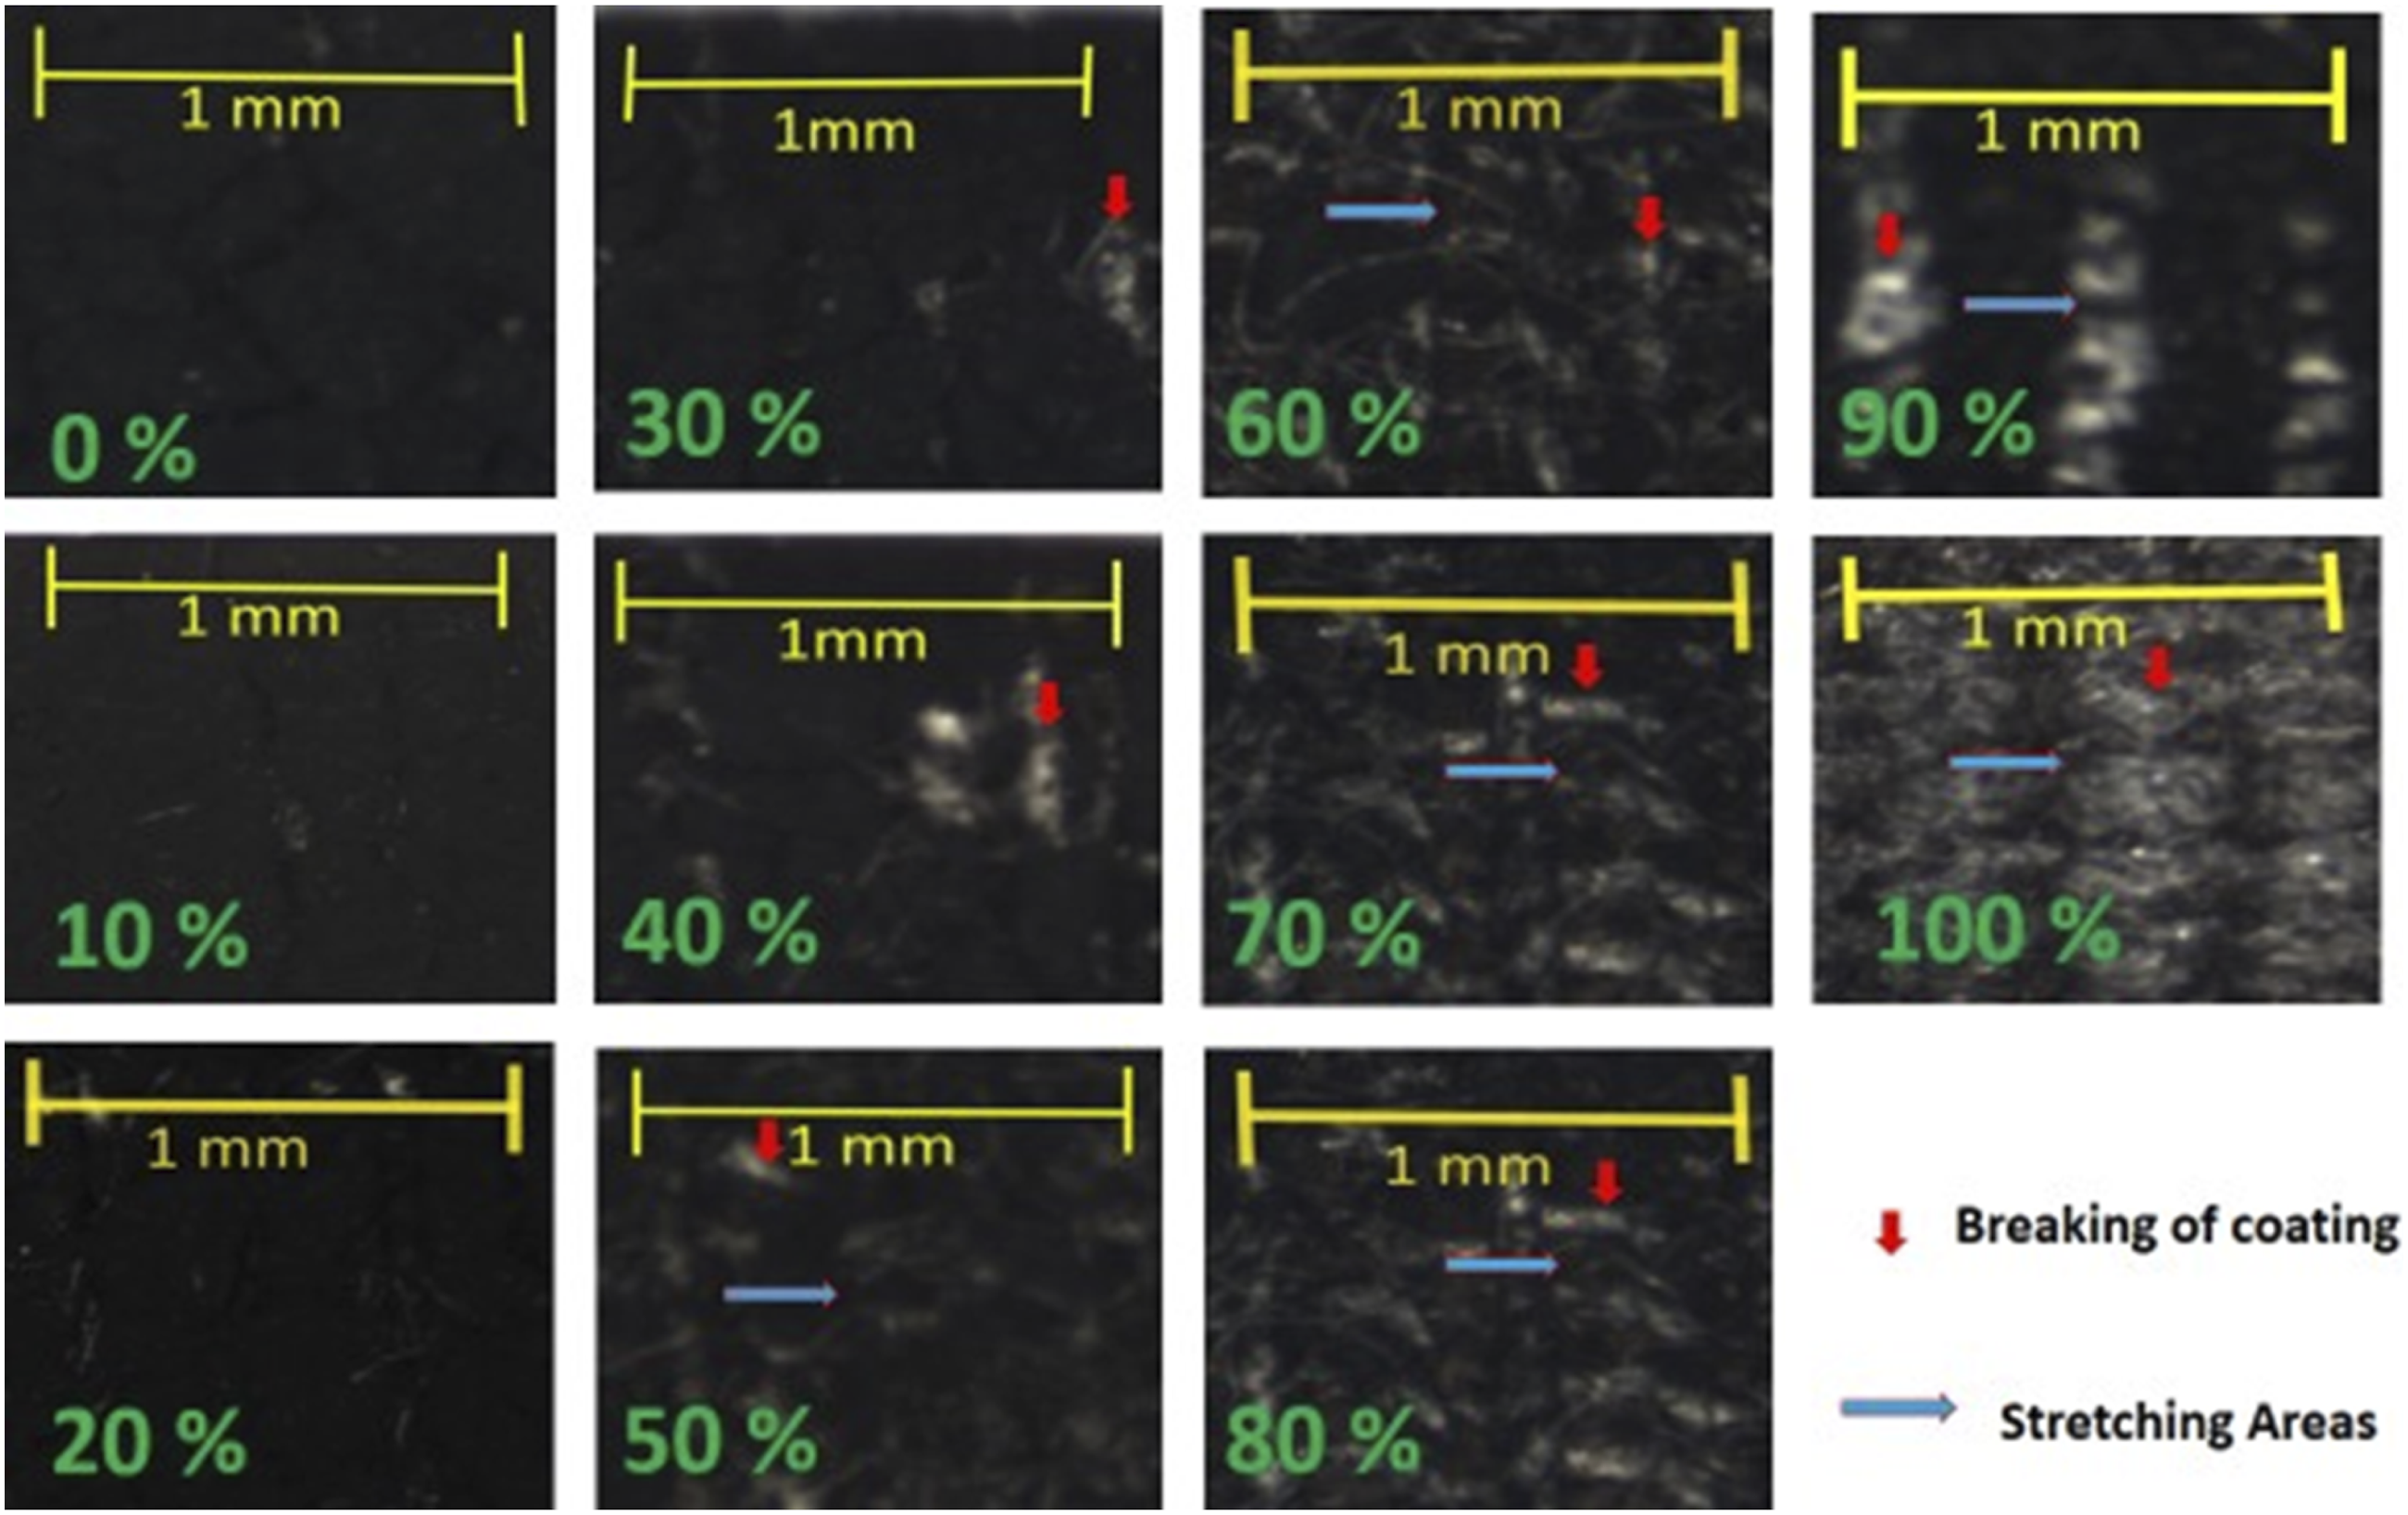
Figure 17 displays the volume resistivity of the electrically conductive fabric samples (T17, T18, T19 and T20) which are fabricated with CNTs coating. Initially, at 0% stretching when the samples T17, T18, T19 and T20 were in their original form (without any stretching), their electrical volume resistivity was about 278, 212, 109 and 85 Ω·mm. These values gradually increase with the increase in stretch, and go up to 317, 293, 272, 267 Ω.mm at the stretch of about 70% and 812, 723, 689, 652 Ω·mm at the stretch of 80%. At the range of about 0%–80% stretch, the variation in the electrical volume resistivity was quite minor so it can be assumed as a constant value. But at the stretch of about 90%, the values exceed up to 3589, 3350, 3323 and 2505 Ω·mm, and increased drastically (70932, 65723, 66690 and 54613 Ω·mm) at the stretch of 100%. Correspondingly, the electrical surface resistivities of the electrically conductive fabric samples named as T17, T18, T19 and T20 coated with CNTs were also examined and their trend lines are shown in Figure 18. Initially, at 0% stretch, the fabric samples (T17, T18, T19 and T20) gave surface resistivities of about 1164, 1034, 893 and 765 Ω. At 70% stretch, the values of the surface resistivities of T17, T18, T19 and T20 were also deliberatively enhanced up to 1388, 1263, 1108, 918 Ω. The electrical resistivity values were quite constant till 70% stretching but they started increasing drastically and reached 90968, 84474, 82638 and 74645 Ω at 100% stretching. Such behaviours can further be justified by analysing the micro-photographs analysis, where the variations in the morphology of the fabric and rupture in coating can be observed at various stretch areas. The micro photos state break areas (where the coating is not smooth and becomes ruptured) as well as stretch areas. At the 0%–40% range, the electrically conductive fabrics did not show any signs of rupture but it starts getting ruptured at about 70% stretch, while stretching areas were increasing as shown in Figure 19. Effect of extensions against volume resistivity of CNTs coated conductive fabric samples (T17, T18, T19 and T20). Effect of extensions against surface resistivity of CNTs coated conductive fabric samples (T17, T18, T19 and T20). Microstructures of CNTs coated electrically conductive fabric samples at stretch of 0%, 10%, 20%, 30%, 40%, 50%, 60%, 70%, 80%, 90% and 100%.


The stretching areas expanded due to increased strain; exhibiting substantial ruptures in continuous coating areas at stress rate of 80%. After 80% stress, the continuous and homogeneous frame work of applied coating of conductive materials (CNTs or CNPs) started destroying. At 90% and 100% stretch, the conductive frameworks were entirely destroyed with immense breaking points in the coating, where the protruding fibres entangled together and resulting in irregular beads. This type of trend (coating failure with increased stress) after 70%–80% emphasizes the fact that the conductive fibric can withstand to exhibit constant electrical resistivity maximum up to 70%. A further increase in stretch (up to 100%) will result in drastic change in coating, leading to sudden increase in resistivity. In the current study, stretchability tests were conducted under uniaxial stretching conditions. The fabric samples were elongated incrementally from 0% to 100% in a single direction (lengthwise) to evaluate changes in electrical resistivity (both surface and volume).
The electrical volume resistance of the CNPs coated electrically conductive fabric samples (C17, C18, C19 and C20) as a function of the stretching are shown in Figure 20. The values of volume resistivity at 0% stretch for fabrics samples C17, C18, C19 and C20 were 423, 386, 244, and 212 Ω·mm respectively. The volume resistivity values increase gradually and consistently up to 60%–70% extension. At 70% stretch values were 4826, 4354, 3347 and 2896 Ω·mm respectively. After 70% of extension the volume resistivity increased very fast and approaches to 10,987,600, 9,826,500, 8,576,000, 7,593,200 Ω·mm at 100% extension. Similarly, electrical surface resistance of the CNPs coated electrically conductive fabric samples (C17, C18, C19 and 20) as a function of stretching was also measured and their trend lines are shown in Figure 21. Fabrics samples C17, C18, C19 and C20 were showing surface resistance at 0% stretch 1873, 1698, 1632 and 1534 Ω respectively. The surface resistance was also increased slowly up to 60% extension, where values for C17, C18, C19 and C20 fabric samples were 3518, 3167, 2947 and 2582 Ω respectively. Hence, they showed constant value of electrical resistivity up to 60% stretch, then sudden increase in resistivity occurred and values of surface resistivity up to 100% extension were so high; 12,637,000, 11,472,000, 9,776,000 and 9,593,000 Ω respectively. This behaviour can also be justified by change in structures of fabric and capturing the micro photos of stretch areas. Electrically conductive fabric samples did not have any ruptures in coating at stretch of 0% to 50%, then slight breaking in coating appears at 60% stretch. While stretching areas were increasing as shown in Figure 22. Effect of extensions against volume resistivity of CNPs coated conductive fabric samples (C17, C18, C19 and C20). Effect of extensions against surface resistivity of CNPs coated conductive fabric samples (C17, C18, C19 and C20). Microstructures of CNPs coated electrically conductive fabric samples at stretch of 0%, 10%, 20%, 30%, 40%, 50%, 60%, 70%, 80%, 90% and 100%.

The stretching areas expanded due to increased strain; exhibiting substantial ruptures in continuous coating areas at stress rate of 70%. After 70% stress, the continuous and homogeneous frame work of applied coating of conductive materials (CNTs or CNPs) started destroying. At 90% and 100% stretch, the conductive frameworks were entirely destroyed with immense breaking points in the coating, where the protruding fibres entangled together and resulting in irregular beads. This type of trend (coating failure with increased stress) after 70%–80% emphasizes the fact that the conductive fibric can withstand to exhibit constant electrical resistivity maximum up to 70%. A further increase in stretch (up to 100%) will result in drastic change in coating, leading to sudden increase in resistivity.
Electromagnetic shielding of conductive composites
The shielding effectiveness (SE) is described as the ratio of transmitted power (Pt) to incident power (Pi), measured in decibels (dB) by the equation given below.
The samples of CNTs coated (T17, T18, T19 and T20) and CNPs coated (C17, C18, C19 and C20) were tested against the parameter of electromagnetic interference (EMI) shielding effect. These samples were used due to their better behavioral response for electrical conductivity. The shielding effectiveness was recorded for frequency range up to 1500 MHz. The EMI shielding effectiveness (SE) works as a degree of frequency for both coated samples (CNTs and CNPs). The phenomena can be described by Figure 23(a). It was analysed that EMI shielding effectiveness is directly associated with electrical conductivity, as higher conductive samples provided higher EMI SH, and EMI SE eventually decreases with the increase in resistivity. It was explained previously, EMI SE fluctuates with increase or decrease in conductivity, as there is conduction system which controls EMI SE of the sample. The maximum EMI SH values for T17, T18, T19 and T20 CNTs coated fabric samples were 7, 10, 15 and 17.5 dB respectively. It is evident from the results that there is noticeable increase in EMI SH with increase in frequency ranges from 100 to 200 MHz, then becomes stable. The results indicate, that the fabric samples coated with CNTs provided higher EMI SH values even at relatively low frequency ranges. It means that fabric samples are able to achieve high EMI at low frequency range, additionally EMI values are so stable till 1500 MG Hz. Additionally, T20 sample has a strong conducting network system and has high electrical conductivity and due to this property, highest value of EMI was noted by T20 sample which was 17 dB. As T20 sample displayed the highest value EMI, so it was selected to examine the effect of increase in stretch percentages against EMI SE. The sample T20 (CNTs coated) was subjected the stretch percentages of 0%, 20%, 40%, 60% and 80%; and against these percentages the recorded EMI SE of sample was 17, 12, 9.76, and 6.3 dB. It means that during the stretching of the conductive fabric, the conductive fillers (CNTs) shift apart on fabric surface, leading to the disruption of the conductive pathway at multiple points (also shown by microscopic images of CNTs coated electrically conductive fabric, as discussed in the aforementioned section). Moreover, Figure 23(b) shows the dependent behavior of EMI shielding on volume conductivity. The EMI shielding was increasing as the fabric electrical resistivity was decreasing (increasing electrical conductivity). The sample T20 with minimum resistivity 85 Ω·mm showed the maximum EMI SH about 17.5 dB. EMI SH efficiency against frequency for CNTs coated samples (a) without stretching for samples T17, T18, T19 and T20. (b) Dependent behaviour of EMI shielding on volume conductivity.
Similarly, fabric samples coated with carbon nanoparticles (C17, C18, C19 and C20) were tested for the EMI SE effectiveness and the results are presented in Figure 24(a). It was analysed that EMI shielding effectiveness is directly associated with electrical conductivity, as higher conductive samples provided higher EMI SH, and EMI SE eventually decreases with the increase in resistivity. It was explained previously, EMI SE fluctuates with increase or decrease in conductivity, as there is conduction system which controls EMI SE of the sample. The highest level of EMI SE recorded were 5.5, 8.03, 9.5 and 14 dB for C17, C18, C19 and C20 CNPs coated fabric samples. It is evident from the results that there is noticeable increase EMI SH with increase in frequency ranges from 100 to 200 MHz. The results indicate, that the fabric samples coated with CNPs provided higher EMI SH values even at relatively low frequency ranges. Additionally, C20 sample has a strong conducting network system and has high electrical conductivity and due to this property, highest value of EMI was noted by C20 sample which was 13.56 dB. As C20 sample displayed the highest value EMI, so it was selected to examine the effect of increase in stretch percentages against EMI SE. The sample C20 (CNPs coated) was subjected the stretch percentages of 0%, 20%, 40%, 60% and 80%; and against these percentages the recorded EMI SE of sample was 14, 9.76, 6.4, 5.54 and 3.2 dB It means that during the stretching of the conductive fabric, the conductive fillers (CNPs) shift apart on fabric surface, leading to the disruption of the conductive pathway at multiple points (also shown by microscopic images of CNPs coated electrically conductive fabric, as discussed in the aforementioned section). Moreover, Figure 24(b) shows the dependent behavior of EMI shielding on volume conductivity. The EMI shielding was increasing as the fabric electrical resistivity was decreasing (increasing electrical conductivity). The sample C20 with minimum resistivity 756 Ω mm, showed the maximum EMI SH about 14 dB. The shielding was achieved from both reflection and absorption factors (typical of conductive carbon networks). The frequency range (30 MHz to 1.5 GHz) encompasses critical industrial and consumer commuication bands, including radio, television broadcasting, mobile communication, and IoT device frequencies, making it highly relevant for evaluating smart textiles used in wearable electronics and health-monitoring systems.
53
It is acknowledgeable that it may not meet strict shielding demands as it is suitable for low-interference environments, wearable applications, and non-critical consumer electronics. The SE values ≥30 dB are ideal for military or aerospace applications, SE values between 10 and 20 dB are commonly accepted in wearable and consumer electronics. Our materials demonstrate promising results for such lightweight, flexible textile-based EMI shielding.
54
EMI SH efficiency against frequency for CNTs coated samples (a) without stretching for samples C17, C18, C19 and C20. (b) Dependent behaviour of EMI shielding on volume conductivity.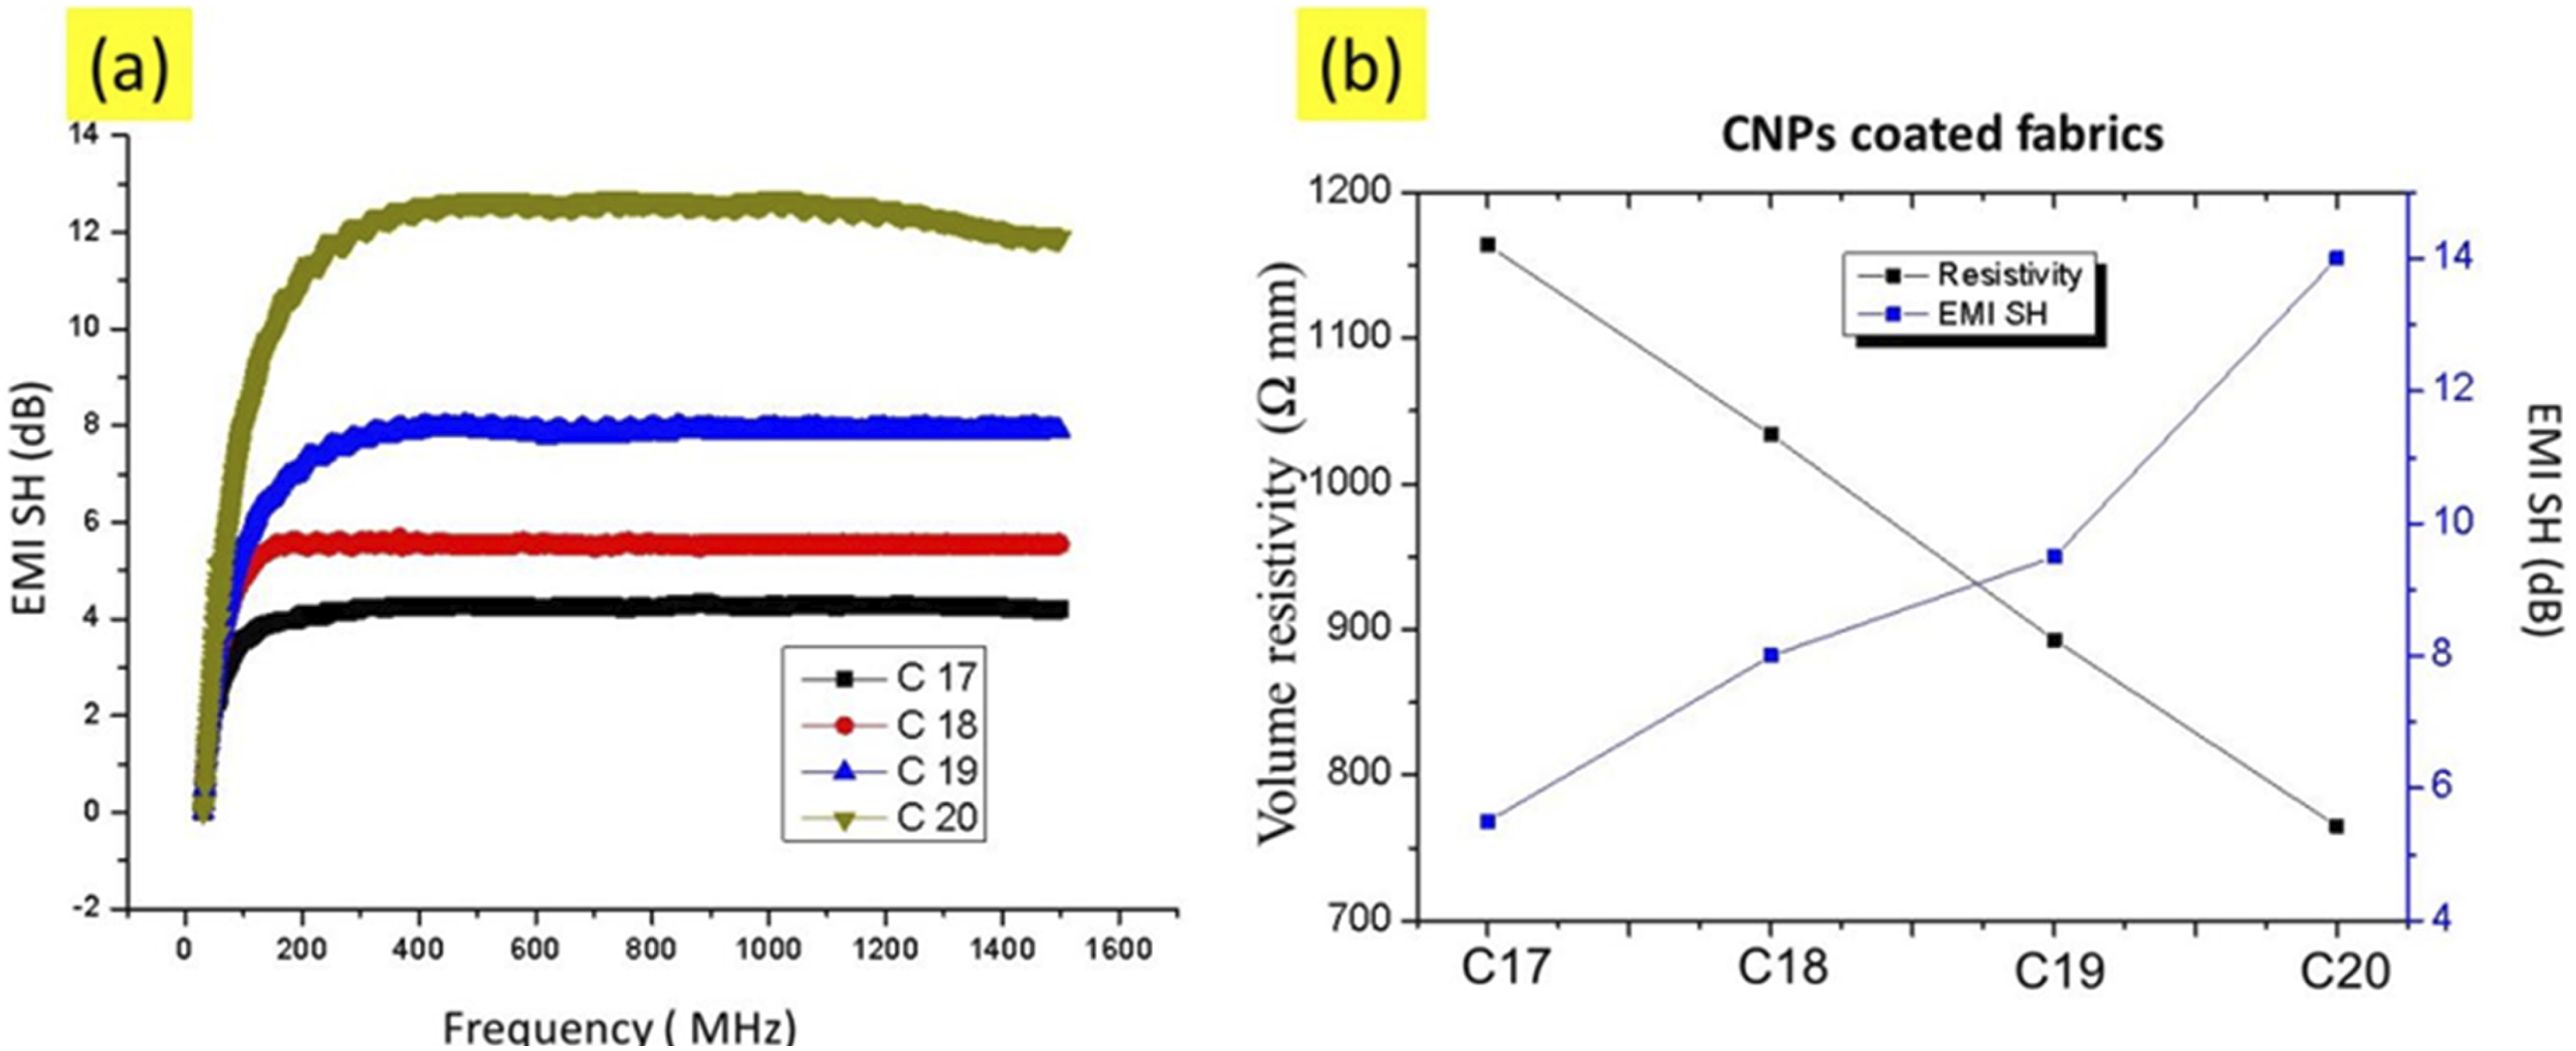
Ohmic heating
The fabrics previously coated with CNTs and CNPs were examined for their heating efficiencies. The change in temperature along the surface was recorded, while applying different sets of varying voltages (Figure 25). The maximum rise surface temperature was recorded for the samples T20 (CNT coated) and C20 (CNP coated). The CNT coated samples (T17, T18, T19 and T20) showed maximum temperatures i.e. 42.2, 55.9, 69.8 and 87.4°C for fabric’s surface with the voltage of 5V and 1 min time duration. Under an applied voltage at 5 V, for 1 min of time interval, the recorded temperatures along the surface were around 42°C, 55°C, 69°C and 87°C for (T17, T18, T19 and T20) CNTs coated fabric samples, while 33°C, 45°C, 59°C and 76°C for (C17, C18, C19 and C20) CNPs coated fabric samples respectively. Moreover, the samples from both sets (CNPs, CNTs) with the highest temperature T20 (87.4°C) and C20 (76.6°C) were subjected the range of different sets of DC input voltages (0–10 V) to analyse the steady state relationship (increase in voltages directly proportional to increase in temperature, ie straight line). At 10 V, maximum temperatures were observed for the samples i.e. (119°C for CNT and 112°C for CNP) as in Figure 26(a) and (b). Surface temperature of (a) CNT coated fabric samples (b) CNP coated fabric samples.
Within 1 min of time interval, the samples T20 and C20 (CNT and CNP based conductive fabric) showed the gradual increase in the temperature around 87.4°C and 76.6°C respectively. A sudden increase in temperature was observed during the initial intervals of time, then it becomes slow and stable. The experiment lasted for 60 min and the samples showed steady readings (stable range in increased temperatures), for whole experiment i.e., 133°C and 120°C for T20 and C20 (CNT and CNP based conductive fabric) respectively, as shown in Figure 27. Recently, similar research was carried out to develop the CNTs coated cotton woven fabrics. Where, the CNTs coated cotton fabrics lose their heat bearing capacity within 220 s.
55
Meanwhile in the current experiment, the samples retain their heating capacity for almost 60 min and even after. Hamdani et al. presented another case in which the polymeric yarn was further modified with silver to mold into active conducive fiber and the material was tested with the parameter of varied potential voltage. The results showed the maximum temperature for the substance’s surface at 9 V, which was 107°C with 80 mm terminal separation. While in the current study, the conductive fabric samples retain their heating capacity for almost 60 min. Hamdani et al. presented another research work in which the polymeric yarn was further modified with silver and the material was tested with the parameter of varied potential voltage. The material showed the maximum temperature for the substance at surface about 107°C with 80 mm terminal separation at 9 V.
55
When the electric potential is applied actively on the material, the migration of charges starts. These potentially charged particles collide with each other resulting in the generation of heat inside the material. The study also showed that the increase in the voltage also increases the temperature of surface forming a direct relation between charge carrier, V and T.
56
Thermal response as a function of voltage (a) CNTs (b) CNPs coated textiles.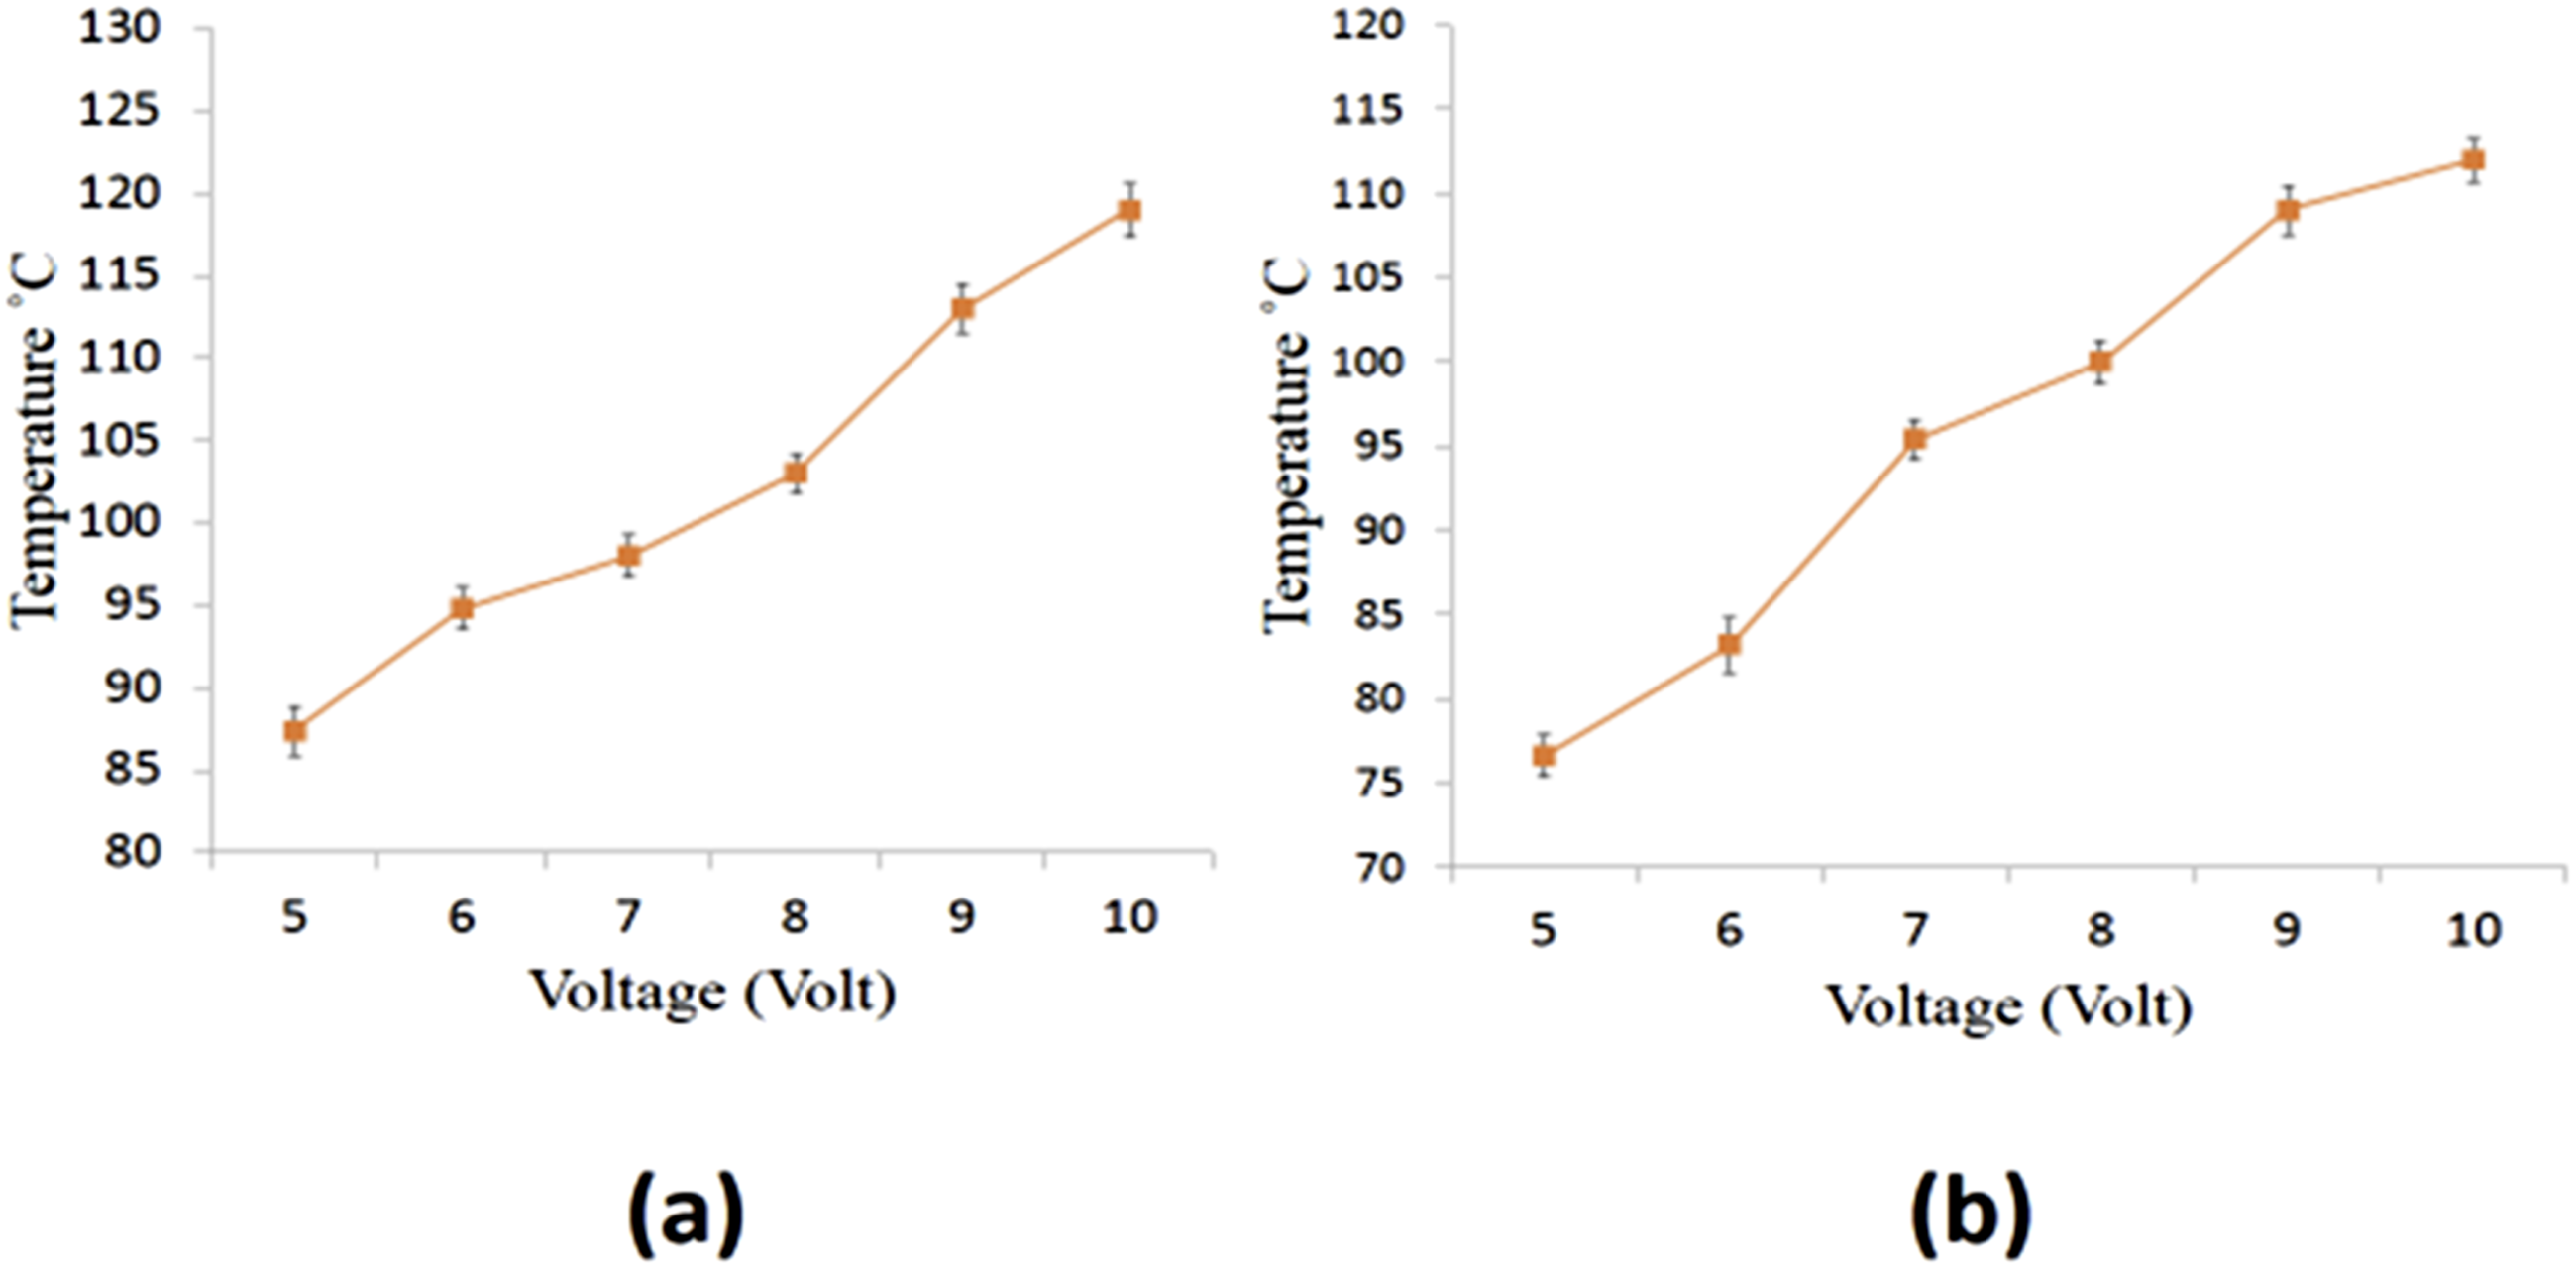
Furthermore, to assess the stability in heating of surface, temperature was recorded at various time intervals while keeping the voltage constant at 5 V. The experiment was prolonged up to 60 min and the recorded surface temperature remained constant during the whole experiment ensuring uniform distribution of temperature with a value of 133°C for T20 and 120°C for C20, respectively. While the maximum surface temperatures recorded during the experiments reached up to 133°C (for CNT-coated samples), no visible deformation or hardening of the fabric was observed during or after the heating process. However, we acknowledge that prolonged exposure to elevated temperatures may induce structural or mechanical changes in fabric substrates. Detailed mechanical or morphological characterization post-heating (e.g., SEM, tensile or flexibility tests) was not within the scope of this study but is recommended for future research to fully evaluate durability and thermal stability. Surface temperatures of conductive fabrics for the duration of 60 min (a) CNTs (b) CNPs coated textiles (c) setup for the measurement of surface temperature.
Thermal conductivity evaluations
ALAMBETA testing equipment has been used to measure thermal parameters.
57
Figure 28 shows the thermal conductivity results of CNPs and CNTs coated substrates. The thermal conductivity was measured against T17 to T20 and C17 to C20 fabric samples. The maximum thermal conductivities were again recorded for the samples T20 and C20. These samples previously showed good electrical conductivity performance and showed excellent thermal conductivity. The intrinsic thermal conductivities of carbon nanotubes and carbon black are 2000 W/mK and 174 W/mK respectively.
58
However, the reported thermal conductivities for nylon and cotton fibrous materials are 1.4 W/m⋅K and 0.17 W/m⋅K respectively.
57
Hence, the thermal conductivities of resultant fabrics coated with CNTs and CNPs were in the range of 0.7 to 1.1 W/m⋅K for CNPs coated textile, while 1.2 to 2.6 W/m⋅K for CNTs coated textile respectively. CNTs has a much higher thermal conductivity than CNPs, therefore even though the insertion concentration of conductive fillers was same. In a similar study, the highest thermal conductivity 0.126 W/mK was obtained from CB coated cotton fabric at 1 mg/ml CB concentration. However, further addition of CB affected thermal conductivity negatively, but thermal conductivities of coated fabrics were still higher than that of neat cotton fabrics.
59
However, the thermal conductivity values in present research are much higher about 2.9 W/mK for CNTs coated fabric and 1.1 W/mK for CNPs coated textile. Thermal conductivities of (a) CNPs coated textiles, (b) CNTs coated textile.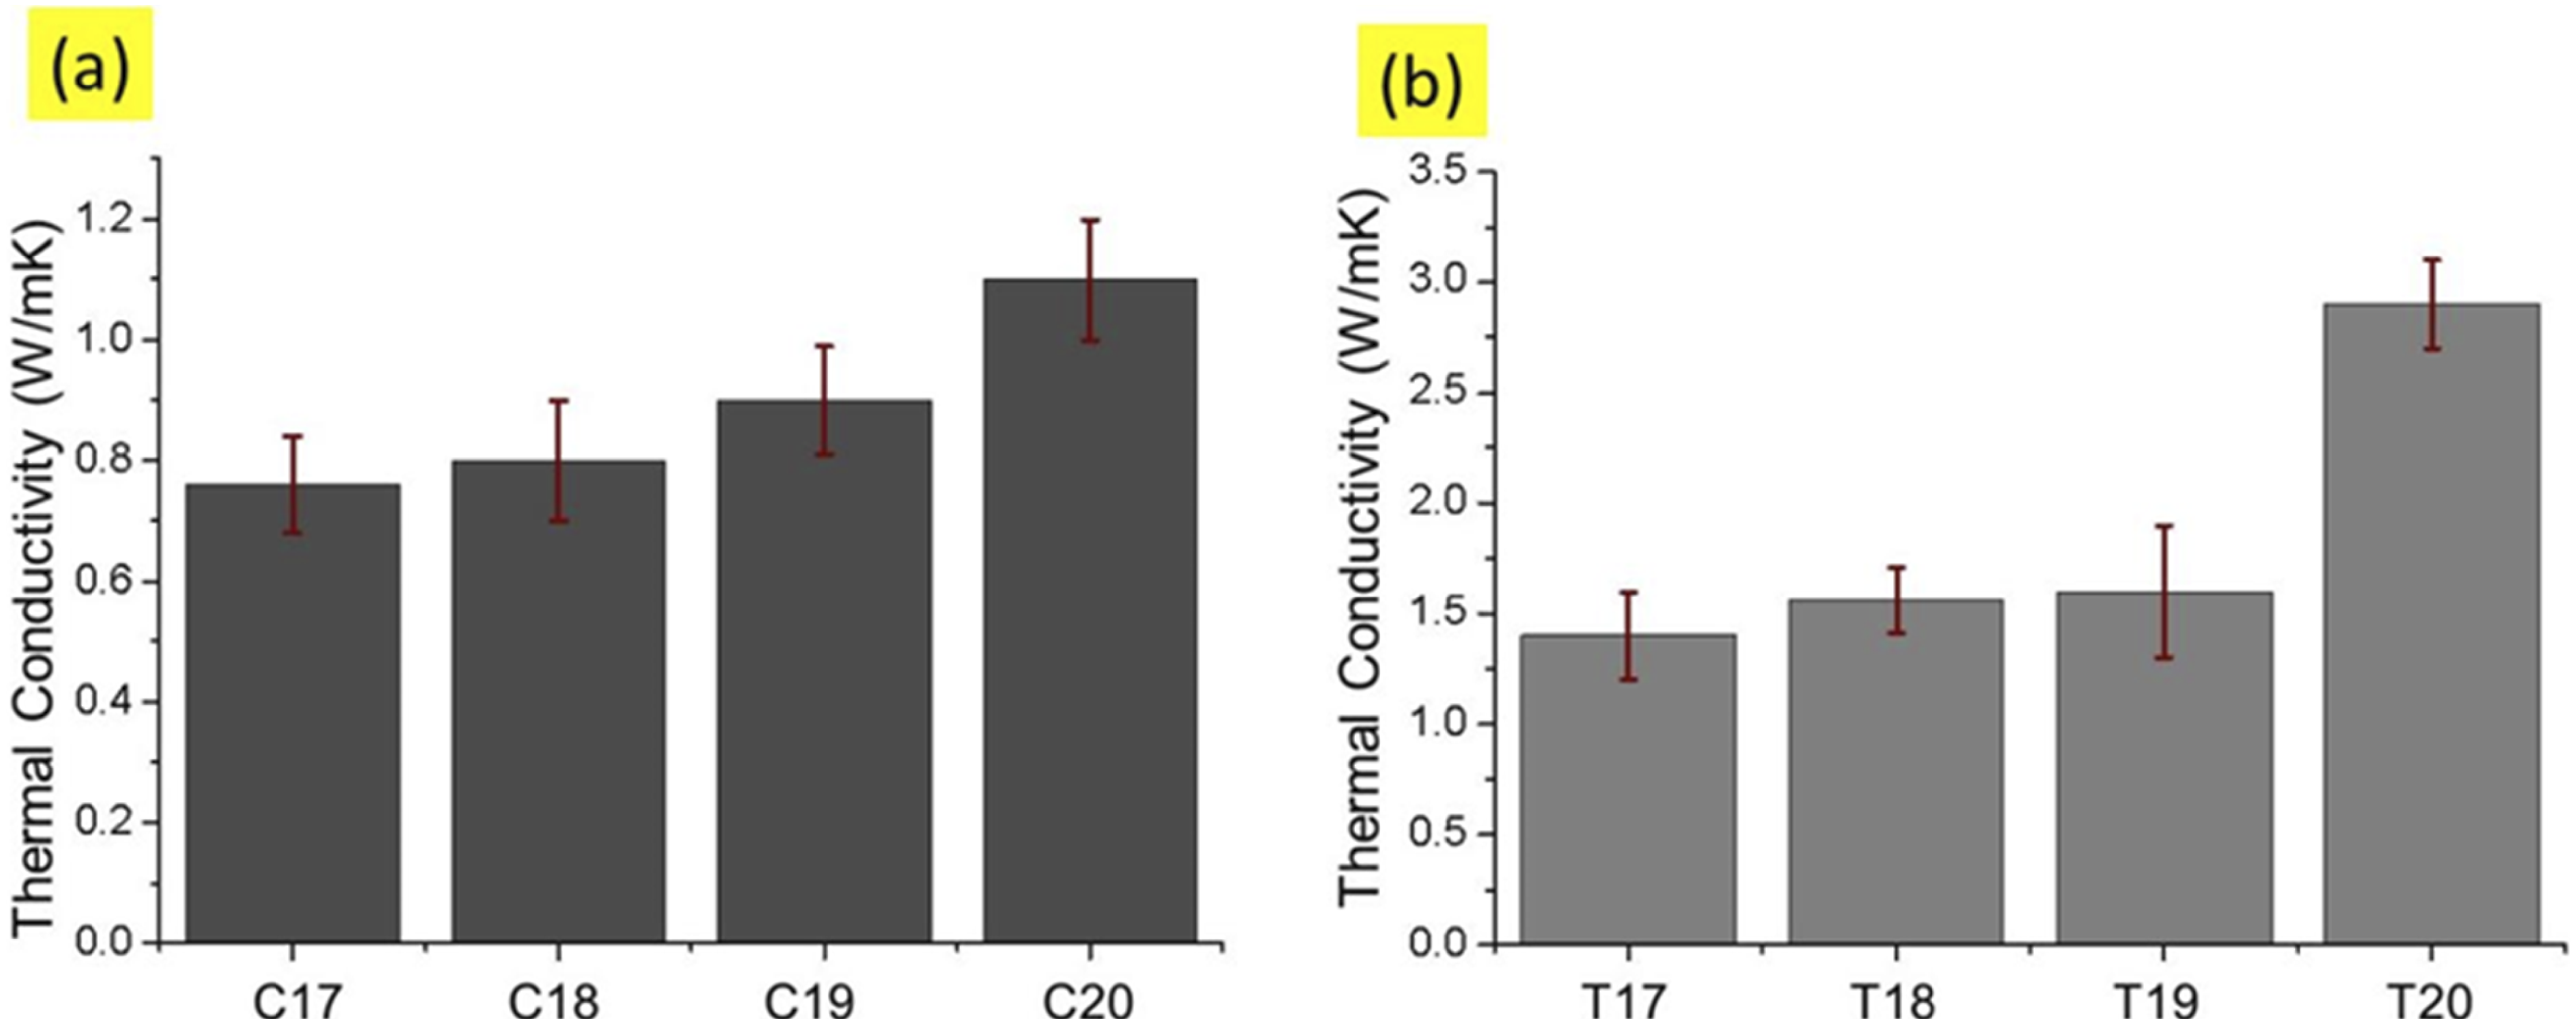
Furthermore, the comparative analysis between the thermal conductivities and ohmic heating was also performed. Thermal conductivity does not directly affect heat generation but significantly influences how heat is distributed in the material. However, in our fabricated materials the samples CNT 17 and C 17 are less electrically conductive, resulting in lower heat generation. In fact, if we raise power supply these samples start to burn (means their heat bearing capacity is low, due to less conductive paths or channels). Hence their noted thermal conductivity was also less about 1.6 W/mK for CNTs coated fabric and 0.7 W/mK for CNPs coated textile. While in the case of samples CNT 20 and C 20 the samples are more electrically conductive, which also produced more ohmic heating. Their thermal conductivity was observed to be higher due to their higher heat bearing capacity shown in Figure 29. Dependent behaviour of Thermal conductivity over Ohmic heating for (a) CNTs coated textile, (b) CNPs coated textile.
Durability of CNTs and CNPs coated textiles
In early discussion, it was mentioned that CNTs and CNPs interacted with non-conductive nylon fabrics to introduce electrical conduction system in nylon fabrics. There were micro-spaces in nylon fabric which restricts electrical conduction, CNTs and CNPs filled these micro-spaces, also stacked to make a conduction system. This behaviour of absorbance and adherence were further described by the durability of the electrical resistance of conductive fabrics against washing in water. These electrically conductive nylon fabrics were tested by soaking, squeezing and twisting in water. After testing with three steps in water, it was observed that CNTs and CNPs adhere firmly to conductive nylon fabrics and no peeling off occurred. Moreover, the adhesive scotch tape was repeatedly applied and removed from the fabric surface to visually assess the detachment of CNTs and CNPs. Transparent tape checked the adhesion property of conductive fabrics and evaluated that CNTs and CNPs were not visibly observed. This test concluded that electrically conductive nylon fabrics also showed mechanical adhesive properties. For further identification, post washing to test electrical resistivity of these fabrics was performed. Due to better electrical conductivity T20 CNTs coated fabric material and C20 CNPs coated fabric sample were investigated by ISO 105-C01 standard washing test. Figure 30 specifies that the electrical resistivity of the fabrics remains unaffected before and after washing, with only a minimal variation detected even under severe washing. It means that CNTs and CNPs are strongly incorporated into the fibrous structure. Washing durability of conductive fabrics.
Conclusion
This study successfully developed highly stretchable and durable electrothermal conductive fabrics using a simple solution dip-dry method for depositing CNTs and CNPs onto knitted fabric structures. The SEM analysis demonstrated that optimizing pH (6.5) and increasing the number of dips, the adherence and deposition of the CNTs and CNPs on the surface of fibre became steadier and more compact. The trend was also justified with the maximum weight gain percentage at 6.5 pH, which leads to reduce the electrical resistivity. The particle size distribution and dispersity reached a maximum stability (96 mV) with a pH range between 5.5 and 6.5, for both types of fillers (CNTs and CNPs). Higher electrical surface and volume resistivities were observed at higher pH and higher number of dipping cycles of fabrics into CNTs and CNPs solution. At acidic pH the knitted fabric (Nylon), having amino groups, goes through the process of protonation causing the formed ammonium cation to react with sulfonate ions which eventually increases the affinity among CNTs, CNPs as well as fibres using ion-exchange process. Moreover, on each pH level resistivity decreased with increasing number of dips, and eventually gets stable between dip number three and 4. However, the sample T20 (composed of CNTs) and sample C20 (composed of CNPs) showed the minimum resistivity (surface and volume) than all developed samples. This is because these samples were developed under the advantages of both parameters, (1) pH at 6.5 (2) having more no of dips, say four dips. In comparison between resistivity, CNTs have lowest value of resistivity (surface and volume) as compared to CNPs treated fabric samples. The reason is that CNTs have high aspect ratio and more contact points as compared to CNPs. So CNTs can make easily conductive network. The conductive fabric showed stability in electrical resistivity values with increase in stretching of samples (stable up to 70% stretch). The developed fabrics also exhibited promising electromagnetic shielding effectiveness, with maximum shielding values up to 17.5 dB for CNTs, which is moderate and may be applicable in low-to-moderate EMI environments such as wearable electronics or personal medical sensors. 54 Furthermore, thermal performance evaluation over a temperature range of 30°C to 130°C highlighted their suitability for advanced applications. The thermal conductivity was measured against T17 to T20 and C17 to C20 fabric samples. The maximum thermal conductivities were again recorded for the samples T20 and C20. These samples previously showed good electrical conductivity performance and showed excellent thermal conductivity. Thermal conductivity influences heat distribution rather than generation, with CNT-coated fabric showing 1.6 W/mK and CNP-coated textile 0.7 W/mK. These results suggest that the optimized conductive textile structures could be integrated into wearable heating devices, stretchable EMI shielding layers in flexible electronics, or temperature-regulating garments for sports and thermal management applications. The durability and flexibility demonstrated here also make them promising candidates for next-generation smart textiles in commercial wearable platforms.
Footnotes
Author contributions
Conceptualization, Jiri Militky, Methodology, Azam Ali, Software Jiri militky, Investigation Mohanapriya Venkataraman, Validation, Jakub Wiener Writing – original draft, Azam Ali Visualization, Blanka Tomkova, Data curation, Supervision, Azam Ali, writing, review and editing, Blanka Tomkova, Jakub Wiener, Funding acquisition, Mohanapriya Venkataraman.
Funding
The authors disclosed receipt of the following financial support for the research, authorship, and/or publication of this article: This work was supported by the project “Advanced structures for thermal insulation in extreme conditions” (Reg. No. 21-32510 M) granted by the Czech Science Foundation (GACR). Funding was provided by Mohanapriya Venkataraman (Reg. No. 21-32510 M).
Declaration of conflicting interests
The authors declared no potential conflicts of interest with respect to the research, authorship, and/or publication of this article.
Data Availability Statement
Data will be available on request.