
Abstract
Core-shell nanofiber of silk fibroin as shell and blend of salicylic acid/poly(vinyl alcohol) as core was fabricated successfully via coaxial electrospinning. Effects of concentration, viscosity, and electrical conductivity of the core and shell solutions on the final diameter of nanofibers and release behavior of salicylic acid were studied by viscometry, electrical conductometry, ultraviolet spectrophotometry, scanning electron microscope and transmission electron microscope methods. Response surface methodology was used to predict the relation between average fiber diameter as well as release rate of salicylic acid with core and shell concentrations. Direct relation between final nanofibers diameters and shell solution concentration was observed, while increase in core solution concentration was not significantly affected the final diameter of electrospun nanofibers. According to the results of release profiles, ratio of component in core and shell are effective parameters in rate and profile of salicylic acid release from these structures. Response surface methodology analysis indicates that the nanofibers diameters are more responsive to the changes in shell solution concentration and the release rate of salicylic acid is responsive to the changes in both shell and core solutions concentrations.
Introduction
Drug-delivery systems in nano scale such as nano and micro particles, hydrogels, micelles, liposomes, and nano tubes are concerned recently. The difficulty with these systems is controlling the rate of release as well as the burst release, especially early in the release process. The most important parameter in application of drug release system is steady and controllable rate of release [1]. For this reason, preparation of new structures to develop the drug-delivery systems with controlled drug release rate is an important subject of research in the pharmaceutical science field. Among the developed technologies of drug-delivery systems, the core-shell structure has gained much attention. The core-shell structure enables a number of suitable features that makes it a good candidate for the controllable drug-delivery systems.
Electrospinning is one of the convenient methods that involve producing fibers by forcing polymer solution or melt under the electric field [2]. By this method, fibers can be applicable for filtrations [3], chemical and biological resistant textiles [4], electronics [5,6], tissue engineering, and drug-delivery systems [7]. Effective parameters in electrospinning are categorized in three major groups, including factors related to spinning solutions, electrospinning process, and operating environment [8–11]. Many modifications have been made in the basic electrospinning process in order to improve the structure and morphology of the electrospun nanofibers. One of the important modifications is coaxial electrospinning process as a common method to fabricate core-shell bicomponent nanofibers [12–14]. In this process, two dissimilar fluids are delivered independently through a coaxial capillary and drawn to form nanofibers in core-shell structure [15]. Parameters such as nozzles size, applied voltage, volume ratio of flows, immiscibility of core and shell, viscosity, and electrical conductivity of fluids play an important role in final morphology of the core-shell structures [16]. Although coaxial electrospinning may be considered as a simple and straightforward process, the fiber formation mechanism is complex and production of nanofibers with desired and uniform diameter remains a challenge [17].
In the last few years, the coaxial electrospinning of micro and nano-sized fibers has been the subject of many investigations. In 2005, Zhang et al. reported the biocompatibility of the electrospun polycaprolactone (PCL)–collagen nanofibers in core-shell structure that is applicable in tissue engineering [18]. Coaxial electrospinning of silk sericin (Ss) and silk fibroin (SF) was subjected in 2012. The effect of process parameters on morphology and thermal properties of fabricated structures was considered by Hang et al. [19]. In 2013, electrospinning of core-shell structure of polyaniline (shell) and fibroin (core) for tissue engineering and its compatibility for cell culture was reported [20]. Maleki studied the modeling of release from core-shell structure of PLGA and PCL with tetracycline hydrochloride in core [21]. PCL fibers containing dipyridamole as drug with core-shell structure were produced in 2015 [22] and in the same year, core-shell structure of SF as shell and composite of hydroxyapatite as core was produced to fabricate a scaffold for bone cells culture [23].
In last decades, biocompatible and biopolymers have been used in medical fields and drug-delivery systems [24–26]. These polymers exhibit compatible properties for wound dressings [24, 25], drug-delivery systems [9], and also cell and tissue scaffolds [22, 27]. This group of polymers includes collagen, SF, lactide–glycolide copolymer, poly lactic acid, poly-glycolic acid, and PCL. This biopolymer demonstrated biocompatibility and biodegradability, so can be a useful for medical applications such as drug delivery and tissue engineering. Among these polymers, SF is a well-known biopolymer due to its attractive mechanical and biological properties [28,29]. The degradation rate for silk-based materials can be varying from several months to several years and its thermal stability is up to 250℃ [30].
The processing parameters of electrospinning and morphology of electrospun silk nanofibers have been studied by several researchers and a few studies are found about coaxial electrospinning of SF-based nanofibers [10]. In present study, coaxial electrospinning of nanofibers based on SF was considered due to importance of biocompatibility of SF. SF protein was used as shell and the core includes mixture of poly vinyl alcohol (PVA) and salicylic acid (SA) as a sample drug molecule. Using the design of experiments, the morphology of core-shell SF/PVA-SA nanofibers and distribution of fiber diameters were investigated in case of varying the concentration of core and shell. The main effects and the interactions of factors were studied by multiple regression analysis. Details for understanding of coaxial electrospinning of SF nanofibers were obtained and a quantitative basis for the relationships between morphology of electrospun fibers and the coaxial electrospinning parameters were reported using response surface methodology (RSM). These results would provide some basis for the preparation of silk nanofibers with core-shell structure and desired properties which are important in drug-delivery systems.
Experimental
Materials
Hybrid silk cocoons were purchased from Guilan East Silk Industry, Iran, SA (Merck, M = 138.12 g/mol), PVA (Merck, Mw = 145,000), sodium carbonate, ethanol, formic acid, calcium chloride (Merck), phosphate buffer saline (PBS, pH = 7.4), an anionic detergent (Sigma Aldrich, B2013), and cellulose membranes (Sigma Aldrich, D9527, molecular weight cutoff = 14,000) were used.
Methods
Fibroin extraction
SF was extracted from cocoons in several steps. To extract the fibroin from silk cocoons, degumming was carried out to remove sericin from silk fibers in the presence of anionic detergent and 2 g/L sodium carbonate in the distilled water bath for about 1 h at a temperature of 90℃. To dissolve silk fibers, ternary solvent system of water:ethanol:calcium chloride with the molar ratios of 8:2:1 at temperature of 65–70℃ was used. Purification and dialysis by cellulose tubular membrane in distilled water for 48 to 72 h were performed and the lyophilized carried out to achieve the regenerated SF.
Preparation of spinning solution
The SF was dissolved in formic acid in three concentrations 6%, 7%, and 8% as shell solutions. The solutions were stirred for 8 h at medium speed and then used. Core solutions were blends of SA in ethanol (3% W/V) and PVA in distilled water in three concentrations (3%, 6%, and 9% W/V). The prepared core solutions were injected into the electrospinning system after homogenization.
Viscometery and electrical conductivity of the solutions
Viscosities and electrical conductivities of prepared solutions for electrospinning were measured by a viscometer (Brokfield Viscometer, LVDV II +, USA) and conductivity meter (Sartorius, professional meter pp-20, Germany), respectively at ambient temperature.
Electrospinning
In order to produce nanofibers with core-shell structure, an assembled coaxial nozzle was used. The nozzle consists of two different gauges of concentric metal needles. The inner diameter of needles was 0.413 mm (gauge 22) and 1.067 mm (gauge 17) for core and shell solutions, respectively. An infusion pump (WPI Inc, AL 1000), a high voltage power supply, and a fixed aluminum collector that placed at a distance of 10 cm from the nozzle, were used for electrospinning. The applied voltage was adjusted at 25 kV and feed rate was fixed on 1 μL/min for shell solutions and 0.3 μL/min for core solutions. All samples were electrospun at ambient temperature and relative humidity of 40–50%. Figure 1 illustrates the schematic diagram of used coaxial electrospinning apparatus.
Schematic diagram of coaxial electrospinning.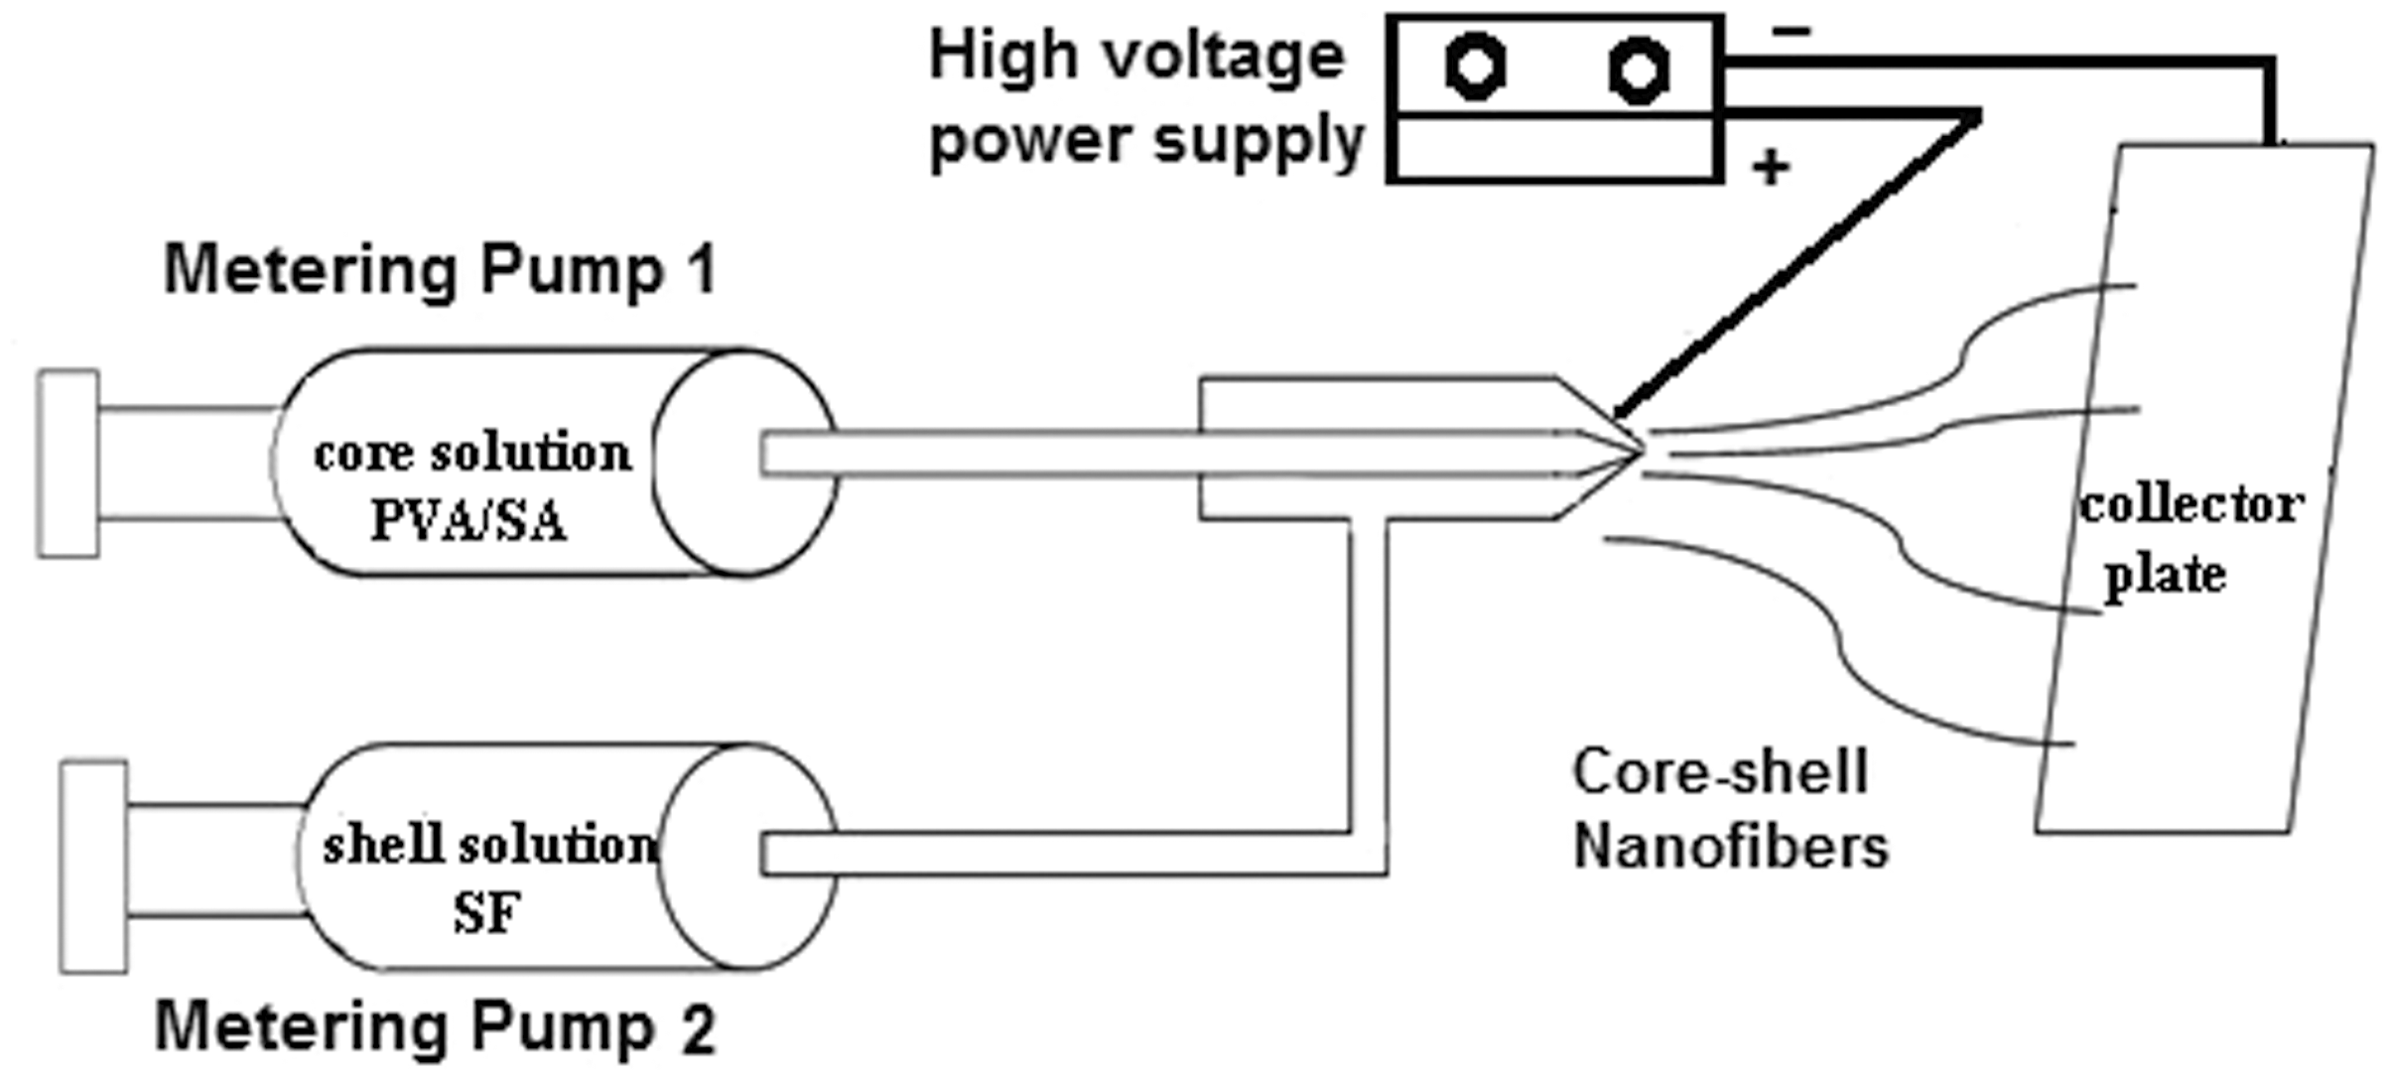
Drug release
In order to evaluate the release behavior of SA, the PBS (pH = 7.4) was used. Fifteen micrograms of fibrous layer were immersed in 15 mL PBS and sampling was done at the specific time intervals. For each sampling, 1 mL of solution was withdrawn and replaced with equal volume of fresh buffer solution. To evaluate the amount of released SA in each interval, the ultraviolet spectrophotometer (Cintra 10, USA) was used. The absorption peak of SA was detected at 228 nm. To convert the absorption data to the cumulative concentration of release SA, calibration curve was calculated and demonstrated in Figure 2.
Calibration curve for calculation of cumulative concentration from absorption data.
Electron microscope
Morphologies of electrospun core-shell nanofibers were examined by scanning electron microscope (SEM; CamScan MV2300, Czech and England). Prepared images were analyzed via image J software and diameter of 100 fibers was considered and reported as. Transmission electron microscope (TEM; Zeiss EM 10C, Germany) was used to show formation of core-shell structure for electrospun nanofibers.
Experimental design
RSM is a statistical method to evaluate the relation between several input variables and one or more output response. The main idea of RSM is to use a set of experiments to obtain the optimal response. Several experimental data have been considered to obtain the model for our study. Two parameters consist of shell concentration in three levels (6%, 7%, and 8%) and core concentration in three levels (3%, 6%, and 9%) as X1 and X2 was coded, respectively. Two defined responses for the study were average fibers diameter and SA release rate. To calculate the release rate, the maximum amount of released SA for each sample was divided to period of time of release test (8 h) so the data of release rate were obtained and used in RSM method.
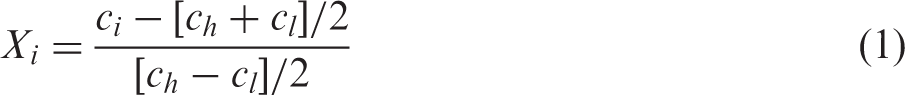
In order to achieve the maximum data for adjusting the model, the coded values were calculated by equation (1). Where Xi is coded value, ch and cl refer to high and low level of ci as variable, respectively.

Experimental factors and responses.

Results of viscosity and electrical conductivity of solutions.

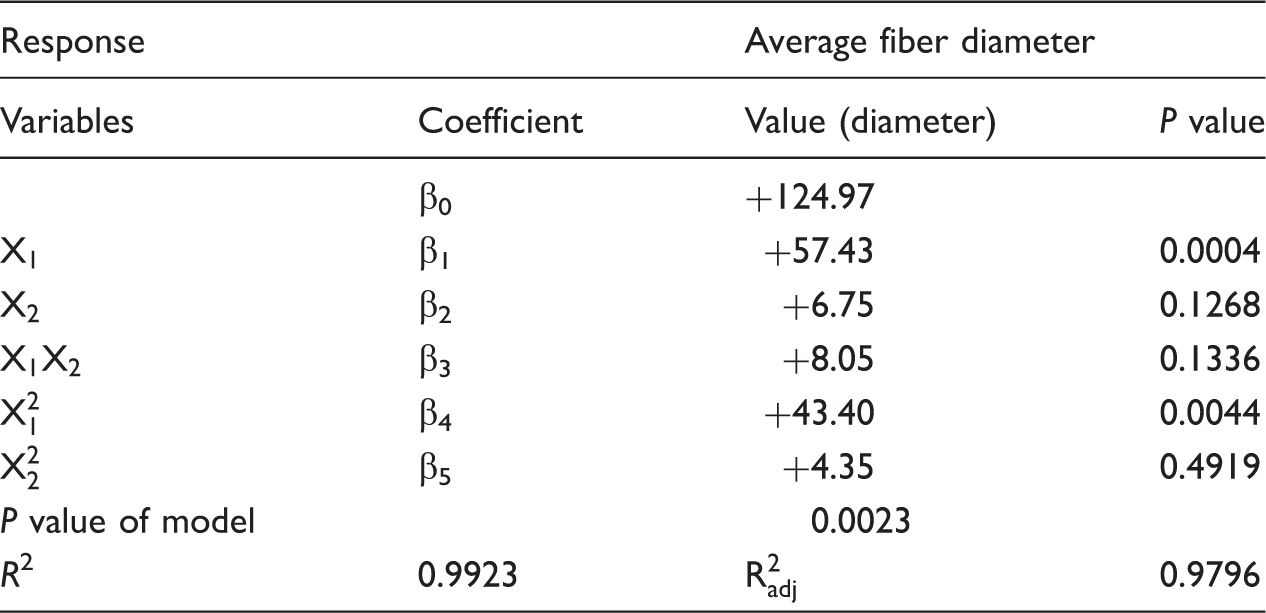
Regression analysis of two factors and coefficients of the model for average fiber diameter in coded form.
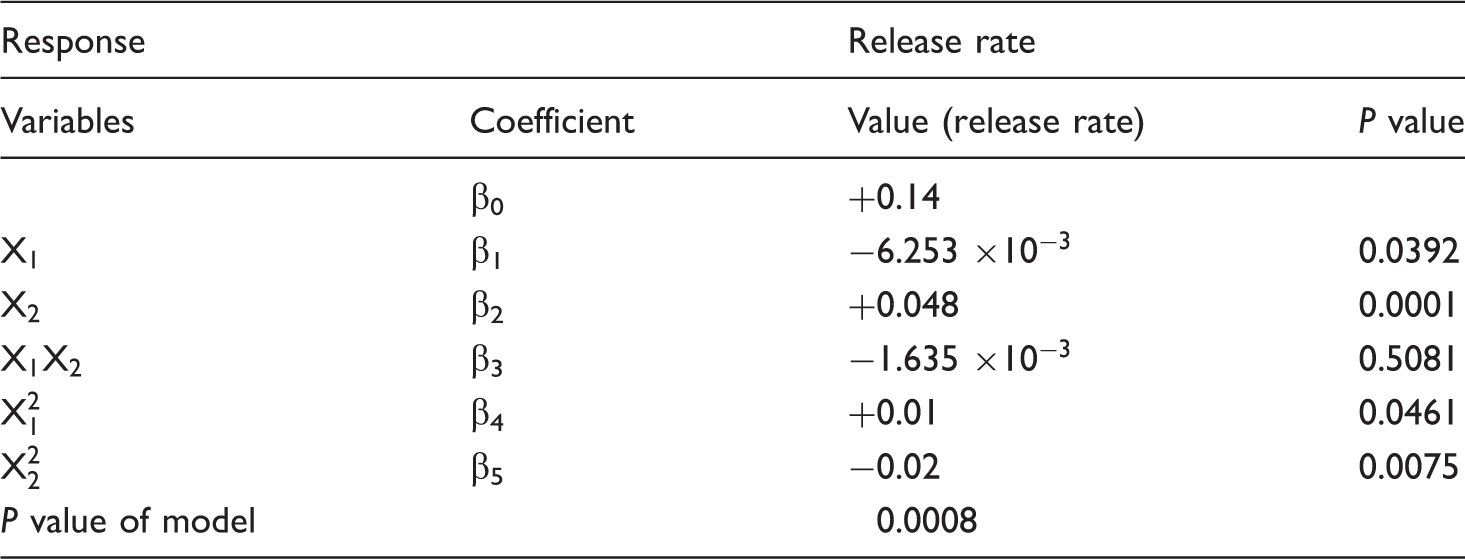
Regression analysis of two factors and coefficients of the model for release rate in coded form.
Results and discussion
Viscosity of electrospinning solution
Three groups of solutions were evaluated in this study, the first group was SF solution in formic acid in three different concentrations (6%, 7%, and 8%), the second was PVA solution in water in three concentrations (3%, 6%, and 9%) and the third group was PVA mixture with a solution of 3% SA in methanol. The viscosity of SF solution in lower concentration than 6% is not sufficient for electrospinning because the electrospun fibers were not uniform and had beads in its structure. The mixture of PVA and SA was prepared in maximum 9% because the mixture in upper concentrations was not stable and homogeneous. Before electrospinning, viscosities of all solutions were measured and the results are presented in Table 2. As specified in this table, the viscosities of the solutions were increased, when the SF concentrations were increased in solutions, and the highest viscosity is related to 8% of SF solution that is equal to 2308 CP. As expected, the same trend in viscosity is observed in the second and third groups of the solutions. Increasing the PVA concentration from 3% to 9% results in increase of the solutions viscosities from 92.7 to 165.1 CP which is much lower than viscosities of SF solutions. Addition of SA to the PVA solutions led to a slight decrease in viscosities of the pure PVA solutions in all concentrations. In the common electrospinning process, when all parameters are constant, increase in solution concentration led to an increase in the diameter of electrospun fibers. The same trend also governs in the coaxial electrospinning [1,31].
Electrical conductivity of the solutions
Electrical conductivity of the electrospinning solution is one of the main parameters that significantly affects morphology and diameter of the electrospun nanofibers. To evaluate the effect of electrical conductivity of the electrospinning solution in core and shell, the electrical conductivity of the core (PVA/SA) and shell (SF) solutions are measured and the results are summarized in Table 2. According to the results of Table 2 with increasing SF concentration, in formic acid, electrical conductivity of the solution slightly decreased. In fact, the reduction of electrical conductivity with increasing concentration of polymer in solutions may be due to the nature of the polymer. Interactions of SF with the solvent in the solution cause reduction of electrical conductivity of the solution; it means that increasing the concentration of nonconductive polymers such as SF results in reduction in electrical conductivity of the solutions [27]. It should be noted that the electrical conductivity of SF solution in formic acid is more than electrical conductivity of pure formic acid. So it can be concluded that addition of SF increased electrical conductivity in compare of pure formic acid, and an increase in concentration of nonconductive SF due to its nature, causes a decrease in electrical conductivity to a certain extent. On the other hand, according to Table 2, with increasing the PVA and PVA/SA solutions concentrations, electrical conductivities of the solutions are increased. This observation is related to the interaction between polymer and solvent as previously discussed. Furthermore, it should be noted that electrical conductivities of PVA/SA (core solutions) in all concentrations are less than the electrical conductivities of SF solutions as shell.
Transmission and SEM images
TEM and SEM images of the fabricated core-shell electrospun nanofibers have been taken to observe formation of core-shell structure, uniformity, and diameter of nanofibers. TEM image of a sample of the fabricated core-shell nanofibers and its SEM image after release process are presented in Figure 3. The TEM image of coaxial electrospun nanofibers shows a distinct and uniform boundary between core and shell. This image and SEM image in Figure 3 confirm that the core-shell structure was successfully fabricated during the used coaxial electrospinning nozzle.
(a) TEM image of core-shell sample with 6% SF in shell and mixture of 9% PVA and 3% SA in core (b) SEM image from cross section of fiber after release of core component.
Effects of electrospinning parameters on diameters of the core-shell electrospun nanofibers in the coaxial electrospinning process were evaluated in two levels. The first level was related to concentration of SF in shell solution and the second level was related to concentration of PVA in core solution. Figures 4–6 show SEM images and distribution of diameters for coaxial electrospun nanofibers. These figures show cylindrical structure with smooth surface without defect in morphology for the coaxial electrospun nanofibers, which indicated appropriate concentration of the used core and shell in the coaxial electrospinning process of SF/PVA system. Figure 7 summarizes the effect of concentration of core and shell solutions on the diameters of the coaxial electrospun nanofibers. The results of Figure 7 suggest that with increasing SF concentration in the shell solutions from 6% to 8%, average diameters of coaxial electrospun nanofibers increase regardless of core solutions concentrations. Another level of the study is related to the constant SF concentration in shell when concentration of PVA in core solution is varied from 3% to 9% and in this case, Figure 6 shows a little and insignificant changes in the coaxial electrospun nanofibers diameters. For example, the diameters of nanofibers that were electrospun from 6% SF concentration in shell solution were 111.7 nm, 115.3 nm, and 114.5 nm when core solutions concentrations were 3%, 6%, and 9% of PVA, respectively. The similar trends were observed for the other coaxial electrospun nanofibers in 7% and 8% concentrations of shell solutions. However, for coaxial electrospun nanofibers in 8% concentration of SF as shell solution, when PVA concentration was increased from 6% to 9%, diameter of nanofibers were increased from 219.3 nm to 250.9 nm and this is the only sample that shows increase in the final diameter with an increase in concentration of core solution.
SEM images of electrospun fibers with SF 6% in shell, (1a, 1b) mixture of PVA 3% and SA 3% in core, (2a, 2b) mixture of PVA 6% and SA 3% in core, (3a, 3b) mixture of PVA 9% and SA 3% in core. SEM images of electrospun fibers with SF 7% in shell, (1a, 1b) mixture of PVA 3% and SA 3% in core, (2a, 2b) mixture of PVA 6% and SA 3% in core, (3a, 3b) mixture of PVA 9% and SA 3% in core. SEM images of electrospun fibers with SF 8% in shell, (1a, 1b) mixture of PVA 3% and SA 3% in core, (2a, 2b) mixture of PVA 6% and SA 3% in core, (3a, 3b) mixture of PVA 9% and SA 3% in core. Average diameter of core-shell fibers with increase of SF concentration in shell and SA 3%.


Increase in diameter of this sample may be attributed to the difference between viscosities of core and shell solutions. In the coaxial electrospinning, shell solution operates as a surround and guide for core solution, so the viscosity of shell solution is critical and should be sufficient to overcome the interfacial stress between two solutions to forms the steady compound Taylor cone [31]. In a constant applied voltage, due to the increase in the concentration and consequently viscosity of PVA (core) solution, ability of shell solution for applying tension to the core is reduced. Finally, applying less tension to the core solution increases the diameter of the core and ultimately increases the total diameter of the coaxial nanofiber structure. Thus increasing the concentration of the shell and core solutions simultaneously, results increase in the average diameters of the core-shell nanofibers. These results clearly showed the direct relations between the concentration of shell solution and SF/PVA core-shell nanofiber diameter. Even a little variation in the shell solution concentration affected the final diameter of core-shell nanofibers. But the concentration of PVA solution in core did not change the final diameter significantly. However, at higher shell and core solutions concentrations increase in core-shell nanofibers diameters may be observed with increase in the core solution concentration.
In electrospinning process, increase in electrical conductivity causes more distribution of electrical charge in the polymer solution, so more stretching is created according to electrical field of used power supply and eventually the diameter of fibers is decreased. The results in this study proved this relation between electrical conductivity and diameter of fibers. When the SF concentration was increased, the electrical conductivity decreased and the diameter of fibers increased finally.
Drug release
In this study, SA was used as a sample drug with small size of molecule, which is reachable and simple molecule. As the focus of this study is evaluation of release behavior of drug from fabricated structures, a sample drug was chosen and with concern to absence of side reactions between drug and polymers in structure, it seems that the release behavior is similar for the drugs in this class of size and molecular weight.
Cumulative percentage of released SA of fabricated samples was calculated using calibration equation and the results plotted versus time in Figure 8. These results suggest that at the beginning of the release process, SA is released more quickly and slower release occurs gradually and constantly over the time.
Cumulative concentration of released SA in samples with (1) SF 6% in shell, (2) SF 7% in shell, (3) SF 8% in shell and (a) mixture of PVA 3% + SA 3% in core, (b) mixture of PVA 6% + SA 3% in core, (c) mixture of PVA 9% + SA 3% in core.
Figure 8 indicates that in each series of fabricated core-shell nanofibers with constant SF concentration in shell increases the concentration of PVA in core composition and causes increase in amount of released SA. In the other words, when PVA concentration in core solutions increased from 3% to 9%, released SA was also increased due to the hydrophilic characteristic of PVA, which facilitates release of SA from the core-shell nanofibers. Because the release test performed in aqueous media (PBS solution), the hydrophilic characteristic of PVA in core controls the amount of released SA. Furthermore, PVA concentration in the core of nanofibers determines the maximum amount of released SA. Samples containing 3% PVA release up to 30% of SA content after 8 h but the use of 6% and 9% of PVA in core combination raise the release amount up to about 60% and 80%, respectively. On the other hand, by increasing the shell SF concentration, the release process can be controlled. In the fabricated SF/PVA core-shell nanofibers, the shell acts as an obstacle for SA, which prevents sudden release of whole amount of SA in specific time of study.
Response surface methodology
RSM was employed in order to predict the relation between average diameter of fiber as well as release rate of SA with core and shell concentrations. Main effect and interaction of the parameters were studied and the correlation coefficients (β0 to β5) in equation (1), P value, and R2 of studied model were obtained by regression analysis. P value explains the significance of each parameter and when it is less than 0.05, the factor has significant impact on the response factor. Therefore, if the P value was more than 0.05 for a parameter, it should be removed to improve the model. R2 is a statistical measure that shows how close the data are to fit regression.
According to the results of regression analysis (Table 3), the fitted quadratic equation for average diameter is given by equation (3). Where Y1 is average diameter of fiber, X1 is shell concentration, and X2 is core concentration of the electrospinning solutions.

The data suggest that the core concentration (X2 and
Figure 9 shows contour plot of core-shell nanofibers diameters. This contour plot indicates that the nanofibers diameters are responsive to the changes in shell solution concentration. Increase in the shell solution concentration results in nanofibers with larger diameters. Changing the shell concentration from 6% to 8% increases nanofibers diameters from about 111 to 250 nm. It may be concluded from Figure 9 that at lower shell solution concentration, diameter of nanofibers was increased slowly in comparison to higher concentration of shell solution. In the case of constant concentration of shell solution, variation in core concentration showed slight increase in fiber diameter although this increase is not as much as when the shell concentration was changed. It means that shell concentration is more effective parameter in final diameter in compare to core solution concentration. Furthermore, it is obvious that at higher concentration of shell solution, variation of concentration in core is more effective on final diameter in comparison to lower concentration of shell solution. For example in 8% of shell concentration, changing the core concentration from 3% to 9% varied the final diameters from 215 nm to 250 nm, but for 6% of shell nanofibers, diameters changed from 111 nm to 114 nm.
Contour plots of fiber diameters (nm) as a function of core and shell concentration.
RSM empirical modeling was employed as described previously for release rate of SA from core-shell SF/PVA-SA nanofibers as an output response. According to the results in Table 4, the fitted quadratic equation for release rate is given by equation (4). Where Y2 is release rate, X1 is shell concentration, and X2 is core concentration.

The RSM analysis suggests that the both core and shell concentrations are effective on release rate and behavior from the core-shell SF/PVA-SA nanofibers. This is concluded from P value that is lower than 0.05 for both shell and core solutions concentrations. P value of interaction term
Figure 10 shows contour plot of release rate of SA from core-shell SF/PVA-SA nanofibers. The contour plot indicates that the release rate is responsive to the changes in concentrations of both shell and core solutions. As the contour plot demonstrates, increase in the concentration of shell solution causes increases in the release rate slightly but when the concentration of shell is constant, increase in concentration of core leads to more release rate. It is worth to note that release rate of SA from the fabricated SF/PVA-SA core-shell nanofibers is more dependent to concentration of core solution rather than concentration of shell solution.
Contour plots of release rate (%/min) as a function of core and shell concentration.
Conclusion
The goal of this study is coaxial electrospinning of SF as shell and PVA-containing SA as a drug sample in core and studying the release behavior of fabricated core-shell structure. The effect of viscosity and electrical conductivity of the solutions on average diameter of core-shell fibers were studied. It is recognized that there is a direct and significant relationship between the final diameters of SF/PVA core-shell nanofibers and concentration of SF in shell solution, while increase in PVA concentrations in core solutions shows no significant change in final nanofibers diameters. This is related to differences in electrical conductivity and viscosity of shell and core solutions. Higher viscosities of SF shell solutions in comparison to PVA core solutions cause shell solutions (SF) to be more effective parameter than core solutions (PVA) on the diameter of SF/PVA core-shell nanofibers. Study of release rate of SA from core-shell nanofibers of SF/PVA-SA shows more release rate of SA from fabricated fibers with higher concentration of PVA in core solutions due to hydrophilicity of PVA. This trend is similar for all three concentrations of shell solutions. By increasing the polymer concentration in shell solution, release of SA is controlled. This means that increasing the concentration of the shell solution acts as a barrier that causes a gradual release of SA from core-shell nanofibers.
RSM was employed to predict the relations between average fiber diameter and release rate with core and shell solutions concentrations. It is concluded that shell solution concentration is the more effective parameter to control average diameter of core-shell nanofibers, whereas core solution concentration is the more effective parameter to control release rate of SA from SF/PVA-SA core-shell nanofibers. Therefore, types and characteristics of polymers in core and shell solutions, their hydrophilicity, viscosity, and electrical conductivity are effective on diameters and release behavior of core-shell nanofibers.
Footnotes
Declaration of Conflicting Interests
The author(s) declared no potential conflicts of interest with respect to the research, authorship, and/or publication of this article.
Funding
The author(s) received no financial support for the research, authorship, and/or publication of this article.