
Abstract
Tissue-engineered skin substitutes have great potential to treat chronic wounds and high-degree burns. Existing solutions, such as Integra Dermal Template, are extensively used for skin defects. However, these templates are still lacking in terms of recreating the functionality of the native tissue and providing scarless healing. In this study, polycaprolactone/silk fibroin (PCL/SF)-based nanofibers with varying blends were fabricated and characterized to develop a novel skin substitute. Morphological analysis showed that the nanofiber distribution of each sample was homogenous without showing any beads. In terms of mechanical properties, all the samples other than SF showed sufficient mechanical strength. It was observed that adding a specific amount of SF into the PCL nanofiber improves the tensile strength of the samples due to the introduction of intermolecular interactions from the functional groups of SF. In addition, incorporating SF into PCL improved Young’s modulus of the PCL nanofibers since SF provides stiffness and structural integrity to the overall structure. Water contact angle analysis was performed as the hydrophilicity of a biomaterial is a significant factor in cell functionality. Each sample had a contact angle between 33° and 48°, indicating the adequate hydrophilicity of nanofibers for advanced cell proliferation other than PCL. Cell proliferation and viability studies were conducted with the seeding of primary human keratinocytes on the samples. It was examined that scaffolds containing blends of PCL and SF resulted in higher cell proliferation and viability after 7 days compared to pure PCL and SF nanofibers.
Introduction
The skin is comprised of two layers called the epidermis and dermis. The epidermis is the thin outer layer containing keratinocytes that protect the body against bacterial infections and water loss. The dermis is the thicker inner layer that contains fibroblasts and is composed of extracellular matrix (ECM). It provides the skin with adequate mechanical strength and flexibility and allows homeostasis with its network system.1,2
Destruction of skin structure by mechanical and physical disruptions, burns, or diseases such as diabetes causes wound formation. In terms of thickness, wounds are divided into three: (1) superficial wounds involving only the epidermis and the papillary dermis, (2) partial thickness wounds containing the loss of both the epidermis and dermis, and (3) full-thickness wounds involving dermis, subcutaneous tissue, and sometimes even bone. As a part of the wound-healing process, the body tries to stop excessive bleeding and prevent bacterial invasion.3,4 Currently, deep wound and burn treatments are mainly based on (1) autografts, skin grafts taken from the same patient’s unharmed body part and applied to the wound area, and (2) allografts, skin grafts taken from another human and applied to the patient’s wound site. Even though autografts are better options than allografts, they pose drawbacks such as donor site morbidity and supply shortage.5,6 In addition, allografts possess problems such as biocompatibility which leads to tissue rejection or transmittance of several diseases.7,8 To solve these challenges, novel polymeric structures are constructed to obtain possible skin substitutes.
Electrospinning is one of the widely used methods for the fabrication of scaffolds. This technique allows the production of materials containing micro or nanostructures, which determine the fate of tissue formation.9 –12 An electrospun biomaterial possesses a high surface area to volume ratio providing a greater surface area for cells to attach, which is not observed in other production techniques. The high surface area also prevents fluid accumulation and improves oxygen permeation. Electrospun biomaterials can also minimize the foreign body reactions and provide a breathable environment with their network structure.13,14 These properties, when translated to the clinical field, allow for an improved recovery process, reduced healing time, and minimized possibility of scar formation.
Silk fibroin (SF), which is extracted from silkworm silk, is a natural protein utilized as a potential biopolymer for tissue engineering applications. SF is diversely used as a biomaterial for its advanced properties such as biocompatibility, biodegradability, high uptake of water and oxygen, and low immunogenicity.15,16 SF scaffolds also provide an efficient environment for cell proliferation and can be processed as fibers, nanoparticles, hydrogels, and sponges. However, SF suffers from low mechanical strength, and its electrospinning is possible only with limited solvents such as Hexafluoroisopropanol (HFIP). 17
Polycaprolactone (PCL) is a synthetic polyester commonly used in biomaterial applications. PCL has superior properties such as biocompatibility, high mechanical strength, non-toxicity, and easy electrospinning. Despite its outstanding properties, it also has disadvantages as a scaffold, such as its hydrophobicity, slow biodegradation time, and lack of recognition sites for cell proliferation. 18
Targeting aim of our ongoing research is to develop a thin (0.15–0.3 mm) ex vivo produced epidermal tissue equivalent that consisted of a stratified epidermis on an electrospun polycaprolactone/silk fibroin bioscaffold. In this study, we blended SF with PCL to produce a skin substitute for superficial wounds which can replace the papillary dermis layer of the skin by combining the advantageous properties of each polymer that could not be produced by using them individually. SF is used for its hydrophilicity and cell proliferation-inducing properties, 19 and PCL provides the structure with adequate mechanical strength and integrity. Here, we examined SF/PCL nanofibers regarding their mechanical strength, morphology, pore size, surface area, contact angle, thermal stability, and cytocompatibility.
Materials and methods
Materials
Silk fibroin (SF) was extracted from Bombyx mori cocoons provided from Bursa Kozabirlik, Turkiye. Polycaprolactone (PCL; Mw = 80,000), Na2CO3, LiBr, dialysis tubing cellulose membrane (molecular weight cut-off = 14,000), hexafluoroisopropanol (HFIP), trypsin solution, calcium chloride, and gentamicin was purchased from Sigma Aldrich, U.S. T-75 flasks were obtained from Corning, NY. Amphotericin B was purchased from Life Technologies, Grand Island, NY.
Preparation of the electrospinning solutions
Extraction of silk fibroin from the Bombyx mori cocoons
Silk fibroin extraction was performed according to the protocol described by Rockwood et al. 20 In summary, B. mori cocoons were cut into dime-sized pieces and silkworms were disposed. About 5 g of the cocoon pieces were degummed in 2 L of boiling 0.02 M Na2CO3 solution for 30 min. Cocoons were stirred occasionally during boiling to provide good dispersion of the fibers in the solution. It the end, silk fibroin was collected with a spatula and immersed in cold water to cool it down. Then, silk fibroin was rinsed by stirring it in 1-L distilled water three times for 20 min and dried at room temperature overnight. A 10 mL of 9.3 M LiBr solution was prepared and added to a 2.5-g fiber. Fibroin was dissolved in a 60°C oven and appeared in a transparent amber color. Silk fibroin solution was put inside a dialysis membrane to eliminate the excess LiBr. The dialysis was performed in 1-L distilled water and continued for 2–3 days, and the dialysis water was changed six times regularly (1 h after the dialysis started, after 4 h, that evening, the next day morning and evening, and lastly the morning of the following day). After the dialysis, the fibroin solution was put into 15-mL falcons and centrifuged at 2000 rpm for 10 min at 4°C. Then, the impurities were removed by transferring the pure silk fibroin into another falcon. Finally, the fibroin solution was lyophilized to remove water from the system for long-term storage of the silk fibroin.
Preparation of the polymer solutions
Silk fibroin is a natural polymer that is challenging to spin with most solvents, whereas HFIP solvent has allowed easy and well-distributed fiber formation for SF.21,22 For this reason, HFIP was chosen as the solvent system for both polymers to enable the effortless blending of SF and PCL solutions. In total, five polymer nanofibers were produced and characterized: 10%PCL (PCL), 5% SF (SF), 10% PCL:5%SF blended in 7:3 (v:v) ratio (PS1), 10% PCL:5% SF blended in 3:7 (v:v) ratio (PS2), and PCL:SF(7:3) on PCL:SF (3:7; PS2PS1).
PS1 solution was generated by first preparing two polymer solutions: 10% PCL (w/v) and 5% SF (w/v), by dissolving them in HFIP. Then PCL and SF solutions were mixed in the volume ratio of 7 and 3, respectively. PS2 solution was prepared similarly but it was blended in the volume ratio of 3 and 7, respectively. For PS2PS1, the spinning of 2.5 mL of the PCL:SF (3:7) solution on an aluminum foil was performed and then the electrospinning of 2.5 mL of the PCL:SF (7:3) solution was conducted on top of the first film.
Preparation of the nanofibers via electrospinning
Apparatus of New Era Pump Systems, Inc. was used for electrospinning polymer solutions. Each solution was loaded into a 5 mL syringe with an 18-G stainless needle (KRUUSE, Denmark), and then electrospinning was performed.
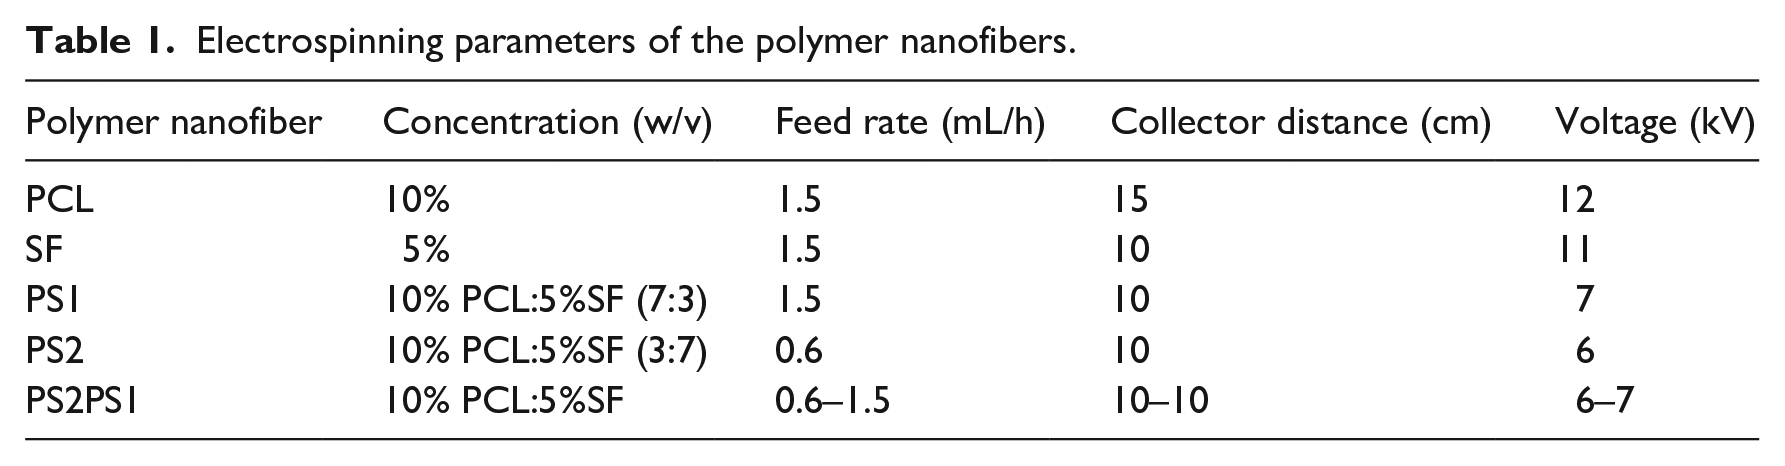
In order to obtain the most optimum nanofiber from each polymer solution (the most optimum Taylor’s cone, bead-free, and the cleanest fibers), varying parameters in feed rate, collector distance, and voltage were tried. Table 1 gives the most optimum parameters for the preparation of the polymer scaffolds. After the preparation of nanofibers, polymer films containing SF were immersed in 99% methanol for 30 min to transform them from water-soluble to water-insoluble form. Then nanofibers were rinsed with ultrapure distilled water several times and dried overnight.
Electrospinning parameters of the polymer nanofibers.
Extraction of primary human skin keratinocytes
The ethical committee of the Koc University School of Medicine approved the use of human skin tissues (report number: “019.253.IRB2.075”), and the informed consent of the donors was taken for research purposes. Full-thickness human skin was obtained from discarded tissues from two individuals after a breast reduction surgery. Keratinocyte cell strains were established using the previously performed method by Bayar et al.23,24 In summary, the digestion of skin tissues was carried out overnight at room temperature with a 0.125% trypsin solution. Enzymatically disintegrated tissues were plated on T-75 flasks at a density of 30–40 × 106 cells per T-75 flask. Cells were cultured in a serum-free chemically defined medium containing 0.375-mg/mL amphotericin B and 0.06-mmol/L calcium chloride, and 25-mg/mL gentamicin. Harvesting of primary keratinocytes was conducted when it was 70%–80% confluent, and the primary keratinocytes were subcultured subsequently.
Characterization of the polymer nanofibers
Fourier transform infrared spectroscopy (FTIR, Shimadzu-Infinity spectrometer, Japan) was performed to analyze the extracted SF structure. The analysis was conducted at room temperature in the 4000–500 cm−1 range with 2 cm−1 resolution.
The molecular weight of SF was detected by Sodium dodecyl sulfate-polyacrylamide gel electrophoresis (SDS-PAGE) with the Laemmli (1970) method using 10% resolving gel and 5% condensing gel. 25 In summary, the SF solution was mixed with a loading buffer and put inside hot water for a few seconds. Then samples were loaded into wells, and electrophoresis was run at 20 mA current at the beginning and was set to 40 mA for the rest of the experiment (Average time ~1.5–2 h). Finally, the electrophoretic profile of the SF was examined by comparing it to the standard protein ladder.
The morphology of polymer nanofibers was examined using Scanning Electron Microscopy (SEM) of LEO Supra 35 VP microscope (Zeiss, Oberkochen, Germany) after being coated with gold/palladium. Mean fiber diameter and fiber diameter distributions were determined using ImageJ software by choosing ~80 random fibers.
The mechanical test of samples was performed with a micromechanical testing device (UniVert, CellScale Biomaterials Testing) using a strain rate of 0.3 mm s−1. Testing was carried out at least two times for each sample with dimensions of 2 cm x 5 cm at room temperature.
Thermal stability and time-dependent weight loss were measured with the Thermal Gravimetric Analysis technique (TGA). The temperature was raised from 30°C to 600°C with a 10.00°C/min ramp rate under a nitrogen environment (Perkin Elmer, Waltham, MA, USA). The water contact angle test was used to determine the hydrophilicity of the nanofibers with a Drop Shape Analyzer 10 MK2 (KRUSS, Hamburg, Germany). Approximately 5 µL of water was dropped on the samples, and the sessile drop method was used to determine the water contact angles.
The pore size, pore volume, and surface area of the samples were determined with Brunauer–Emmett–Teller (BET) device and Barrett-Joyner-Halenda (BJH) analyses utilizing Quadsord SI 5 BET (Quantachrome Instruments, Anton-Paar GmbH, Graz, Austria). The analyses were conducted under a liquid nitrogen atmosphere (77K) with a nitrogen adsorbate gas using the pressure range of 0.01–0.99P/P0.
In vitro biodegradation of the samples was performed by exposing the samples to the Proteinase K enzyme. A 0.01% (w/v) Proteinase K solution was made in a 0.02 M Tris-HCL buffer with an overall pH of 8 and, lastly, 0.01% (w/v) sodium azide was added into the enzyme solution to prevent microbial contamination. Polymer scaffolds were cut into the weight of 4 mg with three replicates for each sample. Each prepared sample was put into 5 mL enzyme buffer solution and incubated at 37°C in two sets with 12 and 24 h. Following the 12 and 24 h, solutions were centrifuged and rinsed with distilled water to remove the remaining enzyme. Finally, scaffolds were lyophilized, and each sample was weighed to determine the in vitro biodegradation percentages.
Cell proliferation and viability were determined by conducting live/dead staining and XTT assays to determine the potential cytotoxic effect of the nanofibers on cells. Each sample was seeded with primary human epidermal keratinocyte cells (40,000 cells/nanofiber) to examine the cell survival on nanofibers. The cells were cultured for 7 days, and calcein-AM (4 μM, Molecular Probes, Thermo Fisher, UK) was used for the staining of the live cells, and ethidium homodimer-1 (EthD-1, 2 μM, Molecular Probes, Thermo Fisher, UK) was used for the monitoring of dead cells. A fluorescent microscope (Leica DMIL, Germany) was used to observe the cells at 488 nm (green) and 527 nm (red) wavelengths. An XTT assay (Biological Industries, USA) was conducted for further analysis. At the end of the 7 days of culturing of the primary human epidermal keratinocyte cells, nanofibers were rinsed, and XTT reagent (50 μL) was added to each sample. After incubation for 3 h, a microplate spectrophotometer (Multiskan Sky, Thermo Fisher, USA) was used for the absorbance measurements at 490 nm. Each measurement was repeated three times.
Statistical analysis was performed with the “Statistical Package for the Social Sciences 15.0” (SPSS Inc., Chicago, IL, USA). Statistical differences in terms of the proliferation assay of the experimental groups between the days second and seventh were examined by one-way ANOVA followed by Tukey’s postoc test. Statistical significances were set at p < 0.05, p < 0.01, and p < 0.001.
Result and discussion
Characterization of the SF solution
FTIR analysis was performed to determine the functional groups in SF; the spectrum is presented in Figure 1. Due to the presence of amide groups in the structure of SF, the successful extraction of SF can be validated by observing four characteristic amide peaks in the spectrum. The peaks shown at 1642, 1517, 1232, and 3282 cm−1 correspond to the Amide I band (C=O stretching, β-sheet), Amide II band (NH deformation and CN stretching, β-sheet), Amide III band (CN stretching/NH bending, β-sheet), and Amide A (NH bending, β-sheet), respectively.26,27
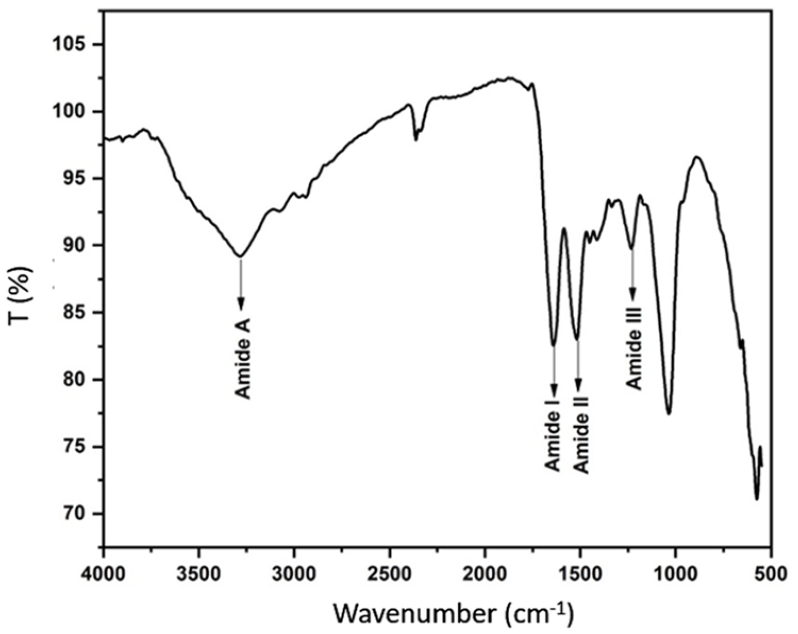
FTIR spectrum of the SF.
Determining the molecular weight of SF is essential to identify the polymer’s degradation and electrospinning properties. The SDS-PAGE electrophoresis method was used to determine the molecular weight of the SF extracted from B. mori cocoons (Figure 2). The SF column showed a smeared stain starting from 60 kDa and was observed to exceed the 250 kDa mark, which meant that the extracted SF had a molecular weight ranging from about 60 kDa to over 250 kDa.
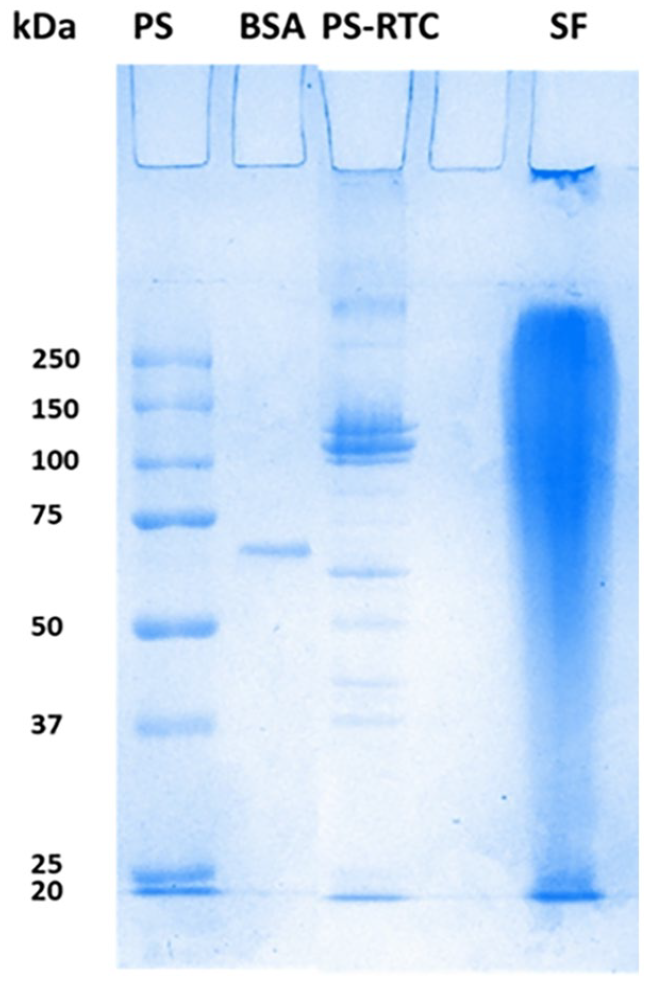
SDS-PAGE analysis of SF.
Morphological characterization of the polymer nanofibers
Producing scaffolds that resemble the extracellular matrix of the native tissues is a great challenge to overcome. So, evaluating the morphology of the polymer nanofibers is essential to determine the ability of scaffolds to support cells and lead to enhanced proliferation. 28 Figure 3 shows the prepared polymer nanofibers’ obtained SEM images and diameter distribution. The fibers were distributed homogeneously, and none of the five nanofibers exhibited beads. It was due to the HFIP solvent, which allowed easy and well-distributed fiber formation for each polymer. In addition, dissolving the polymers with HFIP created more concentrated solutions and allowed better control over fiber diameters. 29
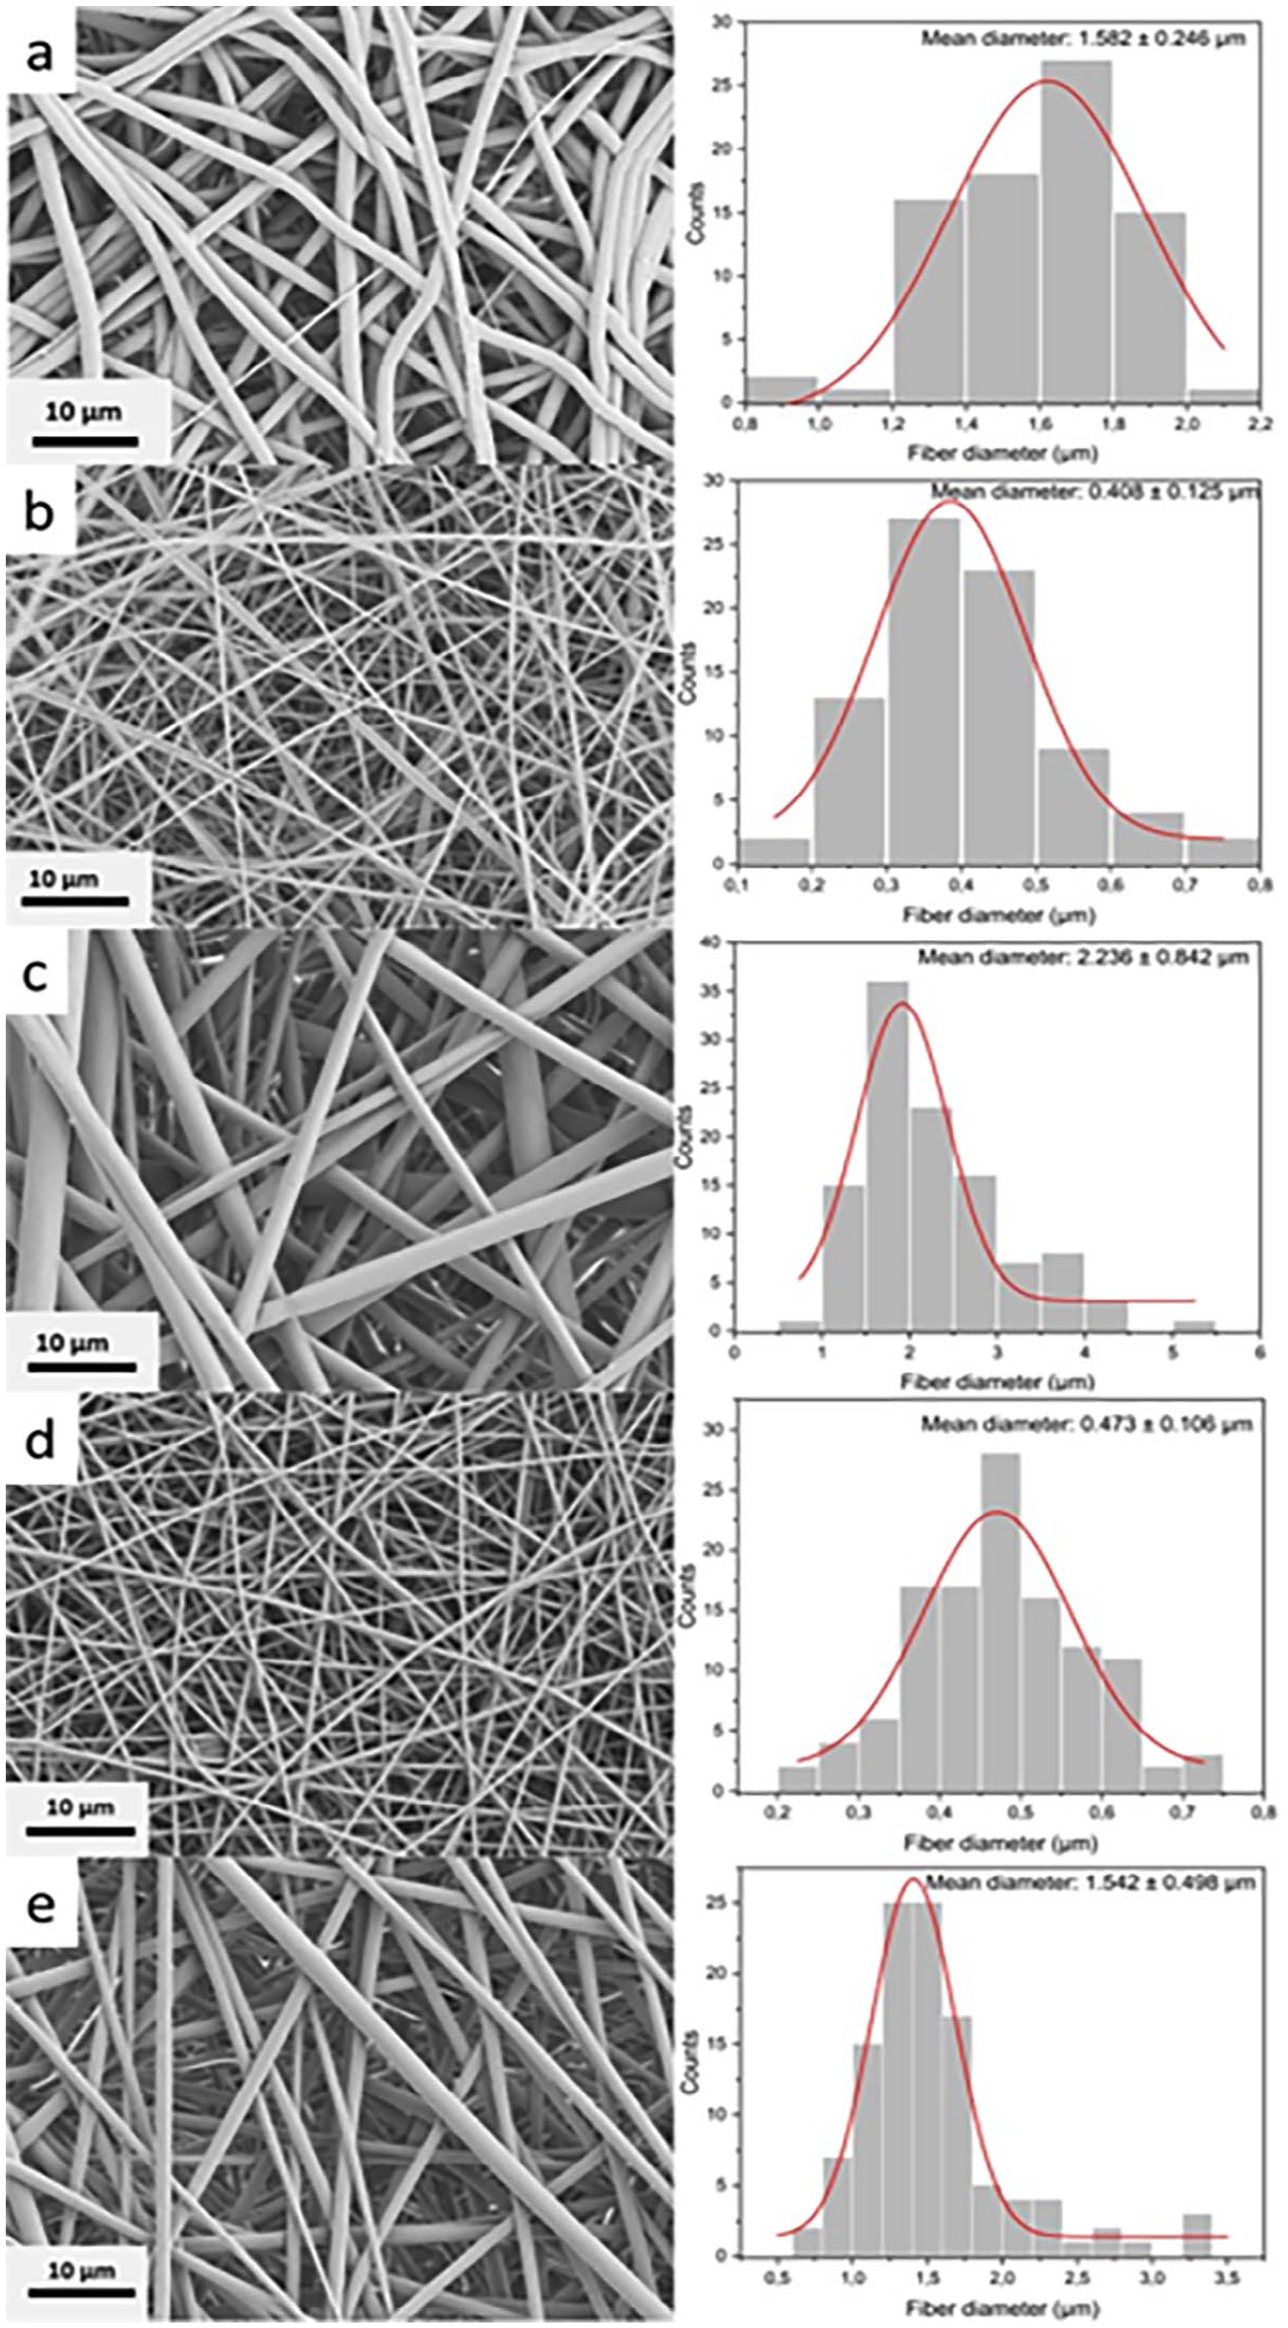
SEM images of nanofibers and their histograms showing the distributions of fiber diameters: (a) PCL, (b) SF, (c) PS1, (d) PS2, and (e) PS2PS1.
Regarding fiber diameter, PCL nanofibers demonstrated thick fibers with a mean fiber diameter of 1.582 ± 0.246 µm and had a comparatively non-uniform diameter distribution (Figure 3(a)). Pure SF electrospuns (Figure 3(b)) formed the thinnest fibers with a mean diameter of 0.408 ± 0.125 µm. This may be caused by the high conductivity of the bioactive SF and the low viscosity of the polymer solution in comparison. 30
PS1 had the greatest fiber diameter with a mean fiber diameter of 2.236 ± 0.842 µm (Figure 3(c)) and showed the most remarkable fiber diameter distribution difference among the fibers. Its fiber diameter was even greater than that of the pure PCL nanofibers could be attributed to the lower voltage applied during electrospinning compared to pure PCL. 31 PS2 contained thin fibers, with a mean diameter of 0.473 ± 0.106 µm (Figure 3(d)), as it was composed of a polymer solution with a higher SF ratio, which led to the lower viscosity of PS2 compared to PS1.
In a study conducted by Gandhimathi et al., 32 it was observed that the addition of SF decreased the mean fiber diameter from 215 to 164 nm when the electrospinning parameters were kept constant. This finding supports the claim that SF produces thinner fibers. In our study, SF also possessed thinner fibers than PCL, whose electrospinning parameters were also almost constant. However, the same effect was not observed in PS1, as it obtained a greater diameter after adding SF. This could be caused by the differences in voltage during electrospinning; using a lower voltage led to thicker diameters even after the incorporation of SF. So, the effect of SF addition on nanofiber diameter cannot be explained directly, as other parameters affect the fiber diameter, such as voltage, feed rate, and distance between the collector and the metal tip.
On the other hand, PS2PS1 possessed a mean fiber diameter of 1.542 ± 0.498 µm (Figure 3(e)). The second layer of PS2PS1 was made up of PS1; this layer was most readily observed with SEM. However, it is likely that some of the fibers from the lower layer (PS2) were also observed under SEM, which led to mean diameter measurements between PS1 and PS2.
Thermal gravimetric analysis
TGA was used to determine the thermal stability and temperature-dependent weight loss of the electrospun scaffolds. During analysis, the temperature was increased from 30°C to 600°C with a 10.00°C/min ramp rate under the N2 atmosphere. Figure 4 depicts the temperature-dependent weight loss of the samples. All samples except PCL experienced an initial weight loss between 30°C and 300°C, attributed to the water evaporation and residual solvent from samples. Initial weight loss of samples SF, PS1, PS2, and PS2PS1 were 20%, 6%, 14%, and 8%, respectively. 33 It was observed that as the PCL content increases in the blends, the water evaporation amount decreases. This could be correlated to the fact that SF possesses hydrophilic -OH groups, which interact with water, in contrast to the hydrophobic nature of the PCL. 34 It was observed in Figure 4 that SF started decomposition at around 300°C due to the decomposition of SF macromolecules through the breakage of peptide bonds and mitigation of the intermolecular interactions. 35 In addition, PCL showed a fast decomposition at around 400°C.
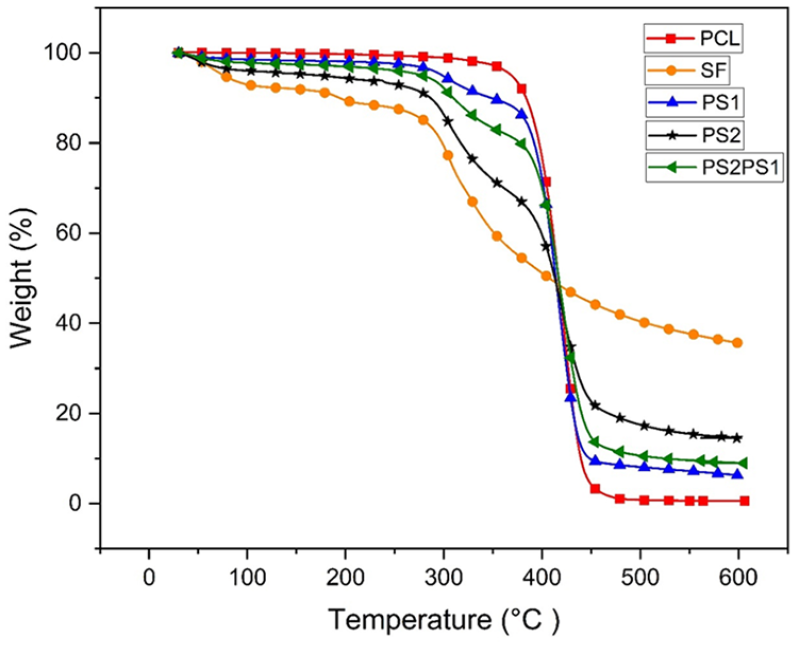
TGA analysis shows nanofibers’ weight percentage change with increasing temperature.
Other nanofibers containing both polymers showed both decompositions at temperatures 300°C and 400°C proportionally to the ratio of polymer content they contain. For example, PS2 showed 26% weight loss from 300°C to 400°C and 45% loss after 400°C. On the other hand, PS1 exhibited 23% weight loss from 300°C to 400°C and 66% loss after 400°C. As the SF amount decreases in the blend, the weight loss percentage between 300°C and 400°C also decreases. Accordingly, the weight loss after 400°C, which mainly represented the PCL decomposition, was even more significant for PS1 than that of PS2. Finally, PS2PS1 experienced a similar decomposition amount to PS1.
Bajsić et al. experimented with PCL/SF fiber blends and observed a three-step decomposition. Similarly, they associated the weight losses before 100°C, between 100°C and 350°C, and after 350°C with water evaporation, SF decomposition, and PCL decomposition, respectively. 34 In a different study, Luo et al. 33 produced blends of SF/Polyurethane, and the thermal characterization of the samples showed decomposition between 250°C and 400°C corresponding to the disintegration of the SF macromolecules.
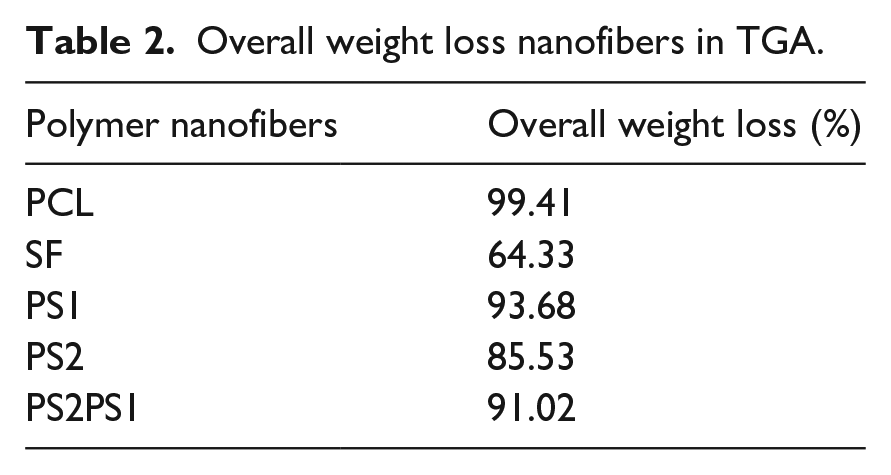
The overall weight loss of the compositions is given in Table 2. According to the percentages, the lowest weight loss was observed in pure SF nanofiber, with 64.33%. Pure PCL experienced the highest weight loss, with 99.41%.
Overall weight loss nanofibers in TGA.
Mechanical properties of polymer nanofibers
Nanofibers are required to obtain adequate mechanical strength to substitute a skin structure in the human body. 32 To further characterize the mechanical features of the samples, tensile strength tests were carried out. In Figure 5, five nanofibers’ stress versus strain curves were compared and Table 3 shows the mechanical properties of the scaffolds in comparison to Young’s modulus of real skin. Pure SF possessed a Young’s modulus of 64.9 MPa, which was the highest among the other samples indicating that SF can resist the force the best before failure among all the samples. The maximum tensile stress of SF reached 1700 kPa, but it failed suddenly at the tensile strain of around 5%. On the other hand, PCL had a Young’s modulus of 10.1 MPa and maximum stress of 1300 kPa.
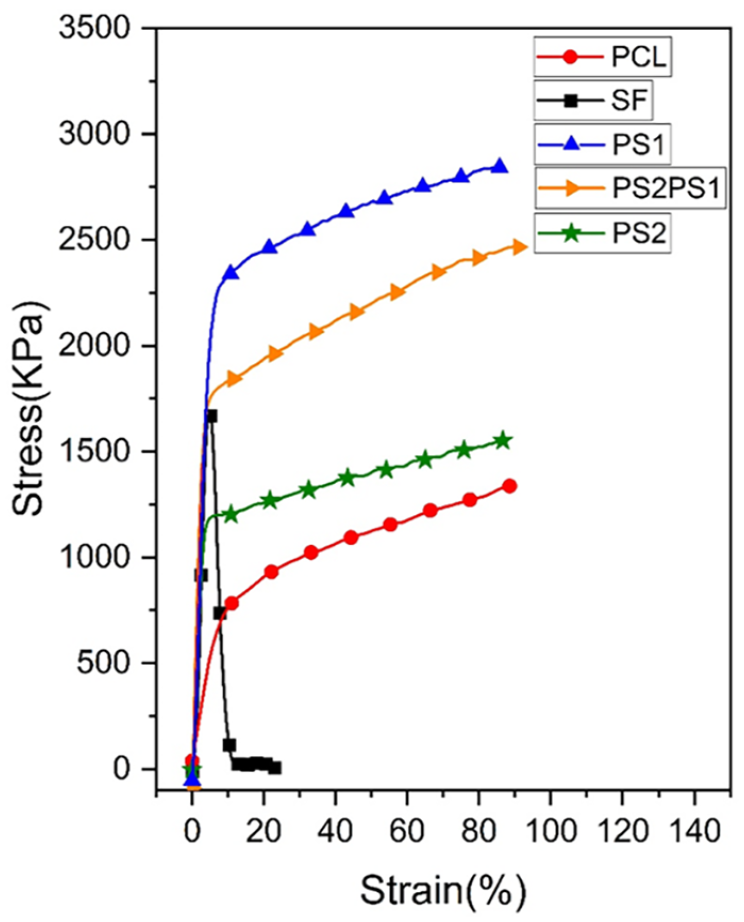
Stress vs. strain curve of nanofibers.
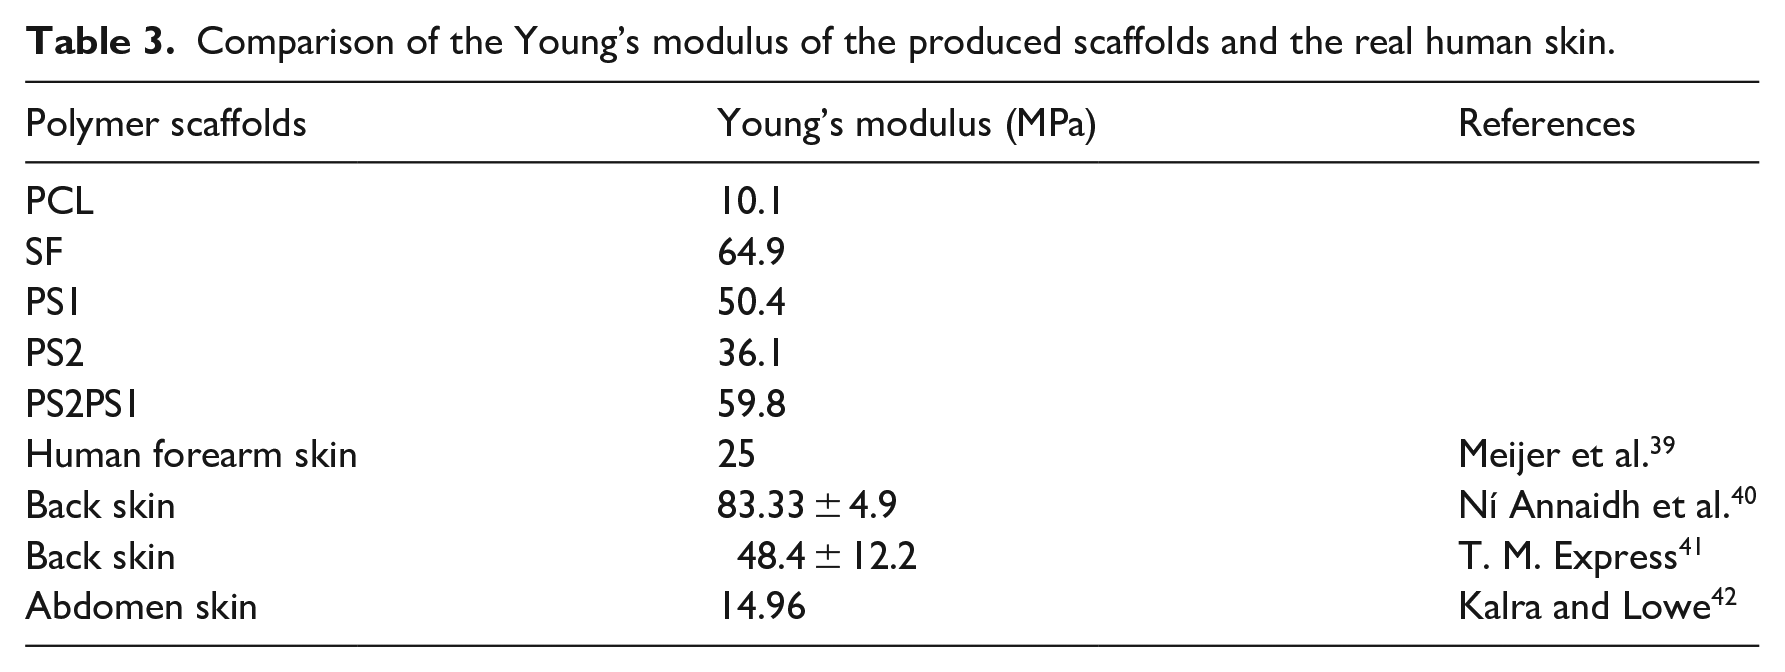
Comparison of the Young’s modulus of the produced scaffolds and the real human skin.
Incorporating SF into PCL increased Young’s modulus to 50.4 MPa and the maximum tensile stress to 2800 kPa in PS1. PS2 also possessed a higher mechanical property than PCL, like Young’s modulus of 36.1 MPa and a maximum tensile stress of 1500 kPa. Overall, it was observed that adding SF into the PCL nanofiber improves the tensile stress of the nanofibers. This could be caused by the formation of a physical connection between PCL and SF fibers, as the deposition of SF fibers onto PCL fibers produced an SF-nanofiber membrane between the thicker PCL microfibers, improving mechanical strength. 36
The increase in Young’s modulus in PCL via the incorporation of SF might be caused by the increase in stiffness from the SF structure and the SF’s role in enhancing the structural integrity of nanofibers. 37
In a similar study performed by Fadaie et al., adding chitosan into PCL improved Young’s modulus of the electrospun 5.4 times, from 6.06 ± 1.4 to 32.9 ± 4.4 MPa. This mechanical improvement was attributed to the intermolecular interactions between PCL molecular chains and chitosan nanofibrils, which also possesses peptide backbone in its structure like SF. 38
Lastly, PS2PS1 possessed a Young’s modulus value of 59.8 MPa and the maximum tensile stress of 2500 kPa. Overall, it can be concluded that PS2PS1 demonstrated a good performance as it had high tensile stress and was one of the highest Young’s modules among the samples.
Various studies are conducted on the mechanical properties of skin, and the results differ according to the sample type, age, sex, and the region the tissue is acquired. In a study performed by Meijer et al. 39 on the forearm skin of humans, Young’s modulus was found to be 25 MPa under a uniaxial tensile test similar to Young’s modulus of the sample PS2. Ní Annaidh et al. 40 measured Young’s modulus of skin tissues excised from the back of people, at 81–97 years old, as 83.33 ± 4.9 MPa, greater than all the samples in this study. In another study performed by Gallagher et al. 41 on back skin tissue, Young’s modulus was between 48.4 and 118.2 MPa. Lastly, Ankersen et al. 42 measured Young’s modulus of the abdomen skin to be 14.96 MPa. The mechanical properties of various skin tissues differ as there are distinctions in age, sex, and region of the tissue excised. However, overall, it could be stated that the mechanical properties of the nanofibers in our study were comparable with the values provided in the literature.
Contact angle measurements
Hydrophilicity is an essential parameter in tissue engineering that affects the adhesion of cells and, consequently the distribution of cells in scaffolds. Cells mostly prefer to attach and grow on hydrophilic surfaces and poorly adhere to hydrophobic materials. 43 Nutrients, biomolecules, and wastes diffuse through nanofibers more in hydrophilic materials, leading to improved cellular function. If the water contact angle of a material is smaller than 90°, it is considered a hydrophilic material; if it is greater than 90°, it is called hydrophobic. 44 Figure 6 gives the water contact angles of the nanofibers. PCL had a water contact angle of 119.1 ± 2.53°, making it hydrophobic (Figure 6(a)). On the other hand, SF was highly hydrophilic with a contact angle of 37.9 ± 4.94° (Figure 6(b)). The high hydrophilicity of SF comes from hydroxyl (–OH) and hydrophilic amide (–CONH) groups of SF. 34 The contact angle of PS2 was 36.7 ± 6.17° (Figure 6(d)) and was lower than the contact angle of PS1 with 33.7 ± 1.53° (Figure 6(c)), which was expected since PS1 has a higher PCL content than PS2, making it more hydrophobic.
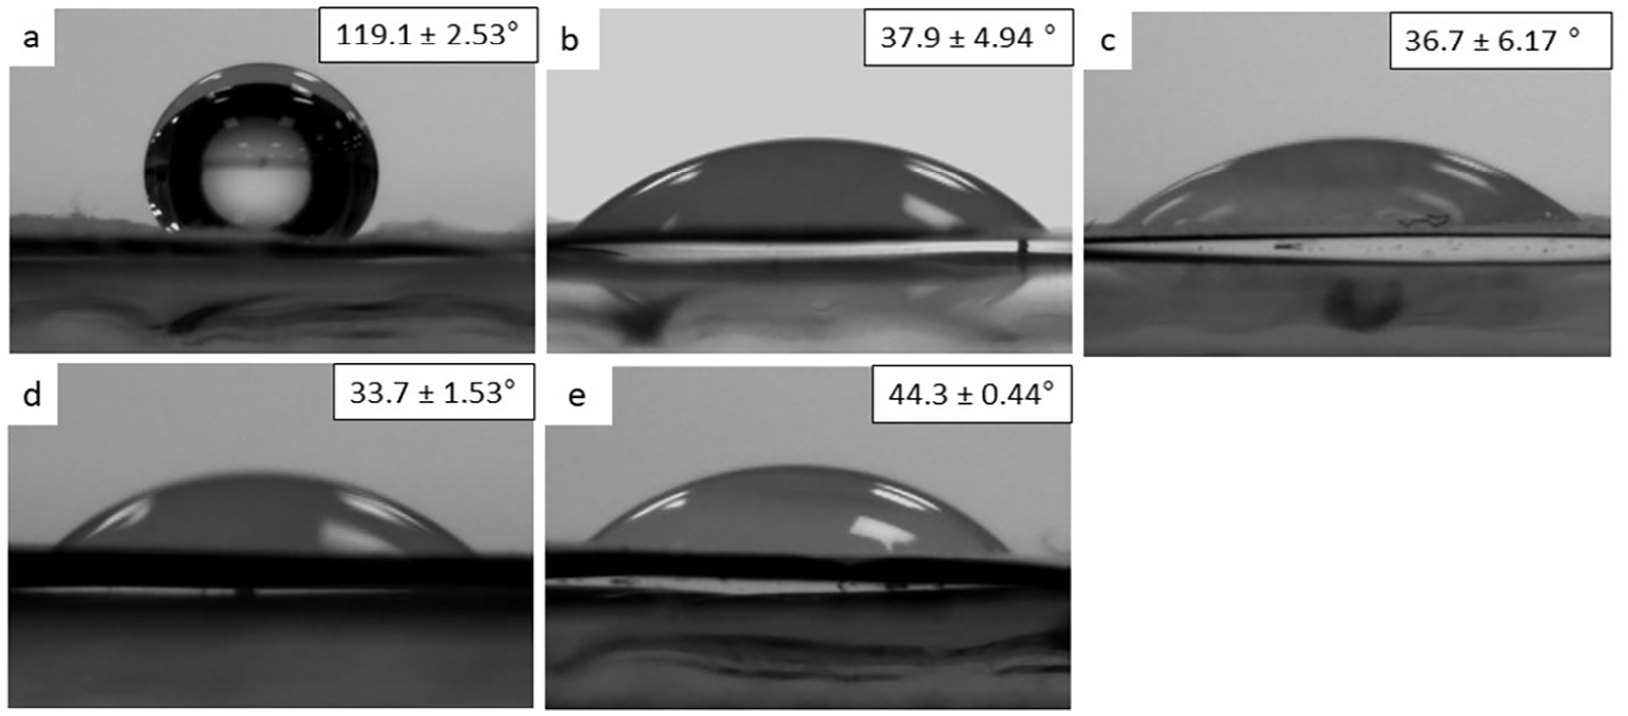
Contact angle of nanofibers: (a) PCL, (b) SF, (c) PS1, (d) PS2, and (e) PS2PS1.
SF was expected to have a smaller contact angle than PS1 and PS2 since SF is more hydrophilic than PCL. Nevertheless, an inverse scenario was observed, and PS1 and PS2 showed greater hydrophilicity than SF. This could be caused by the differences in surface roughness which is another property that affects the hydrophobicity of a material. Li et al. described that if the roughness increases in a hydrophilic material, it becomes more hydrophilic. 45 Accordingly, it could be inferred that the surface roughness of PS1 and PS2 was greater than SF, which could be caused by the fiber distribution. The contact angle of PS2PS1 comes from the fiber’s upper layer, which is PS1 and was 44.3 ± 0.44° (Figure 6(e)). However, the contact angle of PS2PS1 was much more significant than PS2. It was again concluded that the roughness of PS2 fibers was higher than PS2PS1, making the PS2PS1 sample more hydrophobic.
On the other hand, since hydrophilicity also affects protein adhesion and adsorption, it should be taken into account for choosing the most appropriate scaffold. According to the previous studies, it is stated that hydrophilic surfaces promote cell attachment and hydrophobic surfaces induce binding of surface adhesion proteins that signal the cells for the attachment. 46 It was found that super-hydrophilic (with a contact angle <5°) and super–hydrophobic (with a contact angle >150°) materials cannot promote cell attachment and growth. This could be attributed to the surface wettability affecting the binding strength, conformation and the type of the adsorbed protein from the media which promotes the cell attachment overall. If the surface is super-hydrophobic, the proteins in the ECM like collagen, laminin, and vitrein are adsorbed to the surface in a denatured form and with an unsuitable geometry. Similarly, super-hydrophobic surfaces prevent the cell adhesion mediator binding which blocks the cell adhesion on the surface. So, a key factor in inducing cell attachment on the scaffold surface is to have a moderate amount of hydrophilicity to promote both the adherence of the surface adhesion proteins and consequently the cell attachment. 47 Overall, all nanofibers are suitable for use as a scaffold other than PCL due to its hydrophobicity.
Pore size and surface area analysis of polymer nanofibers
Pore size is a significant parameter in scaffolds for cell proliferation and migration. Small pore sizes lead to inadequate cell migration that causes restricted nutrient diffusion and insufficient waste removal. On the contrary, large pore size creates a limited surface area that restricts the required area for cells to grow. The pore size and surface analysis of nanofibers were conducted using BET analysis, which are given in Table 4. All samples appeared to have sub-micron pore radius of around 17.3 Å with slight differences due to concentration and varying spin parameters. The surface area of nanofibers was evaluated with BJH surface area and Multi-point surface area methods. According to BJH analysis, the most significant surface area was PS2 with 13.929 m2/g and the smallest was pure PCL with 1.688 m2/g. Similarly, according to the Multi-point surface area analysis, PS2 had the most significant surface area of 15.637 m²/g, and pure PCL had the smallest surface area of 2.435 m²/g. It can be concluded that an increase in SF content in the scaffolds causes an increase in the surface area of the nanofibers.
BET analysis of nanofibers.
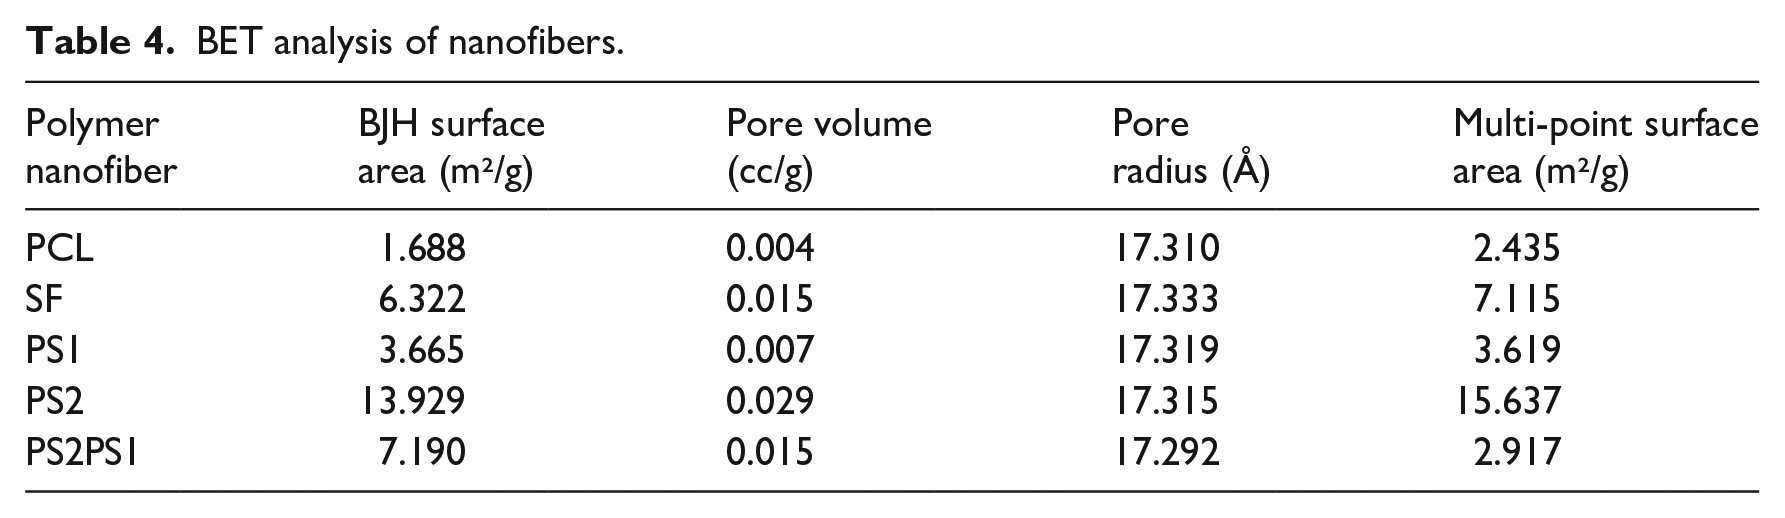
According to Chen et al., 48 this could be correlated to the fact that fibers with uniform and smaller diameters lead to higher surfaces, and in fact, PS2 had one of the most minor mean diameters and had the most uniform fiber distribution among the scaffolds according to the SEM analysis. In another study, Can-Herrera et al. examined the effect of applied voltages on the fiber diameter and surface area of the produced nanofibers. They observed that PCL nanofibers with higher surface areas were obtained with higher applied voltages due to decreased fiber diameters. 49
The PS2PS1 sample possessed a surface area of 7.190 m²/gm²/g, according to the BJH surface area method, between the surface areas of PS1 and PS2. The reason was that PS2PS1 comprised both PS1 and PS2 nanofibers layer by layer leading to a surface area in between. Regarding pore volume, PS2 attained the most significant volume with 0.029 cc/g, and PCL had the smallest pore volume of 0.004 cc/g.
In vitro biodegradation
Scaffolds should possess an adequate biodegradation rate to let the existing tissue replace the substitute via regeneration. 50 Biodegradation profiles of the samples after 12h and 24 h are given in Figure 7. Proteinase K enzyme breaks SF polymer chains into smaller fragments (i.e. peptides and amino acids). 51 On the other hand, PCL biodegradation occurs mostly via surface erosion. 52 Figure 7 shows the biodegradation rate of the scaffolds. It was observed that PCL had the lowest degradation rate with 7.50% and 14.80% after 12 and 24 m²/gh, respectively. Similarly, PS1 showed the second lowest biodegradation rate after PCL with 12.93% and 20.17% after 12 and 24 h, respectively, as its composition contains more PCL than SF. In contrast, SF decomposed completely after 6 h and there was no remaining fiber left at the end of 12 m²/gh. The reason for the high degradation effect of Proteinase K on SF is attributed to the attacking of the enzyme to peptide bonds. Proteinase K attacks peptide bonds and protein fragments are degraded into smaller fractures and the β-sheet structures are turned into random coils and α-helices. 53 PS2 also exhibited a high degradation percentage with 51.09% and 58.70% after 12 and 24 h, respectively, because of its high SF composition. PS2PS1 experienced a biodegradation rate between PS1 and PS2 since its composition contains both PS1 and PS2. Its biodegradation was 31.67% and 46.17% after 12 and 24 h, respectively.
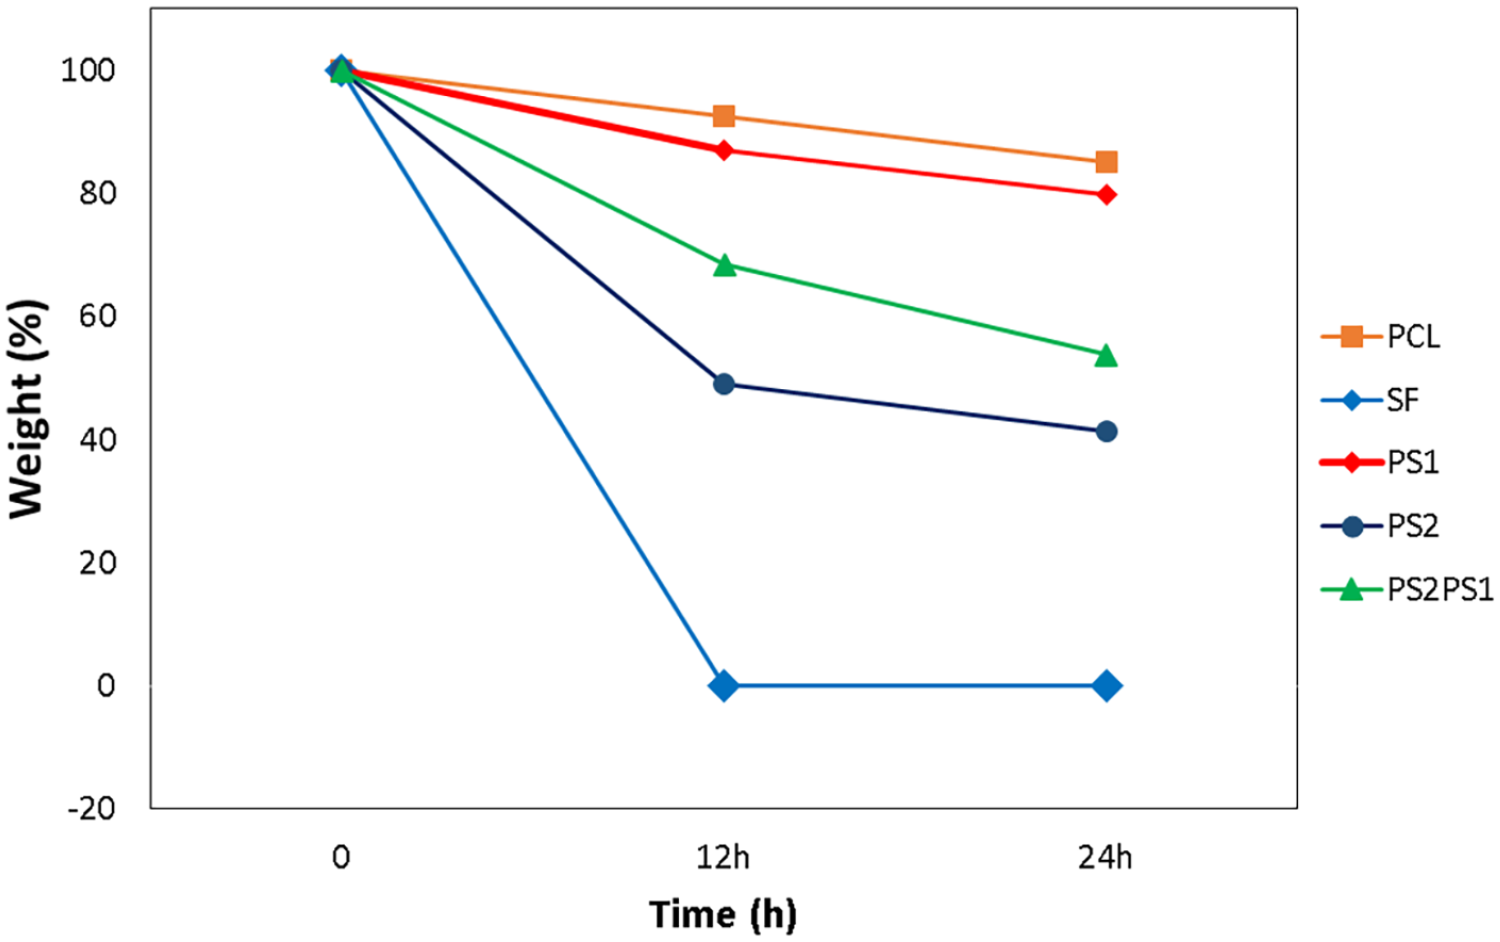
Biodegradation profile of the polymer scaffolds after 12 and 24 h.
Cell proliferation and viability
The proliferation and viability rate of primary human epidermal keratinocyte cells (40,000 cells/nanofiber) on the produced nanofibers were assessed using calcein-AM and EthD-1 staining. For this purpose, primary human epidermal keratinocyte cells were seeded onto PCL, SF, and PS2PS1 samples, and the viability of the cells was examined. After 2 days, the viability of the cells improved, and low cell death was observed, indicating the cytocompatibility of all scaffolds (Figure 8). It was observed that all samples allowed homogenous growth of cells through the scaffold.
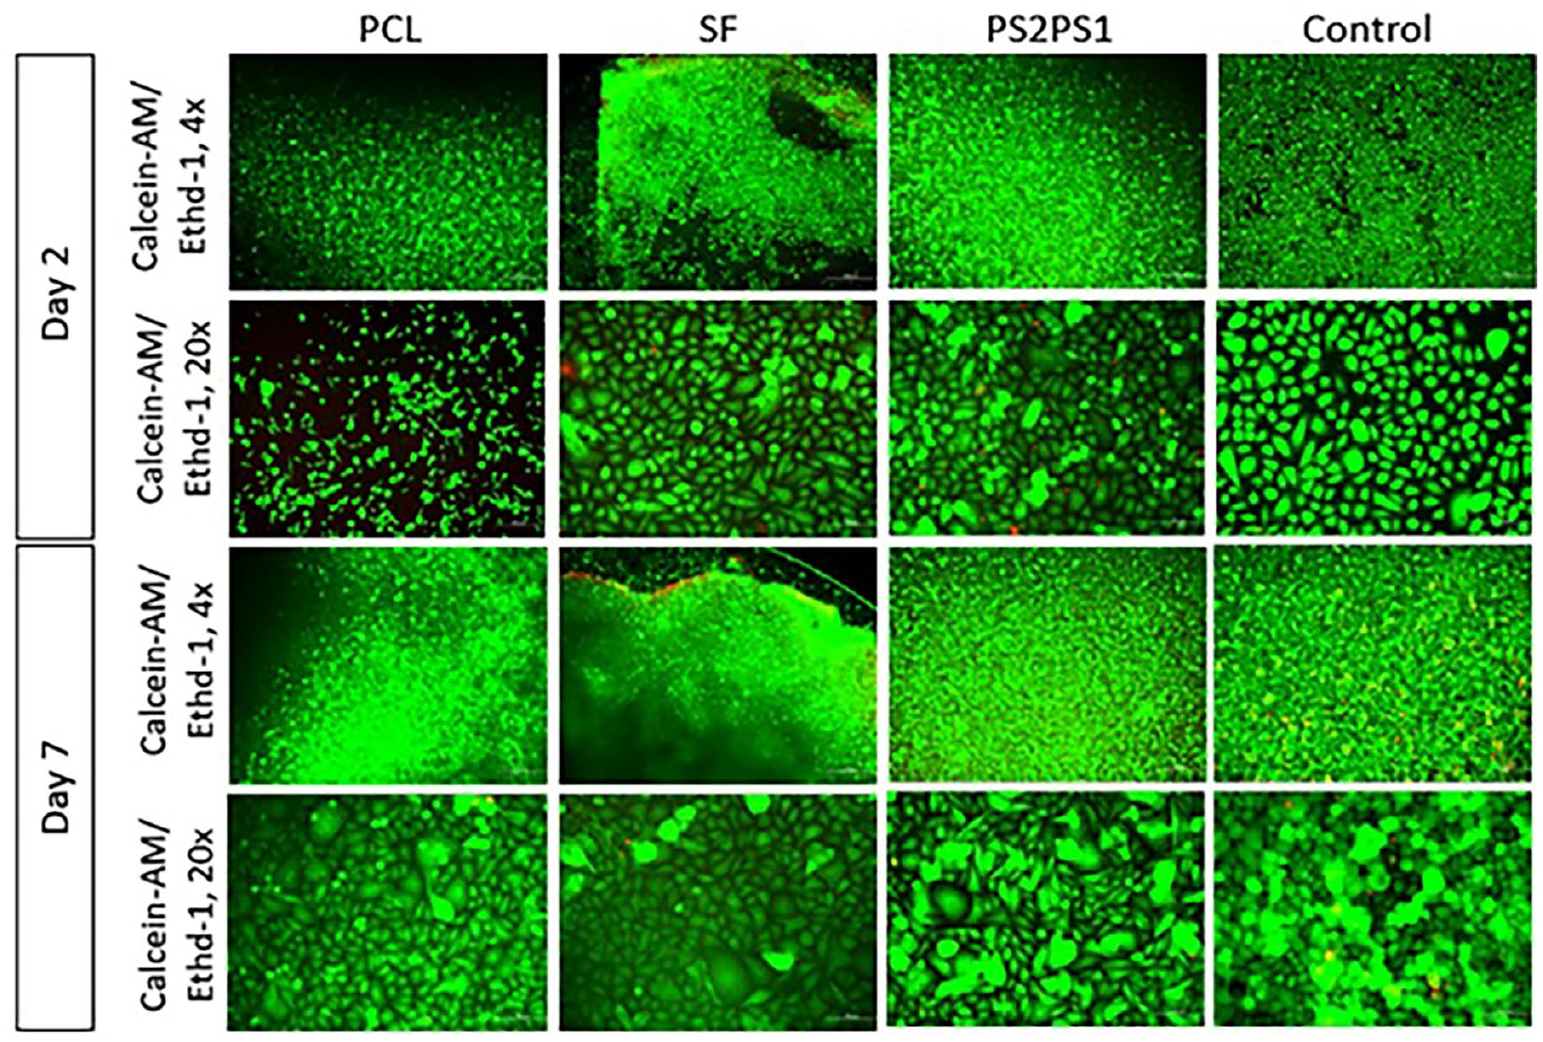
Cell Viability Test of primary human epidermal keratinocyte cells on nanofibers.
Figure 9 shows the XTT proliferation results of the primary human epidermal keratinocyte cells (40,000 cells/nanofiber) on nanofibers. As expected, the cells kept their viability even until the seventh day. It is observed that cells maintained their functions on all nanofibers and showed improved proliferation from day 2 to 7. Overall, PS2PS1 showed the highest viability rate compared to other samples. This could be attributed to its scaffold structure which contains both PS1 and PS2 layer by layer. Each layer provided advanced features individually which formed an overall enhanced scaffold as a skin substitute. PS1 provided the scaffold with adequate structural strength, and PS2 contributed to the final substitute’s required bioactivity, leading to optimum cell proliferation and viability. In addition, the control group which is the tissue culture plate (TCP) showed higher viability compared to the produced scaffolds. TCP is used as a standard in the proliferation of mesenchymal, dermal, and epidermal cell cultures. Therefore, cells could easily adhere to TCP and show enhanced proliferation. Since the adherence property of the scaffolds is not as good as the TCP group, it was expected that cells would not attach on the scaffolds and proliferate on the scaffolds comparable to TCP. As it could be observed from the microscope images from the cell viability study, dead cell number (red fluorescence) in the scaffolds was at a minimum level. These findings indicate that the reason for TCP having a higher proliferation rate compared to the scaffolds was not the cytotoxicity of the scaffolds but the relative cell adhesion to the samples.
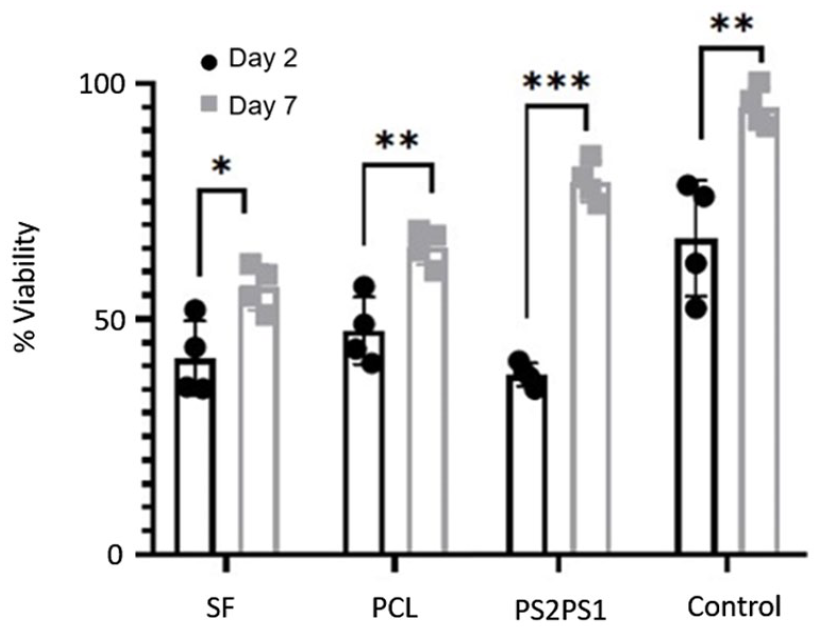
Cell Proliferation (XTT) assay of nanofibers.
Conclusion
PCL/SF-based nanofibers with varying polymer concentrations and viscosities were prepared with HFIP. The nanofibers were characterized by morphology (fiber diameter and distribution), mechanical strength, hydrophilicity, pore size, surface area, and in vitro proliferation capacity. Topographical analysis depicted that using HFIP as the solvent allowed scaffolds to possess homogenous fiber distribution with no beads. According to the tensile tests, it was concluded that adding some SF into the PCL structure improves the mechanical properties by providing stiffness and introducing intermolecular interactions. In terms of wettability, the incorporation of SF into scaffolds caused a sudden enhancement in the hydrophilicity which is required for cellular activities. According to surface area analysis, it was shown that samples with small fiber diameters and uniform fiber distributions obtained higher surface areas. It was also observed that PS2PS1 showed the highest cell proliferation and viability. Among the samples, PS2PS1 seemed to exhibit the optimum properties as a skin scaffold material. To our knowledge, this is the first study demonstrating the construction of a PCL/SF scaffold in a layer-by-layer structure. Using a layer-by-layer structure design allowed the scaffold to acquire distinct properties of each layer, the required mechanical support thanks to PS1, and adequate bioactivity thanks to the PS2 layer. In future studies, performing in vivo experiments to find out the behaviour of the bioscaffold presented in the natural extracellular environment would be highly beneficial.
Footnotes
Declaration of conflicting interests
The author(s) declared no potential conflicts of interest with respect to the research, authorship, and/or publication of this article.
Funding
The author(s) disclosed receipt of the following financial support for the research, authorship, and/or publication of this article: This study was financially supported by the Scientific and Technological Research Council of Turkey (Project ID: 20AG030)