
Abstract
Natural fiber polymer composites have been largely used in applications like aerospace, automotive, marine, and other civil structures, where mechanical and tribological properties are of prime consideration. The performance of hybrid composites can be improved by using different natural fibers and adding particulate fillers to them. In this study, mechanical and tribological properties of jute/sisal/E-glass fabrics reinforcing matrix such as natural rubber and epoxy filled with different proportion of tungsten carbide (WC) powder were studied. Mechanical properties like tensile strength, flexural strength, impact strength, and also tribological behavior like two-body abrasive wear of composite were studied. Taguchi technique was employed for wear analysis. Results revealed that there is a significant change in the mechanical properties and enhancement of wear behavior was noticed due to the incorporation of filler (WC) particles.
Introduction
Advances in the area of materials science have bought forth intriguing and eco-friendly materials known as “natural fiber composites”. Hybridization of natural/glass fiber reinforced composites can give predominant and unique properties since it consolidates the most attractive properties of its constituents. Natural fibers are used in many applications because of its bio-degradability, low cost, low weight, specific strength, resistance to wear and corrosion. Most commonly used natural fibers for reinforcement in composites are jute, sisal, banana, hemp, etc, which are abundantly available in India. The glass fiber reinforced polymer can be used with natural fibers to enhance the mechanical properties as well as potential applications [1–7]. In this view, this study helps to understand the hybridization of glass fibers with natural fibers for the strength enhancement and for specific applications.
Panthapulakkal and Sain [8,9] studied the mechanical and thermal properties of hemp/glass fiber reinforced polypropylene composites. From the obtained results, it was observed that the hybridization of glass fiber with hemp can improve the flexural and impact strength and also found increases in thermal property as well as water resistance. Sanjay and Yogesha [10] determined the mechanical properties of jute/E-glass fiber reinforced epoxy hybrid composites. The result of the tests showed that the incorporation of glass fiber in jute fiber composites enhances the mechanical properties and it leads to the increase of the utilization of natural fibers in various applications. Ramesh et al. [11] evaluated the mechanical properties of sisal–jute–glass fiber reinforced polyester composites. The incorporation of glass with jute and sisal composites shows the maximum flexural strength and impact strength attained from the pure natural fiber composites. Bisaria et al. [12] investigated the tensile, flexural, and impact properties of the randomly oriented short jute reinforced epoxy composites. Jute fiber of the various lengths 5, 10, 15, and 20 mm were reinforced into the epoxy matrix. Results reveal that the tensile property of epoxy resin was not increased, whereas flexural and impact properties of epoxy resin were increased by reinforcement of jute fiber. For the fiber length of 15 mm maximum tensile and flexural properties were found.
Braga et al. [13] compared the mechanical, thermal, and water absorption properties of the raw jute fiber and glass-fiber reinforced epoxy composites. The jute, glass, and epoxy percentage varied by 31–0–69 / 25–7–68 / 18–19–64. This study results showed that the incorporation of jute and glass fiber can increase the mechanical properties, but a considerable decrease in the properties of temperature and water absorption was also observed. Zhong et al. [14] focused on the surface microfibrillation of sisal fiber on the mechanical properties of sisal/aramid fiber hybrid composites. The result reveals that surface microfibrillation significantly influenced the mechanical properties. Sanjay et al. [15] reviewed the properties of natural/glass fiber reinforced polymer hybrid composites. This study showed that the incorporation of natural fibers with glass fiber can improve the properties and can be used as an alternate material for glass fiber reinforced polymer composites. Ahmed et al. [16] carried out experiments on natural rubber (NR) hybrid composites reinforced with silica, marble sludge (MS), rice husk (RHS). The result reveals that the addition of silica and RHS to their corresponding hybrid NR composites significantly improves the tensile strength, modulus, tear strength, and hardness.
Ngah et al. [17] conducted an experiment on the fracture energies of glass fiber (GF) composites with an anhydride-cured epoxy matrix modified using core-shell rubber (CSR) particles and silica nanoparticles. The use of CSR particles eliminates the incomplete phase separation that occur when using liquid rubber, and the addition of CSR or NS particles increases the fracture toughness and bulk polymer and GF composites. Ozdemir et al. [18] investigated the effect of nano-carboxylic acrylonitrile butadiene rubber (CNBR-NP) and nano-acrylonitrile butadiene rubber (NBR-NP) on the interlinear shear strength and fracture toughness of carbon fiber reinforced polymer composites (CFRP). The result showed that the fracture toughness of the CFRP laminates improved significantly with the nano-rubber modification of the matrix, which was justified by the changed morphology of the resins. Mohan et al. [19] studied the erosive behavior effect of tungsten carbide (WC) powder as filler in glass–epoxy (GE) composite. The vacuum-assisted resin-infusion technique was used for the preparation of composite specimen. The effect of different velocities on the resistance of wear was measured. The result showed that the addition of WC to GE composites improves the erosion resistance and it also shows the brittle erosive wear behavior.
Visconti et al. [20] investigated the wear behavior of composite materials, sliding under dry condition against steel counter face. The composite consists of glass fiber with epoxy resin filled with powder of silicon and WC prepared by hand lay-up method. From the results it was revealed that composite with the matrix filled with WC powder presented the highest value of wear resistance in the most severe wear conditions. Swamy et al. [21] studied the mechanical property of Al6061–WC composite. The result of this study revealed that with the increase in the WC particle content, there was significant increase in the ultimate tensile strength, hardness, and Young's modulus but reduction in its ductility. Harisha et al. [22] compared the unidirectional glass fiber and carbon fiber with an epoxy matrix composite and bidirectional glass fiber reinforcement for the erosive wear resistance of epoxy composites at the normal incidence. Silica sand was used to impact on the specimens, and the results showed better wear resistance by bidirectional glass fiber reinforced epoxy composite than the unidirectional reinforced composite. The objective of this work is to examine the mechanical and tribological properties of WC-filled composites with the combination of jute, sisal, glass, and rubber.
Materials and methods
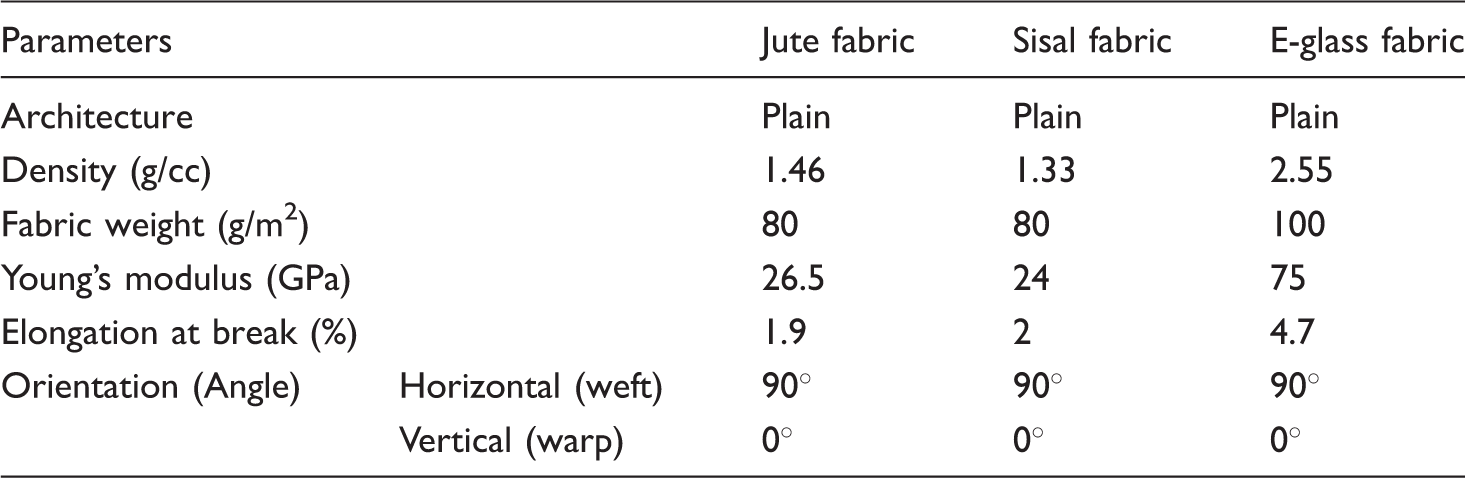
Materials used
The parameters of jute, sisal, and E-glass fabrics.
Composite laminate fabrication
Composition of the composite laminates.

G: glass; J: jute; S: sisal; WC: tungsten carbide; R: rubber; E: epoxy.
Composition of the laminates.


Fabrication of the composite laminates.
Experimental studies
Density measurement
The experimental densities of the composites were measured using a simple water immersion method. Distilled water was used for this test. For each sample analyzed, six measures were carried out and average values of density were recorded.
Tensile test
Tensile test was conducted to measure the material's strength when opposite force was applied. Poisson's ratio, stress, yield strength, Young's modulus, and strain were obtained from this test. The specimens were prepared and tested according to the ASTM D-3039 standard. The dimension of tensile specimen was 250 × 25×3 mm3. The tensile test was conducted on a 100 kN universal testing machine (UTM, Model: LR50 K, Lloyds Instruments Ltd) with data acquisition software. The tests were carried out at a loading rate of 2.5 mm/min at 25℃. Figure 2 shows the tensile tested specimens.
Tensile tested specimens.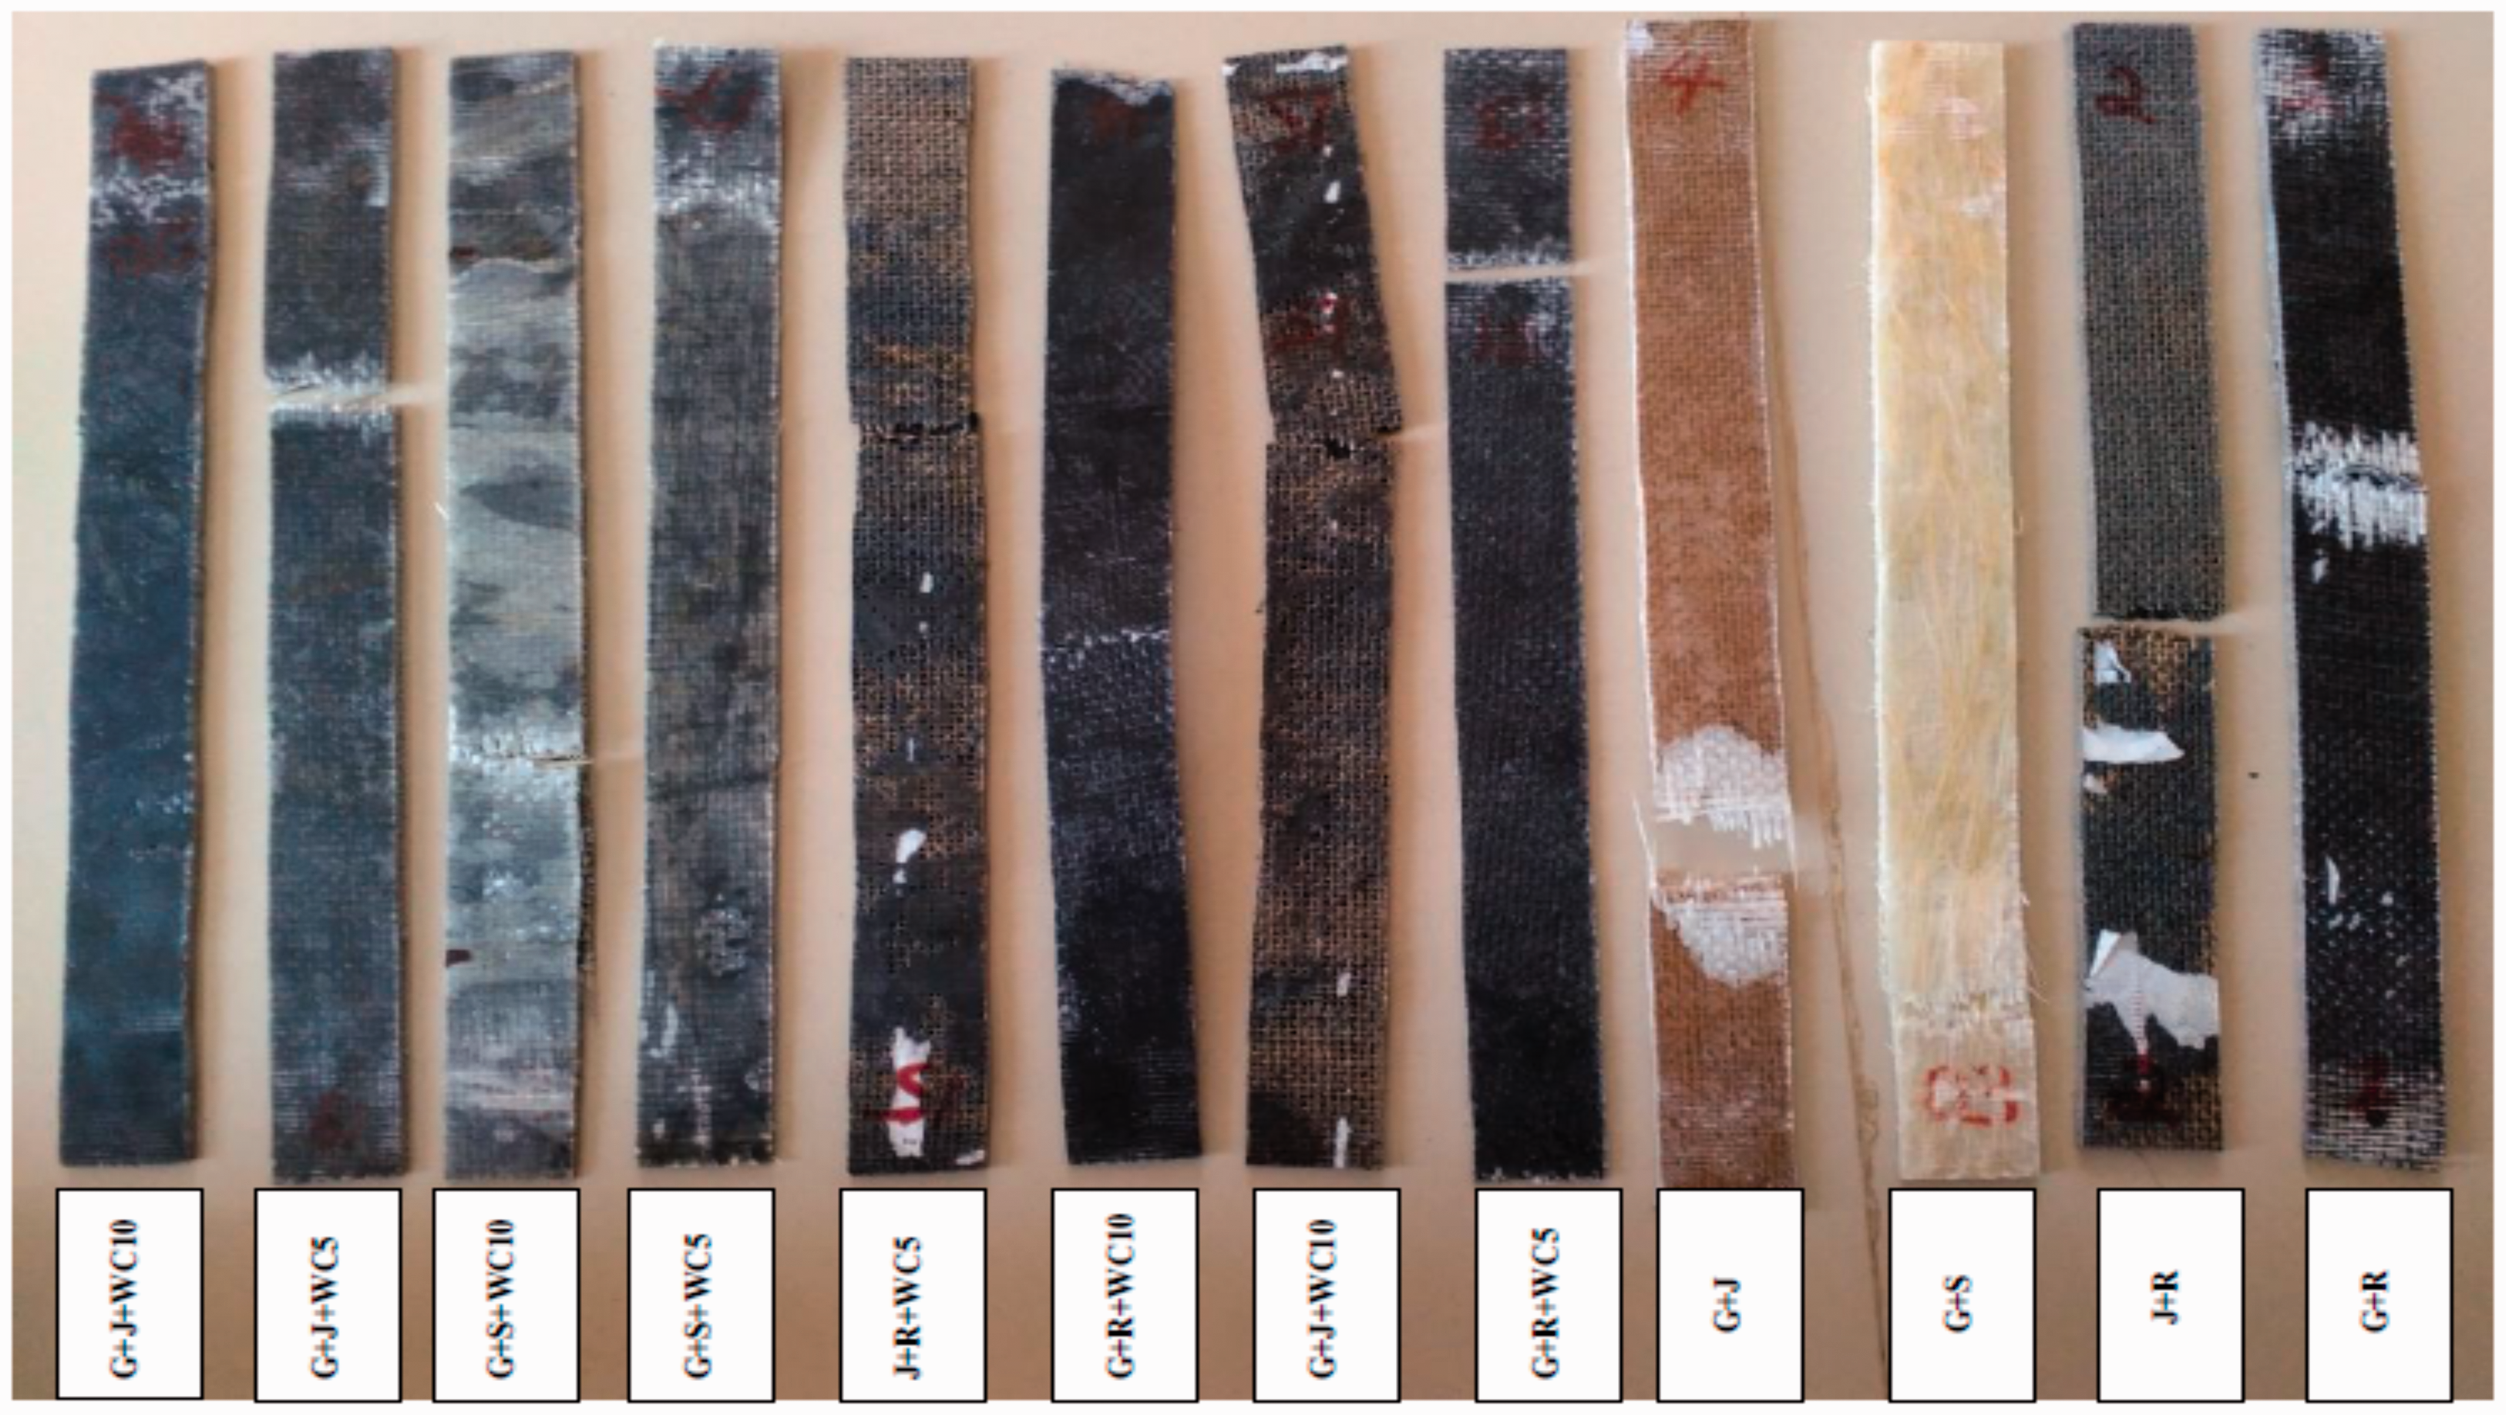
Flexural test
Flexural test comes under destructive testing methods; it is also called as three-point bending test. The dimensions (125 × 12.7 × 3 mm3) of the flexural specimen were made according to the ASTM D790-07 standard. The flexural test was conducted on the same UTM using flexural test fixture and a load cell of 10 kN. The span length of the specimens was 50 mm and the load was applied at the center at a loading rate of 2.0 mm/min. Figure 3 shows the flexural tested specimens.
Flexural tested specimens.
Impact test
This test measures the impact resistance of the specimens for suddenly applied loads. The impact strength of the composite laminate specimens was measured by a digital izod impact tester. The specimens were prepared and tested according to the ASTM D-256 standard. The dimension of impact specimen was 63 × 12.7 × 3 mm3. The specimen was placed in a vertical position, in the form of a cantilever and the notch along the side of striker end. Figure 4 shows the specimens of impact test before testing.
Impact test specimens.
Wear test
The tribological test was conducted to study various factors like friction, lubrication, and wear. To find the wear rate, abrasive wear test was generally employed. The test was conducted according to the ASTM G-99 standard. For this test, pin-on-disc apparatus was generally used. Abrasive paper of 100 grade was attached to the rotating disc and pin was held in a holder. Before starting the test, initial weight was measured and final weight was measured at the end of the test, and this difference between the initial and final weights gave the loss of weight due to wear. Figure 5 shows the specimens used for the abrasive wear test.
Wear test specimens.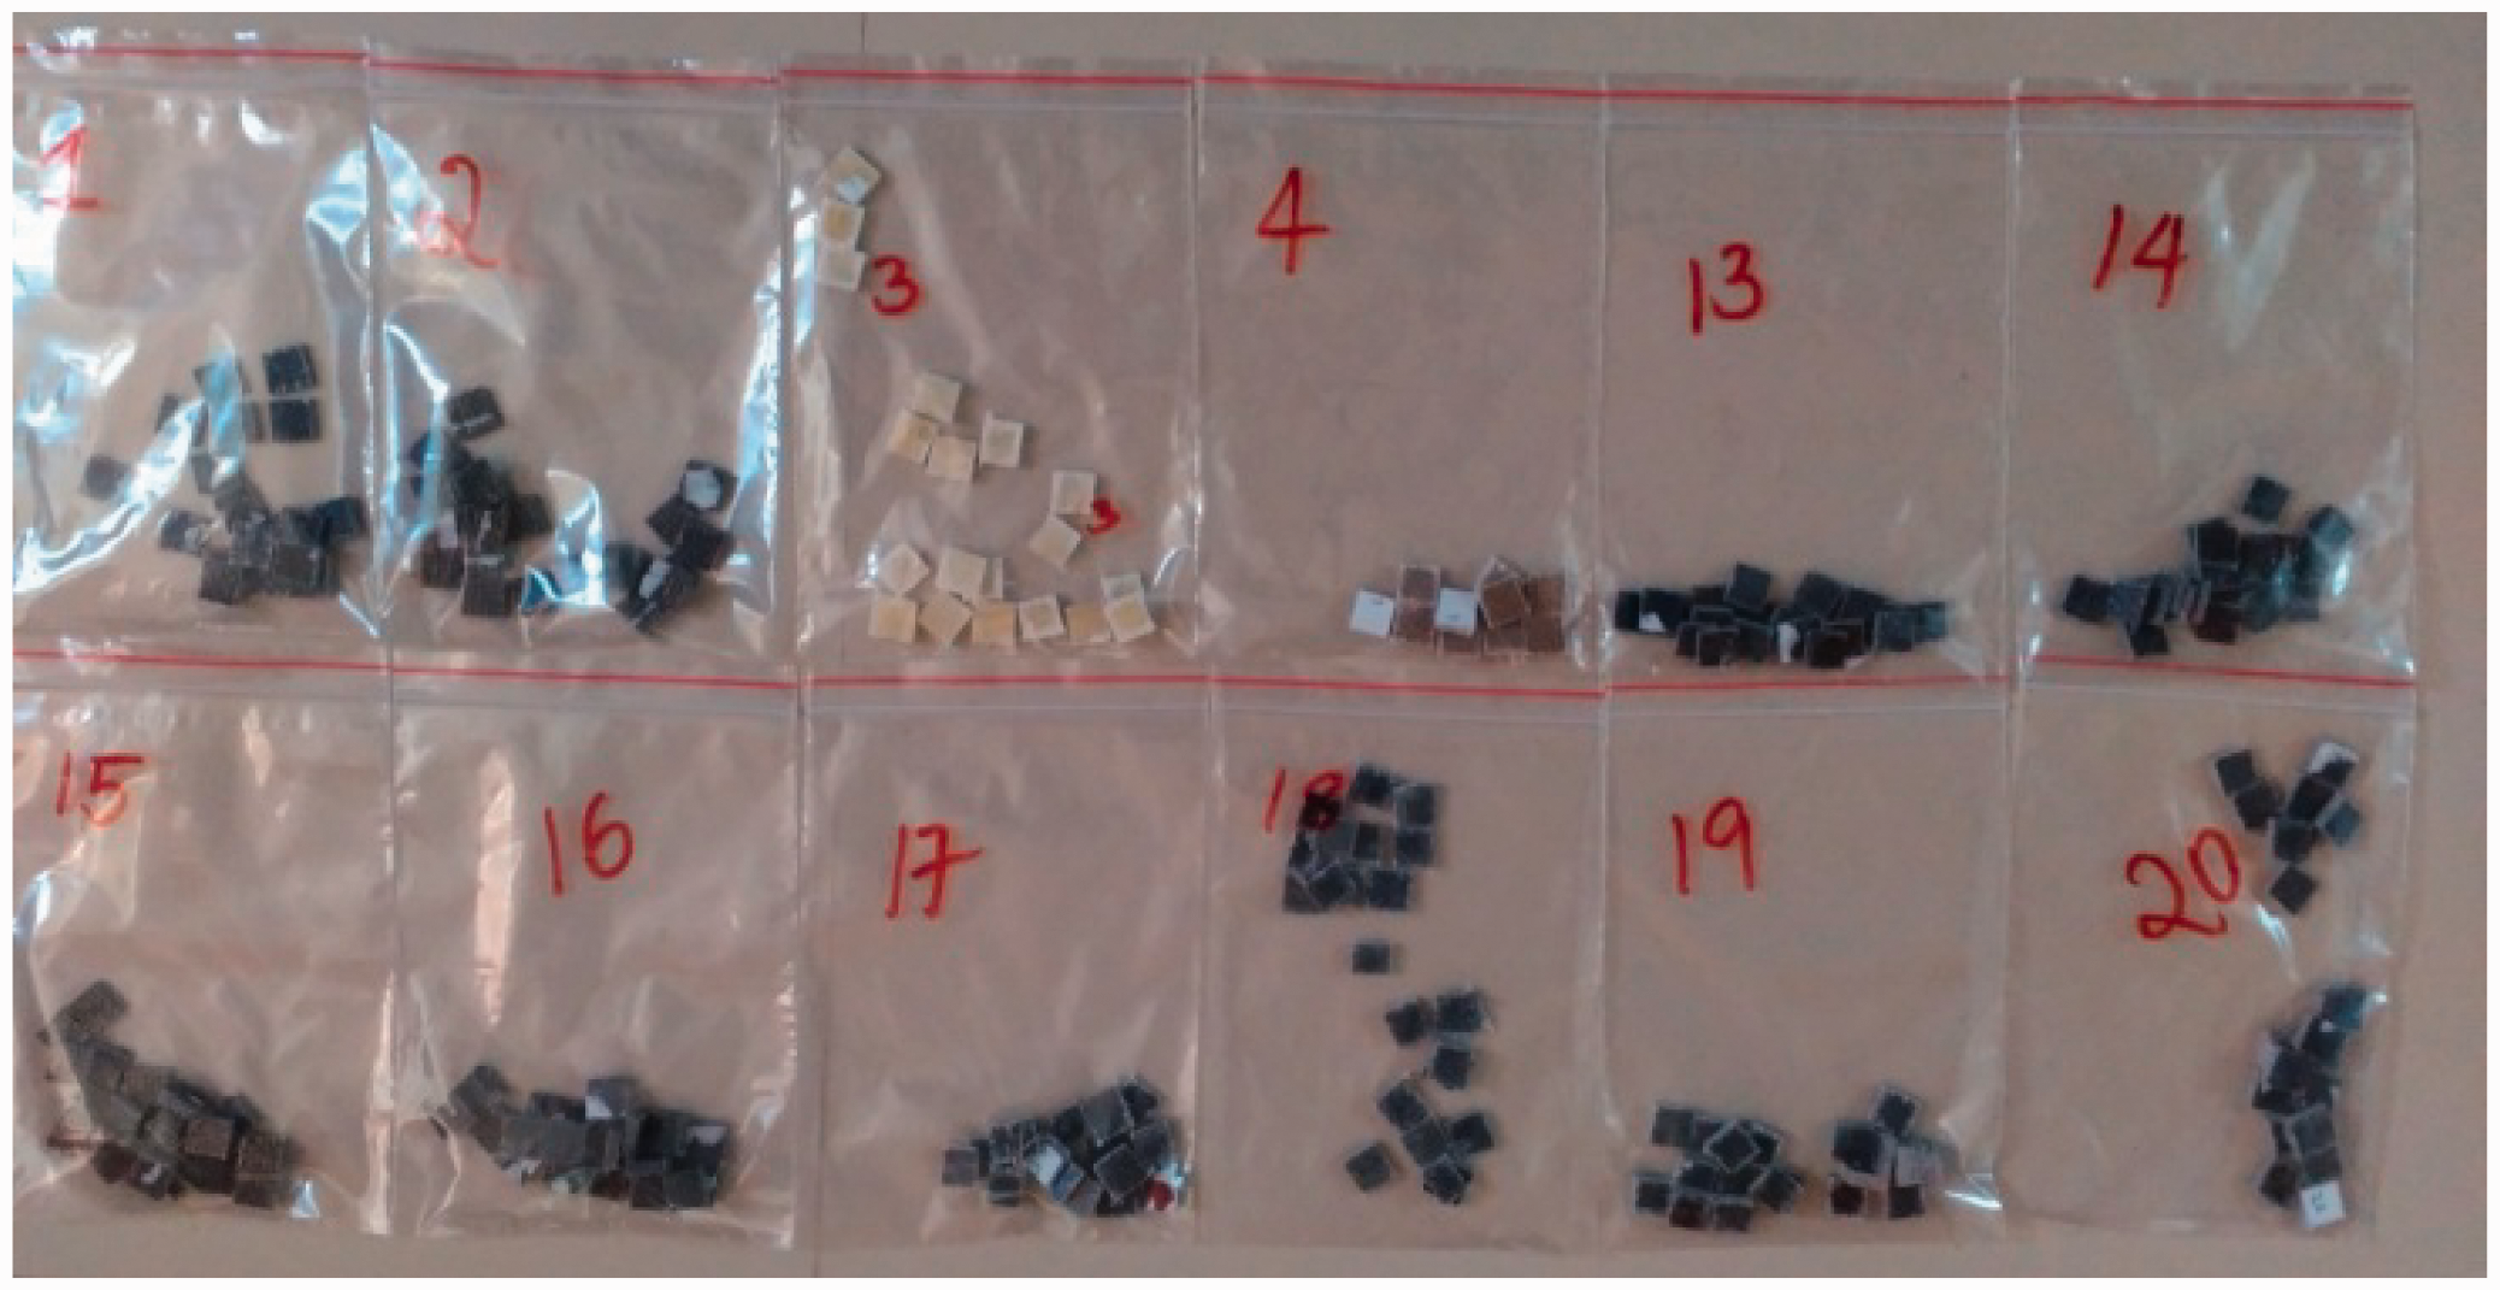
Results and discussion
Density variation
From Figures 6 to 9, it was observed that the density increases by the increase in the filler percentage, because the density of the filler (WC) is greater than the matrix. It was also observed that the combination of glass and rubber and jute and rubber shows lesser density values than the other two combinations.
Density variation of G + J + E. Density variation of G + R + E. Density variation of G + S + E. Density variation of J + R + E.


Tensile strength
Generally, tensile strength of composites is mainly dependent on the interfacial strength of the resin and fiber rather than the modulus of elasticity [14]. The values of tensile strength composite laminates are shown in Figures 10, 12, 14, and 16. The load versus displacement plots of the composite laminates are shown in Figures 11, 13, 15, and 17. By general observations, the tensile strength of all combinations significantly increased with the increase in filler loading.
Tensile strength variation graph for G + J + E. Load vs. displacement graph for G + J + E. Tensile strength variation graph for G + R + E. Load vs. displacement graph for G + R + E. Tensile strength variation graph for G + S + E. Load vs. displacement graph for G + S + E. Tensile strength variation graph for J + R + E. Load vs. displacement graph for J + R + E.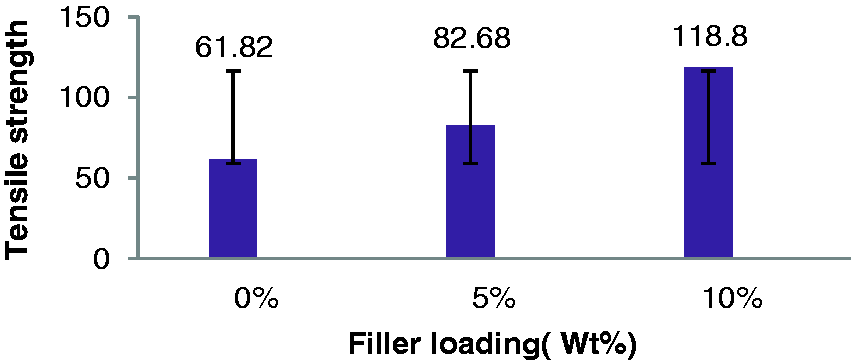


Jute was observed to have less tensile strength than the glass fiber, by comparison of G + R + E and J + R + E combinations with WC as filler. For 0% filler, J + R + E shows lesser tensile strength than G + R + E. For increase in filler loading from 0% to 5%, G + R + E shows nearly 63% increase in the tensile strength. For increase in filler loading from 0% to 5%, J + R + E shows nearly 30% increase in the tensile strength. By this observation, it is clear that the filler loading in J + R + E does not much affect the interfacial strength of jute, rubber, and matrix. But in G + R + E, its effects are in considerable amount. For increase in filler loading from 5% to 10%, G + R + E shows 29% and J + R + E shows 69% increase in the tensile strength. These result shows that for G + R + E combination, the interfacial strength of resin fibers is increased considerably for 5% filler loading, and after an increase in filler loading (10%) there is not much more variation. For J + R + E combination, the 5% filler loading did not show much effects but a considerably greater increase in tensile strength was observed in 10% of WC.
Comparison of glass with jute and sisal was carried out. The results showed that there was no filler G + J + E and G + S + E have only 19%, for 5% of WC shows 37% and for 10% of WC shows only 7%, difference in tensile strength. For 5% WC loading, G + J + E shows 28% and G + S + E shows 13% increase in the tensile strength. For 10% WC loading, G + J + E shows 35% and G + S + E shows 63% increase in the tensile strength.
Comparing both G+J+E and G+S+E showed same performance at 0% and 10% filler loading. But variation was observed in 5% filler loading. There was not much variation in 5% filler loading of G + S + E combination. For 10% filler loading, both showed considerable variation in the tensile strength.
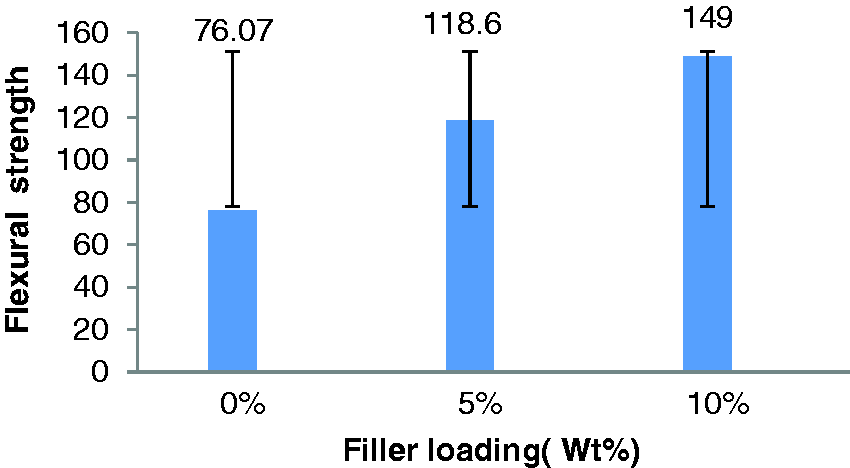
Flexural strength
The values of flexural strength obtained for different samples are shown in Figures 18 to 21. By the observation of results, G + R + E and J + R + E were found to have 43% difference in their flexural strengths, and showed almost a similar variation for an increase in filler loading wt%. In G + S + E composites, there was not much variation in the flexural strength by variation of wt% of WC. G + J + E composites showed lot more variations; it showed an increase in the flexural strength on an increase in filler wt%. The flexural strength increased by 60% for increase in filler wt% from 0 to 5; for 5 to 10 wt% increase of filler only 19% variation was observed. It is because of the strong interfacial bonding of glass and jute fiber with fewer gaps. By adding fillers, these fewer gaps will be filled thereby causing a further increase in the flexural strength. For a further increase in filler wt% the fillers get stuck in fiber and cause lesser impact on increase in the flexural strength.
Flexural strength variation graph for G + J + E. Flexural strength variation graph for G + R + E. Flexural strength variation graph for G + S + E. Flexural strength variation graph for J + R + E.


Impact strength
The impact energy is generally termed as the energy absorbed by the specimen before yield, and it shows “toughness” of the material. High toughness indicates well balance between strength and ductility. The impact strength of the composite laminates is presented in Figures 22 to 25.
Impact strength variation of G + J + E. Impact strength variation of G + R + E. Impact strength variation of G + S + E. Impact strength variation of J + R + E.


Testing results of composites.

Two-body abrasive wear
Wear tests of G-J-E for 10 N load.

Wear tests of G-J-E for 20 N load.

Wear tests of G-R-E for 10 N load.

Wear tests of G-R-E for 20 N load.

Wear tests of G-S-E for 10 N load.
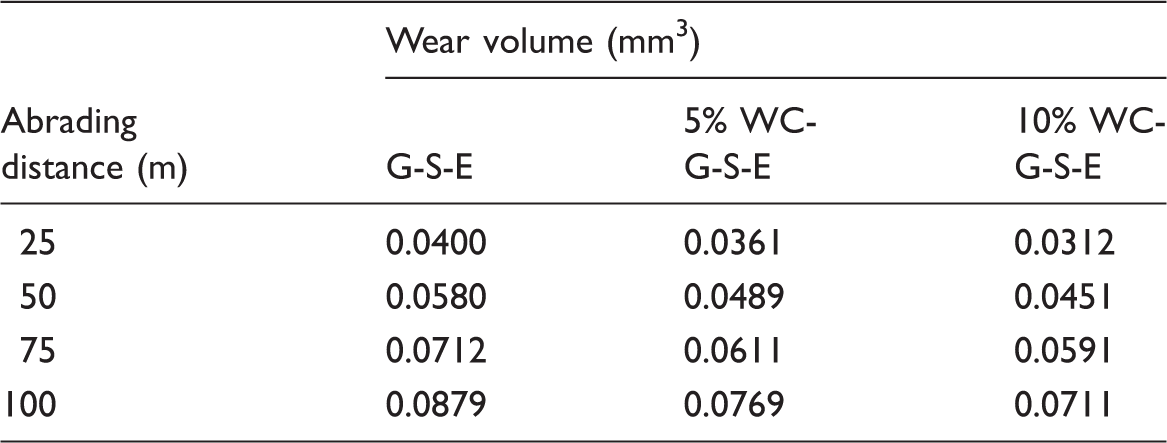
Wear tests of G-S-E for 20 N load.

Wear tests of J-R-E for 10 N load.

Wear tests of J-R-E for 20 N load.


Specific wear rates of G-J-E for 10 N load.

Specific wear rates of G-J-E for 20 N load.

Specific wear rates of G-R-E for 10 N load.

Specific wear rates of G-R-E for 20 N load.
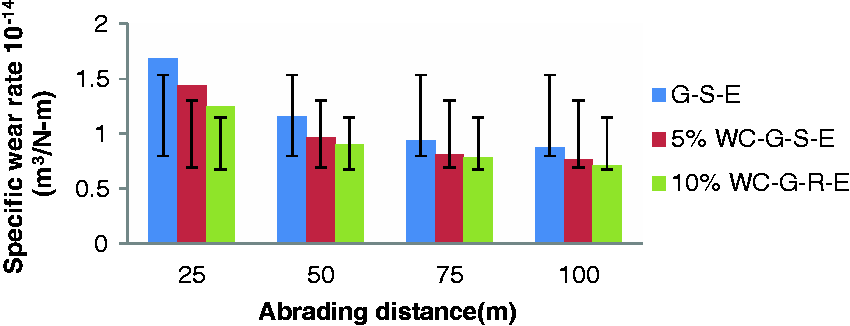
Specific wear rates of G-S-E for 10 N load.

Specific wear rates of G-S-E for 20 N load.

Specific wear rates of J-R-E for 10 N load.

Specific wear rates of J-R-E for 20 N load.
By comparing the wear volume, it is evident that G+R+E shows more wear than others for 10 N and 20 N loading. All other combinations show wear volume between 0.04 and 0.06, but G+R+E combination shows wear volume in the range of 0.06 to 0.08 as shown in Figure 34. This is because of the presence of rubber, which easily comes out. In this combination, filler does not show any effects on the reduction of wear rate.
Comparison of wear volume for 50 m distance at the load of 10 N and 20 N.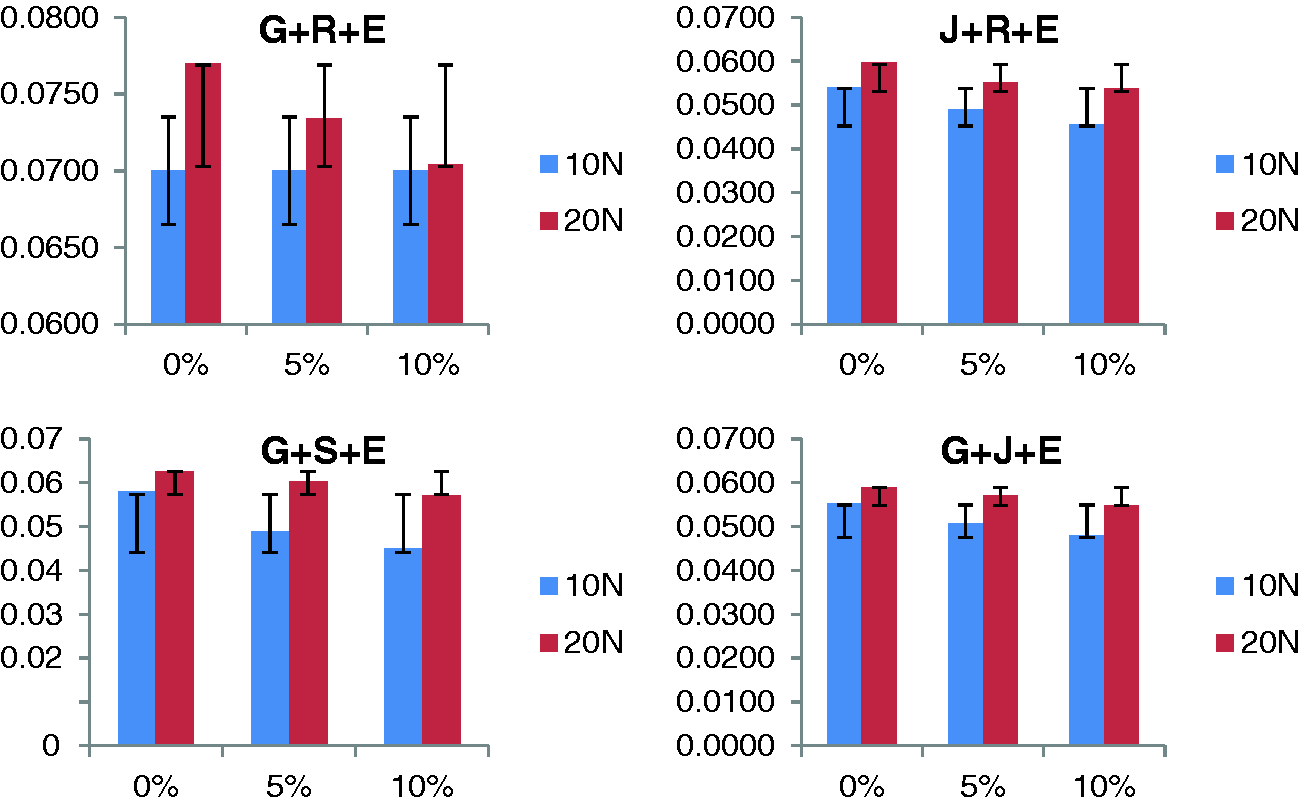
Scanning electron microscope analysis
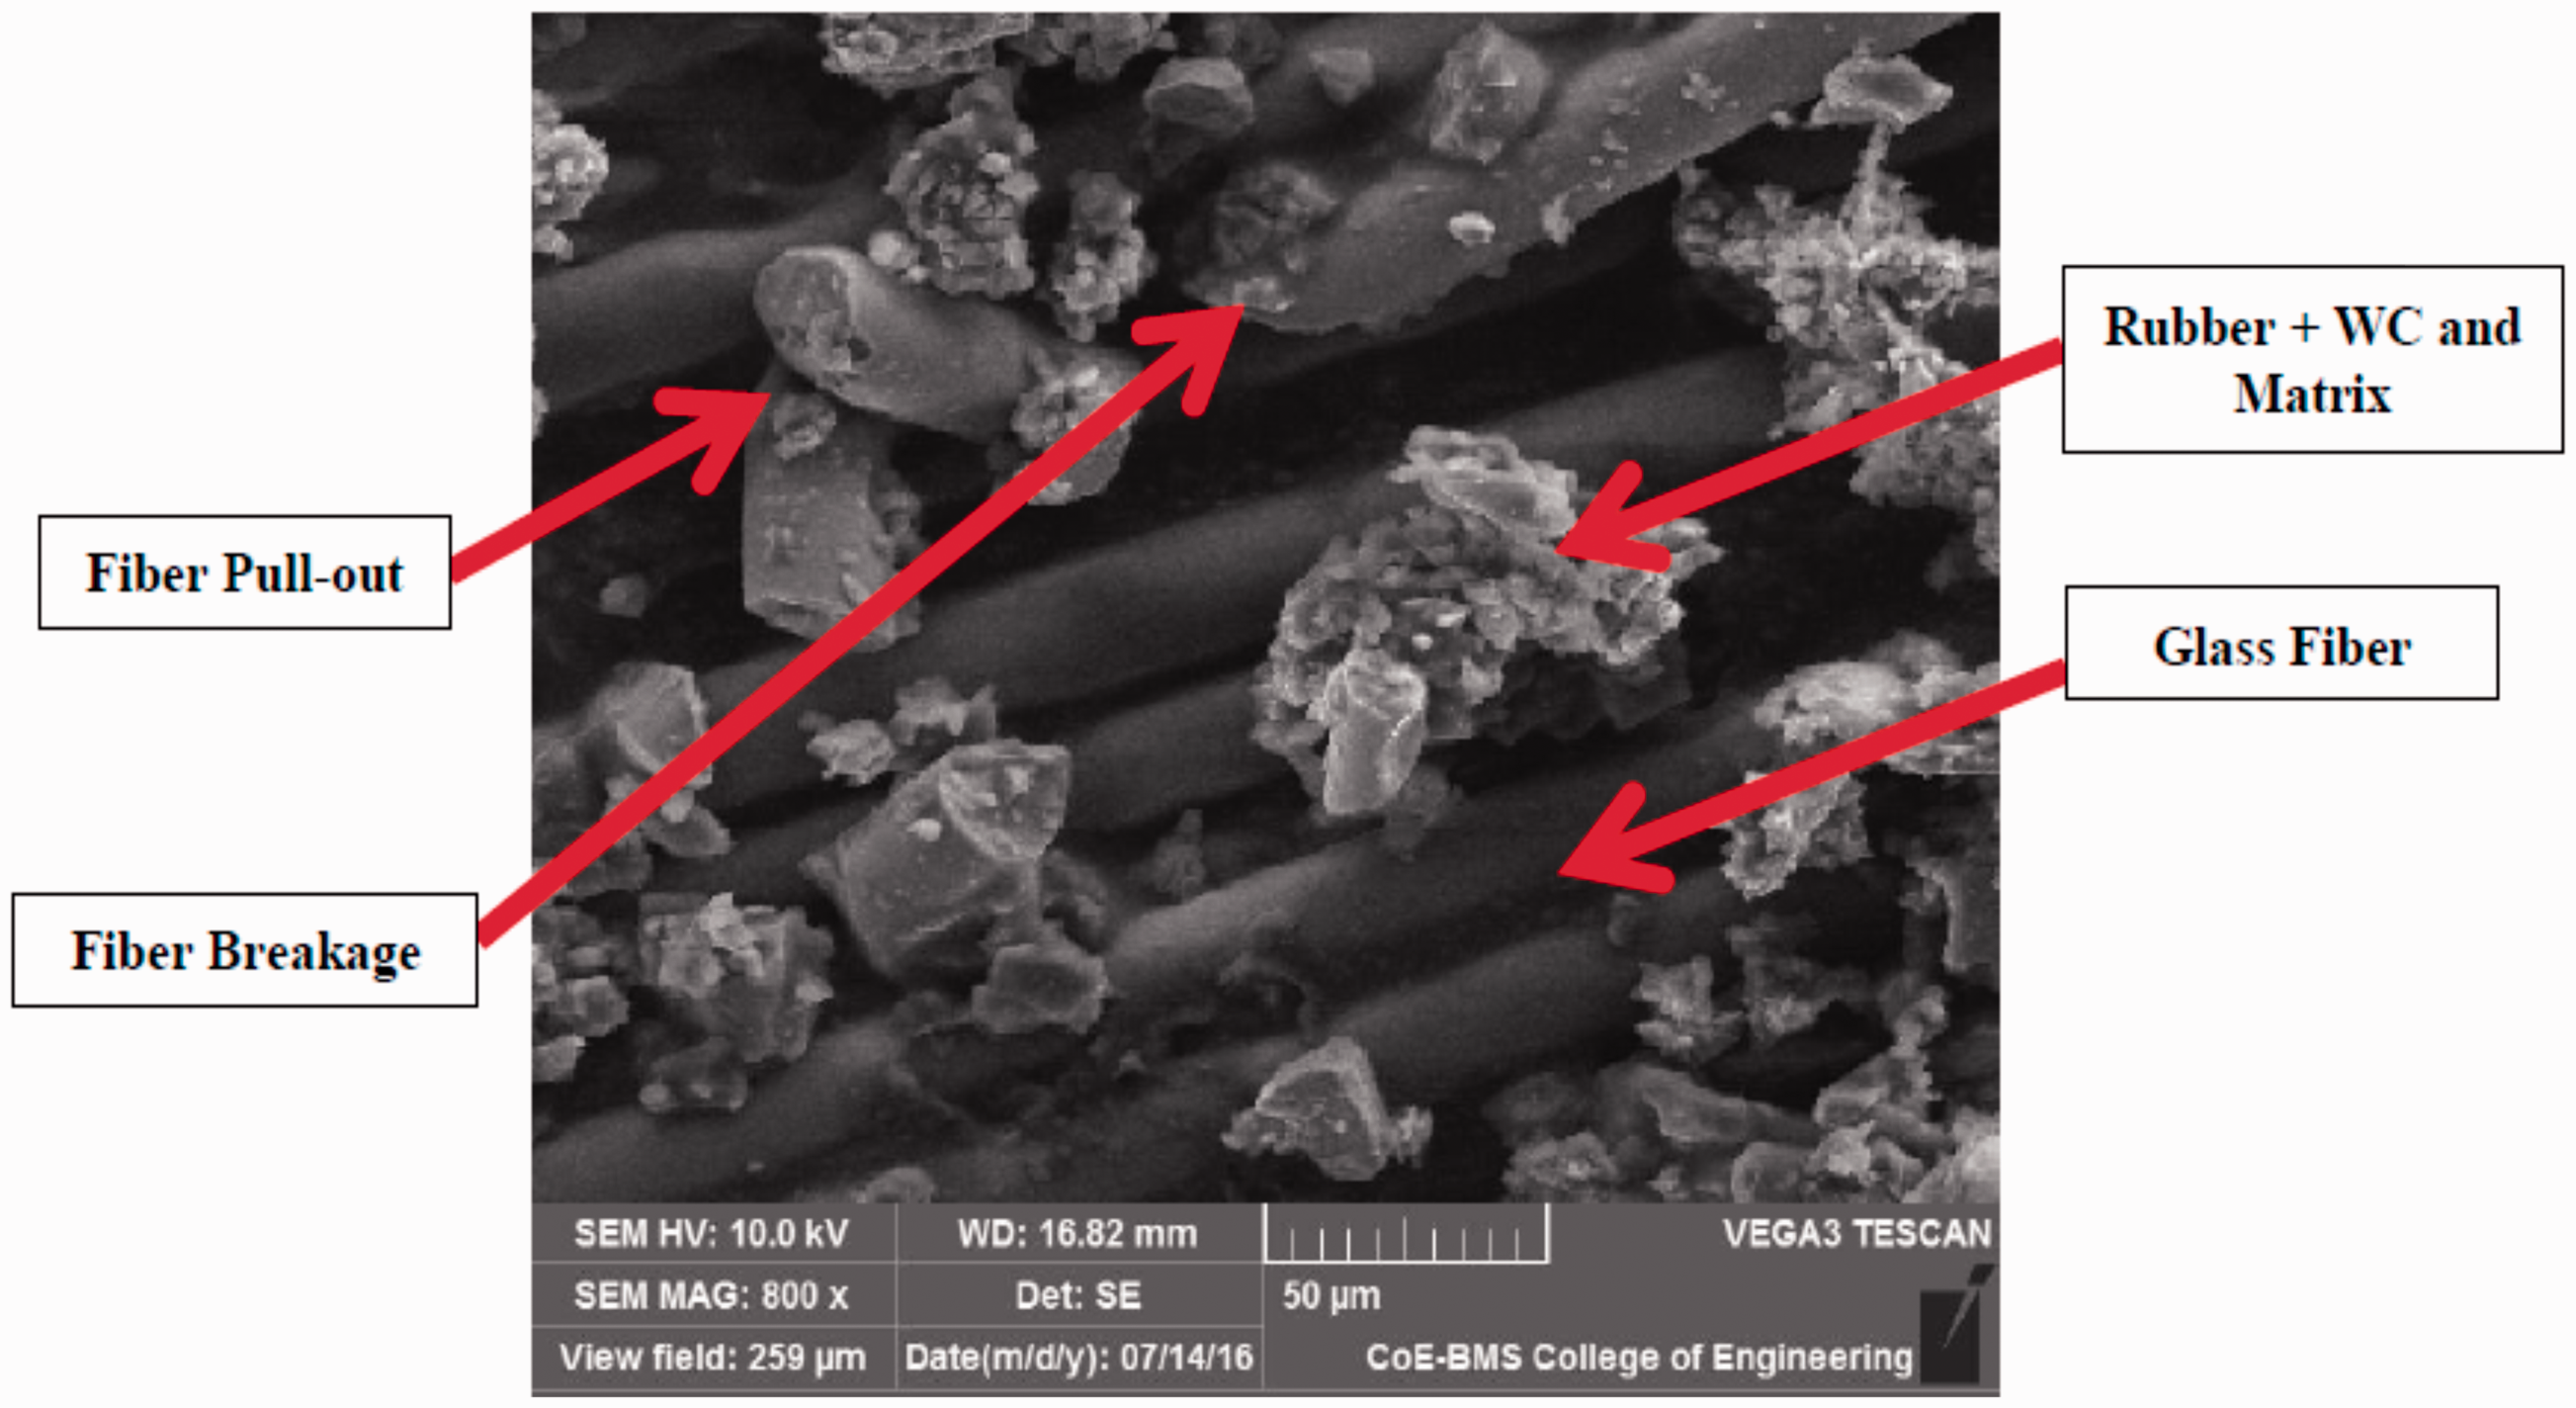
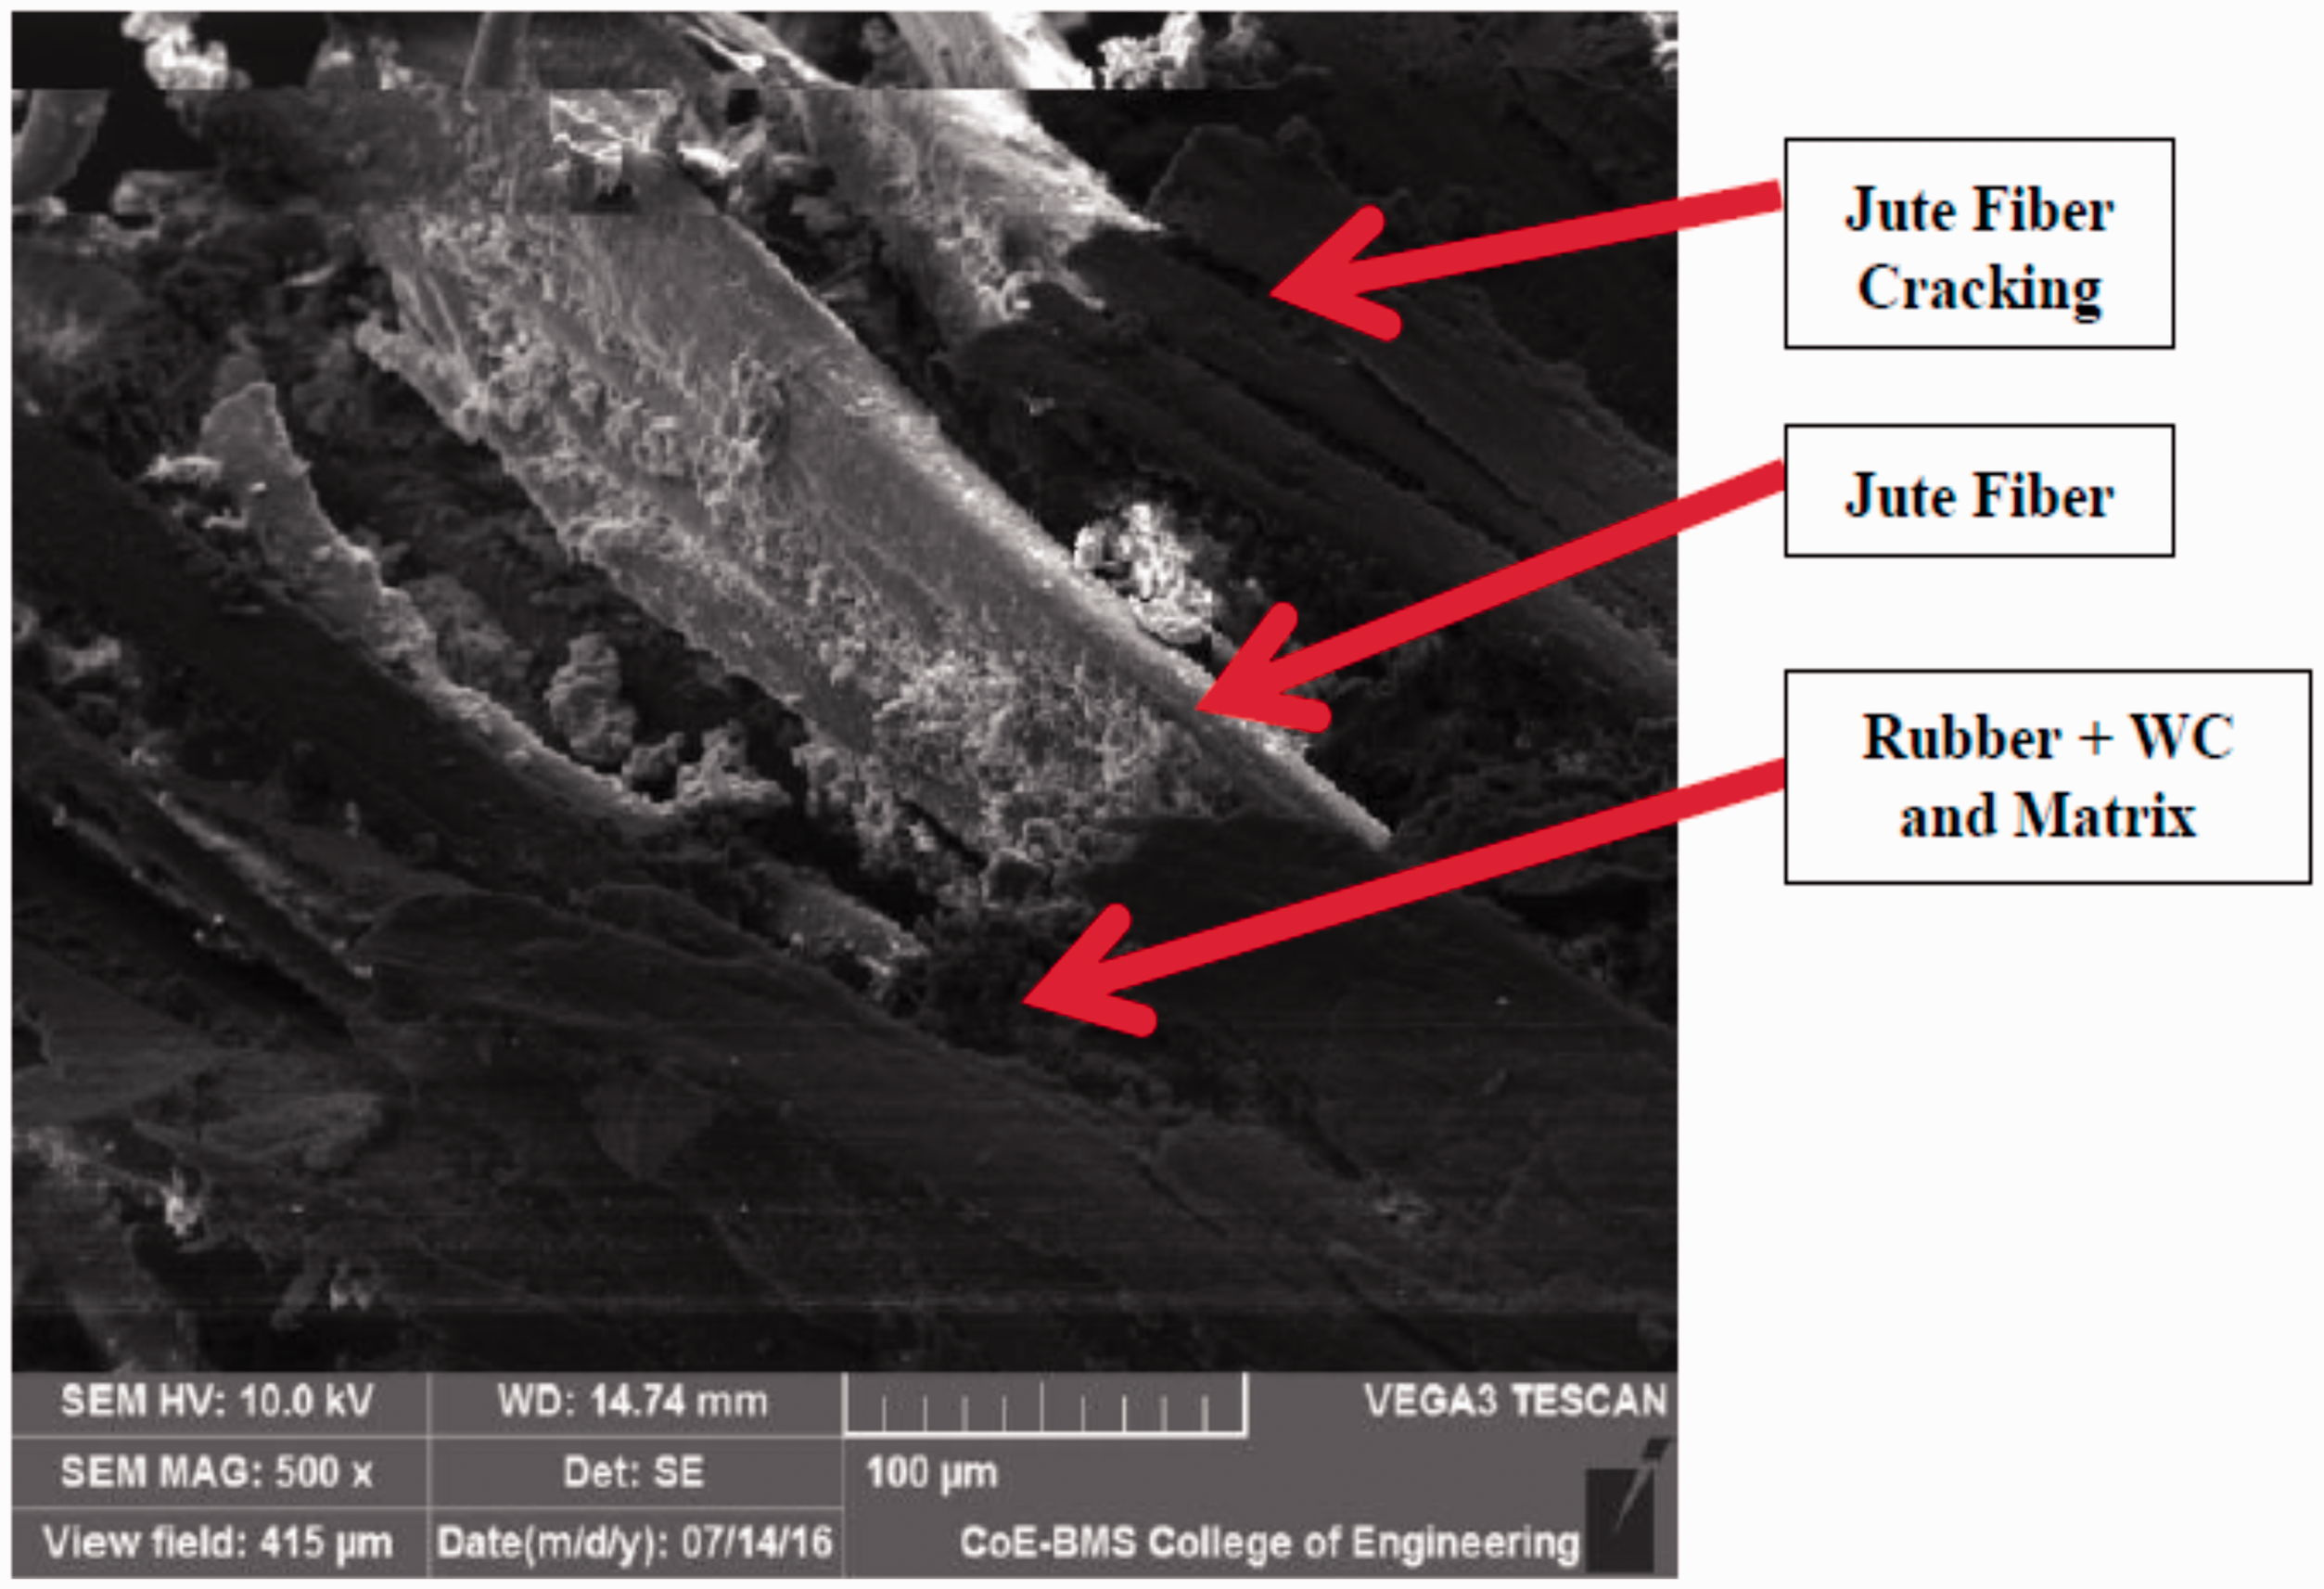
The scanning electron microscopic (SEM) images were taken to observe the interfacial properties, internal cracks, and internal structure of the fractured surfaces of the composite materials. All the specimens were coated with conducting material before observing the surfaces through SEM. By observing all the SEM images, it can be seen that they have few voids and fiber pull outs.
Figure 35 shows G + R + E at 0% WC. Smooth surface of the glass fibers results in poor adhesion with the matrix and fillers. Figure 36 shows G + R + E at 10% WC, and they have better bonding than at 0% WC with some amount of fiber breakage, pull-outs, and random distribution of fibers is present. These are the reasons as to why the rules of mixture for tensile modulus and tensile strength does not validate. Rules of mixture validate for the uniform distribution of fibers, matrix and a perfect bonding exists between them, and the matrix are free from voids. Figure 37 shows the SEM image of J + R + E at 10% WC at 500 × magnification. It is observed that there is a good bonding between jute and rubber with matrix, and also there is uneven distribution of fiber and the fiber cracking. Figures 38 and 39 show the SEM images of G + J + E and G + S + E, respectively. In both the images, fibers are clearly differentiated. In glass–sisal combination, the fiber pull-outs are observed.
SEM image of G + R + E at 0% WC. SEM image of G + R + E at 10% WC. SEM image of J + R + E at 10% WC. SEM image of G + J + E at 10% WC. SEM image of G + S + E at 10% WC.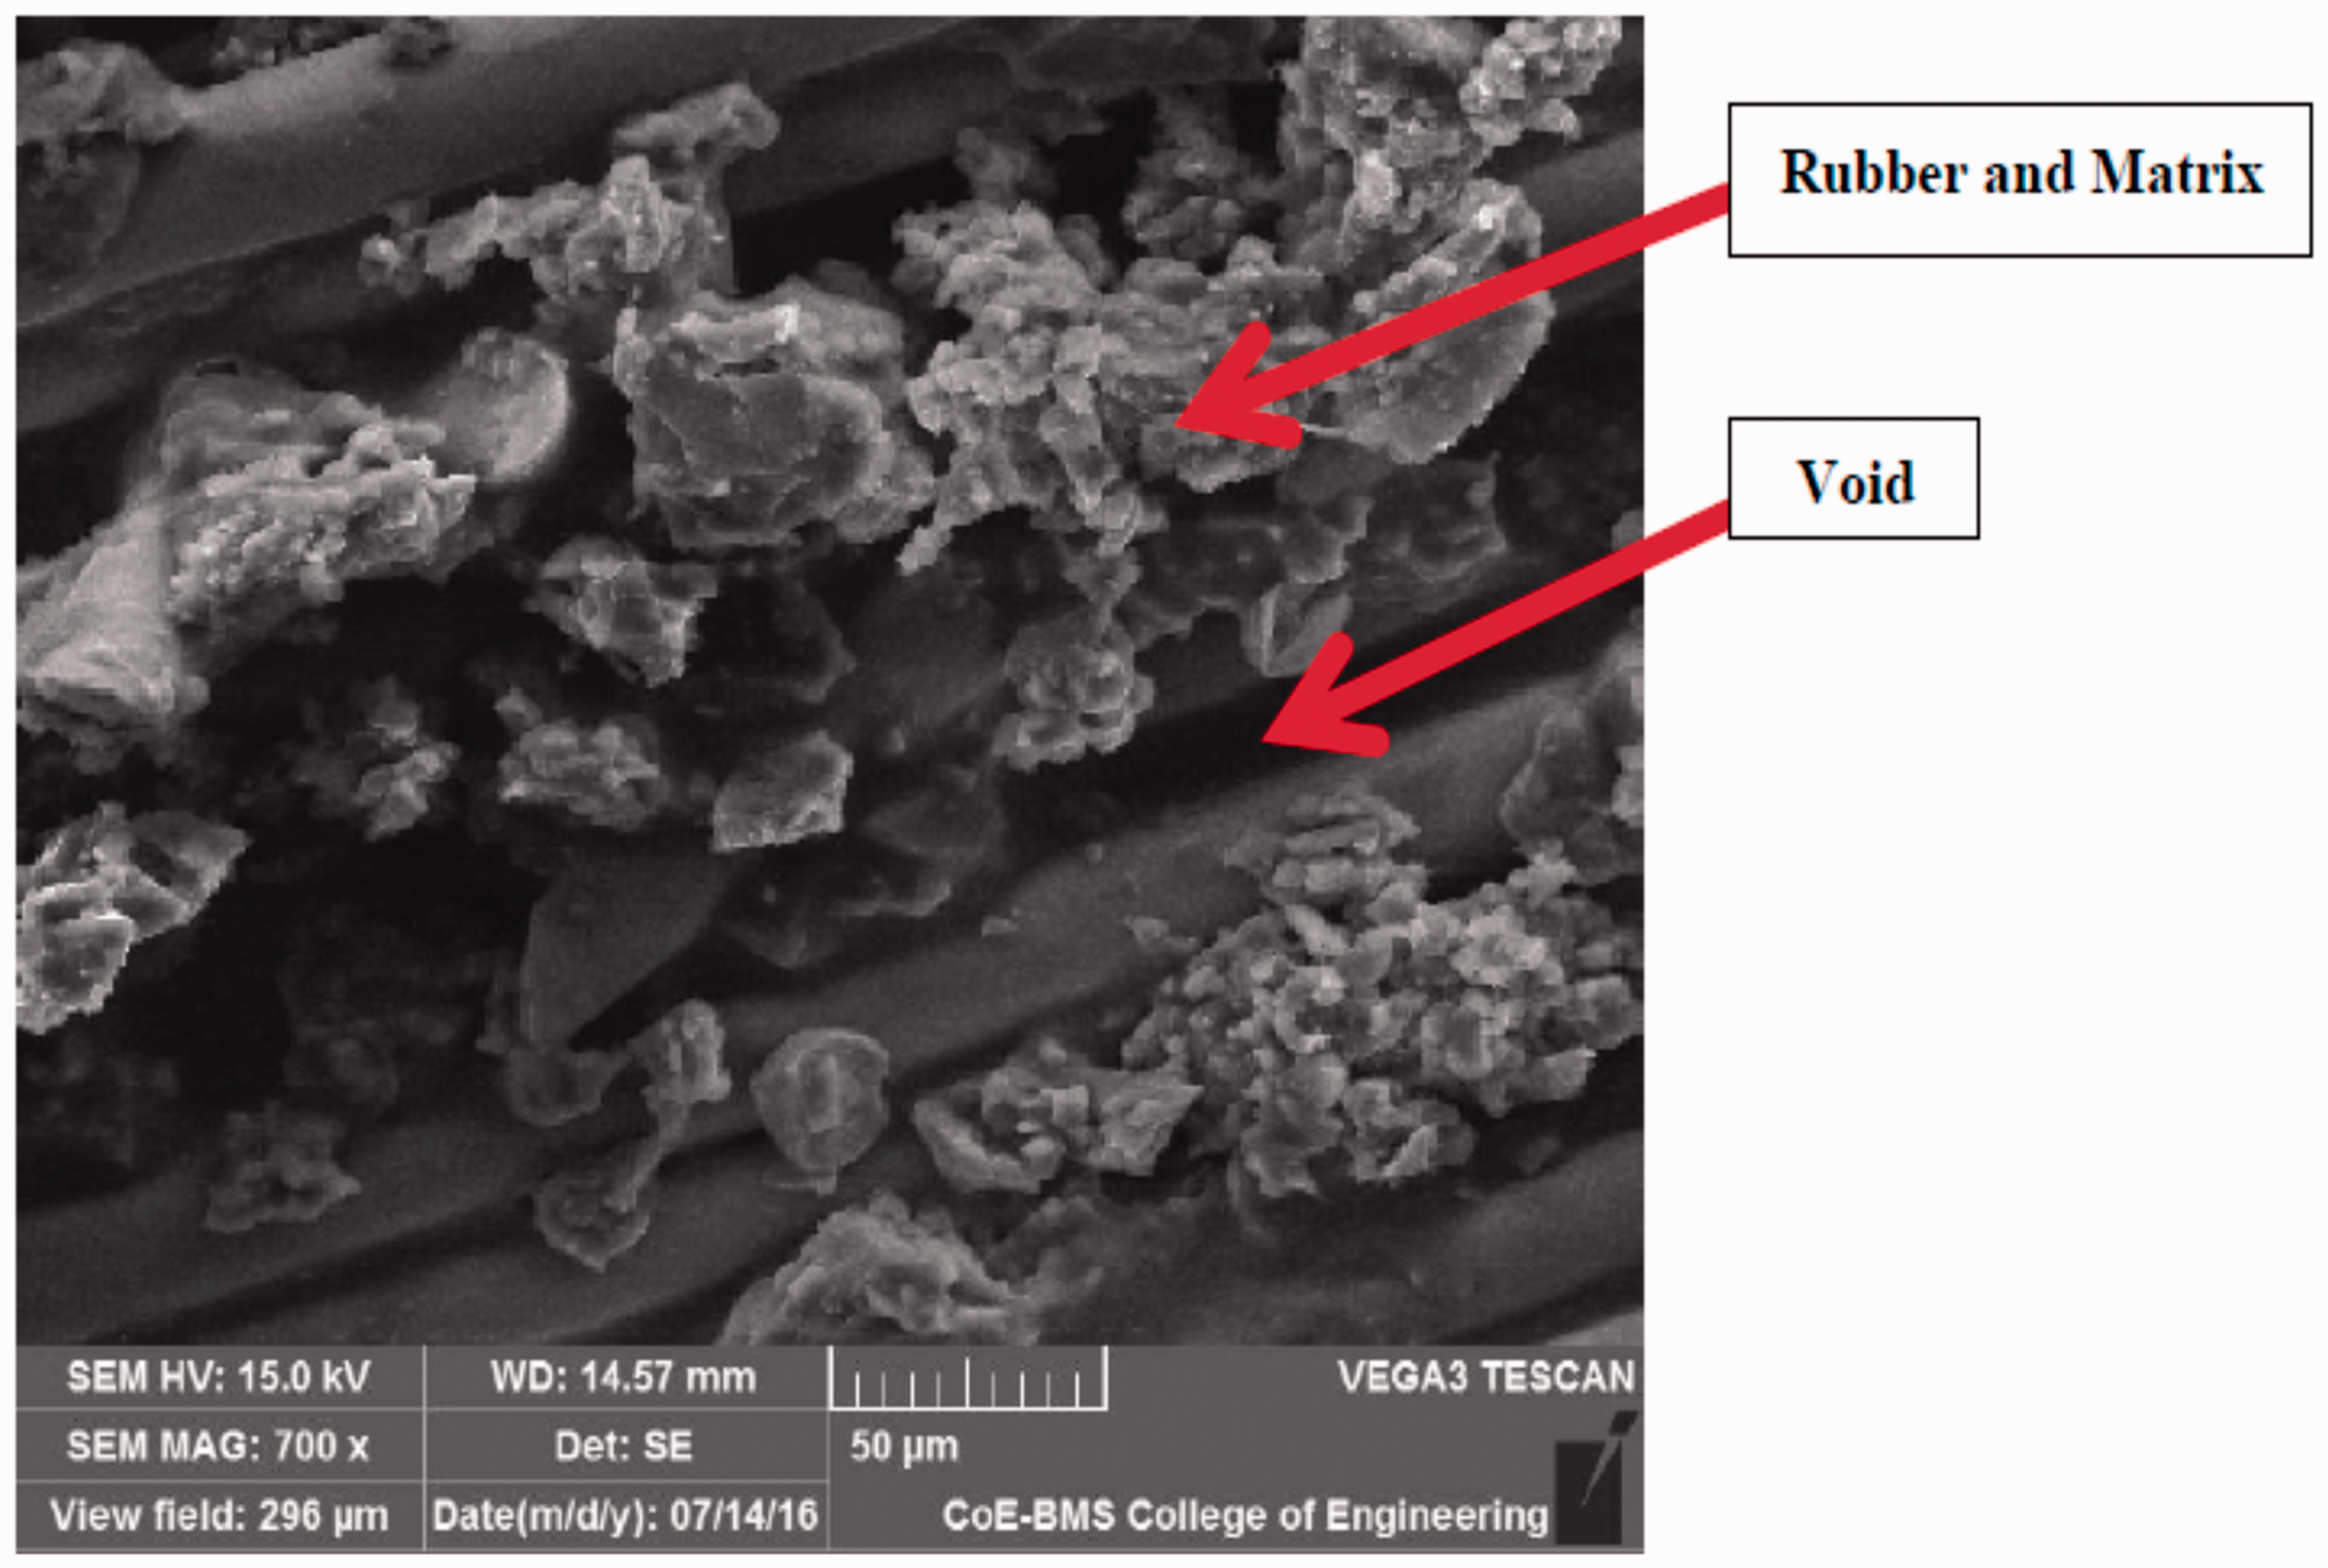


Conclusions
An attempt was made to investigate the effect of WC as filler on the mechanical properties such as tensile strength, Young's modulus, flexural strength, and impact strength of four hybrid composites: G + J + E, G + R + E, G + S + E, and J + R + E.
The following are the findings of our investigation:
Without filler loading (WC=0%): The G + R + E composites shows higher tensile strength in comparison to J + R + E. In filler loading (WC=5% and WC=10%): The G + R + E composites shows higher tensile strength in comparison to J + R + E composites. Among the four hybrid combinations (with and without filler loading): The G + R + E composites shows higher tensile strength, but G + J + E composites show maximum flexural and impact strength. The J + R + E composites exhibits lowest mechanical properties. From the results, it is evident that ductility, tensile, and impact strength were better in WC=10% than in WC=5%. The G + J + E and G + S + E composites show variation at WC=0% and WC=5%, but their ductility, tensile, and impact strength are almost the same at WC=10%. Increased flexural strength by an increase in filler loading was noticed in the G + R + E and J + R + E composites. But there is not much variation in the flexural strength of the G + S + E composites. In the wear test, the wear rate was reduced by an increase in the percentage of WC. Also, the specific wear rate decreases with the increase in abrading distance. From all these results, it was observed that the filler loading can increase the mechanical properties and decrease the wear rate.
Footnotes
Declaration of Conflicting Interests
The author(s) declared no potential conflicts of interest with respect to the research, authorship, and/or publication of this article.
Funding
The author(s) received no financial support for the research, authorship, and/or publication of this article.