
Abstract
This study systematically compared and analyzed the structural differences, mainly involved internal group and crystal structure, between electrospun cellulose diacetate nanofibers produced from different solvent system and raw material cellulose diacetate by means of Fourier transform infrared spectroscopy, X-ray diffraction, scanning electron microscope, thermogravimetric analysis, and differential scanning calorimeter. Due to dissolution and electrospinning process, the internal crystal structure of cellulose diacetate nanofibers significantly reduced. Furthermore, the microstructural changes of different cellulose diacetate nanofiber mats, which were fabricated by selecting acetone and acetone/N,N-dimethylacetamide as solvents and tuning process parameters, were investigated. It was found that the solution concentration, spinning voltage, and receiver distance had little effect on the fiber’s internal structure. In addition, the differences in thermal performance were analyzed between the nanofibers obtained from different solvents and the raw material cellulose diacetate by means of differential scanning calorimeters. The study shows that the electrospun nanofibers had quite different thermal properties compared with the original material cellulose diacetate. The crystallinity of the two different nanofibers decreases and the crystallization is not perfect, internal crystalline region in the two kinds of nanofibers reduces, and the thermal stability of the two kinds of nanofibers decreases compared with the raw material cellulose diacetate.
Introduction
The diameter of electrospun nanofibers, ranging from 100 to 1000 nm, is smaller than other fibers produced from conventional methods. Some previous works about the solvent and the electrospun fibers’ size was reported [1,2]. Attributed to the enormous surface area, the nanofiber films have great potentials in many fields, such as filter materials [3], sensors [4], biomedical materials [5], garments [6], and so on.
The cellulose diacetate is an environmentally friendly and biodegradable modified, regenerated cellulose material. Furthermore, it exhibits low environment pollution and abundant raw materials. It has a great prospect in electrospinning field.
The thermal performance is an important property for fiber material, which is closely related to fiber’s postprocessing and utilization performance.
So far, neither the differences between the electrospun cellulose diacetate (CA) fibers and raw materials in the thermal transition behavior and thermal degradation behavior nor the thermal difference of nanofibers prepared from different kinds of solvent system have aroused widespread attention. In this article, we employed varied methods to characterize the structure and thermal properties of electrospun nanofibers, and analyze the effect on the crystal structure and thermal properties of electrospun nanofibers by tuning the processing parameters.
Materials and methods
Materials
The cellulose diacetate (CA; substitution degree 2.0, polymerization degree 800–1000, molecular weight for a single unit approximately 303) was obtained from Nantong Acetate Fiber Company in Jiangsu Province, and it exhibits powder granular.
N,N-dimethylacetamide (DMAc; analytical grade, CH3CON(CH3)2, molecular weight 87.12, boiling point ca. 160°C) was purchased from Shanghai Reagent Company.
Acetone (analytical grade, CH3COCH3, molecular weight 58.08, boiling point ca. 56°C, volatile) was purchased from Shanghai Reagent Company.
Scanning electron microscope test
The samples were sprayed with gold for 90 s. Then, they were characterized by scanning electron microscope (SEM; JSM-6360LV, Japan) and the scanning voltage was 15Kv.
Fourier transform infrared spectroscopy test and X-ray diffraction test
The samples were tested by Fourier transform infrared (FT-IR; Nicolet NEXUS-670 Nicolet infrared-Raman spectrometer, America). Its resolution rate is 22 cm−1 and every sample was scanned for 100 times.
The samples were characterized by X-ray diffraction (XRD; Rigaku D/Max—2550 PC 18 kW turn target X-ray diffraction, Japan, scanning rate is 0.6° min−1).
Thermogravimetric analysis and differential scanning calorimeter analysis
The samples were tested by thermal gravimetric (TG; Netzsch TG 209 F1, Germany). The heating rate was 10°C min−1, and the thermal degradation temperature ranged from 30 to 800°C.
The samples were characterized by differential scanning calorimeter (DSC; Netzsch DSC 201F1, Germany). The nitrogen flowing rate was 20 mL min−1, and the heating rate was 10°C min−1, with the thermal degradation temperature ranging from 0 to 300°C.
Results and discussion
Nanofibers prepared by dissolved CA in two solvents respectively
The cellulose diacetate and solvents were quantified and weighted according to calculation (the concentration of solution is 8%). After solvents were mixed sufficiently, the cellulose diacetate was added. Then, the solutions were fully stirred and followed by standing for 24 h, two kinds of spinning solution were prepared respectively.
Figure 1 shows SEM images of CA nanofiber membranes, produced by tuning the solution at the same liquid flow rate of 3 mL h−1, the same inner needle diameter of 1.2 mm, the same voltage of 15 kV, the same receiver distance of 20 cm, and the same magnification of 50 times.
Scanning electron microscope (SEM) images of cellulose diacetate (CA) nanofiber membranes produced by tuning the solvent: (a) acetone; (b) acetone/N,N-dimethylacetamide (DMAc) mixture solvent at the weight ratio of 2:1.
As shown in Figure 1, the diameter of CA nanofibers produced by acetone ranges from 0.972 to 1.972 µm, while the diameter of nanofibers produced by acetone/DMAc mixture solvent ranges from 0.186 to 0.324 µm. So, the diameter has a large variation by tuning the solvents. In addition, comparing these two kinds of nanofibers, it was found that the nanofibers in the Figure 1(a) have a cross-linking phenomenon, large diameter variation, and uneven fineness among single fibers, but Figure 1(b) exhibits good uniformity between single fibers and relatively minor diameter variation.
FT-IR spectral analysis
The vertical axis of FT-IR curves stands for the transmission rate (T%). As known, if the characteristic peak is even sharper, the corresponding transmission rate is smaller, and the absorbency is bigger. As shown in Figure 2, the cellulose diacetate has a broad absorption band at the wave number of 3473 cm−1, attributed to hydroxyl (−OH) groups stretching vibration [7]. But, the corresponding absorption peak of CA nanofibers produced by the acetone solvent shifts to the wave number of 3444 cm−1, and the absorption intensity decreases significantly. It demonstrated that, after dissolution, the −CH− group content on CA macromolecular chain decreases. Thus, the hydrogen bonds between the CA macromolecules reduce, and the interaction forces were weakened, eventually leading to the position of hydroxyl peak shift. The nanofibers produced from acetone/DMAc mixture solvent have almost no absorption during this wave number interval.
The Fourier transform infrared (FT-IR) spectrogram: (a) the original cellulose diacetate (CA) material; (b) the CA nanofibers produced from the solvent of acetone; (c) the CA nanofibers produced from acetone/N,N-dimethylacetamide (DMAc) mixture solvent at the weight ratio of 2:1.
The cellulose diacetate has a less obvious absorption peak at the wave number of 2936 cm−1, which attributed to the stretching vibration caused by −CH− groups in the cellulose macromolecules. It is noteworthy that both electrospun nanofibers have nearly no absorption at the corresponding wave numbers.
The cellulose diacetate has an obvious absorption peak at the wave number of 1755 cm−1, indicating that it contains the C = O bond. But, the corresponding absorption peaks from the two kinds of nanofibers shift, respectively, to the wave numbers 1740 cm−1 and 1744 cm−1. When the mixed solvents are used, the corresponding absorption intensity of nanofibers relatively reduces, compared to the cellulose diacetate. It shows that the content of these groups relatively decreases.
All the original CA material and two kinds of nanofiber membranes have characteristic absorption peaks, respectively, at the wave numbers 1375 cm−1, 1367 cm−1, and 1369 cm−1. It indicates that all of them contain methyl (−CH3) groups, but the absorption intensity of the nanofibers at the wave number 1369 cm−1 is obviously smaller.
The original CA material and two kinds of nanofiber membranes separately have a less obvious absorption peak at the wave number of about 901 cm−1, which belongs to the stretching vibration of methylene groups (−CH2−), due to the stretching vibration of C−O−C bonds in the asymmetric surface and the bending vibration of C-H bonds. The peaks at 1044 cm−1 and 1230 cm−1 also have little shift to 1046 cm−1 and 1047 cm−1, 1233 cm−1 and 1235 cm−1 for cellulose diacetate dissolved in acetone and DMAc/acetone, respectively. And, their intensity has little variation. It reveals that the dissolution and electrospinning process have no effects on the number of groups and vibration intensity.
X-ray diffraction analysis
As shown in Figure 3, when the 2θ angle ranges from 5 to 60°, the same point exhibited on the diffraction curves of the two nanofibers is that there are three relatively gentle diffraction peaks, respectively, at 8°, 18°, and about 22°. At the same time, the diffraction intensity is similar at the respectively corresponding peak width.
The X-ray diffraction curves: (a) the original cellulose diacetate (CA) material; (b) the CA nanofibers produced from the solvent of acetone; (c) the CA nanofibers produced from acetone/N,N-dimethylacetamide (DMAc) mixture solvent at the weight ratio of 2:1.
The diffraction peaks of the raw material CA are sharp, and the diffraction intensity is obviously greater than that of the two nanofibers. It reveals that the crystallinity of electrospun nanofibers is much smaller compared with the raw material CA. It is also found that when the 2θ angle varied from 5 to 15°, several diffraction peaks exhibit on the diffraction curve of the raw material CA, but these corresponding peaks disappear on the diffraction curves of the two nanofibers.
Figure 3(b) and (c) shows that the crystallinity of the two different nanofibers decreases similarly, probably due to the property of different solvents. And, the electrospinning process is susceptible to the selected solvent system. It may be related to the solvent volatility and dissolubility. As for DMAc/acetone mixture solvents, the evaporation rate of the whole solvent system slows down [8]. It is detrimental to the rapid crystallization, and the volatility of solvent must destroy the crystallized regions. In addition, the nanofibers prepared from mixed solvent have several relatively sharp diffraction peaks at the 2θ angle of 12.738° and 30.119°.
In the whole ranges of 2θ angle, the area under the diffraction curves of the nanofibers is significantly smaller than that of the raw material CA, and the diffraction peaks are much wider. It reflects that the total diffraction intensity and crystallinity for the electrospun nanofibers are much smaller compared with the raw material CA. In the electrospinning process, the molecules of cellulose diacetate recrystallize. Due to the relatively short time of recrystallization, the crystallization is not perfect and the crystal area decreases. Furthermore, the area of amorphous region increases [9].
It is concluded that in two kinds of different solvent systems, the same point of the two different nanofibers is that the crystallinity has decreased and the crystallization is not perfect. In addition, the dissolution process, to some extent, also weakens the hydrogen bond structure on the molecular chain. It makes the spacing distance of molecules bigger and the area of amorphous region increases, which is the same with the XRD test results [10,11].
Characterization of TG
TG test is adopted in this experiment. The initial weight of raw material CA, and the two kinds of nanofiber membranes separately prepared from only acetone solvent and the mixed solvent are 1.71 mg, 2.00 mg, and 4.35 mg, respectively. As shown in Figure 4, it is obvious that the change trend is basically the same for the three curves in the range of temperatures in the TG curves.
The thermal gravimetric (TG) curves: (a) the original cellulose diacetate (CA) material; (b) the CA nanofibers produced from the solvent of acetone; (c) the CA nanofibers produced from acetone/N,N-dimethylacetamide (DMAc) solvent mixture at the weight ratio of 2:1. Ma: mass change a, Mb: mass change b, Mc: mass change c.
The characteristic parameters of thermal degradation on the three TG curves.

CA: cellulose diacetate, TG: thermal gravimetric, DMAc: N,N-dimethylacetamide, Ti: initial peak temperature, To: onset temperature, Te: end temperature, Tf: ultimate peak temperature.
The raw cellulose diacetate (CA) material.
The nanofibers produced from the solvent of acetone.
The nanofibers produced from mixed solvent DMAc/acetone at the weight ratio of 2:1.
After the dissolution and electrospinning process, the internal structure of electrospun nanofibers may change a lot. The area of amorphous region increases, and the total crystallization of molecules decreases. Thus, the macromolecular motion increases in the high temperature, and the thermal stability of nanofibers reduces. But when using acetone as the solvent, the Tf – Ti difference is biggest. It shows that its internal crystalline structure is poor than that of the mixed solvent used. This particular phenomenon may be attributed to the experimental operation or the difference of initial weight.
In theory, the greater the weight–lose ratio, the more the sample weight loses, and the more unstable the thermal performance is. As seen from Table 1, the weight–lose ratio of the nanofibers produced from the acetone solvent is much bigger than that of the raw material CA, it reveals that the thermal stability of these fibers is worse than the raw material. But, the weight–lose ratio of the nanofibers produced from mixed solvent DMAc/acetone is less compared to the raw material. The weight–lose ratio can only reach to some extent, reflecting the change of internal structure and property within the material in some degree. In the actual testing process, the weight–lose ratio is affected by many factors, such as the initial weight, the testing temperature range, and more.
Figure 5 shows the derivative thermogravimetry (DTG) curves for the raw material CA and the two kinds of electrospun nanofibers. The vertical axis of curve stands for the weight–lose rate.
The DTG curves: (a) the original cellulose diacetate (CA) material; (b) the CA nanofibers produced from the solvent of acetone; (c) the CA nanofibers produced from acetone/N,N-dimethylacetamide (DMAc) solvent mixture at the weight ratio of 2:1.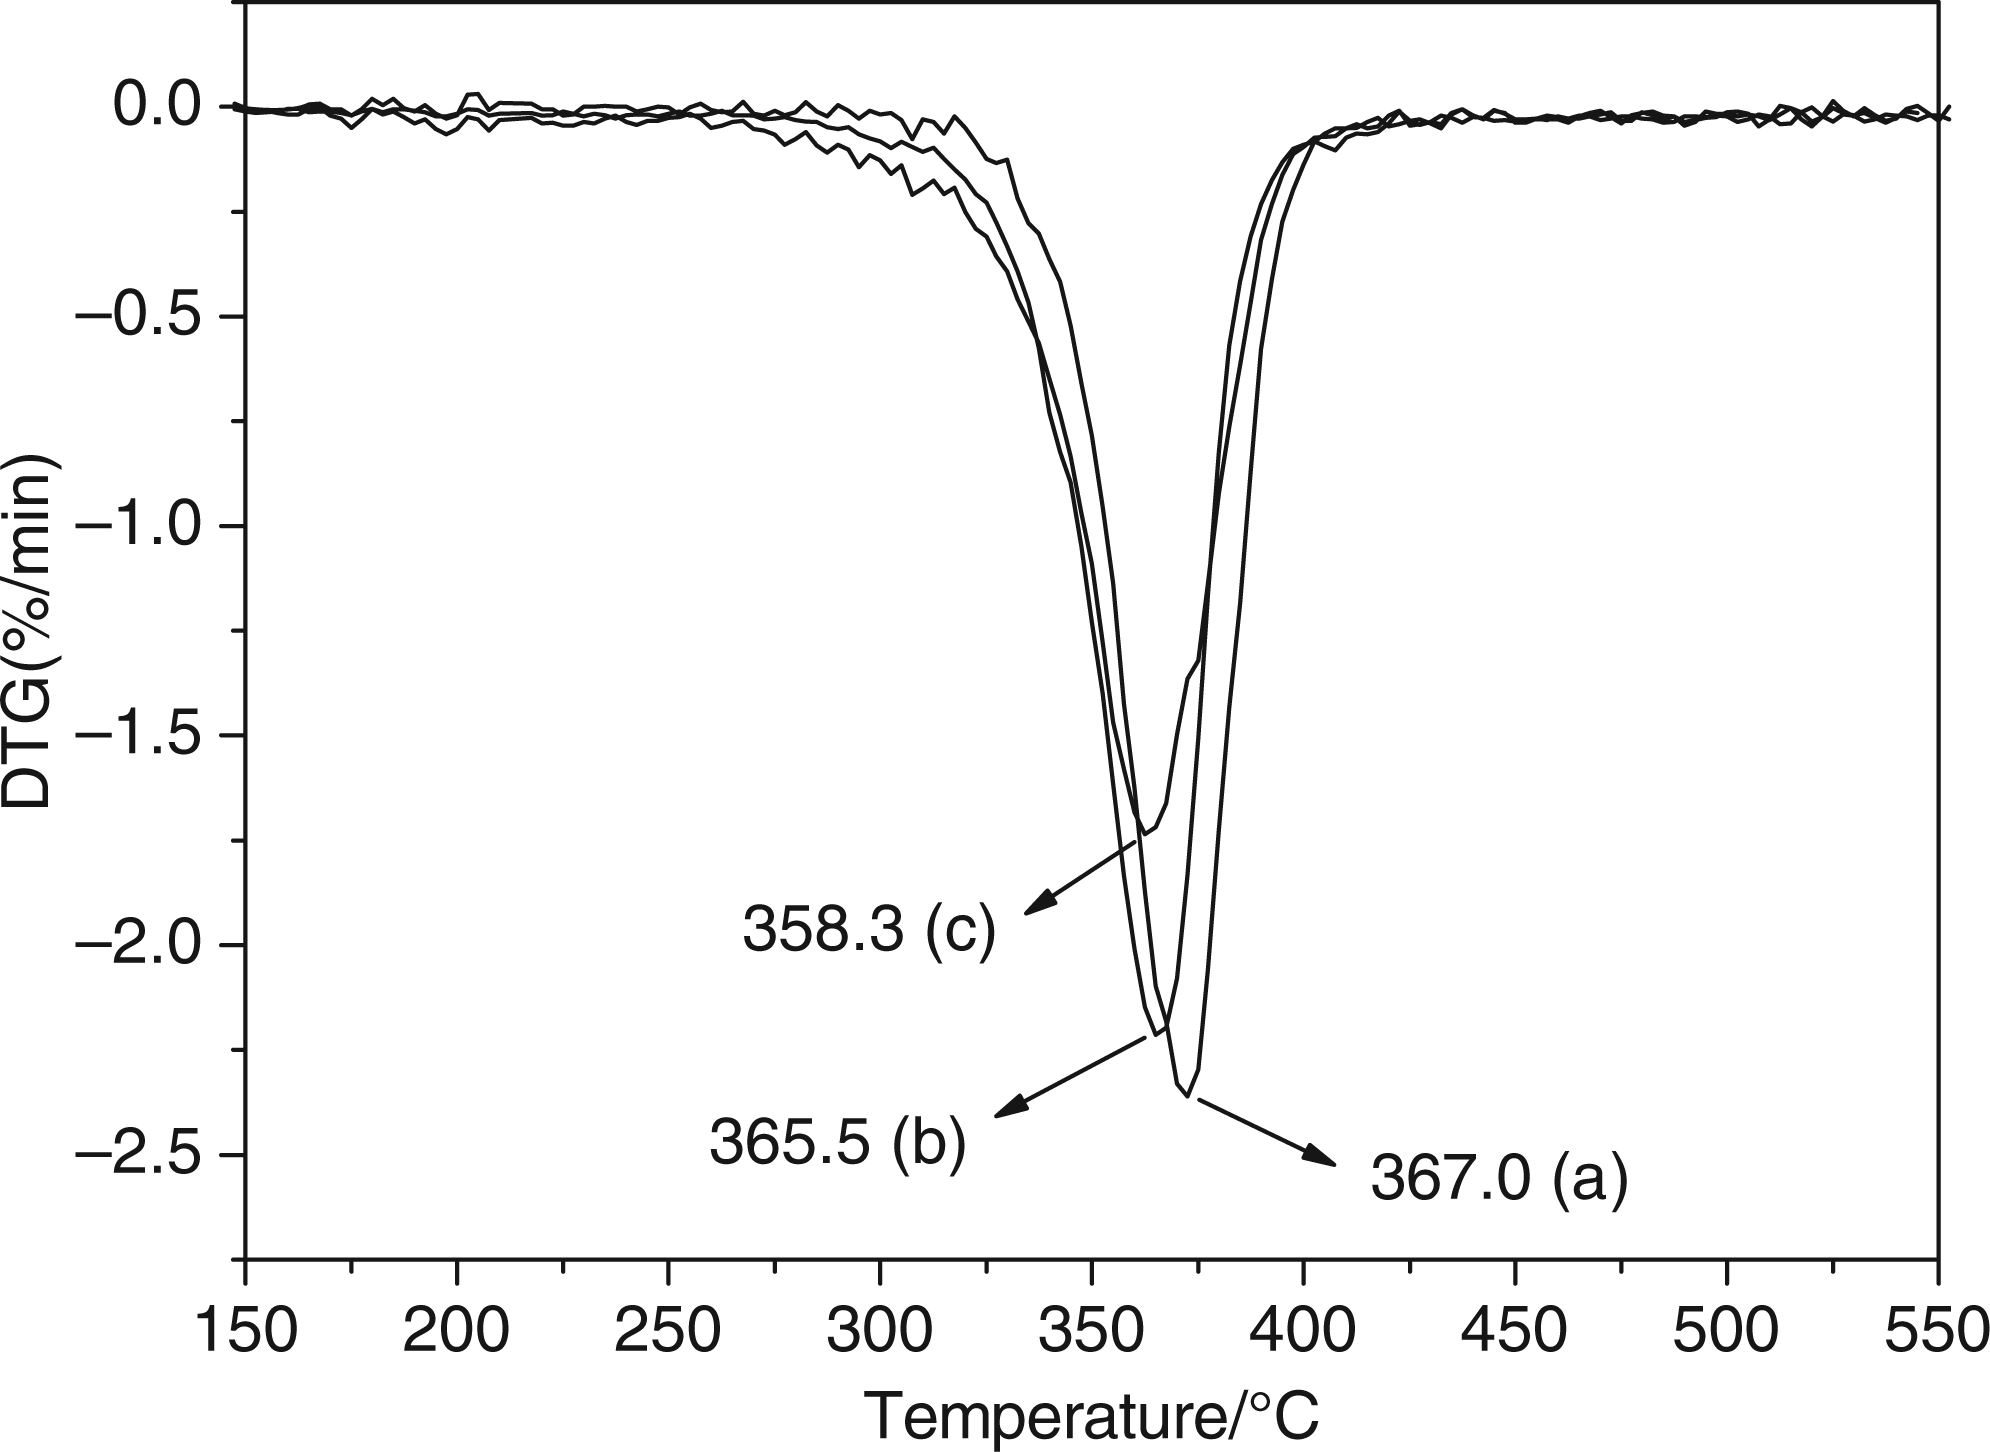
The characteristic parameters of thermal degradation on the three DTG curves.

CA: cellulose diacetate, DMAc: N,N-dimethylacetamide, dm/dT: maximum degradation rate.
The raw CA material.
The nanofibers produced from the solvent of acetone.
The nanofibers produced from mixed solvent DMAc/acetone at the weight ratio of 2:1.
In summary, it is found that the distribution of internal crystalline region and crystallinity in the two kinds of nanofibers reduce, which matches to the results by the infrared spectroscopy and XRD analysis. Comparing the two kinds of nanofibers, the thermal stability of nanofibers produced from only acetone solvent is obviously better. But, the crystallinity of these nanofibers is relatively lower, and the structure of macromolecular chains changes significantly. So, it weakens the thermal stability to a certain extent.
Characterization of DSC
Differential scanning calorimetry test is adopted in this experiment to characterize the thermal property. For the three samples, the original CA material, the CA nanofibers produced from the solvent of acetone, and the CA nanofibers produced from acetone/DMAc solvent mixture at the weight ratio of 2:1, their initial weights are 3.01 mg, 2.37 mg, and 3.21 mg, respectively. Figure 6 shows the DSC curves of three samples.
The differential scanning calorimeter (DSC) curves: (a) the original cellulose diacetate (CA) material; (b) the CA nanofibers produced from the solvent of acetone; (c) the CA nanofibers produced from acetone/N,N-dimethylacetamide (DMAc) solvent mixture at the weight ratio of 2:1.
For the three curves shown in Figure 6, the temperature of corresponding peak on (c) curve is the lowest, only 230.9°C. It reveals that the nanofibers prepared from mixed solvent are the first to reach the transformation of internal structure, and the thermal stability is the worst.
The characteristic parameters of glass transition region on the three DSC curves.
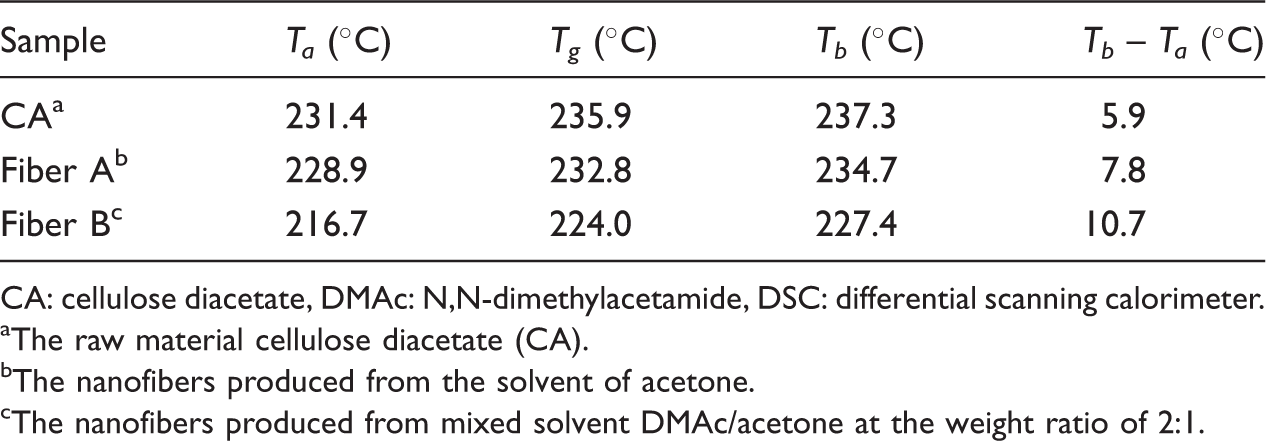
CA: cellulose diacetate, DMAc: N,N-dimethylacetamide, DSC: differential scanning calorimeter.
aThe raw material cellulose diacetate (CA).
The nanofibers produced from the solvent of acetone.
The nanofibers produced from mixed solvent DMAc/acetone at the weight ratio of 2:1.
Another parameter, that is, specific heat capacity (Cp = (dH/dt)/(dT/dt)) is defined as the absorbed heat per unit mass of material with the temperature rising 1°C. In theory, the greater specific heat capacity, the more the heat absorption quantity, and the better the thermal performance of material. In this experiment, dT/dt is constant at 10°C min−1. The specific heat capacity is related with the corresponding peaks of DSC curves. The higher the peak, the greater the specific heat capacity is. As shown in Figure 6, the (b) curve exhibits the best thermal stability, and (c) curve exhibits the worst thermal stability. But, it is also found that the corresponding peak on curve (a) is much smaller compared with curve (b), indicating that the specific heat capacity of raw material CA is smaller than that of electrospun nanofibers. This phenomenon is different from the TG test results. This may be caused by the different temperature ranges, which is due to the improper manipulation in the test.
In theory, the melting heat of different materials can be calculated based on the DSC curves. Thus, the ratio of melting heat, that is, crystallinity, can be obtained. But, because the melting heat of complete crystallization for cellulose diacetate is unknown, it fails to the quantitative analysis.
By means of TGA and differential scanning calorimetry, we can draw the basic conclusions that the thermal stability of the two kinds of nanofibers decreases compared with the raw material CA, and the conclusions is consistent with infrared spectroscopy and XRD analysis.
Conclusion
For the two kinds of electrospun nanofibers, their crystallinity decreased compared with the raw material CA, and the−OH groups on the macromolecular chains reduced significantly. Furthermore, the CA nanofibers produced from acetone/DMAc mixture solvent at the weight ratio of 2 : 1 had the larger variation amplitude.
The thermal stability for the two kinds of electrospun nanofibers weakened, compared with the raw material CA, and the CA nanofibers produced from acetone/DMAc mixture solvent at the weight ratio of 2 : 1 had the larger variation amplitude.
Footnotes
Funding
This work was supported by grants (50973014 and 11172064) from the National Natural Science Foundation of China and from the Foundation for the Author of National Excellent Doctoral Dissertation of P.R. China (200961), as well as sponsored by Shanghai Rising-Star Program in China (10QA1400100) and Fok Ying Tong Education Foundation (121071), also supported by Program for New Century Excellent Talents in University and the Fundamental Research Funds for the Central Universities.