
Abstract
The purpose of this study was to explore the effect of the listener’s education and occupation on intelligibility, comprehensibility (ease of understanding), and accentedness in speakers of Russian-accented American English (RA), Southern-accented American English (SA), and General American English (GAE). Native English listeners (N=126) rated various aspects of each sample presented via a questionnaire. All aspects of speech other than rate were rated highest in the GAE sample followed by the SA and RA samples. Intonation and fluency aspects of accented speech appeared to be influenced by the differences in educational or occupational backgrounds. The study also discussed additional influential factors for the perception of accented speech such as clarity, accentedness, and acceptability of speech for SLPs. This study contributes to increase the awareness of factors associated with the negative perception of regional and foreign accents.
Keywords
The culturally and linguistically diverse population of the United States has rapidly increased in recent years (Zong & Batalova, 2016). The population growth and trend toward diversity resulted in an increased demand for culturally and linguistically diverse speech-language pathologists (SLPs) within the communication sciences and disorders (CSD) field (American Speech-Language-Hearing Association [ASHA], 2017). Despite the need for clinicians with diverse backgrounds, the demographic profile of most SLPs is described as primarily White/Caucasian (78.3%, ASHA, 2022). According to the U.S. Census Bureau (2019), about 40% of the U.S. population is diverse by race/ethnicity. In addition, very few members (8.2%) identify themselves as multilingual service providers (ASHA, 2022), whereas 22% of the U.S. population speak a language other than English at home (U.S. Census Bureau, 2017).
The increase in diversity in the U.S. population has caused a mismatch between the backgrounds of clients and clinicians in CSD (ASHA, 2011; Levy & Crowley, 2012). A previous study by Levy and Crowley (2012) provided information on how individuals in CSD field/occupations perceive SLPs with accented speech. Most directors of SLP graduate programs felt that clinicians with accented speech can appropriately treat most disorders regardless of their accented speech. Considering the expected continuous increase of diverse speakers of multiple languages, it is urgent to promote cultural awareness and sensitivity as well as cultural competency among SLPs (Chakraborty et al., 2019). Although ASHA has a position statement regarding discrimination of individuals who speak with various social dialects that are differences, not disorders (ASHA, 1983), speakers whose speech characteristics deviating from general production of a target language are perceived with biases, stereotypes, and/or prejudice (Gluszek & Dovidio, 2010b). These phenomena toward accented speakers also become barriers for students and professionals in the field of CSD.
Accented speech deviates from the general production of a particular language used in schools, media, and many workplaces in a certain culture or nation (ASHA, 2003). The term, perceptions of accents refers to the way people perceive and evaluate the degree to which someone speaks with an accent that is different from their own. Accents can reflect factors such as socioeconomic status, geographical, ethnic backgrounds associated with the speaker. The topic of accents is complex and context-dependent, being influenced by various factors, such as the listener’s familiarity with the accent and their attitudes toward the accent’s culture or language (Babel & Russell, 2015; Munro & Derwing, 1995; Munro et al., 2006). Accents perceived by a listener are associated with social values, such as desirability and prestige (Moyer, 2013) and are perceived across languages including English. Accent variations can be grouped in two categories: foreign accents and regional accents (ASHA, n.d.-a.).
Foreign accents cause variations in perception when the definition of accent incorporates the foreignness (Cristia et al., 2012). Regional accents also cause the perceived changes in pronunciation but mainly in the speaking styles among native speakers of a language, which makes it even harder to differentiate them and identify the origin/region of the speaker (ASHA, n.d.-a.). It is often acknowledged that accents can be ranked on a perceptual scale according to their acoustic distance from the native speech (e.g., Clarke & Garrett, 2005), with most foreign accents standing at the far end of the perceptual scale and regional accents somewhere in between (e.g., Dewaele & McCloskey, 2015).
Accentedness can have both positive and negative connotations, depending on the listener’s perception. Speakers with accented speech are given different values (e.g., more positive vs. more negative) based on the degree and characteristics (e.g., British, Australian accents [various accents in English-speaking countries] vs. Spanish, Russian [foreign accents]) of accents perceived by the listener (e.g., Carlson & McHenry, 2006; Tsurutani, 2012). Accented speech can enrich communication and foster cross-cultural understanding by reflecting the speakers’ cultural and social origins, affiliations (e.g, nationality, region), membership (e.g., ethnicity), and social class (Kinzler et al., 2009). However, individuals of accented speech can sometime be stigmatized or discriminated against as linguistically incompetent as a result of perceived accented speech (Cargile & Giles, 1997; Giles & Billings, 2004; Yilmaz, 2021). Previous research has found that those who violate the conventions of the general production could be judged negatively by listeners due to differences in the pattern of stress and fluency (Foote & Trofimovich, 2016). Others have found that the perceptions of dialectal and accented speech are often linked to linguistic discrimination, biases, racism, prejudices, microaggressions toward an accented speaker, resulting in negative views on their academic and work credentials, competency, and intelligence (Chakraborty et al., 2019; Gluszek & Dovidio, 2010a, 2010b; Orelus, 2020; Pimentel, 2003). Accentism or linguicism is discrimination against speakers with linguistic variations, and this would have a significant impact on their lives across the settings (e.g., education, occupation/employment; ASHA, 2011; Chakraborty et al., 2019; Cheng, 1999; Levy & Crowley, 2011; Pimentel, 2003).
Owing to the listener’s negative perception of accentedness, accents could be a life-time barrier and have negative impacts on speakers with accented speech across the settings (e.g., educational and employment opportunities, housing choices) (Baugh, 2018; Carlson & McHenry, 2006; Cerrato, 2017; Deprez-Sims & Morris, 2010; Lev-Ari & Keysar, 2010; Timming, 2016). Speakers of General American English (GAE) were historically rated as more credible (Yost, 1977) and intelligent (Riney, 1990) than speakers of African American English (AAE). Furthermore, college-level courses taught by native speakers of GAE were reported as preferred courses compared to courses taught by instructors with a southern American accent (Rubin & Smith, 1990). Carlson and McHenry (2006) also reported that foreign-accented and AAE speakers were also given lower employability scores because of their speech. Similarly, another study reported that Japanese accented job applicants were less favored as compared to French accented job applicants for the same positions requiring greater communication demand (Hosoda & Stone-Romero, 2010). In addition, Lindemann (2005) found that when various foreign-accented English speakers were compared, Russian-accented speakers were rated as less pleasant and less friendly than accented speakers of other languages (e.g., Spanish and French). The author explained that this finding may have been the result of a negative portrayal of Russian individuals in the media. These studies illustrated negative biases against certain groups of people whose speech differed from GAE and also showed a relationship between the perception of accented speech and qualities attributed to the speaker (e.g., Carlson & McHenry, 2006; Riney, 1990). Similarly, a study reported the strong correlations between the perception of intelligibility and personal qualities (i.e., professionalism, intelligence, and resourcefulness) attributed to nonnative speakers of English (first language [L1]: Spanish, Russian, Hindi/Kannada). The study also stated when listeners rated greater perception of intelligibility, positive perception of personal qualities was observed, and concluded the importance of perception of intelligibility for listeners’ positive judgments toward the speakers with accented speech (Fuse et al., 2018). In this study, nonnative English speakers (Mandarin L1) were also included; however, the ratings of perception of intelligibility as well as personal qualities of Mandarin accented speech were rated lower as compared to other three accents. Mandarin was the only tonal language of the four accents and the prosody of the speech samples might have had an influence of the tonal characteristics (e.g., intonation and stress) of Mandarin. As a result, the listeners’ nontonal language backgrounds may have impacted the intelligibility ratings of tonal language, Mandarin accented samples (Archibald, 1997; Fuse et al., 2018). One study investigated the experiences of speakers with nonnative accents and their perceptions of stigmatization and discrimination and revealed that Asians and Latinos reported higher levels of perceived stigmas than did individuals with European accents (Gluszek & Dovidio, 2010a).
Dimensions Used to Examine Perception of Accented Speech
Three speech dimensions are widely used to assess the perception of accented speech: intelligibility, comprehensibility (ease of understanding), and accentedness (Behrman & Akhund, 2013; Derwing & Munro, 1997; Kennedy & Trofimovich, 2008; Munro & Derwing, 1995).
Intelligibility explains the degree to which a listener understands an utterance (Derwing & Munro, 1997; Kennedy & Trofimovich, 2008); this can be measured through listener transcriptions of speech (e.g., Bent & Bradlow, 2003) or Likert scales (e.g., Jaber & Hussein, 2011). A number of factors may influence how intelligibility is perceived including intonation, clarity (Jaber & Hussein, 2011), rate (e.g., Llurda, 2000), and intensity (e.g., Neel, 2009).
Comprehensibility refers to the ease at which the listener understands an utterance produced by the speaker (Gass & Varonis, 1984; Munro & Derwing, 1995). It pertains to how much effort the listener needs to understand the speaker’s message for communication success (Barefoot et al., 1993). Fluency is known to be a strong predictor for comprehensibility (e.g., Trofimovich & Isaacs, 2012).
Accentedness refers to the listener’s perception of the degree or level of prominence or distinctiveness of a person’s or group’s speech or accent compared to the dominant or standard variety of the language (Munro & Derwing, 1995). The perception of accentedness can be influenced by various factors, including the listener’s expectations or biases. Therefore, various aspects mentioned above should be included for the discussion of perception of accented speech in relation to these three dimensions.
Listener’s Factors Influencing the Perception of Accented Speech
Listeners’ Backgrounds and Exposure to Accents
Accents are a behavioral consequence that occurs only when listeners perceive it (Lippi-Green, 2012; Moyer, 2013; Planchenault & Poljak, 2021). Factors influencing perception of speech vary. Accent perception is an active cognitive process in which listeners’ background factors play a role. Perception of speech is influenced by listeners’ physical ability such as age (Adank & Janse, 2010) and hearing acuity (Gordon-Salant et al., 2010). Other factors related to listeners’ experience are listeners’ attitude (Ingvalson et al., 2017; Kang & Rubin, 2009), familiarity (Munro et al., 2006), prior knowledge of particular accents’ characteristics (e.g., Clopper & Pisoni, 2004), and the speaker’s or the listener’s language background (Bent & Bradlow, 2003). Environmental factors such as context (Carlson & McHenry, 2006) and noise (Gordon-Salant et al., 2010) may affect the listeners’ perception of accented speech as well.
Listeners’ judgments and perception of accented speech are affected by their language experience (Gass & Varonis, 1984). A strong correlation between listeners’ familiarity with the accent and their judgments of intelligibility was reported (Bent & Bradlow, 2003; Derwing & Munro, 1997; Gass & Varonis, 1984; Munro et al., 2006). Bradlow and Bent (2008) explained that increased exposure to an accent enhances the quality of the perceptual experience of the listener. They indicated that listeners can adapt to nonnative speech through passive (overhearing) and active adaptation. Active perceptual adaptation occurs when the listener interacts or converses with an accented speaker. Prior research has found that a listener’s perception of an unfamiliar accent or dialect can be improved with repeated exposure (e.g., Adank & Janse, 2010; Witteman et al., 2013). Multiple encounters with a novel accent can improve the listeners’ ratings of intelligibility and comprehensibility (Adank & Janse, 2010; Bent & Bradlow, 2003) and their understanding of the message (Witteman et al., 2013). Repeated exposure to nonnative phonemes in lexical contexts has been also reported to improve phonetic discrimination (Olmstead & Viswanathan, 2018).
Accents were perceived in a fundamentally different way by listeners whose first language were different (Kang et al., 2016). Research on the effect of listeners’ first language backgrounds on their ratings of accented speech intelligibility of accented speech has yielded mixed results. Some studies have suggested that acoustic-phonetic similarities between the listener’s L1 and the speaker’s L1 can improve the listener’s ratings of intelligibility of the accented speech (Bent & Bradlow, 2003; Major et al., 2002). Major et al. (2002) reported that Chinese and Japanese listeners were found to understand Spanish accented English well, possibly due to acoustic-phonetic similarities between Chinese, Japanese, Korean, and Spanish. However, other studies showed contrasting results. According to Munro et al. (2006), few differences were found in the ratings of accented speech among listeners of different L1 backgrounds. It was also reported that native and nonnative listeners demonstrated similar ratings of accented speech (MacKay et al., 2006).
Shared language background between interlocutors in communicative interactions may affect the perception of accented speech. Phonetic convergence is the phenomenon that the speech of interlocutors becomes more similar during a communicative interaction, which may be a general characteristic of human communicative interactions (Coupland, 1984; Putman & Street, 1984). Olmstead et al. (2021) indicated that such phonetic convergence may be interrupted in the interactions involving nonnative speakers due to the mismatches in interlocutors’ phonetic repertoire. The interrupted phonetic convergence between individuals with different language backgrounds may possibly affect the interlocutors’ adaptations to accented speech. A failure to elicit a short-term adaptation effect to unfamiliar regional and foreign accents has been also reported (Adank & McQueen, 2007; Floccia et al., 2009).
Influence of Educational and Occupational Backgrounds on the Perception of Accent
Despite the wealth of literature on factors influencing the perception of accented speech, there is a lack of research on the influence of listener-related factors such as education and occupation. A few studies have assessed how individuals’ educational and occupational backgrounds (e.g., Hsieh, 2011; Huang, 2013) influence the ratings of intelligibility (e.g., intonation, clarity, and rate), as well as overall comprehensibility (including fluency), and accentedness. Previous research has shown that individuals with fewer years of education expressed less critical judgment about people’s foreign accent than those with a bachelor’s or a master’s degree, who more harshly judged a speaker’s accent by attributing it to an incomplete acquisition of English (Dewaele & McCloskey, 2015). However, contradicting results have been also reported: Highly educated people were more likely to have positive attitudes toward language diversity (Byrnes et al., 1997; Smitherman & Villanueva, 2000), possibly due to their exposure to individuals with diverse language backgrounds and accents. Similarly, in a study (Chakraborty et al., 2019) examining nonnative accent perception among high schoolers, SLP students, and SLP professionals, significantly more unbiased beliefs about persons with accented speech were found in the SLP students and SLP professionals compared to high schoolers.
It has been also reported that certain occupations or work environments may influence a listener’s perception of accented speech (Dewaele & McCloskey, 2015; Smitherman & Villanueva, 2000). There is ample research on how teachers of English as a second language (ESL) judge foreign-accented speech compared to those of other occupations, but these studies have yielded inconsistent results. Other studies reported that ESL teachers consistently rated the comprehensibility and accentedness of foreign-accented teacher’s assistants more positively than undergraduate students/inexperienced listeners (e.g., Hsieh, 2011; Huang, 2013). The ESL teacher’s firsthand experience with foreign accents likely contributed to their perception of the accents, which was consistent with the ESL teacher’s self-report (Huang, 2013). However, Caban (2003) did not find any significant differences in speech ratings of accented speech by ESL teachers, English learners with the same L1 as the speaker, and native English speakers with little exposure to the target accent. Hence, they argued that language background and academic training (e.g., for ESL teachers) do not influence how accents are perceived.
Similar research in this area found that English language arts teachers and professors who had taken courses on AAE and other American English dialects were less likely than those who did not take these courses to agree that students should only be taught in GAE. Respondents who had taken these courses expressed more positivity about students with foreign accents and more support for the idea that students learning English should receive dual language instruction in school (Smitherman & Villanueva, 2000). In addition, individuals who work in diverse environments and are exposed to accented speech were found more receptive to accented speech and were less likely to find foreign accents as “annoying” than those with less workplace exposure to accents (Dewaele & McCloskey, 2015). Regardless of this information, only one known study (Levy & Crowley, 2012) assessed how those in CSD occupations perceive accented SLPs. This study found that most directors of SLP graduate programs felt that accented clinicians can appropriately treat most disorders, regardless of their accent. However, this study did not compare the perceptions of those with CSD occupations and those who work in other fields. This highlights the need to compare how CSD and non-CSD professionals view accented speech, in order to understand how they perceive SLPs with accented speech.
Importance of Diversity in the CSD Field
Clinicians with diverse backgrounds bring unique skill sets and perspectives to the CSD field. Since SLPs must be mindful of the needs of diverse clients (ASHA, 2017), clinicians from diverse linguistic backgrounds with accented speech or who have experience with accented speech may bring advantageous skills when working with these clients. Studies have found that individuals seeking therapy often choose therapists with the same cultural or ethnic background (Cabral & Smith, 2011) because they feel a sense of connectedness and less fear of negative judgment (Harry, 2002). Moreover, Fuertes et al. (2002) reported that clients were likely to seek mental health counseling services from someone with a similar accent so that they could easily build a rapport with their counselor.
Because of the growing diversity in the United States, the perceptions of accented speech based on listeners’ educational and occupational backgrounds requires assessment. Most previous studies did not delve into the domains of intelligibility, comprehensibility, and accentedness (e.g., Hsieh, 2011). In addition, no known studies have assessed whether varying levels of education influence how listeners perceive accented speech and only one study examined if a CSD occupation (Levy & Crowley, 2012) impacts the perception of accented speech. Such information is critical for clinicians to understand the ways in which people judge accents and the reasons for these attitudes. Therefore, to assess the way individuals perceive different accents, we sought to determine listeners’ perceptions of speakers with a foreign accent (i.e., Russian) and a regional accent (i.e., Southern American). Few studies have compared the perception of a foreign accent to GAE and a regional dialect (Carlson & McHenry, 2006; Major et al., 2002). In particular, none has juxtaposed the perception of GAE, Southern Accented American English (SA), or Russian-Accented American English (RA).
Current Study
The purpose of this study was to examine how the listeners’ factors, specifically the listeners’ education and occupation affect perception and ratings of intelligibility, comprehensibility, accentedness, and acceptable speech of foreign (RA) and regional (SA) accented speech compared to GAE. The following research questions were formulated to guide the study: (1) How do listeners with different levels of education (i.e., high vs. low) rate accented speech in terms of intelligibility, comprehensibility, accentedness, and acceptable speech for an SLP? and (2) how do listeners with different occupations (i.e., CSD vs. non-CSD) rate accented speech in terms of intelligibility, comprehensibility, accentedness, and acceptable speech for an SLP? Based on previous research studies mentioned above, the following hypotheses were developed: (1) Listeners with a bachelor’s or higher degree (i.e., a 4-year college degree or higher) rate the accented speech samples more positively than listeners with less than a 4-year college degree (Byrnes et al., 1997; Smitherman & Villanueva, 2000) and (2) listeners with professional knowledge of speech and language (e.g., careers in CSD) rate the speech samples more positively compared to people in other occupations (Dewaele & McCloskey, 2015; Hsieh, 2011; Huang, 2013; Levy & Crowley, 2012).
Method
Listeners
A total of 126 native speakers of English (107 females and 19 males) participated in the
The education levels of listeners were as follows: high school/GED (n = 5), some college (n = 25), associate’s degree (n = 12), bachelor’s degree (n = 44), master’s degree or more (n = 37), and doctoral degree (n = 3). Data from listeners with a bachelor’s or higher degree were categorized into the higher education group (n = 84), whereas data from listeners with an associate’s or lower degree were categorized into the lesser education group (n = 42). Similarly, the data from listeners were divided into two groups based on occupation: those with a career in CSD (n = 35) and those with a career outside of the CSD field (n = 91). This study was approved by the institutional review board of our institution. No personal identifiers were obtained so that the confidentiality of the listeners was maintained.
Speech Samples
For the study, speech samples of GAE, SA, and RA speakers (1 male and 1 female per accent) reading the first six sentences of the “Rainbow Passage” (Fairbanks, 1960, p. 127, See Appendix A) were procured. As it includes every speech sound in the English language, the “Rainbow Passage” is considered as useful for gauging the proficiency with which a speaker can produce connected speech. Three speech samples (one GAE and two SA samples) were obtained from the International Dialect Archive (IDEA) and other three speech samples (one GAE and two RA samples) were recorded. IDEA is an online database that includes recordings of native speakers of English from more than 130 countries, speaking a variety of accents and dialects. The archive provides the background information on the speakers and the dialects they speak. For the samples that were recorded, the recordings were conducted in a quiet environment using a head-worn microphone maintaining a constant mouth-to-microphone distance of 2 inches. Microphone position and recording gain settings remained constant across all groups of speakers.
Based on the census report, from 1980 to 2010, the population of Russian speakers has been continuously increasing in the United States (U.S. Census Bureau, 2013). Speakers of Russian are largely located in the northeast region (i.e., New York, U.S. Census Bureau, 2013), and Russian language is ranked as one of the top three languages spoken in New York (New York State Office of General Services, Office of Language Services., 2021).
Speakers’ Background Information
During the speech sample selection process, speakers’ background information, such as country, state, age, gender, and location, was considered including the samples from IDEA. The GAE and SA speech samples were produced by native speakers of English (1 female and 1 male in the GAE and SA speaker groups). The speakers who were identified as having GAE and SA were born and educated in different states of the United States (female GAE speaker: New York, male GAE speaker: Illinois, female SA speaker: Kentucky, male SA speaker: Oklahoma). The speakers who were identified as having RA were born in the Ukraine and were simultaneous bilinguals in Russian and English.
Speech Sample Selection Procedures
The samples were selected on the basis of the level of accentedness as judged by speech rate, prosody (e.g., pitch), fluency, place of birth, and the speaker’s L1. The speaker’s permission was obtained for all speech samples collected. Upon selection of the speech samples, 20 monolingual English-speaking college students rated intelligibility of the six samples using a scale of 1 for least intelligible to 10 for most intelligible. All samples were judged to be moderately intelligible by native English speakers (GAE: M = 9.1, range = 7–10; SA: M = 7.9, range = 3–10; Russian: M = 7.9; range 3–10).
Survey Development
A survey was developed to rate the perception of intelligibility, comprehensibility, and accentedness of the speech samples. The survey consisted of 29 questions in total. It included two screening questions and 19 background questions to gain information about the listeners of the study (e.g., age, gender, educational, and language background). The remaining eight questions required the listeners to rate the perception of speech intelligibility and the perception of the speaker’s qualities. Owing to the focus of this study, four background and seven speech samples’ rating questions were included in the final analyses.
The assessed items included background questions (e.g., age, gender, occupation, educational, and language background) through the use of multiple choice, yes or no, and fill-in-the-blank formats. The survey also included items for which the respondent rated speech intelligibility in terms of intonation, clarity, and rate of speech. Similarly, items to assess the respondents’ perception of comprehensibility (including fluency) and accentedness of the samples were included. These questions were adapted from previous literature on the perception of accented speech (Amaro et al., 2012; Jaber & Hussein, 2011; Munro & Derwing, 1995). Since these studies used Likert scales with different points, a 6-point scale was adapted for the purposes of this study. To measure intelligibility, the listeners were asked to rate the speaker’s intonation and clarity (1 = very poor, 6 = very good). For the rate of speech, a rating of 1 represented slowest and 6 represented fastest was used. In terms of comprehensibility, the listeners were asked to rate how difficult it was to understand the speaker (1 = very difficult to understand, 6 = not difficult to understand at all) and the fluency of their speech (1 = very poor, 6 = very good). Next, for accentedness, the listeners were asked to rate the overall degree of accent of the speaker (1 = strong accent, 6 = very native-like). Finally, for acceptability, the listeners were asked to choose how acceptable the speaker sounds if they were an SLP (1 = very unacceptable, 6 = very acceptable). As noted earlier, varied perceptions were reported toward SLPs with accented speech for their abilities to appropriately treat their clients (e.g., Levy & Crowley, 2012). Since limited research compared the perception of accented SLPs of listeners in the CSD field and others, this study included the question asking the listeners to rate acceptability of a speech sample if they were an SLP, to understand how individuals in CSD and non-CSD perceive SLPs with accented speech. The survey items for intelligibility, comprehensibility, and accentedness were included in Appendix B.
Procedures
An online survey with embedded voice clips was distributed via the website, SurveyMonkey. The link was posted in Facebook groups geared toward professionals and students in the speech-language pathology or the audiology field, and it was sent to the researchers’ contacts via email. Listeners either responded to the recruitment advertisement on Facebook or an email that provided a link to the survey. No personal identifiers were obtained to preserve confidentiality.
Listeners were prompted to take the survey in a quiet environment with Internet access. The questions for all of the dimensions were presented after the listeners listened to each speech sample. The stimuli were embedded into the online survey using SurveyMonkey software. Listeners answered the background questionnaire after rating the speech samples. Listeners took approximately 20 to 25 minutes to complete the online survey.
Statistical Analyses
Using SPSS software, we calculated descriptive statistics and conducted Friedman and Mann–Whitney U tests to analyze the data downloaded from the SurveyMonkey instrument. The Friedman test, the nonparametric alternative to one-way analyses of variance (ANOVAs) with repeated measures was conducted to compare the differences between groups. Mann–Whitney U, the nonparametric alternative to the independent t test, was used to compare differences between independent groups (Fay & Proschan, 2010).
Results
This study was conducted to examine how listeners with different levels of education (i.e., high vs. low) rate accented speech in terms of intelligibility, comprehensibility, accentedness, and acceptable speech for an SLP, and how listeners with different occupations (i.e., CSD vs. non-CSD) rate accented speech in terms of intelligibility, comprehensibility, accentedness, and acceptable speech for an SLP.
Speech Ratings
The ratings of perceived intelligibility, comprehensibility, accentedness, and acceptableness of the GAE, SD, and RA speech samples were compared using Friedman tests on the survey data. Table 1 presents the mean ranks and median raw scores for the perceived degree of intelligibility, comprehensibility, and accentedness based on the ratings by all listeners. It also shows the level of acceptability of each speech sample as rated for an SLP. That is, the listeners rated how acceptable the speaker sounds if they were an SLP.
Listeners’ Ratings of Intelligibility, Comprehensibility, Accentedness, and the Acceptability for SLP for the GAE, SA, and RA Speech Samples.
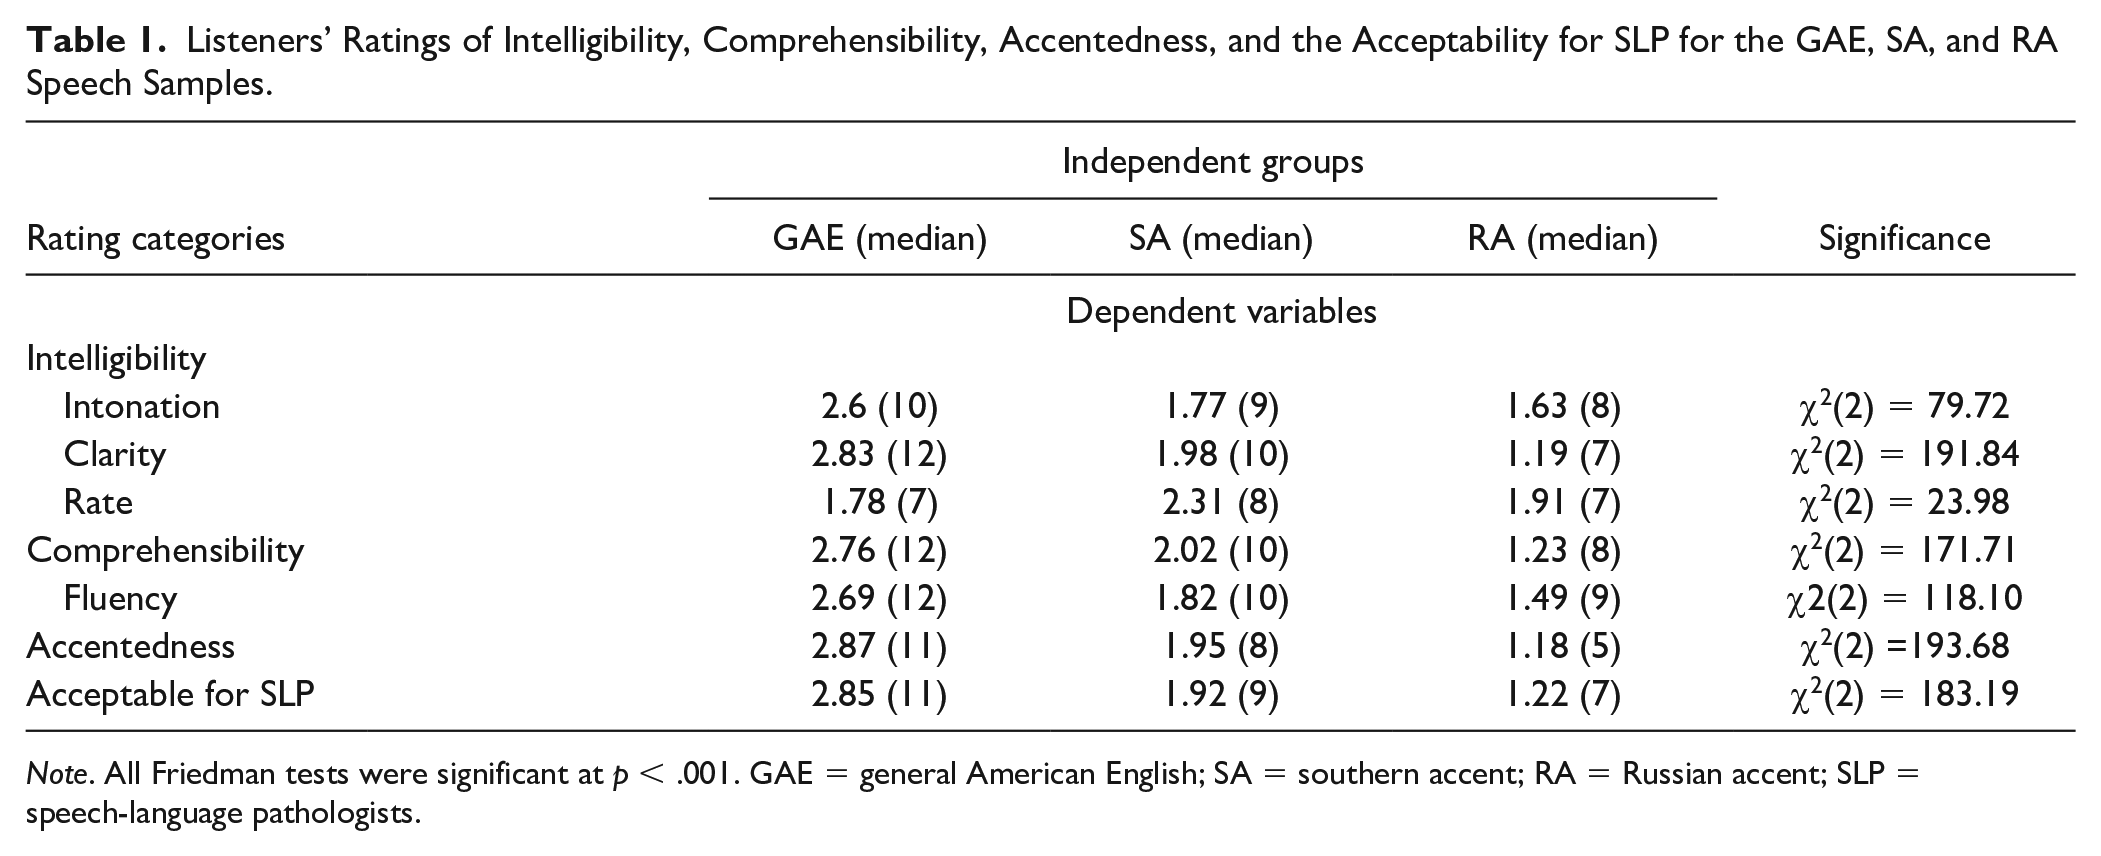
Note. All Friedman tests were significant at p < .001. GAE = general American English; SA = southern accent; RA = Russian accent; SLP = speech-language pathologists.
The Friedman test results indicated significant differences in the way the listeners rated all aspects of speech intelligibility (i.e., intonation, clarity, and rate), overall comprehensibility (including fluency), and accentedness. Moreover, the responses were examined to indicate any differences in the way listeners rated the speech characteristics of SLPs. The results of the analysis showed that the listeners rated the GAE, SA, and RA samples significantly different when they were asked whether the speech would be acceptable for someone working as a professional SLP or in the field of CSD.
According to the comparisons of mean ranks, the ratings were higher for all aspects of speech, except the rate of speech, in the descending order of GAE, SA, and RA speech samples. Specifically, the comparisons of mean ranks across intonation, clarity, and fluency indicated that the GAE samples were rated highest followed by SA and RA speech samples. This pattern was consistent in the mean rank order of overall comprehensibility and accentedness as well as the acceptableness of speech. The rate of the SA speech samples was perceived the fastest, followed by RA and GAE samples (see Table 1). As expected, listeners rated the native English speakers as sounding the most native-like where lower numbers represent accented speech and higher numbers represented more native-like speech.
Education and Perception of Accented Speech
This study first hypothesized that listeners with a bachelor’s or higher degree (i.e., a 4-year college degree or higher) rate the accented speech samples more positively than listeners with less than a 4-year college degree. As Table 2 shows, although no differences were found in the ratings between the higher (n = 84) and lower education (n = 42) groups for all of the aspects of the GAE samples, the ratings of intonation, fluency, accentedness, and acceptable speech for the SA and RA samples were found to be consistently different between the two education groups. The listeners with higher education backgrounds perceived the SA and RA intonation and fluency better than did those with lower education backgrounds. The same pattern was observed for the accentedness rating, where the higher education group rated the SA and RA speech samples significantly more native-like than the lower education group did. These results show that intonation and fluency are related to the perception of accentedness.
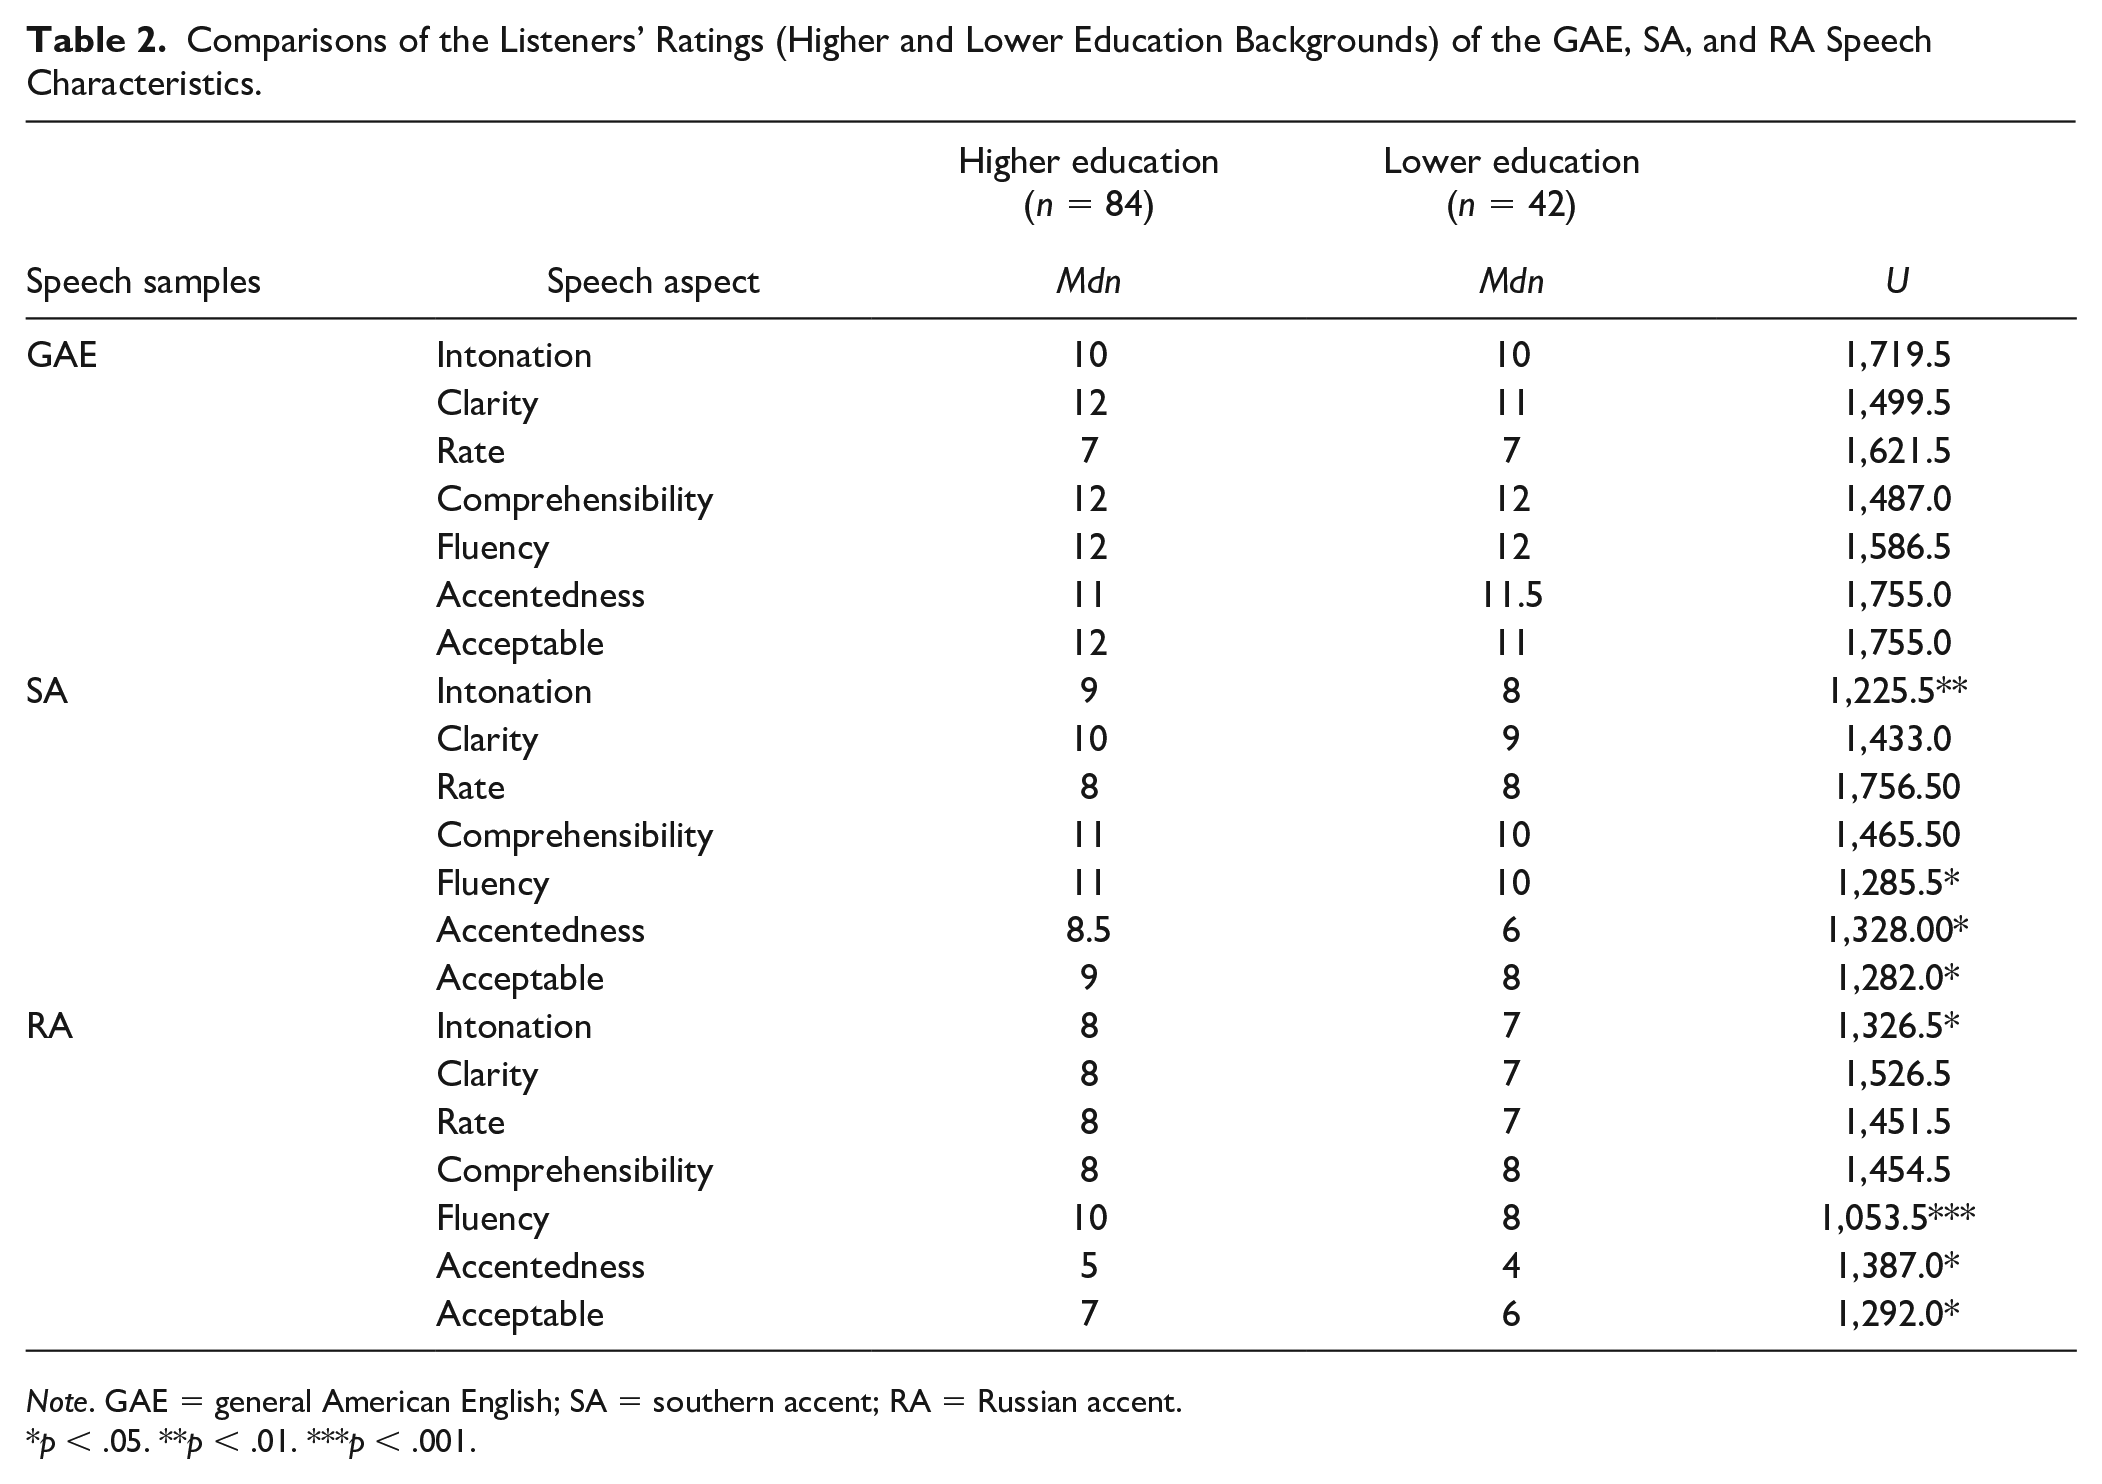
Note. GAE = general American English; SA = southern accent; RA = Russian accent.
p < .05. **p < .01. ***p < .001.
Moreover, the higher education group rated the SA and RA samples as more acceptable for SLPs than the lower education group did. No differences were found in the ratings of the GAE samples between the higher and lower education groups. These results indicate a link between the rating of intonation, fluency, accentedness, and the perception toward the speakers if they were an SLP (whether the speech is acceptable if they were an SLP).
Occupation and Perception of Accented Speech
The second hypothesis was that listeners with professional knowledge of speech and language (e.g., careers in CSD) rate the speech samples more positively compared to people in other occupations. When comparing responses from those in CSD occupations and those not in CSD, for aspects of clarity and fluency, both groups rated the three speech samples differently (see Table 3). Also, we found differences in the way these two groups of listeners rated the intonation of the SA and RA speech samples, indicating that the CSD group rated the samples with greater intonation than did the non-CSD group. For the GAE and SA samples, the CSD group rated clarity and fluency higher than the non-CSD group did, and the same pattern was found for the rating of the acceptability of speech for SLPs. Moreover, the CSD group rated the SA speech samples as featuring more foreign accent characteristics than did the non-CSD group.
Comparisons of Listeners’ Ratings (CSD vs. Non-CSD Backgrounds) of Speech Characteristics of the GAE, SA, and RA Samples.
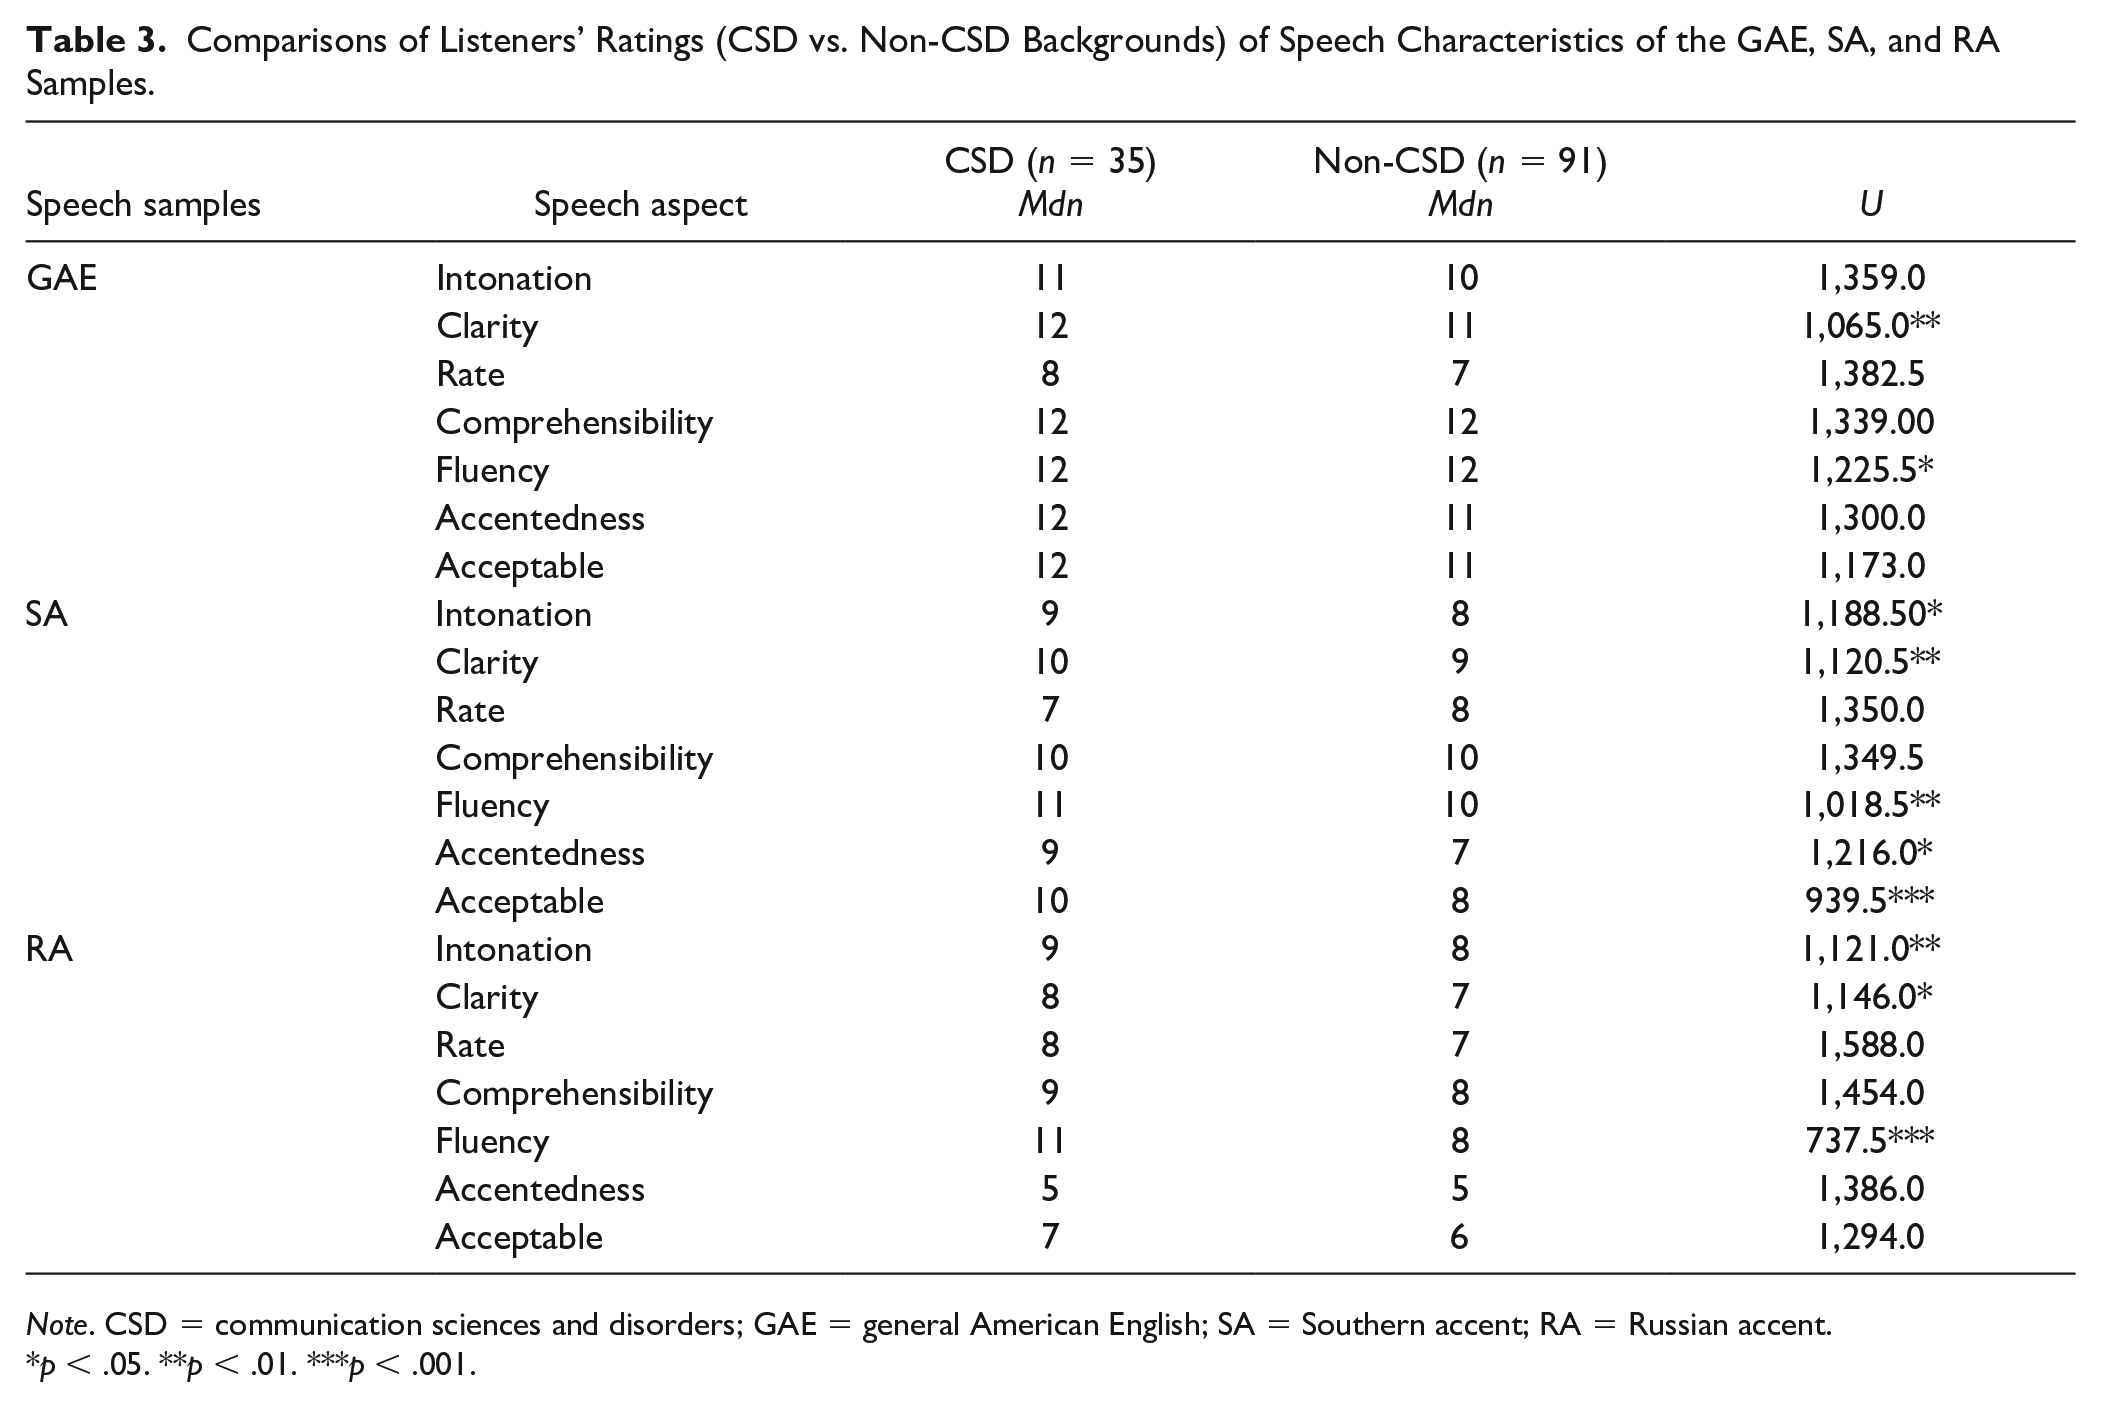
Note. CSD = communication sciences and disorders; GAE = general American English; SA = Southern accent; RA = Russian accent.
p < .05. **p < .01. ***p < .001.
Discussion
For this study, we investigated whether listener-related factors (education level and occupation) contributed to the listeners’ perceptions of accented speech, SA and RA compared to GAE in terms of intelligibility, comprehensibility, and accentedness. In addition, we also examined whether the listeners’ perceptions are related to their rating of acceptable speech for SLPs.
Speech Ratings
The results of overall ratings on GAE, SA, and RA speech samples showed that GAE samples were consistently ranked the highest in these measures followed by SA and RA samples for all aspects of speech, except rate. There are a number of possible reasons that may provide explanations for this finding. First, the listeners likely gave the high ratings to the GAE speech samples because it is widely used (Bresnahan et al., 2002; Grover et al., 2022; Orelus, 2020) and are likely familiar with it, as compared to other accented speech such as SA or RA. Desirability and prestige associated with GAE (Edwards, 1999; Moyer, 2013; Wells, 1982) may result in higher ratings to the GAE speech samples. Furthermore, as previous research has suggested, comprehensibility and accentedness are overlapping concepts (Trofimovich & Isaacs, 2012). The current results aligned with this contention in that the findings indicated the same pattern in the ratings of comprehensibility and accentedness. Similarly, accentedness is possibly a mediating factor in the way listeners perceive comprehensibility and intelligibility (Behrman & Akhund, 2013). Our study supported this suggestion as indicated by the listeners rating the samples as less intelligible, less comprehensible, and more accented.
The GAE accent was rated the most acceptable speech for an SLP, followed by SA and RA speech samples. This result is consistent with previous literature which stated that some CSD students do not feel that accented clinicians can appropriately serve certain clients (Levy & Crowley, 2012). ASHA (2011) has maintained that accented clinicians can effectively treat clients presenting any speech or language disorder or difference. ASHA (n.d.-b.) also stated that clinicians with foreign accents or regional speech variations can appropriately serve clients as long as they can model the phoneme or grammatical feature needing attention. SLPs who share a foreign-accent or regional accent with their client can leverage this similarity to build rapport (Fuertes et al., 2002) and establish a sense of connectedness between the two individuals (Harry, 2002).
Education and Perception of Accented Speech
The hypothesis and related findings from our study supported the literature which states that listeners who have earned higher educational degrees judged accented speech more favorable for communication (Byrnes et al., 1997; Smitherman & Villanueva, 2000). The listeners with lower education levels consistently rated the speech samples lower for intonation and fluency, as well as higher for accentedness than did those with higher education levels. As hypothesized, they also gave lower ratings of acceptability for an SLP than did those with higher education. These findings are also in line with the results of Chakraborty and colleagues (2019), which reported that the students and professionals in speech-language pathology presented with more unbiased beliefs about persons with accented speech compared to high schoolers. Individuals with higher education tend to have more exposure to people with diverse language backgrounds, which may lead to the listeners’ positive attitude toward accented speech (Ingvalson et al., 2017; Kang & Rubin, 2009; Munro et al., 2006). This may account for why individuals with bachelor’s degrees or higher were more likely to view the SA and RA samples as acceptable for an SLP.
The present findings have also shown the importance of intonation and fluency for listeners with various educational levels and establish that these factors are linked to the perception of accentedness and acceptable speech for an SLP. The perception of accented speech was only affected by some aspects of the SA and RA samples (i.e., intonation for intelligibility, fluency for comprehensibility, and accentedness of speech ratings, Bent & Bradlow, 2003; Kennedy & Trofimovich, 2008).
Occupation and Perception of Accented Speech
The findings also support that the listener’s occupation can influence the listener’s perception of the accented speech. It is very likely that the exposure as well as the knowledge, training, and experiences of those in the CSD field may have influenced their positive perceptual judgments of accented speech. The ratings illustrated that individuals in the CSD field consistently provided higher ratings than those with other occupational backgrounds except for the rate of speech. The background of CSD professionals significantly influenced their rating for clarity and fluency of speech for all accents, including GAE. The ratings for intonation were only affected for the SA and RA speech samples. The ratings of the SA samples for accentedness and acceptable level of speech for an SLP also demonstrated a difference between these two groups showing the higher ratings of the CSD group as compared to the non-CSD group. No difference was found for the same aspects of the RA samples which may be due to the listeners’ low familiarity with the RA speech sample (Munro et al., 2006) and possible negative attitudes toward Russian-accented speakers (Lindemann, 2005). Hence, this suggests that one’s occupation (CSD vs. non-CSD) could influence how they perceive acceptable speech for an SLP.
Because of the dearth of research on the influence of occupation on the perception of accented speech samples, the finding of differences between perceptions of CSD professionals and others is a novel contribution to the literature. The individuals with CSD backgrounds likely rated the accented speech positively as a result of their training (ASHA, 2017), which is in line with the previous finding by Smitherman and Villanueva (2000). This finding indicated that training on linguistic diversity or speech variations could be helpful for educators and professionals who work with individuals with accented speech outside of CSD.
Limitations of Current Study/Implications in the Field of CSD/Future Directions
Although this study provided further understanding toward accented speech perceived by individuals with different educational or occupational backgrounds as well as how the accented speech may be viewed if they were an SLP, some limitations must be acknowledged. This study had a small number of listeners who are familiar with Russian (n = 7). Recruiting additional bilingual Russian listeners would have allowed us to confirm whether a shared language background provides a benefit for people listening to accented speech. Furthermore, due to time constraints, additional questions were not included to ensure interrater reliability among the listeners. It was also acknowledged that this study did not ask listeners about their own awareness of regional or foreign accents. Studies in the future may want to consider this a factor when examining listeners’ perception of speech. This study also asked the listeners to rate how acceptable the speaker sounds if they were an SLP. The question was to examine whether the perception of the intelligibility, comprehensibility, and accentedness of the speech samples may be consistent with their perception of acceptability of the speech samples if they were an SLP. Although the listeners responded to this question after answering other questions for the first speech sample, it is possible that this question may have influenced the listeners’ perception and led to a change in respondent behavior when they rated the remaining speech samples.
In addition, future researchers might incorporate additional questions regarding accented SLPs. In particular, surveys could prompt clients to respond favorably or unfavorably to seeking specific services from an accented clinician. Because previous research by Levy and Crowley (2012) revealed that some CSD graduate students do not think accented clinicians could effectively treat accent modification or phonological disorders; a follow-up study should be conducted to determine the extent to which students and professionals in the CSD field perceive accented speech. Also, since the listeners reported no hearing deficits, no hearing screening was administered in this study. Considering the listeners’ age ranges between 18 and 56 years (M = 29 years), this could be another limitation of this study. It was also acknowledged that age and language background of listeners may affect the perception of accents. Future studies need to further investigate the correlation between listeners’ background information and the perception of accents. Age has been a contributing factor that affects a person’s ability to comprehend an auditory signal. Older adults might perceive unfamiliar accents more harshly because they may have limited ability to adapt to perceive novel accents as easily as younger adults (e.g., Adank & Janse, 2010).
Despite ASHA’s long-standing efforts against discrimination of persons with accented speech and/or dialect in educational programs, employment, or service delivery (ASHA, 1983, 2011), literature has reported numerous evidence of biases, racism, prejudice, and discrimination against speakers with linguistic variations across the settings (Akomolafe, 2013; Ennser-Kananen et al., 2021; Gluszek & Dovidio, 2010a, 2010b; Grover et al., 2022; Orelus, 2020). As noted earlier, implicit and explicit biases and discrimination exist based on their distinctive speech patterns such as regional or foreign accents in their spoken language (e.g., accentism, linguicism, Orelus, 2020). This study revealed the importance of intonation and fluency in listeners’ perception of accented speech and acceptable speech for an SLP regardless of the listeners’ education levels. It is important for clinicians to be aware of the listeners’ factors and how they can affect communication and social interactions. In addition, current and future SLPs are encouraged to have exposure and interaction with speakers with accents as familiarity benefits listeners in processing efficiency (Derwing & Munro, 2014) and in perceiving accented speech with less biases (Dewaele & McCloskey, 2015). Gaining more knowledge of other listener’s factors on the perception of accented speech would help current and future SLPs to further strengthen the self-awareness and to reduce the impact of listeners’ factors on accent perception. In the field of CSD, more emphasis should be on preventing accent-based biases and discrimination rather than on accent modification training (Gluszek & Dovidio, 2010b), which is critical to address systemic racism and institutional equities and our commitment to diversity, equity, and inclusion (ASHA, n.d.-c). This study has also reported exposure as well as the knowledge, training, and experiences as influential factors for positive perceptual judgments of accented speech for current and future SLP. Encouraging diverse accents, valuing linguistic diversity, and embracing multiculturalism can help break down the barriers associated with accents. SLPs must also make continuous efforts to develop multicultural competencies by increasing their understanding of linguistic and cultural differences when working with fellow SLPs and clients with accented speech.
Conclusion
This study revealed the relationships of speaker-related factors (accent) and listener-related factors (backgrounds such as education and occupation status) on how accented speech is perceived. Overall, some aspects of speech (e.g., intonation, fluency) had a greater influence on how people perceive an individual’s accent, and how they judge the accent if the speaker was an SLP. This study found that individuals with higher levels of education (i.e., college or higher) or from the CSD field rated some aspects of speech (e.g., intonation, fluency) for both regional and foreign-accented samples (i.e., SA and RA) as more favorable. At the same time, the CSD group only perceived the accentedness and acceptability of speech as an SLP for the regional accent, SA samples, more favorably, but not for the foreign accent, RA samples. Although previous literature touched on education and occupation as an influence on one’s perception of accented speech (Dewaele & McCloskey, 2015; Smitherman & Villanueva, 2000), this study showed how occupational knowledge in CSD may have helped in judging accented speech. Through these findings, we shed light on the factors that may influence the perception of accented speech and increase the understanding of the factors associated with perceptions and attitudes toward individuals with regional or foreign-accented speech. The current findings indicate a possible challenge for individuals with accented speech which may be due to the negative perception of accented speech (Carlson & McHenry, 2006), specifically clinicians demonstrating accented speech variations (Levy & Crowley, 2012).
Footnotes
Appendix A
Appendix B
Declaration of Conflicting Interests
The author(s) declared no potential conflicts of interest with respect to the research, authorship, and/or publication of this article.
Funding
The author(s) received no financial support for the research, authorship, and/or publication of this article.