
Abstract
The objective of the article is to identify clusters of patients with COPD according to factors known to be associated with mortality and to verify whether clusters’ assignment is associated with 2-year mortality. Patients (n = 141) were evaluated by bioelectrical impedance, maximal inspiratory pressure (MIP), one-repetition maximum test of the quadriceps femoris (1RMQF) and BODE index (body mass index; airflow obstruction (spirometry); dyspnea (modified Medical Research Council scale); and exercise capacity (6-minute walk test (6MWT) distance). Vital status was retrospectively checked 2 years after the assessments, and time to death was quantified for those deceased in this period. K-means analysis identified two clusters. Patients in cluster one (CL I, n = 69) presented an impaired clinical status in comparison to cluster two (CL II, n = 72). Receiver operating characteristics curves identified the cutoffs discriminating patients composing CL I: forced expiratory volume in the first second <44%pred; 6MWT <479 m; 1RMQF <19 kg; and maximum inspiratory pressures <73 cmH2O (area under the curve range 0.750–0.857). During the follow-up, 19 (13%) patients deceased, 15 in CL I (22%) and 4 in CL II (0.06%) (p = 0.005). CL I was associated with a higher risk of 2-year mortality (hazard ratio (95% confidence interval): 4.3 (1.40–12.9), p = 0.01). A cluster of patients with COPD highly associated with 2-year mortality was statistically identified, and cutoffs to identify these subjects were provided.
Introduction
Chronic obstructive pulmonary disease (COPD) 1 was accountable for more than three million deaths in 2002, representing 5% of all deaths worldwide. 2 Worrisome, despite the amount of financial investments 3 and research and development, it is estimated to be the third leading cause of death by 2030. 2 Regardless of having its diagnosis based on lung function measurements, extrapulmonary manifestations are undoubtedly involved in disease progression and prognosis. 1,4 Within this context, a substantial scientific effort has been devoted to understand the factors involved in disease’s association with the ultimate outcome in health care, that is, mortality (Online Supplemental Material, Table S1). 5 –13
Single variables were shown to be associated with mortality in COPD, 6 –9,12 and multidimensional indices have also been developed intending to increase the capacity to identify patients at high risk of death. 5,10,11 Noteworthy, one of those indices which is based on the body mass index (BMI), airflow obstruction (forced expiratory volume in the first second (FEV1)), dyspnea (modified Medical Research Council scale (mMRC)), and exercise capacity (6-minute walk test (6MWT) distance), the BODE index, 5 has been widely used and recognized. Despite the fair capacity of these multidimensional indices to predict survival, their composition include outcomes based on expert opinion, 9 fact that is known for not providing the best scientific evidence level, 14 since expert opinions are, at least in part, influenced by the clinical characteristics of the patients routinely seen in practice. Thus, between-location differences in patients’ characteristics could be a determinant of the expert opinion and also of the accuracy of any index (or even a single variable) in predicting prognosis.
The variables composing the BODE index and each respective cutoff were identified in a cohort of 207 patients and further validated in a distinct cohort of 625 COPD patients from Spain, Venezuela, and the United States. Noteworthy, differences across geographical locations are noted for clinical characteristics in the cohort such as exercise capacity (i.e. 6MWT distance: 225 ± 40 in Venezuela, 311 ± 121 in the United States, and 446 ± 99 in Spain; p < 0.001). Although this variability guarantees that between-location patient characteristics are taken into account, proper validation is required for extrapolation of the results (i.e. predicting responses to values outside the range of the predictor variables used in the model) in samples with characteristics out of the patterns from the populations included in any cohort.
Notwithstanding, this is the case of Brazilian patients with COPD, who have already been shown to have higher 6MWT distance than patients from Europe or North America (i.e. a shift in the regression line curve to the left). Hence, it was hypothesized that by using a statistical method with the ability to identify clusters of patients according to well-known literature-based predictors of mortality previously identified in COPD, this would improve the capacity to identify the patients at high risk of mortality. This would allow identifying patients characterized by different combinations of risk factors, instead of identifying a patient with worse/better prognosis according to each single variable and summing their single weights.
Thus, to prove this hypothesis, this study aimed to identify clusters of patients with COPD according to factors previously known to be associated with mortality, verifying whether these clusters’ assignment is associated with 2-year mortality; and secondarily, to compare the association of these clusters versus the association of the most recognized multidimensional index in COPD, i.e. the BODE index. 5
Materials and methods
Study participants
For this retrospective cohort study with an intention-to-treat analysis (see statistical analysis for more information), patients with diagnosis of COPD according to the Global Initiative for Chronic Obstructive Lung Disease (GOLD), 1 who were referred to our institutional exercise training program and had data regarding mortality available at our database, were included in this study. Whether or not any of the patients was evaluated more than once, only the first assessment was used for further analysis. Inclusion criteria were those for screening to the exercise program, that is, clinical stability (i.e. absence of infections or exacerbations) in the previous 3 months, absence of severe and/or unstable cardiac diseases, and not having severe neurological or musculoskeletal conditions that might interfere in the proposed protocol. Patients unable to perform the proposed assessments were excluded. For database and statistical analyses handling, patients were unnamed and identified by a unique study code. Approval for study execution was obtained from the ethics committee of the State University of Londrina, Brazil, approval 996.413, and all patients signed a written informed consent.
Vital status
The Center for Information on Mortality (CIM), the agency responsible for registering all death events at Londrina, Brazil, was used for official date of death confirmation for the deceased patients. Formal authorization for using the CIM database was obtained from the Health Secretary of the city. Therefore, vital status was last checked, retrospectively, in January 2017, and quantified as time (i.e. months) from the last assessment to date of death for those who deceased. For those who were not at the CIM database, telephone contact was done to guarantee whether they were alive, and time to last contact was quantified. The date of the preceding contact was used for quantification of the follow-up for those patients who were not located, neither by telephone contact nor at the CIM database, at the last attempt.
Measurements
A comprehensive initial questionnaire was used for characterization of the study sample, including information regarding anthropometrics, clinical history, and comorbidities. Lung function was assessed by spirometry (Spirobank spirometer, version 3.6 MIR, Rome, Italy), 15 inspiratory muscle strength by maximum inspiratory pressures (MIP; manovacuometry (Makil, Brazil)), 16 and functional exercise capacity by the 6MWT. 17 All the above cited tests followed specific international protocols and local reference values were used. 18 –20 Body composition was assessed by bioelectrical impedance. 21 Peripheral muscle strength was measured by the one-repetition maximum test of the quadriceps femoris, 22 and dyspnea sensation in daily life by the mMRC. 23 Lastly, the BODE index (i.e. BMI, airflow obstruction (FEV1), dyspnea (mMRC scale), and exercise capacity (6MWT distance)) was calculated. 5
Statistical analysis
The Statistical Package of Social Science (SPSS) 20 (SPSS Inc., Chicago, Illinois, USA) was used for statistical analysis. Normality in continuous data distribution was analyzed by the Shapiro–Wilk test. Continuous data following Gaussian distribution were expressed as means ± standard deviation. Otherwise, non-Gaussian distributed continuous data were expressed as median (interquartile range 25–75%]. For categorical data, the number of cases and its respective percentages were chosen for data expression. Furthermore, previously known predictors of mortality in patients with COPD were identified by a non-systematic literature review. Among the identified factors, those that were available at our database (i.e. FEV1 (%predicted), 9 6MWT (m), 7 fat-free mass index (kg/m2), 6 quadriceps femoris strength (kg), 8 mMRC scale [0–4 points], 12 and maximum inspiratory pressure (cmH2O) 13 ; see Online Supplemental Information Table S1 for further information) were used to identify clusters of patients by K-means cluster analyses after data standardization. Additionally, the receiver operating characteristics (ROC) curve was performed to identify which of these variables are able to discriminate patients composing each cluster; an area under the curve (AUC) >0.500 was considered as the statistical cutoff to assume that a unique variable has discriminatory capacity to identifying patients composing each cluster. The Youden’s index was used to identify the cutoffs associated with better specificity and sensitivity. As patients were evaluated at the intake of an exercise training program, an intention-to-treat analysis was carried out, by the last observation carried forward method, for those patients who did not finish the exercise training program; for those patients who finished the program, the post-exercise training measurements were considered. A posteriori, clusters’ validation was done by verifying its association with 2-year mortality by Kaplan–Meier approach with log-rank test. Cox’s proportional-hazard regression was used for adjust estimates of potential confounders (i.e. BODE index, change in 6MWT (m) after exercise training, gender, comorbidities, and pack years). Noteworthy, variables used to identify the clusters were not considered as confounders, as they are inherent to clusters composition. Non-paired t-test and χ2 test were also used when appropriate. A p value lower than 0.05 was adopted.
Results
Out of the 162 patients registered in our exercise training database, 153 had available data regarding mortality. Twelve of these 153 patients were not able to be clustered because of missing data of at least one of the factors included in the K-means model. Accordingly, a sample of 141 COPD patients was used in the final analysis, mostly classified as having moderate to very severe COPD. Entire characteristics’ description of the sample is shown in Table 1. K-means cluster analysis was able to identify two clusters of patients, with 69 patients composing cluster one (CL I) and 72 cluster two (CL II). CL I patients had a more affected clinical status, having worse lung function, dyspnea sensation in daily life and exercise capacity, lower peripheral muscle strength, and fat-free mass index (Table 2). Further analysis revealed all variables used for cluster composition as having powerful discriminatory capacity to identify patients with higher likelihood of being assigned to CL I (Table 3).
Baseline characteristics of the study participants.a
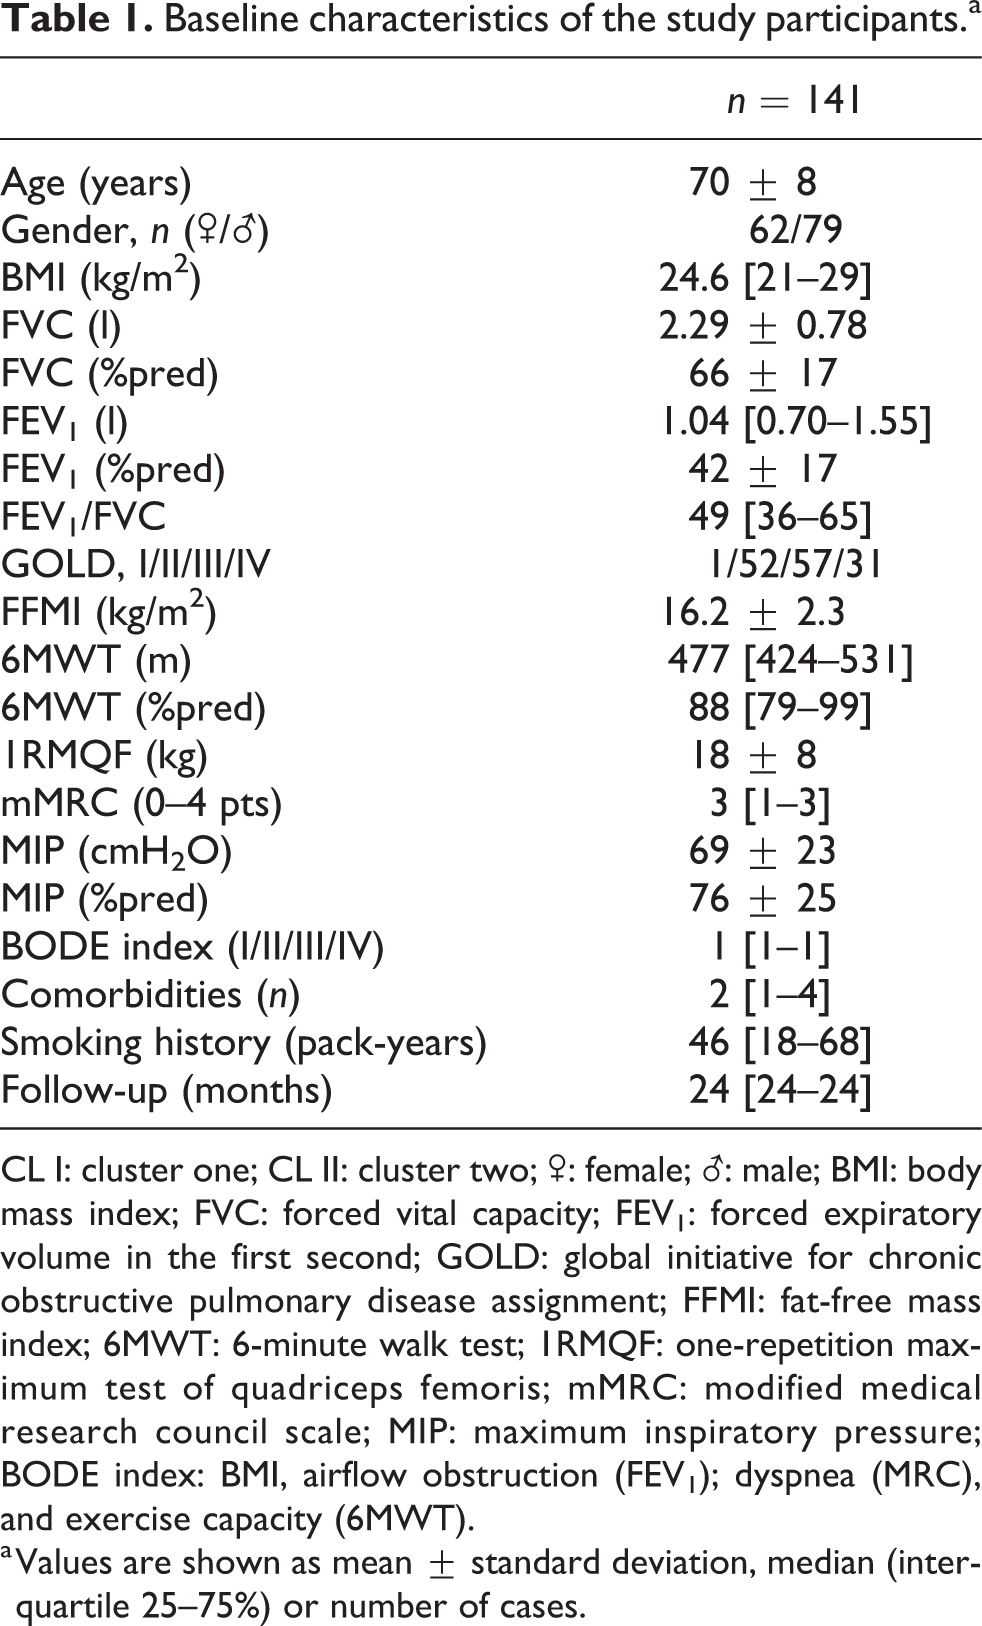
CL I: cluster one; CL II: cluster two; ♂: female;
a Values are shown as mean ± standard deviation, median (interquartile 25–75%) or number of cases.
Baseline characteristics and comparisons of the two identified clusters.a

CL I: cluster one; CL II: cluster two; ♂: female;
a Values are shown as mean ± standard deviation, median (interquartile 25–75%) or number of cases.
ROC curve analyses identifying patients composing CL II.
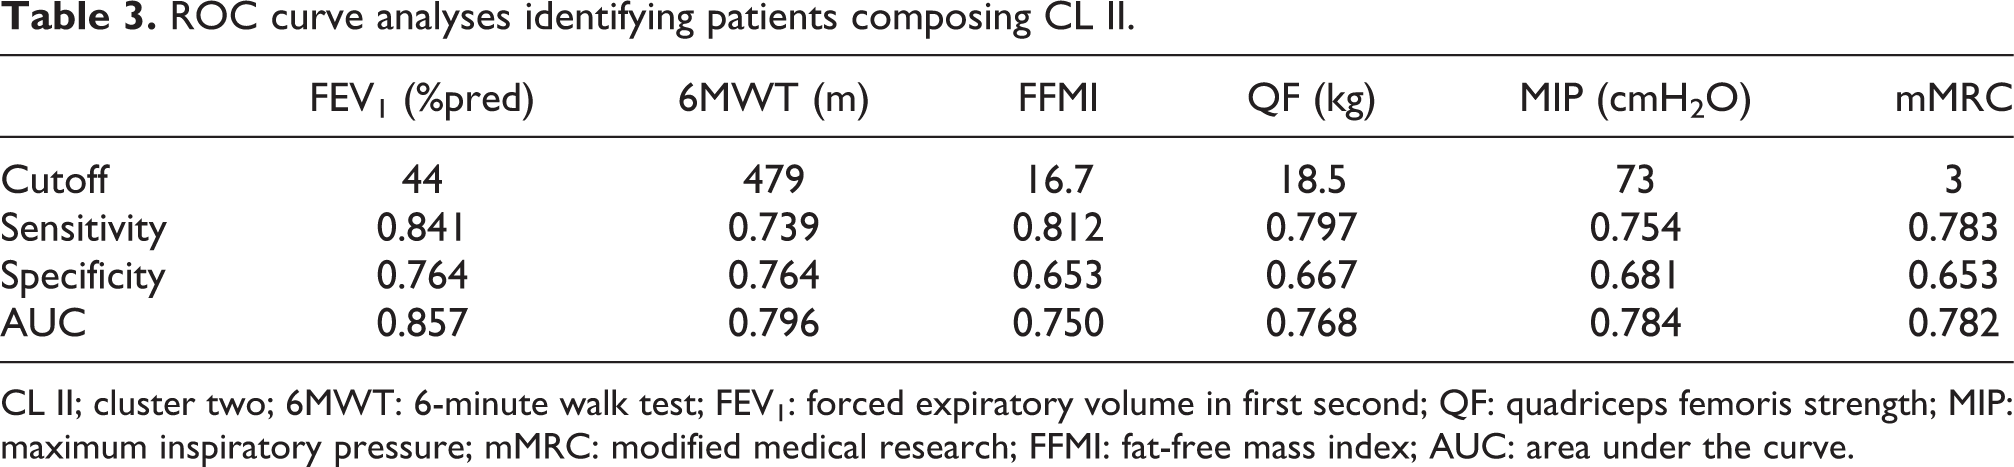
CL II; cluster two; 6MWT: 6-minute walk test; FEV1: forced expiratory volume in first second; QF: quadriceps femoris strength; MIP: maximum inspiratory pressure; mMRC: modified medical research; FFMI: fat-free mass index; AUC: area under the curve.
The follow-up period varied between 1 month and 24 months. Within this period, 19 (13%) patients deceased, 15 in CL I (22%) and 4 in CL II (0.06%) (p = 0.005). The Kaplan–Meier approach and univariate Cox’s proportional-hazard regression analysis unveiled a statistically significant association between clusters’ assignment and 2-year mortality, with patients assigned to CL I presenting more than four times increased chance to decease in 2 years (Table 4; Figure 1(a)). Noteworthy, in our sample, BODE index was not associated with survival (Table 4; Figure 1(b)). After correction for possible confounders in the multivariate model, clusters’ assignment and gender were the only variables that remained in the model, with patients in CL I having more than 5.17 times increased chance to decease (Table 4).
Risk of 2-year mortality due to any cause.

95% CI: 95% confidence interval; BODE index: BMI, airflow obstruction (FEV1); dyspnea (MRC), and exercise capacity (6MWT); Δ6MWT: change in the 6MWT distance after exercise training; Comorbidities: patients with more than two comorbidities versus those with less than two; NS: non-statistically significant; mMRC: modified medical research.
a Variables with a p value lower than 0.20 were considered as significant for adjustment at the multivariate level.

Life table and Kaplan–Meier survival curves with logrank test. (a) For the identified clusters (shorter dashed plot indicate CL I patients; longer dashed plot indicate CL II patients); (b) For the BODE index (longer dashed plot indicate––BODE I/II patients; shorter dashed plot indicate BODE III/IV patients) during the 24-month follow-up period.
Discussion
Based on previously known predictors of mortality in COPD, two clusters were statistically identified, and further use of survival models unveil an outstanding association with 2-year mortality. Remarkably, the use of the BODE index as a comparator highlighted the promising potential of the present results for this population, since the BODE is the most scientifically used and recognized multidimensional prognostic index in COPD. However, it is anticipated that validation of these clusters in different samples involving worldwide population-based studies is necessary before its full comprehension and acceptance. Thresholds enabling identification of patients with higher likelihood of being assigned to CL I are also useful due to the fact that, for example, the BODE index was not able to identify those patients from our cohort who deceased since they were characterized by less impaired/better preserved exercise capacity, an important component of the BODE. Therefore, these thresholds might prove themselves as valuable alternatives to identify patients with a higher likelihood of composing CL I, and consequently increased chance to decease, in populations presenting similar characteristics. Altogether, these findings make these results a promising tool for the evaluation of “short-term” mortality risk in patients with COPD.
Multidimensional indices have already proved to be better than a sole variable in identifying patients at high risk of mortality, independently whether derived from measurements of lung function or from extrapulmonary manifestations of the disease. 5,10,11 In this study, the use of previously known predictors of mortality in COPD follows the same premise. The novelty, herein, is the use of an advanced statistical method to cluster patients. The identified clusters presented a multitude of differences, with patients in CL I considerably more affected than those from CL II and establishing a between-clusters known-groups validity (Table 2). This finding is in line with the original study proposing the BODE index, in which patients with worse scores were also more affected. 5 However, clusters’ assignment in the present study was highly associated with mortality but not the BODE index (Table 4; Figure 1). In fact, a short follow-up was investigated in the present study, instead of the relatively longer follow-up investigated by Celli and colleagues 5 as the main outcome (24 vs. 52 months). This may, at least in part, help in the explanation of this finding. Furthermore, patients in the present cohort had a better preserved exercise capacity (Table 1), and even patients who deceased in the follow-up period walked longer distances in the 6MWT than the patients who did not decease in the BODE cohort 5 (mean 6MWT distance (m) of 384 ± 101 vs. 264 ± 113, respectively). Corroborating the role of between-location differences in patients’ characteristics, only 17 (12%) patients in our sample walked less than 350, the highest cutoff for the 6MWT in the BODE index. This is not surprising, since it is already known that socioeducational–cultural differences (and consequently geographical location) may influence patients’ level of exercise capacity. 24 Therefore, these differences should be taken into consideration when interpreting the present results.
Despite the abovementioned differences in study design and sample, the survival curve of the BODE index noticeably highlights patients in the “better” (or “milder”) assignments (i.e. BODE I/II) having a steep death rate until approximately 10 months of follow-up (i.e. the survival curves cross approximately at this time point; Figure 1(b)). This indicated patients with a better clinical status according to the BODE index deceasing at shorter time and also justified the higher 6MWT distance cutoff identifying patients composing CL I (i.e. 479 m; Table 3) in comparison to the previously published value of 350 m (Online Supplemental Material, Table S1). 7 Additionally, two other reasons may help explaining the fact that the present clusters’ assignment achieved better short-term mortality associations than the BODE index: the substitution of variables/cutoffs proposed by expert opinions by using a statistical analysis method to identity clusters of patients from variables previously known as predictors of mortality; and the variables with the ability to identify the clusters (Table 3) having a bigger impact in short-term mortality than the variables used to classify patients according to the BODE index 5 (i.e. BMI, FEV1, mMRC, and 6MWT).
Despite the fact that an increased chance to decease in patients presenting worse clinical status is not surprising, finding ways to identify these patients, however, is an important clinical information. Thus, the use of these simple and easily applicable cutoffs presented in Table 3 would enable the identification of patients with higher likelihood of short-term mortality. The level of obstruction, measured by the FEV1, was the cutoff with higher discriminatory capacity (AUC 0.857); 6MWT, MIP, dyspnea in daily life, peripheral muscle strength, and body composition also presented powerful discriminatory capacity to identifying patients composing CL I (AUC 0.750–0.796). Therefore, simple measurements, routinely performed in clinical practice, 4 can be used with this purpose. Indeed, clusters based on these aforementioned variables, all of which previously known to be associated with mortality, 6 –9,12,13 help in explaining their higher discriminatory capacity. Moreover, as these are measurements routinely found in clinical practice, this easily allows to use any of these cutoffs, either independently or in combination. For those clinical situations in which more than one, or all of these variables are available, patients could be classified as having smaller or higher likelihood of short-term mortality according to the number of criteria met. As an example, patients presenting values below the cutoff of six variables may have a higher likelihood to decease than patients presenting values below the cutoff of only one variable, though external validation is needed to support or refute this hypothesis.
Despite all the efforts applied in the development of the present study, some limitations should be pointed out. The retrospective design is known for not being the preferred design for cohort studies. To circumvent this limitation, corrections for comorbidities, improvement in 6MWT after the exercise training, and other possible confounders were done (Table 4). However, other factors, such as the occurrence of acute exacerbations during the follow up period, were not possible to be adjusted for, as this information was not available in our database. Also, selection bias cannot be ruled out as a limitation due to the fact that the screening for inclusion was done at the initial assessment of a rehabilitation program. On the other hand, nowadays, not offering exercise training for patients with COPD could even be considered unethical. Noteworthy, disease severity did not preclude the offer to take part in the exercise training program and, consequently, participation in the present study. Moreover, to circumvent the influence of exercise training in patients’ survival, improvement in 6MWT after exercise training was used as a confounder in the analysis (Table 4).
In summary, two clusters of patients were identified using variables previously known as predictors of mortality in COPD, and clusters’ assignment was proved highly associated with 2-year mortality. The cutoffs allowing the identification of these clusters were provided and are easily applicable in clinical practice. However, further validation of these clusters and cutoffs in different samples worldwide is welcomed to endorse or refute their applicability.
Supplemental material
supplementary-converted - Cluster analysis identifying patients with COPD at high risk of 2-year all-cause mortality
supplementary-converted for Cluster analysis identifying patients with COPD at high risk of 2-year all-cause mortality by Antenor Rodrigues, Carlos Augusto Camillo, Karina Couto Furlanetto, Thais Paes, Andrea Akemi Morita, Thamyres Spositon, Leila Donaria, Marcos Ribeiro, Vanessa Suziane Probst, Nidia Aparecida Hernandes, and Fabio Pitta in Chronic Respiratory Disease
Footnotes
Declaration of conflicting interests
The author(s) declared no potential conflicts of interest with respect to the research, authorship, and/or publication of this article.
Funding
The author(s) disclosed receipt of the following financial support for the research, authorship, and/or publication of this article: The study was partially funded by a personal grant from the Coordination for the Improvement of Higher Education Personnel (CAPES), Brazil.
Supplemental material
Supplemental material for this article is available online.
References
Supplementary Material
Please find the following supplemental material available below.
For Open Access articles published under a Creative Commons License, all supplemental material carries the same license as the article it is associated with.
For non-Open Access articles published, all supplemental material carries a non-exclusive license, and permission requests for re-use of supplemental material or any part of supplemental material shall be sent directly to the copyright owner as specified in the copyright notice associated with the article.