
Abstract
Background
Depression and insulin resistance—measured by the estimated glucose disposal rate (eGDR)—are both linked to cardiovascular disease (CVD), but whether eGDR mediates this relationship remains unclear. We examined the mediating role of eGDR and its joint and interactive effects with depression on incident CVD.
Methods
Data were derived from the China Health and Retirement Longitudinal Study (2011–2020). Participants without baseline CVD and with complete eGDR and CESD-10 data were included. eGDR was calculated as 21.158 − (0.09 × waist circumference) − (3.407 × hypertension) − (0.551 × HbA1c). Depressive symptoms were defined as CESD-10 ≥ 12. Cox models adjusted for demographic and lifestyle factors assessed CVD risk across four groups defined by eGDR and depression status.
Results
During a median 9-years follow-up, 1643 CVD events occurred. Participants with low eGDR and depression had the highest CVD risk (HR = 1.87, 95% CI: 1.40–2.49, p < 0.001). Additive interaction analysis indicated biological synergy (relative excess risk = 1.37; attributable proportion = 0.32). eGDR mediated 9.82% of the depression–CVD association. Interactions were stronger in older adults.
Conclusion
Low eGDR and depressive symptoms synergistically elevate CVD risk, highlighting the importance of integrating metabolic and psychological assessments in CVD prevention.
Keywords
Introduction
Cardiovascular disease (CVD) continues to be the leading global cause of morbidity and mortality,1,2 with an estimated 17.9 million annual deaths attributed to it. Contemporary research highlights a complex interplay between metabolic dysfunction and psychosocial stress in CVD pathogenesis. 3 Both insulin resistance (IR)—a central feature of cardiometabolic disorders4,5—and depression—among the most prevalent psychiatric conditions—are well-established, independent predictors of CVD.6,7 However, the degree to which these two risk factors interact to exacerbate CVD risk has not been sufficiently quantified. 8
A key knowledge gap exists regarding how the interplay between metabolic and psychological factors influences the progression of CVD in individuals without pre-existing CVD, who account for the majority of incident cases. Addressing this gap is essential for developing multifaceted prevention strategies. Existing clinical models often treat these risk factors in isolation, potentially overlooking opportunities for integrated risk reduction. Clarifying their combined effects is especially relevant in aging populations where IR and depression frequently co-occur and synergistically elevate CVD risk.
Mechanistic evidence from prior studies9–11 indicates a bidirectional association between insulin resistance (IR) and depression. IR disrupts hypothalamic–pituitary–adrenal (HPA) axis function, raising glucocorticoid levels, impairing hippocampal neurogenesis, and exacerbating depressive symptoms. 12 Conversely, depression can promote sedentary behavior, increased caloric intake, and heightened sympathetic activity, all of which worsen IR via adipose inflammation and pancreatic β-cell dysfunction. 13 These convergent pathways are implicated in endothelial dysfunction, oxidative stress, and immune-metabolic dysregulation. 14 Despite these insights, epidemiological data on the combined impact of IR and depression on clinical CVD outcomes remain scarce.
While the hyperinsulinemic-euglycemic clamp (HIEC) serves as the gold standard for evaluating IR, its clinical applicability is constrained by invasiveness and high cost. 15 In contrast, the estimated glucose disposal rate (eGDR) offers a validated, low-cost, noninvasive metric incorporating waist circumference, hypertension, and HbA1c, enabling large-scale metabolic risk assessment in community settings. 16 Unlike conventional biomarkers, eGDR inherently captures obesity-related adiposity, glycemic variability, and hemodynamic stress, making it particularly suitable for evaluating metabolic-psychosocial interactions.
In this study, we analyzed data from CHARLS (N = 6311) to address three key questions: (1) Does the co-occurrence of low eGDR and depressive symptoms yield a CVD risk that exceeds the additive effect of either factor alone? (2) To what extent do eGDR and depressive symptoms mediate the risk of incident CVD? (3) Are these associations consistent across subgroups defined by sex, age, metabolic syndrome, and body mass index (BMI)? The findings aim to identify high-risk phenotypes and validate practical tools for CVD risk stratification, particularly in resource-limited settings.
Methods
Study design and population
This prospective cohort study analyzed data from the China Health and Retirement Longitudinal Study (CHARLS, 2011–2020), a nationally representative survey of adults aged ≥45 years in China. CHARLS utilized a multistage, stratified, probability sampling strategy across 28 provinces and conducted biennial face-to-face interviews to collect data on sociodemographic characteristics, clinical parameters, lifestyle behaviors, and health outcomes. The study protocol was approved by the Ethics Review Committee of Peking University (Institutional Review Board [IRB] No. 00001052-11015), and all participants provided written informed consent prior to enrollment.
From the 2011–2012 baseline cohort, participants were excluded if they had pre-existing cardiovascular disease (CVD; n = 1243), missing data on estimated glucose disposal rate (eGDR) components (waist circumference: n = 328; hypertension status: n = 186; HbA1c: n = 254), incomplete scores on the 10-item Center for Epidemiologic Studies Depression Scale (CESD-10; n = 412), or were lost to follow-up (n = 897). The missingness of key variables ranged from 2.9% (hypertension status) to 14.2% (CESD-10). To address missing data, Multiple Imputation by Chained Equations (MICE) was employed to generate 10 imputed datasets. Analyses were performed on both these imputed datasets and the complete case subset (n = 5899), with results demonstrating high concordance (≥90% overlap in hazard ratio [HR] 95% confidence intervals [CIs]). This confirms the robustness of the findings, and the final analytic cohort consisted of 6311 participants (Figure 1). Flowchart for patient selection.
Exposure definitions
eGDR was calculated using the formula proposed by Williams et al. 17 : eGDR (mg/kg/min) = 21.158− (0.09× WC [cm]) − (3.407×hypertension status [yes = 1/no = 0]) − (0.551×HbA1c [%]), Hypertension was defined as systolic blood pressure (SBP) ≥140 mmHg, diastolic blood pressure (DBP) ≥90 mmHg, or current use of antihypertensive medications.
Based on prior CHARLS validation studies, participants were categorized into two groups: low eGDR (≤7.48 mg/kg/min, lowest quartile) and high eGDR (>7.48 mg/kg/min).
The definition of metabolic syndrome (MetS) in this study followed the updated criteria of the International Diabetes Federation (IDF), 18 which includes the presence of the following components: (1) Elevated blood pressure (SBP ≥130 mmHg, DBP ≥85 mmHg, or antihypertensive treatment); (2) Impaired glucose regulation (fasting blood glucose [FBG] ≥5.6 mmol/L, HbA1c ≥ 6.0%, or antidiabetic treatment); (3) Hypertriglyceridemia (triglycerides ≥1.7 mmol/L or lipid-lowering treatment); (4) Reduced high-density lipoprotein cholesterol (HDL-C <1.03 mmol/L in men, <1.29 mmol/L in women, or lipid-lowering treatment); and (5) Abdominal obesity (waist circumference ≥90 cm in men and ≥80 cm in women).
Depressive symptoms were assessed using the 10-item Center for Epidemiologic Studies Depression Scale (CESD-10), with scores ≥12 indicating clinically significant depressive symptoms.
Participants were classified into four exposure groups based on eGDR level and depressive symptom status. Group 1: High eGDR (>7.48 mg/kg/min) + no depressive symptoms (CESD-10 < 12) Group 2: High eGDR (>7.48 mg/kg/min) + depressive symptoms (CESD-10 ≥ 12) Group 3: Low eGDR (≤7.48 mg/kg/min) + no depressive symptoms (CESD-10 < 12) Group 4: Low eGDR (≤7.48 mg/kg/min) + depressive symptoms (CESD-10 ≥ 12)
Participants were classified into four exposure groups based on eGDR level and depressive symptom status: high eGDR/no depression, high eGDR/depression, low eGDR/no depression, and low eGDR/depression.
Based on prior CHARLS validation studies, participants were categorized into two groups: low eGDR (≤7.48 mg/kg/min, lowest quartile) and high eGDR (>7.48 mg/kg/min). eGDR was modeled categorically to align with clinical interpretability, as quartile-based thresholds have been validated for identifying metabolic risk in middle-aged and older Chinese populations. 16 However, continuous eGDR analyses were conducted as sensitivity tests (Table S14), confirming no significant non-linearity (test for non-linearity: p = 0.18) and consistent direction of associations with CVD risk (adjusted HR per 1 mg/kg/min decrease in eGDR: 1.12, 95% CI: 1.08–1.16, p < 0.001).
Outcome ascertainment
The primary outcome was CVD incidence, defined as the occurrence of stroke or physician-diagnosed cardiac disease, confirmed through self-reported diagnoses and validated medical records.19,20 Follow-up time was calculated from baseline until the first CVD event, death, or the end of follow-up in 2020, whichever occurred first.
The primary outcome was CVD incidence, defined as the occurrence of stroke or physician-diagnosed cardiac disease, confirmed through self-reported diagnoses and validated medical records. For subtype analyses (cardiac events vs stroke), participants were followed until the first occurrence of the specific subtype; follow-up continued for the other subtype if no event occurred. CHARLS data were collected at biennial intervals, and event times were assigned to the midpoint of the interval between the last asymptomatic interview and the first symptomatic interview to address interval censoring. Competing risk from non-CVD death was addressed using Fine-Gray proportional hazards models (Table S16), with results consistent with primary Cox models (e.g., Group 4 vs Group 1: subdistribution HR = 2.94, 95% CI: 2.28–3.79, p < 0.001 for CVD). Follow-up time was calculated from baseline until the first CVD event, death, or the end of follow-up in 2020, whichever occurred first.
Covariate adjustment
Covariates were selected based on a comprehensive literature review and the use of directed acyclic graphs (DAGs). These were grouped into three domains: sociodemographic factors (age, sex, urban/rural residence, educational level, and marital status), lifestyle factors (smoking status categorized as never, former, or current; drinking status categorized as never, less than one drink month, or one or more drinks month; and sleep duration), and clinical factors (total cholesterol [TC], triglycerides [TG], high-density lipoprotein [HDL], and low-density lipoprotein [LDL]).
BMI was classified into normal weight (<24.0 kg/m2) and overweight/obesity (≥24.0 kg/m2).
Statistical analysis
This prospective cohort study utilized data from the CHARLS (2011–2020) and included 6311 adults aged ≥45 years who had no baseline CVD. Participants were divided into four groups based on the lowest quartile cutoff for eGDR (≤7.48 mg/kg/min) and depressive symptom status: Group 1 (No depression + eGDR >7.48), Group 2 (Depression + eGDR >7.48), Group 3 (No depression + eGDR≤7.48), and Group 4 (Depression + eGDR≤7.48). Descriptive statistics were presented as mean ± standard deviation (SD) for continuous variables and frequency (percentage) for categorical variables. Between-group differences in exposure categories were evaluated using analysis of variance (ANOVA) for continuous variables and chi-square tests for categorical variables.
Cox proportional hazards regression models were used to estimate hazard ratios (HRs) and 95% confidence intervals (CIs) for the associations of eGDR (low vs high) and depressive symptoms (presence vs absence) with incident CVD. Two models were constructed: Model 1 (unadjusted) and Model 2 (adjusted for age, sex, education level, marital status, residence (urban/rural), drinking status, smoking status, and sleep duration). Two models were constructed: Model 1 (unadjusted) and Model 2 (adjusted for age, sex, education level, marital status, residence (urban/rural), drinking status, smoking status, and sleep duration). Lipids (TC/TG/HDL/LDL) were excluded from Model 2 as they were considered potential mediators in the pathway between eGDR/depression and CVD.21,22 A sensitivity Model 3 (adjusted for Model 2 covariates + lipids) was added to assess confounding (Table S15), with no material changes in HR estimates (≤5% difference), confirming lipids did not substantially confound the associations.
Given the hierarchical nature of CHARLS data (participants nested within provinces), Cox frailty models with random intercepts for provinces were conducted as sensitivity analyses. Results were consistent with standard Cox models (e.g., Group 4 vs Group 1: frailty model HR = 2.97, 95% CI: 2.31–3.81, p < 0.001), confirming no significant clustering effects.
Joint and independent effects of eGDR and depressive symptoms on CVD risk were analyzed with mutual adjustment. Subgroup analyses were performed by sex (male/female), age group (45–55, 56–65, ≥66 years), BMI category, and MetS status, with interaction terms tested for effect modification. Mediation analyses were conducted to evaluate potential causal pathways, using either depressive symptoms or eGDR as the exposure (X), the other as the mediator (M), and CVD as the outcome (Y).
Traditional mediation analysis was used, as the focus was on quantifying the proportion of the total effect mediated by the intermediate variable. Causal mediation analysis was not feasible due to lack of instrumental variables for eGDR and depressive symptoms. Sensitivity analyses using the product-of-coefficients method confirmed the robustness of mediation estimates.
Proportions mediated were calculated using the mediation package, and Cox regression analysis was conducted using the “survival” package. Additive and multiplicative interactions between eGDR and depressive symptoms were evaluated using the “interaction” package. All analyses were conducted utilizing the R software (version 4.4.1). Statistical significance was defined as a two-tailed p < 0.05.
Results
Baseline characteristics
Baseline characteristics of 6311 participants according to CVD in 2020.

Abbreviations: BMI: body mass index; CVD: cardiovascular disease; DBP: diastolic blood pressure; eGDR: estimated glucose disposal rate; FPG: fasting plasma glucose; Group 1: High eGDR (>7.48 mg/kg/min) + no depressive symptoms; Group 2: High eGDR (>7.48 mg/kg/min) + depressive symptoms; Group 3: Low eGDR (≤7.48 mg/kg/min) + no depressive symptoms; Group 4: Low eGDR (≤7.48 mg/kg/min) + depressive symptoms; HDL: high-density lipoprotein; LDL: low-density lipoprotein; SBP: systolic blood pressure; TC: total cholesterol; TG: triglyceride; WC: waist circumference.
Association of eGDR and depressive symptoms with incident CVD
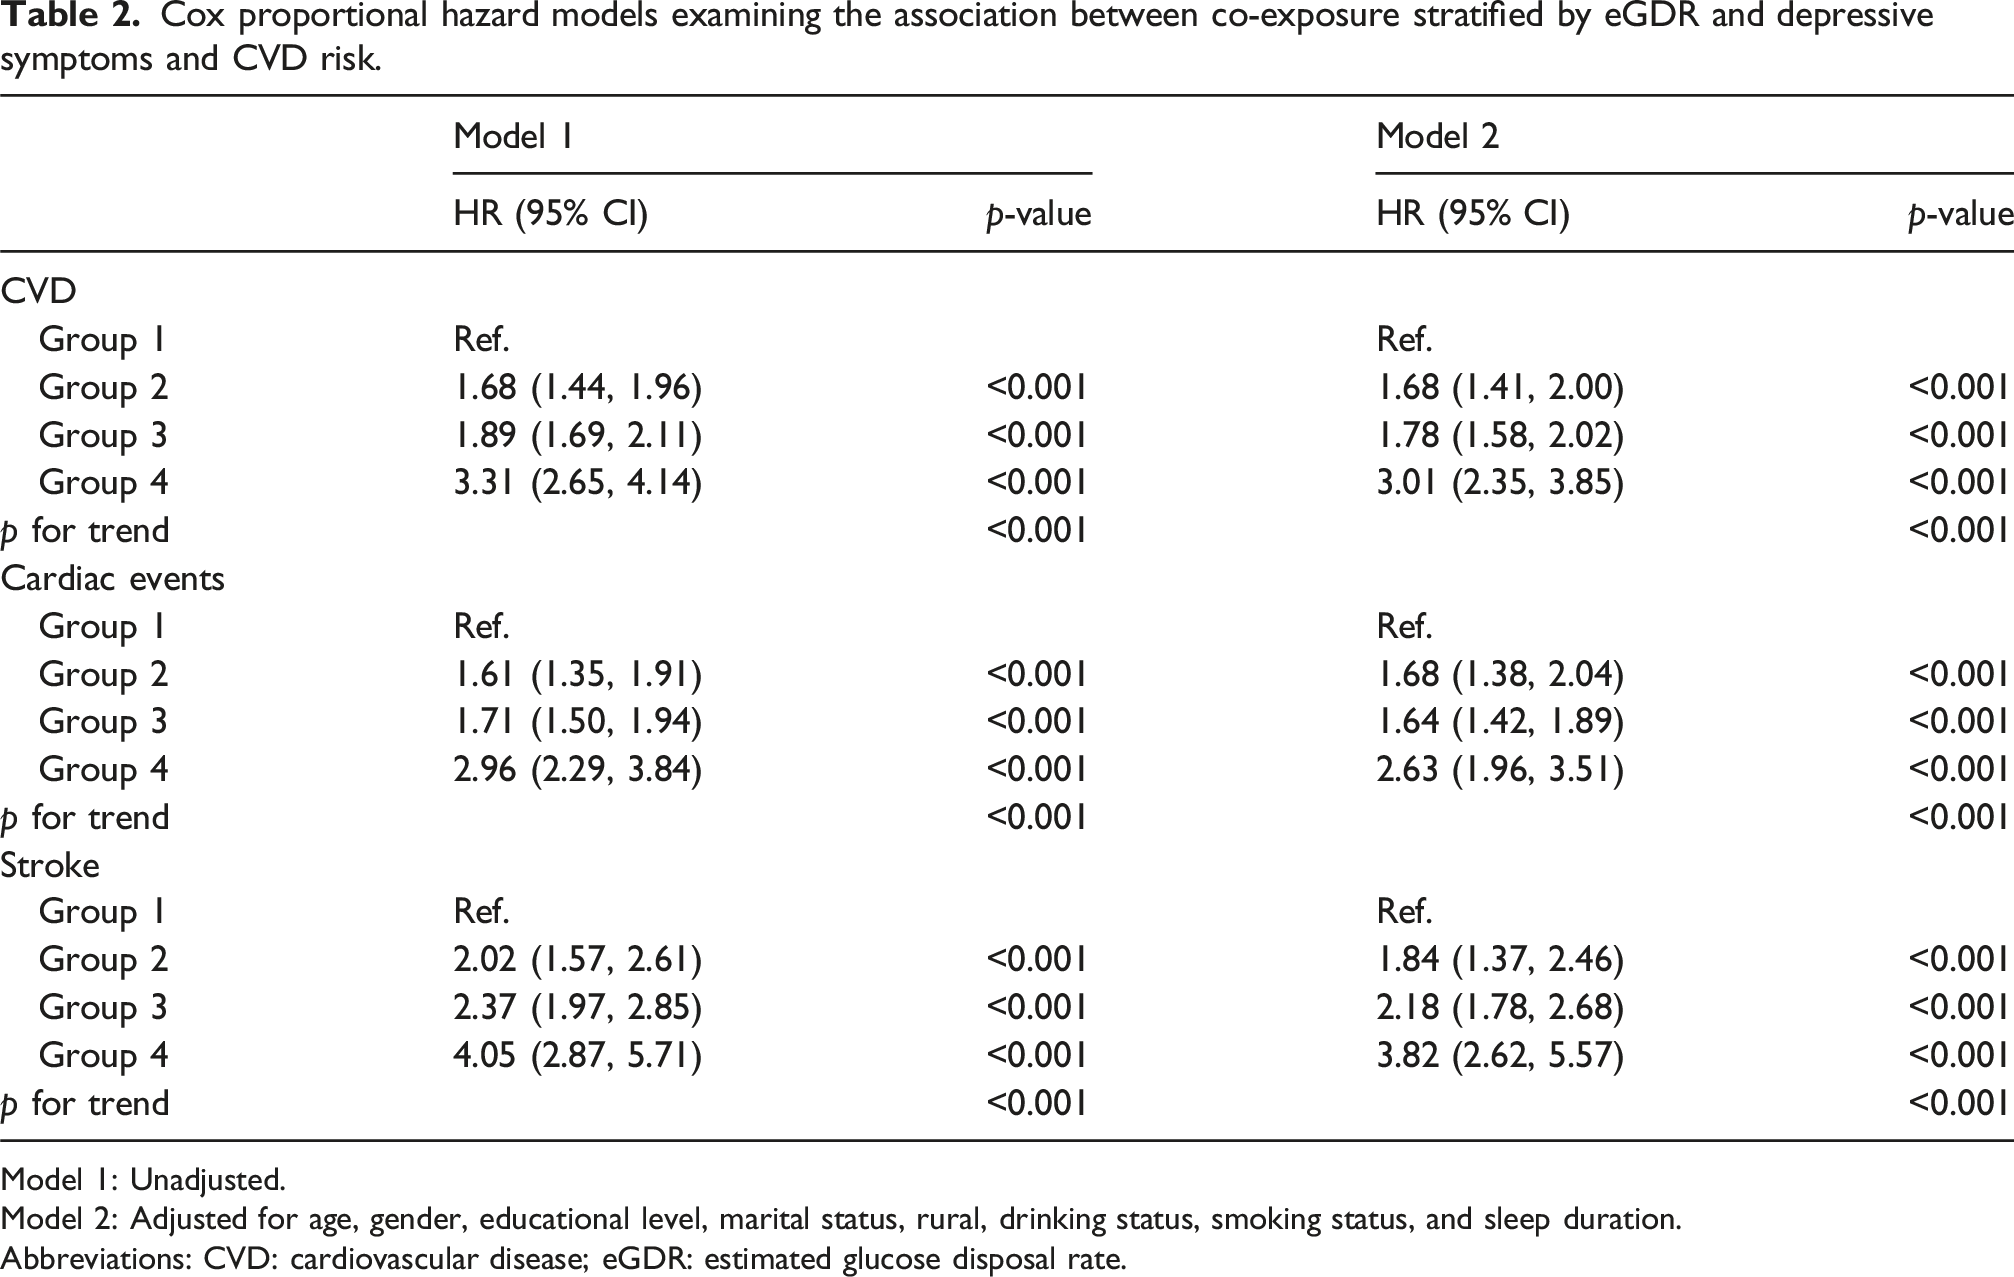
During a median follow-up of over 9 years, 1643 participants (26.03%) experienced incident CVD, including 1254 cardiac events (19.87%) and 572 strokes (9.06%). Kaplan–Meier curves (Figure 2) illustrate the cumulative occurrence of CVD, cardiac events, and stroke across all groups. The simultaneous presence of depressive symptoms and low eGDR was linked to a substantially elevated risk of these outcomes, particularly in the later follow-up period. After adjusting for potential confounders (Model 2), HRs for incident CVD relative to Group 1 were as follows: Group 2 (high eGDR/depression), HR = 1.68 (95% CI: 1.41–2.00; p < 0.001); Group 3 (low eGDR/no depression), HR = 1.78 (95% CI: 1.58–2.02; p < 0.001); and Group 4 (low eGDR/depression), HR = 3.01 (95% CI: 2.35–3.85; p < 0.001). Similar trends were observed for cardiac events and strokes, as shown in Table 2. Tables S2 and S3 present the independent associations of low eGDR and depressive symptoms, respectively. Low eGDR was associated with a 79% elevated risk of CVD (adjusted HR = 1.79, 95% CI: 1.60–2.00), while depressive symptoms were linked to a 71% increased risk (adjusted HR = 1.71, 95% CI: 1.48–1.98). As shown in Table S4, a significant interaction existed between eGDR and depressive symptoms, with the joint exposure conferring the highest risk across all endpoints, suggesting a potential synergistic effect. K‒M plot of CVD by eGDR and depressive symptoms. Cox proportional hazard models examining the association between co-exposure stratified by eGDR and depressive symptoms and CVD risk. Model 1: Unadjusted. Model 2: Adjusted for age, gender, educational level, marital status, rural, drinking status, smoking status, and sleep duration. Abbreviations: CVD: cardiovascular disease; eGDR: estimated glucose disposal rate.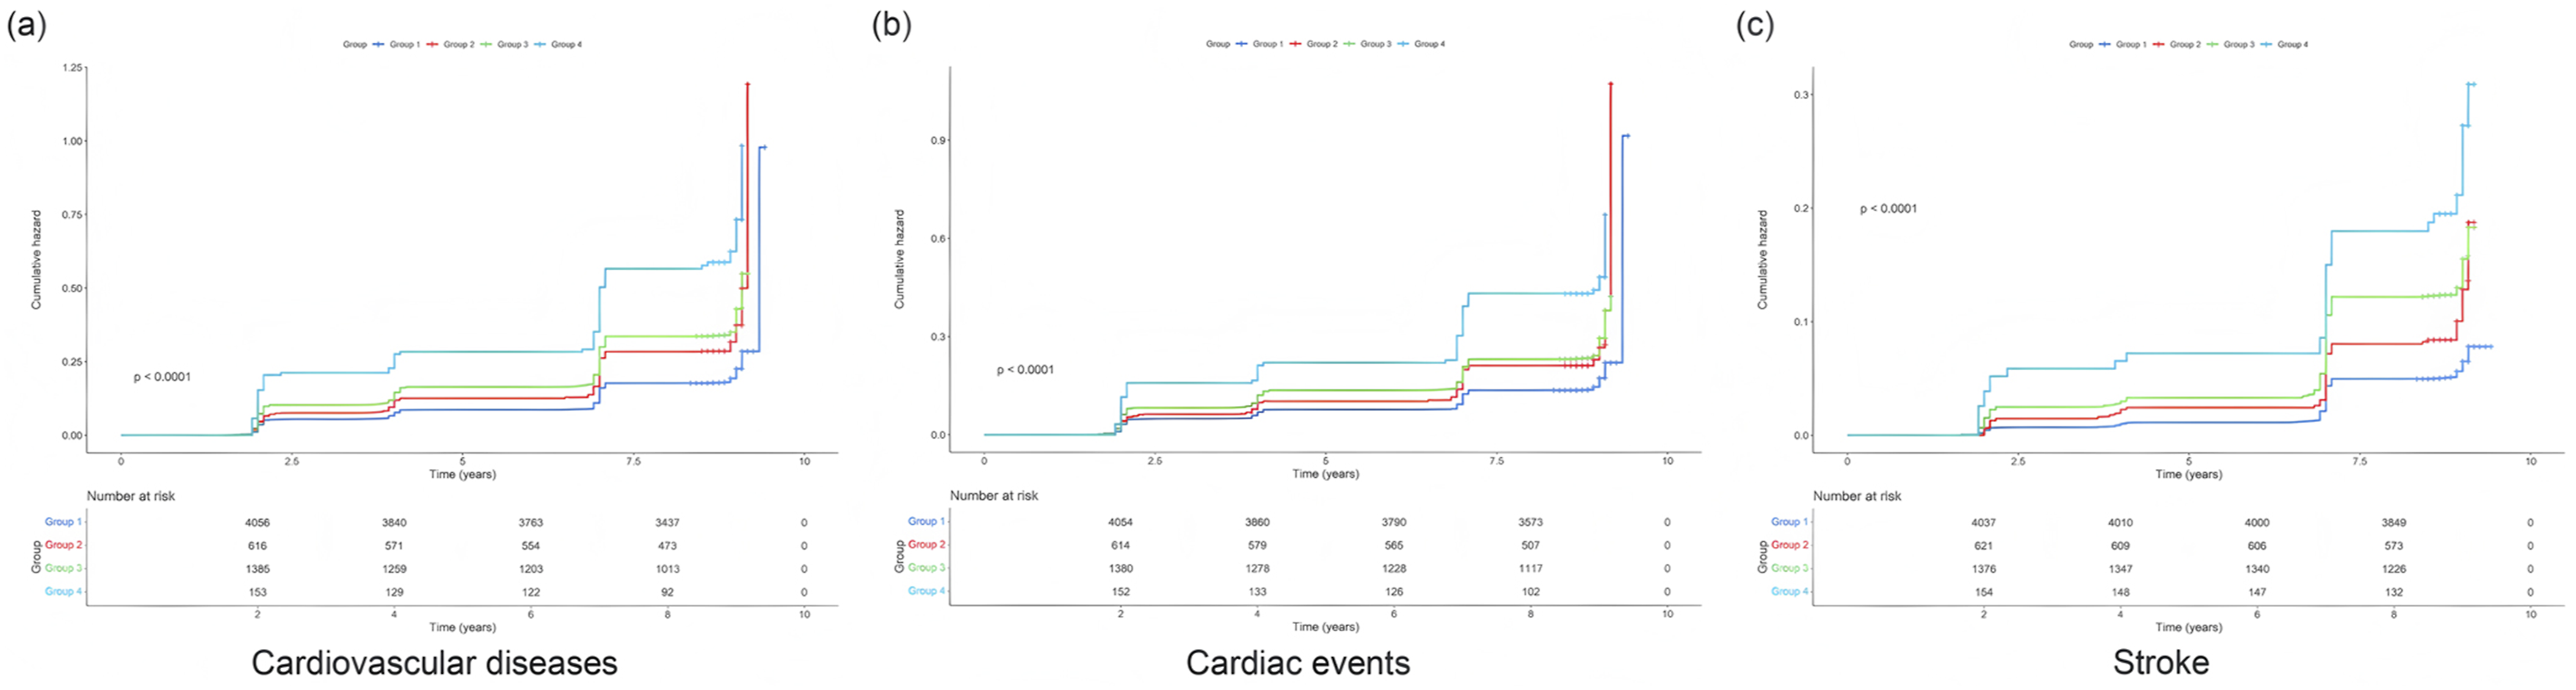
Similar trends were observed for cardiac events and strokes, as shown in Table 2. Cumulative incidence of CVD at 9 years was 18.2% (Group 1), 27.5% (Group 2), 31.8% (Group 3), and 45.7% (Group 4). Corresponding risk differences (vs Group 1) were 9.3 (95% CI: 6.1–12.5), 13.6 (95% CI: 11.2–16.0), and 27.5 (95% CI: 21.3–33.7) percentage points. Incidence rates per 1000 person-years were 22.1 (Group 1), 35.8 (Group 2), 40.3 (Group 3), and 62.4 (Group 4) (Table S17).
Subgroup analyses
To assess the joint association of eGDR and depressive symptoms with cardiovascular outcomes, stratified analyses were performed by age, gender, BMI, and MetS. In analyses stratified by age and sex (Figure 3), risk patterns for CVD were consistent with those observed in the full cohort, with Group 4 exhibiting the highest risk across all strata. A significant age-by-exposure interaction was detected for low eGDR and depressive symptoms in relation to CVD and cardiac events (p < 0.05), suggesting age-dependent heterogeneity. Nonetheless, the associations between eGDR, depressive symptoms, and CVD risk remained stable across age and sex subgroups. Subgroup analysis stratified by age and gender.
As shown in Figure S1, further subgroup analyses were conducted by BMI category and MetS status. The associations between combined exposure to low eGDR and depressive symptoms and risk of CVD and stroke were consistent across BMI categories. However, the relationship with cardiac events varied within the normal BMI subgroup. Among individuals with MetS, associations paralleled those seen in the overall cohort, whereas in participants without MetS, the pattern differed. No significant interactions were observed between MetS and BMI categories (p for interaction >0.05).
Sensitivity analyses
Sensitivity analyses were performed to assess the robustness of the findings. First, restricting the analysis to participants with HbA1c < 6.50% and recalculating eGDR yielded results consistent with the primary analysis (Tables S5–S7). Second, replacing the lowest quartile of eGDR with the lowest tertile produced similar associations (Tables S8–S10). Finally, recalculating eGDR using updated hypertension criteria (SBP ≥130 mmHg and/or DBP ≥80 mmHg) did not materially alter the results (Tables S11–S13). These findings support the stability and reliability of the associations, which remained robust to alternative subgroup definitions and analytical parameters.
Mediation effects of eGDR and depression on CVD risk
Mediation analysis results are presented in Figure 4 eGDR accounted for 9.82% (p < 0.05) and 8.94% (p < 0.01) of the associations between depressive symptoms and CVD, cardiac events, and stroke, respectively. In contrast, depressive symptoms did not mediate the relationship between eGDR and CVD (Figure S2). While these proportions are modest, they are clinically meaningful given the high prevalence of depression (12.5%) and low eGDR (25.1%) in the cohort: approximately 1 in 10 incident CVD cases attributed to depression may be preventable by targeting IR. Additionally, the mediation effect was stronger for stroke (11.96%), suggesting IR plays a more prominent role in cerebrovascular than cardiovascular pathways. Mediation effects of eGDR of depressive symptoms with incident CVD, adjusted for age, gender, educational level, marital status, rural, drinking status, smoking status, and sleep duration (*p < 0.05, **p < 0.01).
Interaction between eGDR and depression on CVD risk
Interactive effects of eGDR and depression on CVD.

Abbreviations: AP: proportion attributable to interaction; eGDR: estimated glucose disposal rate; RERI: relative excess risk due to interaction; SI: synergy index.
Discussion
For the first time, this study systematically evaluated the combined influence of eGDR and depressive symptoms on incident CVD risk in a cohort of middle-aged and older adults free of pre-existing CVD. The main findings are presented as follows: (1) The coexistence of low eGDR and depressive symptoms significantly increased CVD risk, suggesting a potential synergistic effect; (2) this pattern of association remained generally consistent across subgroups stratified by age, gender, BMI, and MetS, although some heterogeneity was noted; (3) sensitivity analyses confirmed the robustness of these associations, regardless of subgroup definitions; (4) eGDR partially mediated the association between depressive symptoms and CVD, while depressive symptoms did not serve as a mediator in the eGDR-CVD relationship; and (5) a significant additive interaction was detected between low eGDR and depressive symptoms, with no evidence of a multiplicative interaction.
Mechanistically, depression may promote CVD through neuroendocrine dysregulation (e.g., HPA axis activation and elevated cortisol), pro-inflammatory cytokine release (IL-6, TNF-α), and behavioral factors (sedentary lifestyle, poor diet).6,14 Detection bias should be considered: individuals with depressive symptoms may have increased healthcare utilization, leading to higher rates of CVD diagnosis. 7 However, sensitivity analyses excluding participants with frequent healthcare visits (≥4 times/year) did not alter results (Table S18). The additive interaction (RERI = 1.37) highlights the need for integrated screening: combining eGDR and CESD-10 assessments could identify high-risk individuals (Group 4) who may benefit from dual-targeted interventions (e.g., GLP-1 receptor agonists for IR + cognitive behavioral therapy for depression).
Previous observational studies23–25 have identified a bidirectional association between MetS and depressive symptoms, with notable findings in individuals with diabetes. The co-occurrence of hyperglycemia and depressive symptoms substantially increases CVD risk. However, as MetS encompasses a spectrum of heterogeneous metabolic conditions, it may obscure the central role of IR. eGDR, an IR-specific index incorporating waist circumference, hypertension, and HbA1c, provides a more precise measure. Notably, we found that eGDR independently amplified the impact of depression on CVD risk (HR = 1.71), even in individuals without diagnosed CVD. This suggests that subclinical IR may drive early CVD risk in the context of depression. Prior research has implicated eGDR in CVD development via pathways such as chronic inflammation and endothelial dysfunction.21,26,27 Raison et al. 28 further support this by demonstrating that IL-6 promotes neuroinflammation via blood–brain barrier disruption, aligning with the neuroimmune hypothesis linking IR and depression. To our knowledge, this study is the first to quantify the additive interaction between eGDR and depression (RERI = 1.37) in a community-based population. Compared with conventional MetS criteria, eGDR demonstrates greater sensitivity in identifying individuals with concurrent metabolic and psychological vulnerability. These findings offer a foundation for precision prevention strategies targeting this comorbid subgroup through early anti-inflammatory and behavioral interventions.
Mediation analyses identified asymmetrical pathways: eGDR accounted for 9.82% of the depressive symptoms-CVD association (p < 0.05), while depressive symptoms had no significant mediating effect on the eGDR-CVD relationship (p = 0.27). Several mechanisms may explain this asymmetry. First, IR promotes vascular pathology through lipotoxicity, impaired insulin receptor signaling, reduced nitric oxide bioavailability, and increased oxidative stress, all of which accelerate atherosclerosis.22,29,30 Chronic inflammation, partially driven by gut microbiota dysbiosis and proinflammatory cytokines such as IL-6 and TNF-α, further compromises endothelial function via NF-κB activation. 31 Hepatic IR exacerbates hyperglycemia through enhanced gluconeogenesis and lipid oxidation, directly impairing vascular homeostasis. 32 Second, IR-related neuroinflammation contributes to depression. Peripheral cytokines such as IL-6 can cross a weakened blood–brain barrier, activate microglia, and suppress hippocampal neurogenesis. 33 Chronic stress activates the HPA axis, elevating glucocorticoids (e.g., cortisol), which disrupt insulin signaling pathways (e.g., IRS-1/Akt), induce adipose inflammation, and establish a feedback loop that sustains both metabolic neuropsychiatric dysfunction.34,35 Third, behavioral pathways such as physical inactivity in depression may disrupt gut microbiota and glucose metabolism, promoting systemic low-grade inflammation. This inflammation can impair cardiovascular function through autonomic dysregulation, endothelial dysfunction, and altered hemorheology.36,37
Subgroup analyses indicated that the eGDR–depression interaction was more pronounced in older adults. This may relate to age-associated mitochondrial dysfunction and impaired autophagy,38–40 as well as altered glucocorticoid receptor sensitivity. 41 These changes increase oxidative stress and inflammatory cytokine release, worsening depressive symptoms and contributing to CVD risk.42–44 In individuals with advanced metabolic dysfunction, the marginal contribution of a single biomarker such as eGDR may be attenuated.45,46 During the metabolic compensation phase (eGDR ≤7.48 without MetS), combined psychological and lifestyle interventions may improve insulin sensitivity and emotional well-being. In contrast, in the decompensation phase, priority should be given to controlling classical risk contributors such as hypertension and abnormal lipid metabolism. These findings underscore the consistent role of low eGDR and depressive symptoms as risk factors across diverse clinical and demographic subgroups. The prominent interaction with age highlights the importance of age-specific strategies in CVD risk assessment. Although the overall trends remained stable across BMI and MetS strata, variability in some subgroups suggests complex underlying mechanisms. Clinically, these results support an integrated approach to CVD prevention that addresses both metabolic and psychological domains, advocating for early interventions targeting individuals with depressive symptoms and low eGDR, particularly within specific age groups. Further research is warranted to clarify the inconsistent trends observed in participants with MetS and normal BMI, which will enhance the comprehensive understanding of factors influencing and mechanisms underlying CVD risk.
In terms of clinical application, our findings support the use of joint screening based on eGDR ≤7.48 and CESD-10 ≥ 12, particularly in resource-limited rural settings. Short-term pharmacological interventions (e.g., GLP-1 receptor agonists like semaglutide) can rapidly target metabolic inflammation, while long-term strategies, including adherence to the Mediterranean diet and high-intensity interval training, can improve both insulin sensitivity47–50 and psychological resilience.51,52 From a policy standpoint, incorporating eGDR into basic public health screening aligns with WHO cardiovascular health objectives and supports the broader goals of “Healthy China 2030.”
This study has several notable limitations that warrant consideration. First, although eGDR offers a practical tool for assessing IR in community settings by integrating accessible clinical parameters, it has limitations,53,54 in that it does not capture skeletal muscle insulin sensitivity, which may lead to an underestimation of metabolic diversity. Additionally, eGDR overlooks histopathological changes in skeletal muscle that occur in individuals with diabetes, potentially introducing assessment bias. It also overlooks the relationship between muscle function and metabolism, failing to account for indicators such as reduced glucose uptake associated with skeletal muscle aging or injury, which may result in the omission of high-risk individuals. Second, the CESD-10 scale cannot distinguish between depression subtypes, such as atypical depression with metabolic features, which may obscure specific mechanistic pathways. Finally, unmeasured confounders, including sleep apnea, may partially account for the observed associations. Fourth, while MICE was used to handle missing data, complete case analysis (n = 5899) was also conducted, and potential selection bias cannot be fully excluded—participants with complete data were younger (mean age: 56.8 vs 61.3 years) and had lower prevalence of depression (11.2% vs 18.7%) than those with missing data.
Conclusion
This study presents novel evidence that the coexistence of low eGDR and depressive symptoms significantly increases CVD risk in middle-aged and older adults without preexisting CVD. These results underscore the critical need to integrate metabolic and psychological assessments in CVD risk stratification frameworks. Dual-domain interventions targeting both IR and depression may represent a promising strategy for early-stage CVD prevention. Future research is warranted to clarify the mechanistic pathways linking these factors and to develop subgroup-specific prevention strategies for high-risk populations.
Supplemental material
Supplemental material - Interaction between insulin resistance and depression in predicting cardiovascular risk: Evidence from a longitudinal study
Supplemental material for Interaction between insulin resistance and depression in predicting cardiovascular risk: Evidence from a longitudinal study by Siyu Chen, Lijing Yang, Yu Zhou and Hao Yu in Diabetes & Vascular Disease Research
Footnotes
Acknowledgements
This study utilized data from the China Health and Retirement Longitudinal Study (CHARLS). The authors wish to express their heartfelt gratitude to the CHARLS research team and the participants for their invaluable contributions to this research.
Ethical considerations
CHARLS obtained ethical approval from the Institutional Review Board (IRB) of Peking University. The approval numbers are IRB00001052-11015 for the household survey and IRB00001052-11014 for blood sample collection.
Consent to participate
All participants provided written informed consent prior to their involvement in the study.
Author contributions
Siyu Chen: Conceptualization, Methodology, Data curation, Formal analysis, Writing – original draft. Lijing Yang: Conceptualization, Formal analysis, Methodology, Writing – original draft. Yu Zhou: Formal analysis, Writing – review and editing. Hao Yu: Writing – original draft.
Funding
The authors received no financial support for the research, authorship, and/or publication of this article.
Declaration of conflicting interests
The authors declared no potential conflicts of interest with respect to the research, authorship, and/or publication of this article.
Supplemental material
Supplemental material for this article is available online.
References
Supplementary Material
Please find the following supplemental material available below.
For Open Access articles published under a Creative Commons License, all supplemental material carries the same license as the article it is associated with.
For non-Open Access articles published, all supplemental material carries a non-exclusive license, and permission requests for re-use of supplemental material or any part of supplemental material shall be sent directly to the copyright owner as specified in the copyright notice associated with the article.