
Abstract
Objective
Kidney stones, affecting approximately 10% of adults worldwide, pose substantial clinical and economic burdens. Although insulin resistance is implicated in lithogenesis, the association between estimated glucose disposal rate, a surrogate marker of insulin sensitivity, and kidney stone risk, as well as the mediating role of lipid markers, remains unexplored.
Methods
This cross-sectional study analyzed data from 11,282 participants in the National Health and Nutrition Examination Survey (2007–2018). Estimated glucose disposal rate was calculated using waist circumference, hypertension status, and glycosylated hemoglobin. History of kidney stones was self-reported. Weighted logistic regression, restricted cubic spline models, and mediation analysis were used to assess associations, adjusting for sociodemographic, metabolic, and renal covariates.
Results
In our study, the mean age of participants was 47.71 years, and the prevalence of kidney stones was 9.8%. In the fully adjusted multifactorial logistic regression model, participants in the highest quartile of estimated glucose disposal rate (Q4) were 44% less likely to develop stones than those in Q1 (odds ratio: 0.56, 95% confidence interval: 0.37–0.83; p = 0.005). Restricted cubic spline analysis identified a nonlinear, inverted L-shaped relationship between estimated glucose disposal rate and kidney stone risk, with an inflection point at an estimated glucose disposal rate of 8.72. Below this threshold, each 1-unit increase in estimated glucose disposal rate was associated with an 8% reduction in stone risk (odds ratio: 0.92, 95% confidence interval: 0.88–0.95; p < 0.001), whereas above 8.72, the risk was reduced by 31% for each 1-unit increase (odds ratio: 0.69, 95% confidence interval: 0.60–0.79; p < 0.001). Mediation analysis suggested that high-density lipoprotein mediated 5.72% of the total effect (p = 0.001), independent of body mass index, diabetes, and other confounders.
Conclusions
Estimated glucose disposal rate and kidney stone risk demonstrated an inverted L-shaped association, with a threshold at 8.72. In addition, high-density lipoprotein partially mediated the association between estimated glucose disposal rate and kidney stones. These findings highlight the interaction between metabolic health and kidney stones and may guide personalized prevention strategies.
Keywords
Introduction
Kidney stones are a common urinary system disease worldwide, affecting approximately 10% of adults, with a rising incidence. 1 As a key contributor to the global disease burden, kidney stones cause severe pain, repeated hospital visits, and kidney damage. They are also associated with increased risk of hypertension, chronic kidney disease, and cardiovascular disease.2–4 In the United States, annual direct medical costs attributable to kidney stones exceed US$5 billion, whereas indirect costs, such as absenteeism and home care, further increase the socioeconomic burden. 5 The high recurrence rate (up to 50% within 10 years) makes kidney stones a long-term health challenge, reducing patients’ quality of life and contributing to psychological stress. 6 Although diet and genetics are known risk factors, some cases remain unexplained by traditional factors, prompting exploration of novel biomarkers and investigation of their nonlinear risk associations to improve risk assessment and enable personalized interventions.7,8
Insulin resistance (IR) is a key metabolic abnormality associated with various diseases. Although the hyperinsulinemic-euglycemic clamp (HEC) is considered the gold standard for assessing IR, its invasive nature and high cost limit its clinical application. 9 Traditional indicators, such as the homeostatic model assessment for insulin resistance (HOMA-IR), also exhibit limitations in certain populations.10,11 Estimated glucose disposal rate (eGDR), which is based on clinical parameters such as waist circumference, hypertension, and glycosylated hemoglobin (HbA1c), correlates well with HEC results. It is easy to calculate and suitable for large-scale studies, particularly for assessing IR in patients with type 1 diabetes. 12 Studies have shown that lower eGDR is associated with increased susceptibility to IR-related diseases, including nonalcoholic fatty liver disease, cardiovascular disease, and acute ischemic stroke.13–15 Lipid indicators (total cholesterol (TC), triglycerides (TG), high-density lipoprotein (HDL), and low-density lipoprotein (LDL)) are also associated with kidney stone risk. 16 However, few studies have investigated the relationship between eGDR and kidney stones and the role of lipid indicators in this context.
This study aims to use the National Health and Nutrition Examination Survey (NHANES) database to clarify the dose–response relationship between eGDR and kidney stone risk and to explore the mediating role of lipid indicators. These findings will help establish an eGDR-based risk stratification system and provide a basis for combined interventions (e.g. insulin sensitizers and HDL modulators) in patients with kidney stones and metabolic syndrome, offering theoretical support for reducing recurrence rates.
Methods
Data source
This study used data from NHANES, a nationally representative program conducted by the National Center for Health Statistics (NCHS). NHANES employs a complex, multistage, stratified cluster probability sampling design. Data collection includes interviews (e.g. medical history and dietary habits), physical examinations (e.g. blood pressure and anthropometric measurements), and laboratory tests (e.g. serum HDL and glucose). Objective measurements (clinical biomarkers) and self-reported variables (lifestyle factors) were integrated to explore metabolic–renal associations. The NCHS Ethics Review Board approved the NHANES protocols, and all participants provided written informed consent. The data are deidentified. All procedures performed in this study were conducted in accordance with the ethical standards of the institutional and/or national research committee and with the Declaration of Helsinki 1975, as revised in 2024.
Selection of the population
This retrospective cross-sectional study used data from six NHANES cycles (2007–2018). The inclusion criteria were as follows: (a) participants with a complete history of kidney stones; (b) participants with valid eGDR measurements; and (c) participants with complete lipid profiles and covariate data (Figure 1). Initially, 59,842 participants were screened. After excluding individuals with missing kidney stones information (n = 25,163), eGDR data (n = 4613), and lipid/covariate data (n = 18,784), 11,282 participants were included in the final analysis.

Flowchart presenting the selection of participants.
eGDR and kidney stones
Based on previous studies, eGDR (mg/kg/min) was calculated as follows: eGDR =21.158 − (0.09 × WC) − (3.407 × HT) − (0.551 ×HbA1c). Here, WC refers to waist circumference in centimeters, HT indicates hypertension (yes = 1/no = 0), and HbA1c is HbA1c expressed as percentage (%). WC and HbA1c were measured using standardized protocols. 17
A history of kidney stones was determined based on self-reported data. Participants were asked the question, “Have you ever had kidney stones?” Those who responded “yes” were classified as having a history of kidney stones.
Covariates in our study
Demographic variables included age, sex, race, marital status, education level, and poverty-to-income ratio (PIR). Smoking status was categorized as now, former, and never based on whether participants currently smoked and whether they had smoked more than 100 cigarettes. Drinking status was defined as consumption of ≥12 bottles of alcohol per year. Anthropometric measures included body mass index (BMI) and WC. Laboratory parameters included HbA1c, TC, TG, HDL, and LDL. The estimated glomerular filtration rate (eGFR) was calculated based on serum creatinine. Chronic conditions such as hypertension and diabetes mellitus (DM) were defined as follows: DM was diagnosed based on physician confirmation, HbA1c ≥6.5%, fasting glucose ≥7.0 mmol/L, or use of glucose-lowering medications; hypertension was defined as systolic/diastolic blood pressure ≥140/90 mmHg or the use of antihypertensive medications.
Statistical analysis
Participants were categorized according to quartiles of eGDR levels. NHANES sampling weights were applied in all analyses to ensure national representation. Continuous variables were reported as mean ± standard error, and categorical variables were presented as frequencies (weighted percentages). Comparisons of continuous variables between groups were performed using unpaired t-tests or one-way analysis of variance (ANOVA), and chi-square tests were applied for categorical variables. Multivariate logistic regression models were used to assess the association between eGDR (as a continuous variable and by quartiles) and the risk of kidney stones. Three models were constructed: Model 1 (unadjusted), Model 2 (adjusted for age, sex, race, and PIR), and Model 3 (fully adjusted for age, sex, race, PIR, education level, marital status, smoking status, drinking status, BMI, diabetes, HDL, LDL, and eGFR). Nonlinearity was assessed using restricted cubic spline (RCS) modeling. RCS analysis was performed with 4 knots placed at the 5th, 35th, 65th, and 95th percentiles of the eGDR distribution. Subgroup analyses were conducted according to age, sex, BMI, smoking status, drinking status, and diabetes status. The p for interaction was determined using likelihood ratio tests. In addition, associations between lipid markers and kidney stones were evaluated using multivariate logistic regression analysis. Mediation analyses using nonparametric bootstrapping (1000 iterations) were performed to quantify the indirect effects of TC, TG, HDL, and LDL on the association between eGDR and kidney stones, adjusting for the covariates included in Model 3.
The reporting of this study conforms to the Strengthening the Reporting of Observational Studies in Epidemiology (STROBE) guidelines. 18 All analyses were performed using R software (version 4.3.2), including the ‘survey,’ ‘tableone,’ and ‘rms’ packages. A two-tailed p value <0.05 was considered statistically significant.
Results
Baseline characteristics
The study included 11,282 participants, with an overall kidney stone prevalence of 9.8% (Table 1). Participants in lower eGDR quartiles exhibited distinct metabolic and demographic profiles compared to those in higher quartiles. Lower eGDR groups were characterized by older age, a higher proportion of males, a higher proportion of Non-Hispanic Black participants, and elevated rates of diabetes (p < 0.05). Metabolic parameters progressively worsened across decreasing eGDR quartiles, including higher BMI, larger waist circumference, elevated HbA1c levels, and adverse lipid profiles (lower HDL and higher TG).
Baseline characteristics of the study population according to eGDR quartiles.

Continuous variables are presented as mean ± SE, and categorical variables are presented as proportions (percentages).
eGDR quartiles: Q1 < 5.439, 5.439 ≤ Q2 < 7.956, 7.956 ≤ Q2 < 9.950, and 9.950 ≤ Q4.
BMI: body mass index; eGDR: estimated glucose disposal rate; eGFR: estimated glomerular filtration rate; HbA1c: glycosylated hemoglobin; HDL: high-density lipoprotein; LDL: low-density lipoprotein; PIR: poverty income ratio; TC: total cholesterol; TG: triglyceride; SE: standard error.
Association between eGDR and kidney stone risk
Multivariate logistic regression analysis demonstrated a robust inverse association between eGDR levels and kidney stone risk (Table 2). When analyzed as a continuous variable, each 1-unit increase in eGDR was associated with a 14% reduction in risk in the fully adjusted model (odds ratio (OR): 0.94, 95% confidence interval (CI): 0.89–0.98; p = 0.008). In the unadjusted model (Model 1), higher eGDR quartiles were associated with lower risk, with the highest quartile (Q4) showing 73% lower odds of kidney stones compared with Q1 (OR: 0.27, 95% CI: 0.22–0.35, p < 0.001). In Model 2 (adjusted for age, sex, race, and income), the risk was 63% lower in Q4 (OR: 0.37, 95% CI: 0.28–0.49; p < 0.001). In the fully adjusted Model 3 (including metabolic, lifestyle, and renal factors), the risk remained 44% lower in Q4 (OR: 0.56, 95% CI: 0.37–0.83; p = 0.005). A significant dose–response relationship was observed across all models (p for trend = 0.003).
Weighted logistic regression analysis of eGDR and kidney stones.

Model 1: Adjusted for none.
Model 2: Adjusted for age, sex, race, and PIR.
Model 3: Adjusted for age, sex, race, PIR, marital status, education level, drinking status, smoking status, BMI, DM, HDL, TC, and eGFR.
BMI: body mass index; CI: confidence interval; DM: diabetes mellitus; eGDR: estimated glucose disposal rate; eGFR: estimated glomerular filtration rate; HDL: high-density lipoprotein; OR: odds ratio; PIR: poverty income ratio; TC: total cholesterol.
Nonlinear relationship between eGDR and kidney stone risk
RCS analysis revealed a significant nonlinear inverted L-shaped relationship between eGDR and kidney stone risk (p overall < 0.001; p for nonlinearity = 0.009) (Figure 2 and Table 3). Below the inflection point (eGDR = 8.72), each 1-unit increase in eGDR was associated with an 8% reduction in kidney stone risk (OR: 0.92, 95% CI: 0.88–0.95; p < 0.001). Beyond this threshold, the protective effect was enhanced, with a 31% reduction in risk for each 1-unit increase in eGDR (OR: 0.69, 95% CI: 0.60–0.79; p < 0.001).

Restricted cubic spline of eGDR and kidney stones after adjustment for covariates in Model 3 (adjusted for age, sex, race, PIR, marital status, education level, drinking status, smoking status, BMI, DM, and eGFR). The shaded area represents the 95% CI. BMI: body mass index; CI: confidence interval; DM: diabetes mellitus; eGDR: estimated glucose disposal rate; eGFR: estimated glomerular filtration rate; PIR: poverty income ratio.
Nonlinear association between eGDR and risk of kidney stones.

eGDR: estimated glucose disposal rate.
Subgroup analysis
To further explore the association between eGDR and kidney stones across different populations stratified by age, sex, BMI, smoking status, drinking status, and diabetes status, subgroup analyses were performed (Figure 3). A negative association between eGDR and kidney stones was observed in most subgroups. Notably, no interaction was observed between eGDR and subgroup variables in relation to kidney stone risk.

Subgroup analysis of the association between eGDR and kidney stones. Models were adjusted for covariates included in Model 3. The p for interaction was calculated using likelihood ratio tests. eGDR: estimated glucose disposal rate.
Association between lipid indices and kidney stone risk
In the fully adjusted model (Model 3), higher HDL levels were inversely associated with the risk of kidney stones (OR: 0.990, 95% CI: 0.983–0.997; p = 0.007), whereas the other lipid indices, including TC, TG, and LDL, did not show significant associations after adjustment for confounders (Table 4).
Weighted logistic regression analysis of lipid indices and kidney stones.
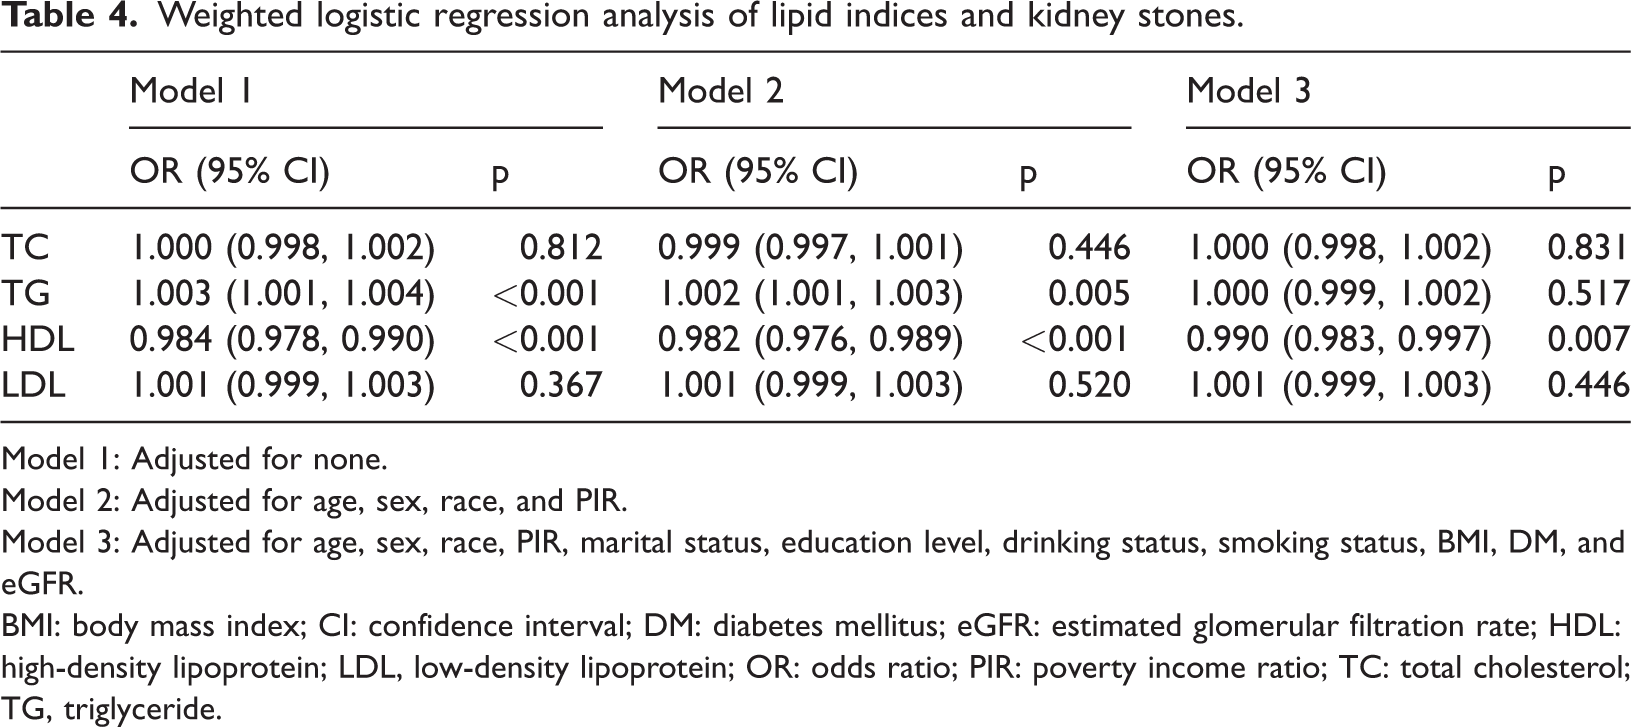
Model 1: Adjusted for none.
Model 2: Adjusted for age, sex, race, and PIR.
Model 3: Adjusted for age, sex, race, PIR, marital status, education level, drinking status, smoking status, BMI, DM, and eGFR.
BMI: body mass index; CI: confidence interval; DM: diabetes mellitus; eGFR: estimated glomerular filtration rate; HDL: high-density lipoprotein; LDL, low-density lipoprotein; OR: odds ratio; PIR: poverty income ratio; TC: total cholesterol; TG, triglyceride.
Mediation analysis of lipid indices in the eGDR–kidney stone association
We further explored the mediating roles of TC, TG, HDL, and LDL in the association between eGDR and kidney stones (Figure 4). After adjusting for all covariates, TC, TG, or LDL did not significantly mediated the association between eGDR and kidney stones. In contrast, HDL significantly mediated the negative association between eGDR and kidney stones, accounting for 5.72% of the total association.

Mediation analysis results of lipid indices in the association between eGDR and kidney stones. Bootstrapping was performed with 1000 iterations. eGDR: estimated glucose disposal rate.
Discussion
This study demonstrated a nonlinear inverted L-shaped relationship between eGDR and kidney stone risk, with eGDR of 8.72 identified as a critical inflection point. Beyond this threshold, higher eGDR was associated with a significantly reduced risk of kidney stones. Notably, HDL partially mediated this relationship, accounting for 5.72% of the total effect. These findings emphasize the interplay among IR, lipid metabolism, and kidney stones, thereby offering novel insights into the metabolic pathways underlying stone formation.
Renal stone disease is a common metabolic disorder of the urinary system, and its pathogenesis involves multiple metabolic factors. Recent studies have increasingly focused on how metabolic syndrome contributes to the formation of kidney stones. 19 Metabolic syndrome comprises a cluster of metabolic abnormalities, including IR, dyslipidemia, obesity, and hypertension, all of which are implicated in renal stone formation. For example, IR results in increased urinary excretion of calcium and decreased urinary excretion of citrate, both of which promote stone formation. 20 Upon investigating the association between five indicators of IR and the risk of kidney stone development, Shen et al. 21 reported that higher metabolic scores for insulin resistance (METS-IR) and triglyceride glucose–BMI (TyG–BMI) were associated with an increased incidence of renal stones. In addition, abnormal lipid metabolism has been associated with an increased risk of kidney stones. A longitudinal study from Taiwan, including 27,002 participants, found that hypertriglyceridemia (67–93 mg/dL) was associated with a 1.463-fold increase in the risk of new-onset kidney stones, whereas low HDL-cholesterol (HDL-C) (>63 mg/dL) was protective against new-onset kidney stone formation. 22 BMI has also been associated with an increased risk of renal calculi. For example, Semins et al. 23 reported that higher BMI was associated with an increased risk of developing kidney stones, and this positive association increased nonsignificantly when BMI exceeded 30. A similar association was observed in another study among patients with DM, in which each 1-unit increase in BMI was associated with a 2.1% increase in the risk of kidney stone development. 24 Previous studies have demonstrated that IR and HDL are closely associated with kidney stones. Yang et al. 25 found that Life’s Essential 8 (LE8), representing cardiovascular health, was linearly and inversely associated with kidney stones, with HDL mediating 19.62% and HOMA-IR mediating 24.26% of this association, emphasizing the importance of comprehensive cardiovascular health management. In contrast, our study directly revealed a nonlinear, inverted L-shaped relationship between eGDR, a surrogate marker of insulin sensitivity, and kidney stones, with HDL mediating 5.72% of the association, highlighting the value of eGDR as a specific risk stratification tool. Although LE8 is suitable for population-level primary prevention, eGDR is better suited for the precise identification of high-risk individuals with metabolic syndrome. This study makes two key contributions to the literature: (1) to the best of our knowledge, it is the first to characterize the dose–response relationship between eGDR and kidney stones as nonlinear with an identifiable inflection point, enabling precision risk stratification and (2) it validates that eGDR, an easily calculated clinical metric, may serve as a practical alternative to invasive insulin sensitivity assessments in nephrolithiasis research.
The inverse relationship between eGDR and kidney stones may be explained by several mechanisms. First, IR enhances urinary calcium excretion by upregulating the Na+/H+ exchanger and inhibiting renal calcium reabsorption. 26 Concurrently, hyperinsulinemia induced by IR causes urine acidification (lower urinary pH) and decreased urinary citrate excretion, which together facilitate calcium crystallization and nephrolithiasis. 27 Abate et al. 27 reported that IR was associated with low urinary pH based on a hyperinsulinemic normoglycemic clamp test, 24-h urinalysis, and anthropometric evaluation of 55 healthy volunteers and 13 patients with recurrent uric acid renal stones. In addition, the mediating role of HDL in the association between eGDR and kidney stone risk may operate through several pathways. First, HDL-bound paraoxonase-1 (PON1) attenuates oxidative stress and reduces renal tubular injury and crystal nucleation.28,29 Second, HDL regulates insulin signaling by upregulating adiponectin and indirectly improving insulin sensitivity. 30 Giannini et al. 31 reported a significant positive correlation between the TG/HDL-C ratio and IR in White obese adolescents by conducting oral glucose tolerance tests and fasting lipid analyses in 1452 adolescents with obesity.
This study has several limitations in exploring the relationship between eGDR and kidney stone risk and the mediating role of lipid indicators. First, the cross-sectional design does not allow for causal inference; longitudinal studies are needed to confirm temporal relationships. Second, residual confounding (e.g. dietary oxalate intake and genetic factors) may persist despite extensive adjustments. Third, this study relied on self-reported histories to obtain information on kidney stones. This approach may have introduced recall bias, as some participants, particularly asymptomatic cases or those with mild symptoms who did not seek medical care, might have failed to report previous episodes, potentially resulting in underestimation of kidney stone prevalence. Fourth, eGDR was calculated using surrogate markers (waist circumference, HbA1c, and hypertension), which may not fully capture insulin sensitivity compared with the HEC, and measurement errors in waist circumference and HbA1c may have affected the accuracy of eGDR calculations. Finally, the NHANES database primarily includes US participants, and it remains uncertain whether these findings are generalizable to populations in other countries or regions. Future research should integrate multomics approaches to elucidate the specific stone-protective pathways of HDL.
Conclusion
This study demonstrates a nonlinear inverted L-shaped relationship between eGDR and kidney stone risk, with a critical threshold at eGDR of 8.72. Lower eGDR levels, indicative of IR, are independently associated with elevated kidney stone risk, with HDL accounting for 5.72% of this association. These findings highlight that eGDR may serve as a novel biomarker for risk stratification and suggest that HDL may play a contributory role in this association, potentially informing future intervention strategies.
Footnotes
Acknowledgments
Not applicable.
Author contributions
Junzhi Liu, Xiaoyi Li, and Kun Xu: Project development, Data Collection, and Manuscript writing; Xinfeng Chen, Jie Jiang, Zhenmin Liu, Jiangang Chen, Dehua Hu, and Haixia Liu: Data collection; and Bing Zheng, Hua Zhu, and Jianwei Liu: Manuscript revision.
Data availability statement
All data for this study were obtained from the NHANES website (NHANES Questionnaires, Datasets, and Related Documentation).
Declaration of conflicting interests
The authors confirm that they have no conflicts of interest.
Ethics approval and consent to participate
This study was conducted in accordance with the Declaration of Helsinki. The NHANES was approved by the Research Ethics Review Committee of the National Center for Health Statistics, and participants provided written informed consent (Ethics Review Board Approval|National Health and Nutrition Examination Survey|CDC).
Funding
This research was funded by the following grants: Nantong Municipal Science and Technology Plan Project (MSZ2024099); Medical Research Project of Nantong Health Commission (MS2024032); Current status of the application of artificial intelligence big models in the field of health in Shenzhen and the establishment of a standardised assessment system (738020023).