
Abstract
Aims/Hypothesis
We hypothesised that the detrimental effect of high glucose variability (GV) in people with type 1 diabetes is mainly evident in those with concomitant insulin resistance.
Methods
We conducted secondary analyses on continuous glucose monitoring (CGM) using baseline observational data from three randomised controlled trials and assessed the relationship with established vascular markers. We used standard CGM summary statistics and principal component analysis to generate individual glucose variability signatures for each participant. Cluster analysis was then employed to establish three GV clusters (low, intermediate, or high GV, respectively). The relationship with thrombotic biomarkers was then investigated according to insulin resistance, assessed as estimated glucose disposal rate (eGDR).
Results
Of 107 patients, 45%, 37%, and 18% of patients were assigned into low, intermediate, and high GV clusters, respectively. Thrombosis biomarkers (including fibrinogen, plasminogen activator inhibitor-1, tissue factor activity, and tumour necrosis factor-alpha) increased in a stepwise fashion across all three GV clusters; this increase in thrombosis markers was evident in the presence of low but not high eGDR and at a threshold of eGDR <5.1 mg/kg/min.
Conclusion
Higher GV is associated with increased thrombotic biomarkers in type 1 diabetes but only in those with concomitant insulin resistance.
Introduction
The association between long-term glucose control, as assessed by HbA1c, and risk of vascular complications in type 1 diabetes is well established. 1 While HbA1c reflects an average glucose level over an approximate period of 3 months, it fails to capture glucose variability (GV) which some studies have shown to associate with adverse vascular outcome. 2 In addition to glycaemia, both microvascular and macrovascular complications show an association with insulin resistance (IR) in people with type 1 diabetes. 3 Higher insulin doses used in type 1 diabetes individuals with IR may predispose to greater glucose fluctuations, implicating GV, in the presence of IR, a potential pathogenic mechanism for increased vascular complications. However, accurate assessment of IR requires clamp studies that are invasive and difficult to perform in routine practice. Alternatively, estimated glucose disposal rate (eGDR) is emerging as a practical alternative 4 particularly given its association with clinical outcomes in this population. 5 In this study we tested the hypothesis that GV is associated with an adverse vascular profile in type 1 diabetes in the presence of IR, measured as eGDR.
Materials and methods
Study population
This study consisted of data from three randomised controlled trials (RCTs) conducted by our group (Clinical trial registration: NCT02595658; ISRCTN40811115; ISRCTN13641847). Each RCT received ethical approval from local National Health Service Research Ethics Committees (REC reference: 14/NE/1183, 17/NE/0244, 20/LO/0650) and written informed consent was obtained from all participants.
We included participants that met inclusion criteria as described previously6,7 including classical presentation of type 1 diabetes; aged 18–50 years; diabetes duration of ≥5-years; treated on a stable (>12-months) basal-bolus insulin regimen delivered through multiple daily injections or continuous subcutaneous insulin infusion; and no established diabetes-related complications.
Data collection and study procedures
We used baseline pre-treatment data across each RCT and obtained the following physiological characteristics: age, duration of diabetes, HbA1c, insulin requirements, BMI, blood pressure. Participants were categorised as hypertensive if ≥140/90 mmHg, pre-existing physicians’ diagnosis, or prescribed antihypertensive drugs. Overnight fasting venous blood samples were obtained and analysed plasma levels of tumour necrosis factor alpha (TNF-a; Human TNF-a Quantikine ELISA; R&D Systems, Roche Diagnostics, UK), fibrinogen (ab108842, Fibrinogen Human ELISA Kit; Abcam, Japan), tissue factor activity (TF; Human Tissue Factor activity ab108906; Abcam, UK) and plasminogen activator inhibitor-1 activity (PAI-1; Human PAI-1/serpin ELISA Kit DSE100; R&D systems, UK) were measured using methods previously described. 6 Intra-assay coefficient of variation was <10% for all biochemical analysis.
eGDR was calculated using a composite of BMI, HbA1c and hypertensive status using the following formulae: eGDR = 19.02–(0.22 X BMI [kg/m2])–(3.26 X HTN)–(0.61 X Hba1c [%]), whereby HTN is hypertension (1 = yes, 0 = no).5,8
The definitions of continuous glucose monitoring (CGM)-derived glucose metrics [Medtronic Minimed, Northridge, CA, USA, (n = 100) and Dexcom G4 Platinum, Dexcom Inc, San Diego, CA, USA (n = 7)] including time-in-range (TIR), within-day coefficient of variation (CV), and within-day standard deviation (SD) were described in Supplementary S1. 9
Statistical analysis
Data were analysed using SPSS (IBM SPSS Statistics 25, IBM Corporation, USA). Statistical significance was set at p < 0.05 for all analyses.
As CGM-derived glucose metrics were inter-correlated, we analysed the combined effect of CGM-derived glucose metrics to optimise the GV signal by employing a data-driven cluster analysis with complete data available for TIR, SD, and CV, with the number of clusters predefined to 3 in order to allocate patients to one of three classifications: low-GV, intermediate-GV, or high-GV. These glucose metrics (TIR, SD and CV) were selected by the computerised model named “Principal Component Analysis” (Supplementary S2); characteristics of each GV cluster in the final model were presented in Supplementary Figure 1. This process enables assessment of the covariance structure or interactions between CGM-derived metrics, and better captures an overall GV signature, which may otherwise be underestimated in analyses evaluating single metrics. Importantly, TIR, SD, and CV have been shown to be robust clinical indices of GV, as compared to other metrics such as mean amplitude of glucose excursion (MAGE), 10 and the combination of TIR, SD, and CV has previously been identified as suitable means for assessing GV in routine clinical practice, and for enabling comparisons with reference populations of patients with similar type, duration and level of control of HbA1c or mean glucose. 11
To compare the differences in thrombosis biomarkers within and between GV clusters a Mann–Whitney U-test was applied with further analysis by eGDR tertiles. A generalised linear regression model with gamma distribution and log link function was used to adjust relevant confounders (age, sex, diabetes duration, BMI, and HbA1c).
Results
Characteristics of the study population are presented in Supplementary Table 1 and Supplementary Figure 1. Data from 107 patients were included in this reanalysis featuring >200,000 individual glucose measurements. A data-driven cluster analysis assigned patients into low (n = 48 [45%]), intermediate (n = 40 [37%]), and high-GV clusters (n = 19 [18%]) reflecting distinct glycaemic signatures (Supplementary Figure 1). The high-GV cluster was characterised by a longer diabetes duration and lower eGDR (with higher BMI and HbA1c) compared to intermediate-GV and low-GV, respectively. Levels of thrombosis biomarkers increased in a stepwise fashion across all three GV clusters with the increase in thrombosis markers evident in the presence of low, but not high eGDR, and at an eGDR threshold of <5.1 mg/kg/min. These findings remained robust when adjusting for potential confounders (Figure 1 and Supplementary Figure 2) and when assessing the potential mediating impact of hypoglycaemia (Supplementary Figure 3). Thrombosis biomarkers by glucose variability (GV) clusters in conjunction with tertiles of estmated glucose disposal rate (eGDR). (a) tumour necrosis factor-alpha, (b) fibrinogen, (c) tissue factor activity, (d) plasminogen activators inhibitor-1. Grey boxplot eGDR <5.1 mg/kg/min, strip boxplot eGDR 5.1 to <8.7 mg/kg/min, white boxplot eGDR ≥8.7 mg/kg/min. *p < 0.05, **p < 0.01 Mann-Whiney U-test.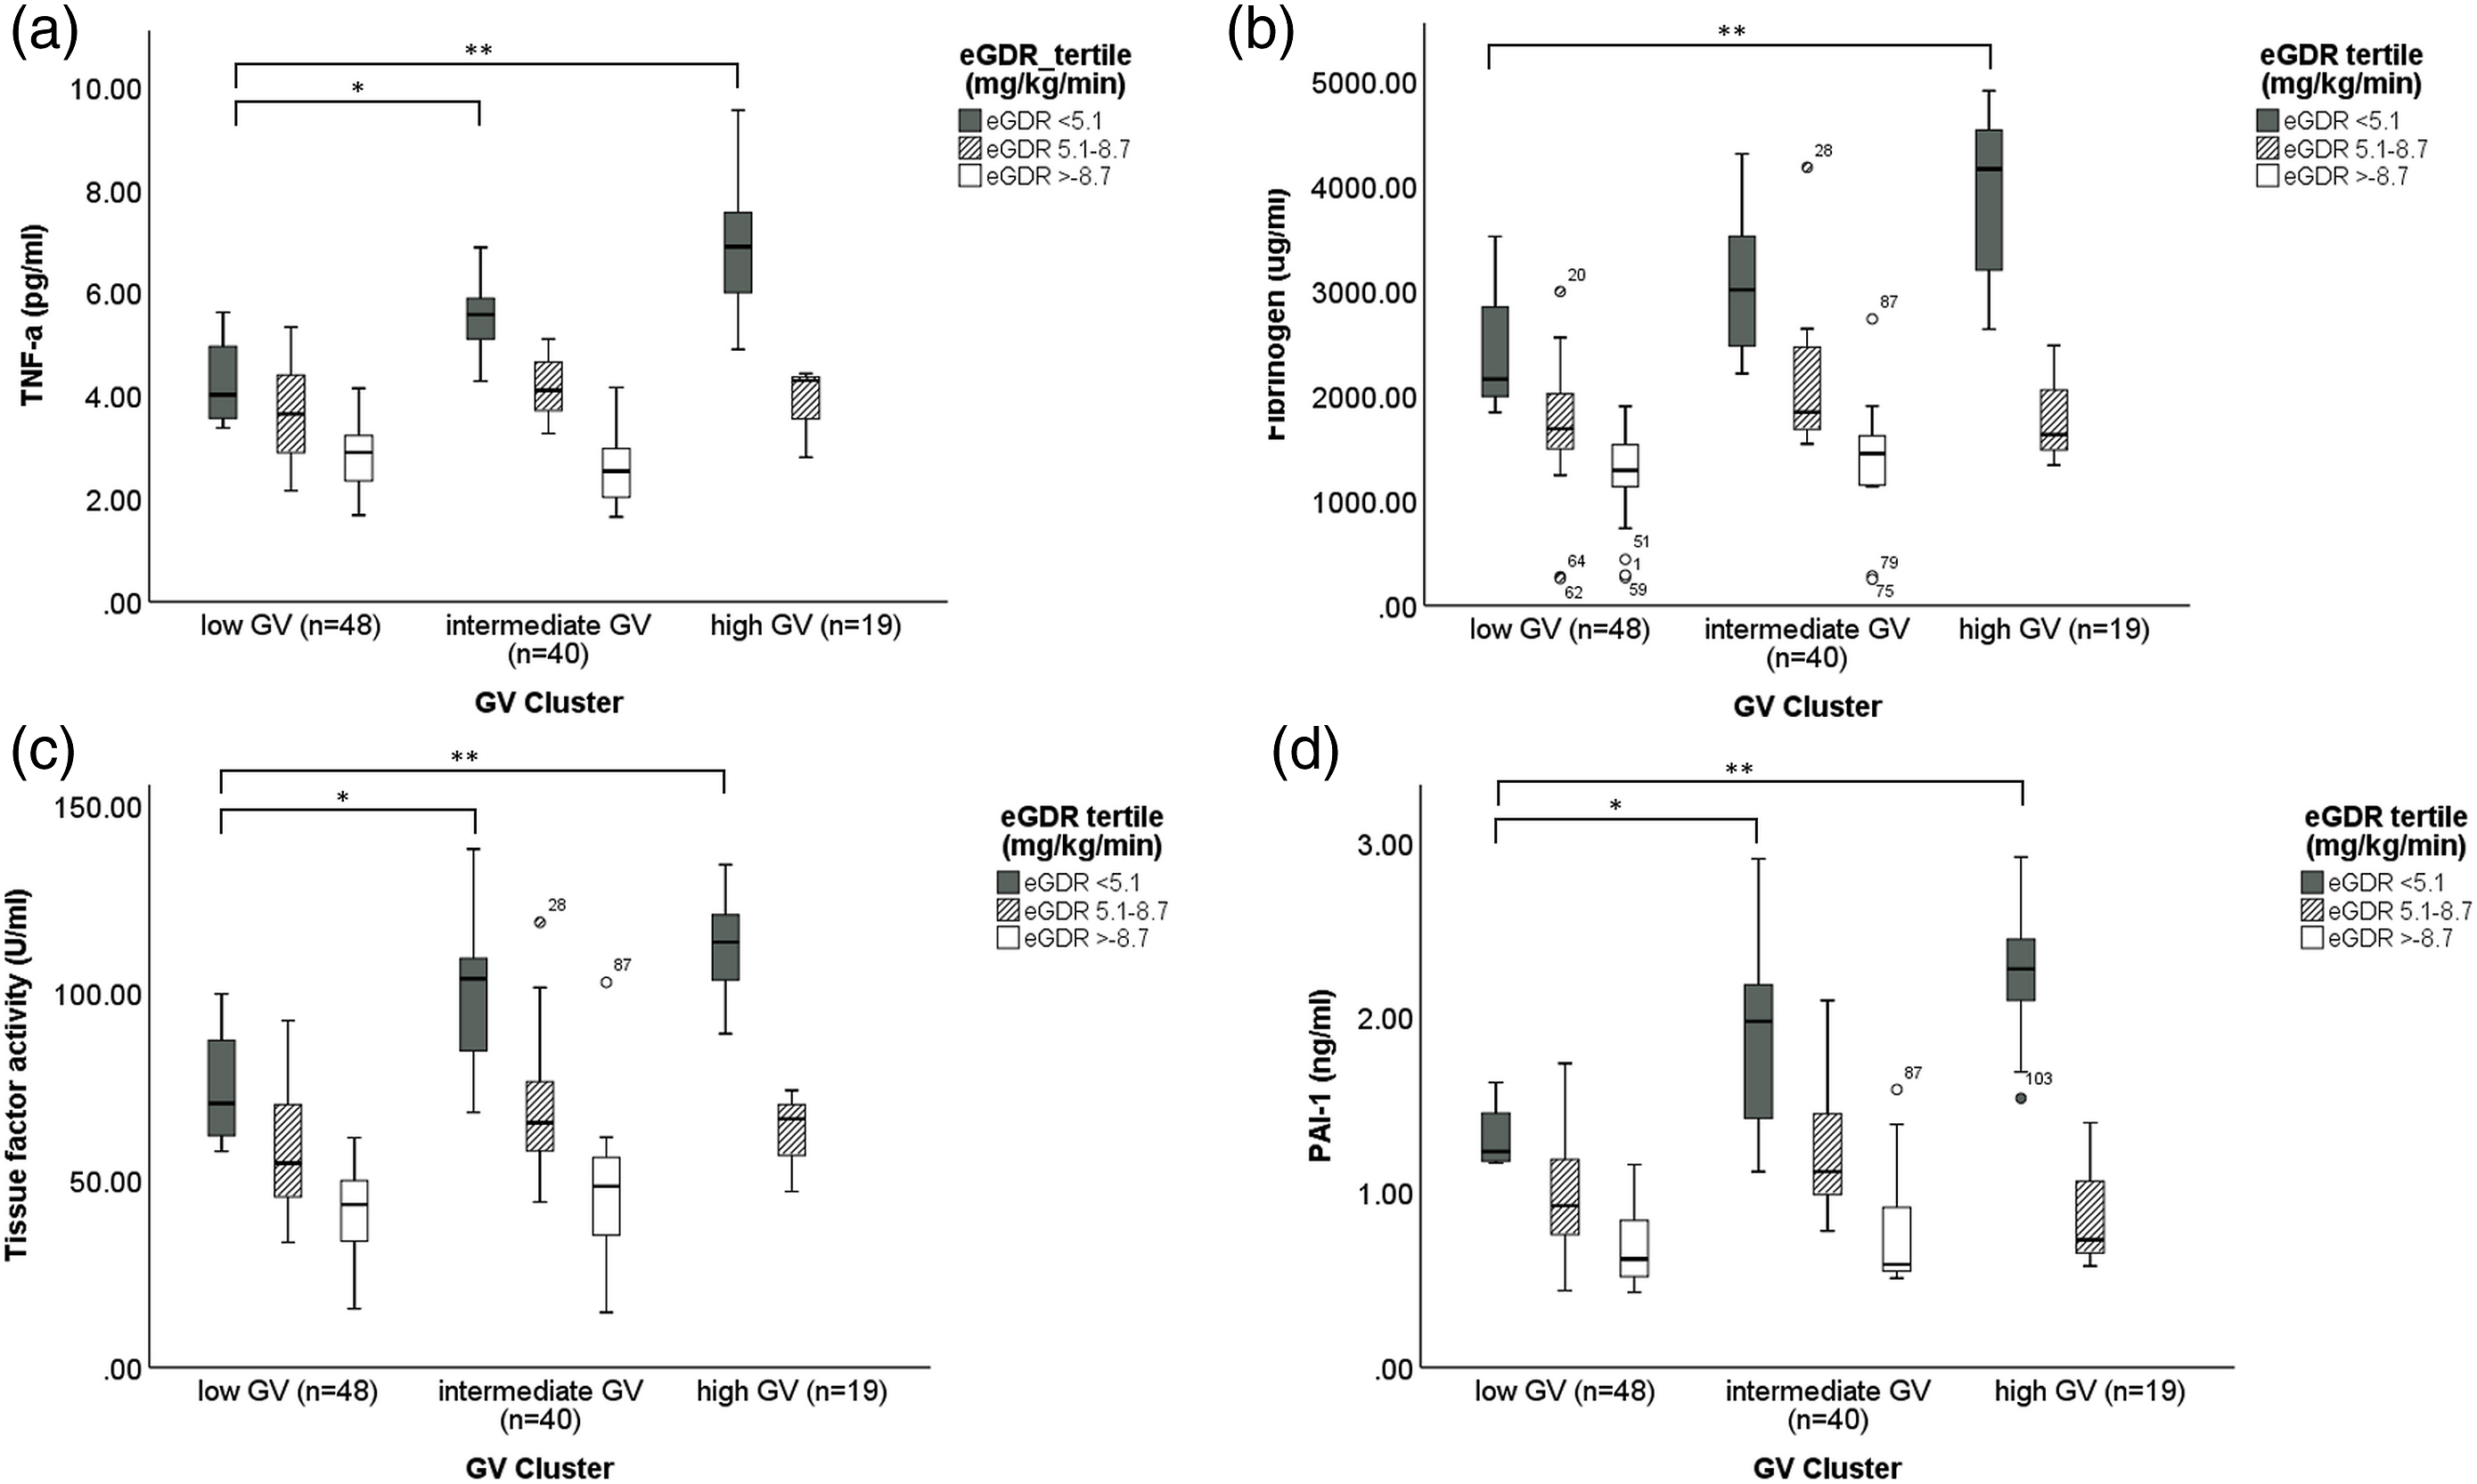
Discussion
For the first time we show that increased GV is associated with elevated levels of established vascular markers, including fibrinogen, PAI-1, TF activity and TNF-a but only when eGDR is less than 5.1 mg/kg/min. Moreover, the effects of GV on inflammatory/thrombotic markers appear to be independent of the effects of hypoglycaemia and hyperglycaemia, which is important to acknowledge given potential associations between GV and low glucose levels. 12
We postulate that the detrimental effect of GV links to the activation of oxidative stress and endothelial dysfunction. 13 Intact endothelial cells are crucial for promoting anticoagulant properties and counteracting platelet activation, thus interruption of normal endothelial function by oxidative stress leads to a procoagulant state. 14
In clinical studies, however, the adverse effect of GV in people with type 1 diabetes remains controversial. 2 Secondary analyses from the landmark DCCT and DCCT/EDIC studies failed to demonstrate a convincing relationship between short-term, self-monitoring blood glucose (SMBG)-derived GV metrics and microvascular outcomes. 15 However, this may be due to “partial” glycaemic data provided by SMBG, giving an incomplete picture of GV. However, it may also be related to the study of a newly diagnosed group of type 1 diabetes with limited prevalence of IR.
Unlike the secondary analyses from DCCT study, a number of small CGM studies have shown associations of GV with microvascular complications, including cardiac autonomic neuropathy, nocturnal heart rate variability, peripheral nerve axonal dysfunction, and retinal thickening/neurodegeneration. 2 Moreover, patients in these CGM studies tended to be older in age and have a longer diabetes duration and thus more likely to present with IR.
It is well accepted that IR is associated with a prothrombotic and proinflammatory environment, explaining elevated levels of fibrinogen and PAI-1 in individuals with T2D. 16 We have recently shown, in a small study including 32 type 1 diabetes patients, that IR, measured as eGDR, is associated with thrombo-inflammatory vascular markers. 17 These biomarkers, PAI-1 in particular, may be intermediary factors contributing to developing microvascular complications. 18 In the current study, and using a significantly larger number of type 1 diabetes individuals, we demonstrate an inverse correlation between eGDR and vascular biomarkers, irrespective of GV clusters. When the relationship between GV and these biomarkers was analysed, a clear association was found only in those with eGDR <5.1 mg/kg/min. This implies an interaction between GV, eGDR, and vascular markers, suggesting that GV in type 1 diabetes is detrimental only in the presence of IR. These finding were robust following adjusting for age and diabetes duration, indicating that our results may be independent to the length of dysglycaemic exposure.
Strengths of the current study include the number of individuals analysed and presence of complete clinical and CGM data sets; we recorded over 20,000 glucose measurements from 107 patients. Furthermore, we used a combination of widely accepted and routinely used CGM GV metrics to characterise and define individual GV “signatures.” This process enables assessment of the covariance structure or interactions between CGM-derived metrics, and better captures an overall GV signature, which may otherwise be underestimated in analyses evaluating single metrics. However, there are several limitations to acknowledge, including the use of two different CGM devices and relatively short period of CGM capture. Owing to the cross-sectional nature of the work, it was not possible to investigate the causative relationship between GV, IR, and adverse vascular markers and/or clinical outcomes.
Conclusion
Collectively, our data suggests that the independent adverse vascular effects of GV are only evident in the presence of IR in individuals with type 1 diabetes. Moreover, the relationship between GV and vascular markers is not related to hypoglycaemia. This is an important finding as the vascular effects of GV and hypoglycaemia can be difficult to disentangle given the association between these two glycaemic markers. While our data are not conclusive, they provide a solid foundation to explore the clinical longitudinal role of GV in vascular complications in insulin resistant individuals with type 1 diabetes, which may have important implications for the future glycaemic management of these patients.
Supplemental Material
Supplemental Material - Glucose variability is associated with an adverse vascular profile but only in the presence of insulin resistance in individuals with type 1 diabetes: An observational study
Supplemental Material for Glucose variability is associated with an adverse vascular profile but only in the presence of insulin resistance in individuals with type 1 diabetes: An observational study by Noppadol Kietsiriroje, Sam M Pearson, Lauren L O’Mahoney, Daniel J West, Robert AS Ariëns, Ramzi A Ajjan and Matthew D Campbell in Diabetes and Vascular Disease Research
Footnotes
Author contributions
NK, RA, and MC were responsible to design of the study, analysis of the data, and preparation the manuscript. SP, LO, DW, RA, and RA involved in manuscript preparation and revision of intellectual contents. All authors have approved the manuscript.
Declaration of conflicting interests
The author(s) declared the following potential conflicts of interest with respect to the research, authorship, and/or publication of this article: MC reports personal fees and grants from Abbott Diabetes Care, Eli Lilly and AGADA, outside the submitted work, and has a financial interest in N55Biotech Ltd. RA reports grants, personal fees and other from Abbott Diabetes Care, personal fees from AstraZeneca, personal fees from Boehringer Ingelheim, personal fees from Eli Lilly, personal fees from Menarini Pharmaceuticals, personal fees from NovoNordisk, outside the submitted work.
Funding
The author(s) disclosed receipt of the following financial support for the research, authorship, and/or publication of this article: NK was funded by the Faculty of Medicine, Prince of Songkla University, Thailand.
Data availability
The datasets generated during and/or analysed during the current study are available from the corresponding author on reasonable request.
Supplemental Material
Supplemental material for this article is available online.
References
Supplementary Material
Please find the following supplemental material available below.
For Open Access articles published under a Creative Commons License, all supplemental material carries the same license as the article it is associated with.
For non-Open Access articles published, all supplemental material carries a non-exclusive license, and permission requests for re-use of supplemental material or any part of supplemental material shall be sent directly to the copyright owner as specified in the copyright notice associated with the article.