
Abstract
Background
Trends in cardiovascular disease (CVD) risk factors and mortality have been reported among US adults with diabetes, but not among those with prediabetes. This study aimed to examine and compare the trends in CVD risk factors and mortality in US adults with diabetes and prediabetes.
Methods
In this serial, cross-sectional study, medical records of prediabetic patients from the National Health and Nutrition Examination Survey (NHANES) among adults aged 18 years or older were retrospectively reviewed.
Results
Data on 17,193 individuals including 7803 with diabetes and 9390 with prediabetes were analyzed from 1999–2000 to 2017–2018. A similar non-linear trend in the mean blood pressure (p = .991) and plasma fasting glucose (p = .068) was observed among the population with diabetes and prediabetes. The mean hemoglobin A1c decreased from 7.5% to 7.1% in diabetes and the trend was different from that in prediabetes (p = .004). Among both groups, a significant decline in the mean total cholesterol was identified while there was a difference in the trend (p = .003). The prevalence of hypertension remained largely the same for diabetes and it declined from 59.8% to 48.8% for prediabetes (p = .044). The prevalence of dyslipidemia increased from 40.4% to 53.5% in diabetes and it remained stable for prediabetes. The all-cause mortality decreased from 148.2 to 93.6 per 10,000 person-years between 1999–2006 and 2007–2014 in prediabetes and heart diseases mortality remained unchanged.
Conclusion
In the US from 1999 to 2018, the adults with prediabetes had different secular trends in the mean hemoglobin A1c and the prevalence of hypertension and dyslipidemia compared to those with diabetes. There was a significant reduction in all-cause mortality from 1999 to 2014 for the population with prediabetes. However, heart diseases mortality remained stable among them.
Introduction
The decrease in cardiovascular disease (CVD) mortality rates is a major public health success in the United States (US) over the last several decades. 1 This has been attributed to the control of CVD risk factors such as smoking and cholesterol levels and advances in healthcare management. However, CVD mortality remains to be the leading cause of death in the US. 2 Recent evidence also shows that the rate of CVD mortality flattened while the total number of death from CVD increased among the US general population in the last decade.2,3 The reasons for this deceleration in the decline of CV mortality are not fully clarified.
cardiovascular disease closely relates to diabetes and common conditions coexisting with them (such as hypertension and dyslipidemia) are clear risk factors for CVD. Populations with diabetes have increased rates of cardiovascular burdens and mortality.4,5 Numerous studies have shown the efficacy of aggressive management of CVD risk factors in preventing and slowing CVD in people with diabetes. Along with the improved quality of diabetes care, a significant reduction in all-cause and CVD mortality was observed among the US population with diagnosed diabetes between 1988 to 2015.6,7
The prelude to diabetes is prediabetes and it can be described as a continuum from normoglycemia through worsening dysglycemia. It is estimated that nearly 34.5% of all US adults aged 18 years older had prediabetes in 2013–2016 in the US. 8 Recent evidence suggested that adults with prediabetes have a higher prevalence of CVD burdens than those with normal glycaemic status. 9 As a high-risk metabolic state for diabetes, prediabetes has also been proven to be associated with increased risk of all-cause and CVD mortality. 10 However, no national studies of mortality trends in prediabetes are available, leaving the question of whether the control of CVD risk factors in this population has improved over the past decades.
To address these knowledge gaps, we analyzed the nationally representative data from the National Health and Nutrition Examination Surveys (NHANES) between 1999–2018 to examine and compare the trends in CVD risk factors and mortality in adults with diabetes and prediabetes over time.
Methods
Data source
The NHANES is a series of nationally representative, cross-sectional studies designed to be representative of the US civilian, noninstitutionalized population. 11 It was conducted by the National Center for Health Statistics of the Centers for Disease Control and Prevention. Participants are selected with the use of a complex, stratified, multistage probability-cluster sampling design for in-home interviews and visits to a mobile examination center. The design and methods of the NHANES have been described elsewhere. 12 The data from NHANES are publicly available to researchers around the world. We used data from the ten 2-years NHANES survey cycles conducted between 1999–2000 to 2017–2018. The National Center for Health Statistics approved the study protocols and written informed consent was obtained from each participant.
Data collection
This study aims to evaluate cardiovascular burdens. We selected the available variables from the NHANES which are related to cardiovascular burdens according to the literature.4,9,13,14
During the in-home interview, a standardized questionnaire was used to collect demographic and health-related information.11,12 Smoking status was self-reported based on responses to questionnaires regarding whether a participant was currently smoking or not. Medical history and medication were accessed during the interview. Participants were asked if they have ever been diagnosed with diabetes by a “doctor or other health professionals”. History of CVD including congestive heart failure, angina, myocardial infarction, or stroke was ascertained by self-report.
During the examination, weight, height, and waist circumference were measured. The body mass index (BMI) was calculated as weight in kilograms divided by height in meters squared and the waist-to-height ratio was calculated waist circumference divided by height. Blood pressure (BP) was measured by trained staff after the participant rested quietly in a seated position for at least 5 min. Mean BP was calculated as the mean of three or four readings according to the standardized protocol. Blood samples were collected at the mobile examination center and tested at the central laboratories for the measurement of hemoglobin A1c and total cholesterol. Although different equipment was used for the measurement of hemoglobin A1c over time, calibration is unnecessary according to the recommendations from NHANES. 15 Fasting plasma glucose (FPG) was only available in a subsample of survey participants after fasting for 8–24 h.
Diagnosed diabetes was defined as having a self-reported previous diabetes diagnosis; undiagnosed diabetes as a hemoglobin A1c value ≥6.5% or an FPG value ≥126 mg/dL among those without diagnosed diabetes; diabetes as either diagnosed or undiagnosed diabetes. Prediabetes was defined as a hemoglobin A1c value of 5.7–6.4% or an FPG value of 100–125 mg/dL among participants without diabetes and with both hemoglobin A1c and FPG values available. 16 Hypertension was defined as the self-reported use of antihypertensive medications, systolic BP ≥130 mmHg or diastolic BP ≥80 mmHg; dyslipidemia as the self-reported use of lipid-lowering medications, or total cholesterol ≥240 mg/dL.
Ascertain of mortality
Mortality data of NHANES 1999–2014 were ascertained by linkage to the National Death Index through 31 December 2015. The ICD-10 was used to determine disease-specific death. According to the Codebook for the 2015 Public-Use Linked Mortality File, CVD mortality included mortality of heart diseases and cerebrovascular diseases. 17 Given that mortality of cerebrovascular diseases was only available for NHANES 1999–2006, we investigate the trends in all-cause and heart diseases mortality in the current study.
Statistical analysis
Statistical analysis was conducted in R version 4.1.0 with the “Survey” package after accounting for the complex sampling design. 18 To enable nationally representative estimation, we used the interview sampling weights for participants with diagnosed diabetes and the fasting sampling weights for adults without diagnosed diabetes so that the sum of sampling weights was added to the total US population. 19 For each variable, participants with missing values were excluded from the analysis. All statistical tests were 2-sided, and p < 0.05 was considered statistically significant.
In the estimation of the prevalence of and trends in CVD risk factors among participants with diabetes and prediabetes, we pooled survey years into 4-years intervals (1999–2002, 2003–2006, 2007–2010, 2011–2014, and 2015–2018) to minimize the effects of small sample size and improve the precision of estimation. The age-standardized summary statistics were computed using the direct standardization methods to the 2000 US population with the following three categories: 18–44 years old, 45–64 years old, and 65 or more years. Means were estimated for continuous variables and prevalence for categorical variables. Linear or nonlinear secular trends were tested by linear regression (continuous variables) or logistic regression (dichotomized variables) with recoded pooled survey cycles (1–5) as a continuous variable. The nonlinearity of the trend was tested by adding a quadratic term or a logarithmic term into the regression model. We tested both the linear and nonlinear trend since the trend of some variables might be nonlinear. The p-value for the difference in secular trends among the population with diabetes and prediabetes was tested by adding an interaction term between survey cycles and diabetes status.
In the estimate of trends in mortality, we first pooled survey years into 8-years intervals due to the low all-cause and heart diseases mortality rate and we compared the difference in the mortality rate directly between 1999–2006 and 2007–2014. Considering that participants in 2011–2012 and 2013–2014 were only followed for a short period, we also compared the difference in mortality rate between 1999–2004 and 2005–2010. To minimize bias from differential follow-up, we limited follow-up to 10 years. Age-standardized mortality rates per 10,000 person-years were calculated. The number of person-years of follow-up time was calculated from the time of entry into the study until the date of death or the termination day of follow-up. Poisson regression was used to examine differences in rates across periods after adjusting for age, sex, and race. Furthermore, subgroup analyses by age (18–44 years old, 45–64 years old, and 65 or more years), sex (men and women), and race (Hispanic, non-Hispanic White, and non-Hispanic Black) were conducted.
Results
Cardiovascular disease risk factors burdens among US adults with diabetes and prediabetes, NHANES 1999–2018.

All the values in the bracket (except for the No of missing cases and rate of change or odds ratio) represent standard error.
Bold font of the p values represents statistical significance.
BMI: body mass index; CVD: cardiovascular disease; NHANES: National health and nutrition examination survey.
aTested by adding an interaction term between survey cycles and diabetes status into the linear or logistic mode.
bTested for non-linear trend by adding a quadratic term into the linear or logistic model.
The mean systolic BP decreased from 133.9 mmHg in 1999–2002 to 129.0 mmHg in 2007–2010, then increased to 131.1 mmHg in 2015–2018 for participants with diabetes. A similar non-linear secular trend was observed for those with prediabetes (p for interaction: 0.991). For the population with diabetes, the mean hemoglobin A1c decreased from 7.5% to 7.1% between 1999–2002 and 2015–2018. A different trend in the mean hemoglobin A1c was observed for the population with prediabetes (p for interaction: <0.01). Similar non-linear changes in the mean PFG were observed in the population with diabetes and prediabetes (p for interaction: 0.068). Among both groups, a significant decline in the mean total cholesterol was identified while there was a difference in the trend (p for interaction: <0.01). The prevalence of hypertension remained largely the same from 1999–2002 to 2015–2018 for the population with diabetes and it declined from 59.8% to 48.8% during the same period for those with prediabetes (p for interaction: <0.01). Conversely, the prevalence of dyslipidemia increased from 40.4% in 1999–2000 to 53.5% in 2015–2018 for people with diabetes and it remained stable for those with prediabetes (p for interaction: <0.01). The reported history of CVD remained generally constant across time in both groups (p for interaction: 0.991).
Difference in all-cause and heart diseases mortality among the US adults with diabetes and prediabetes between 1999–2006 and 2007–2014.
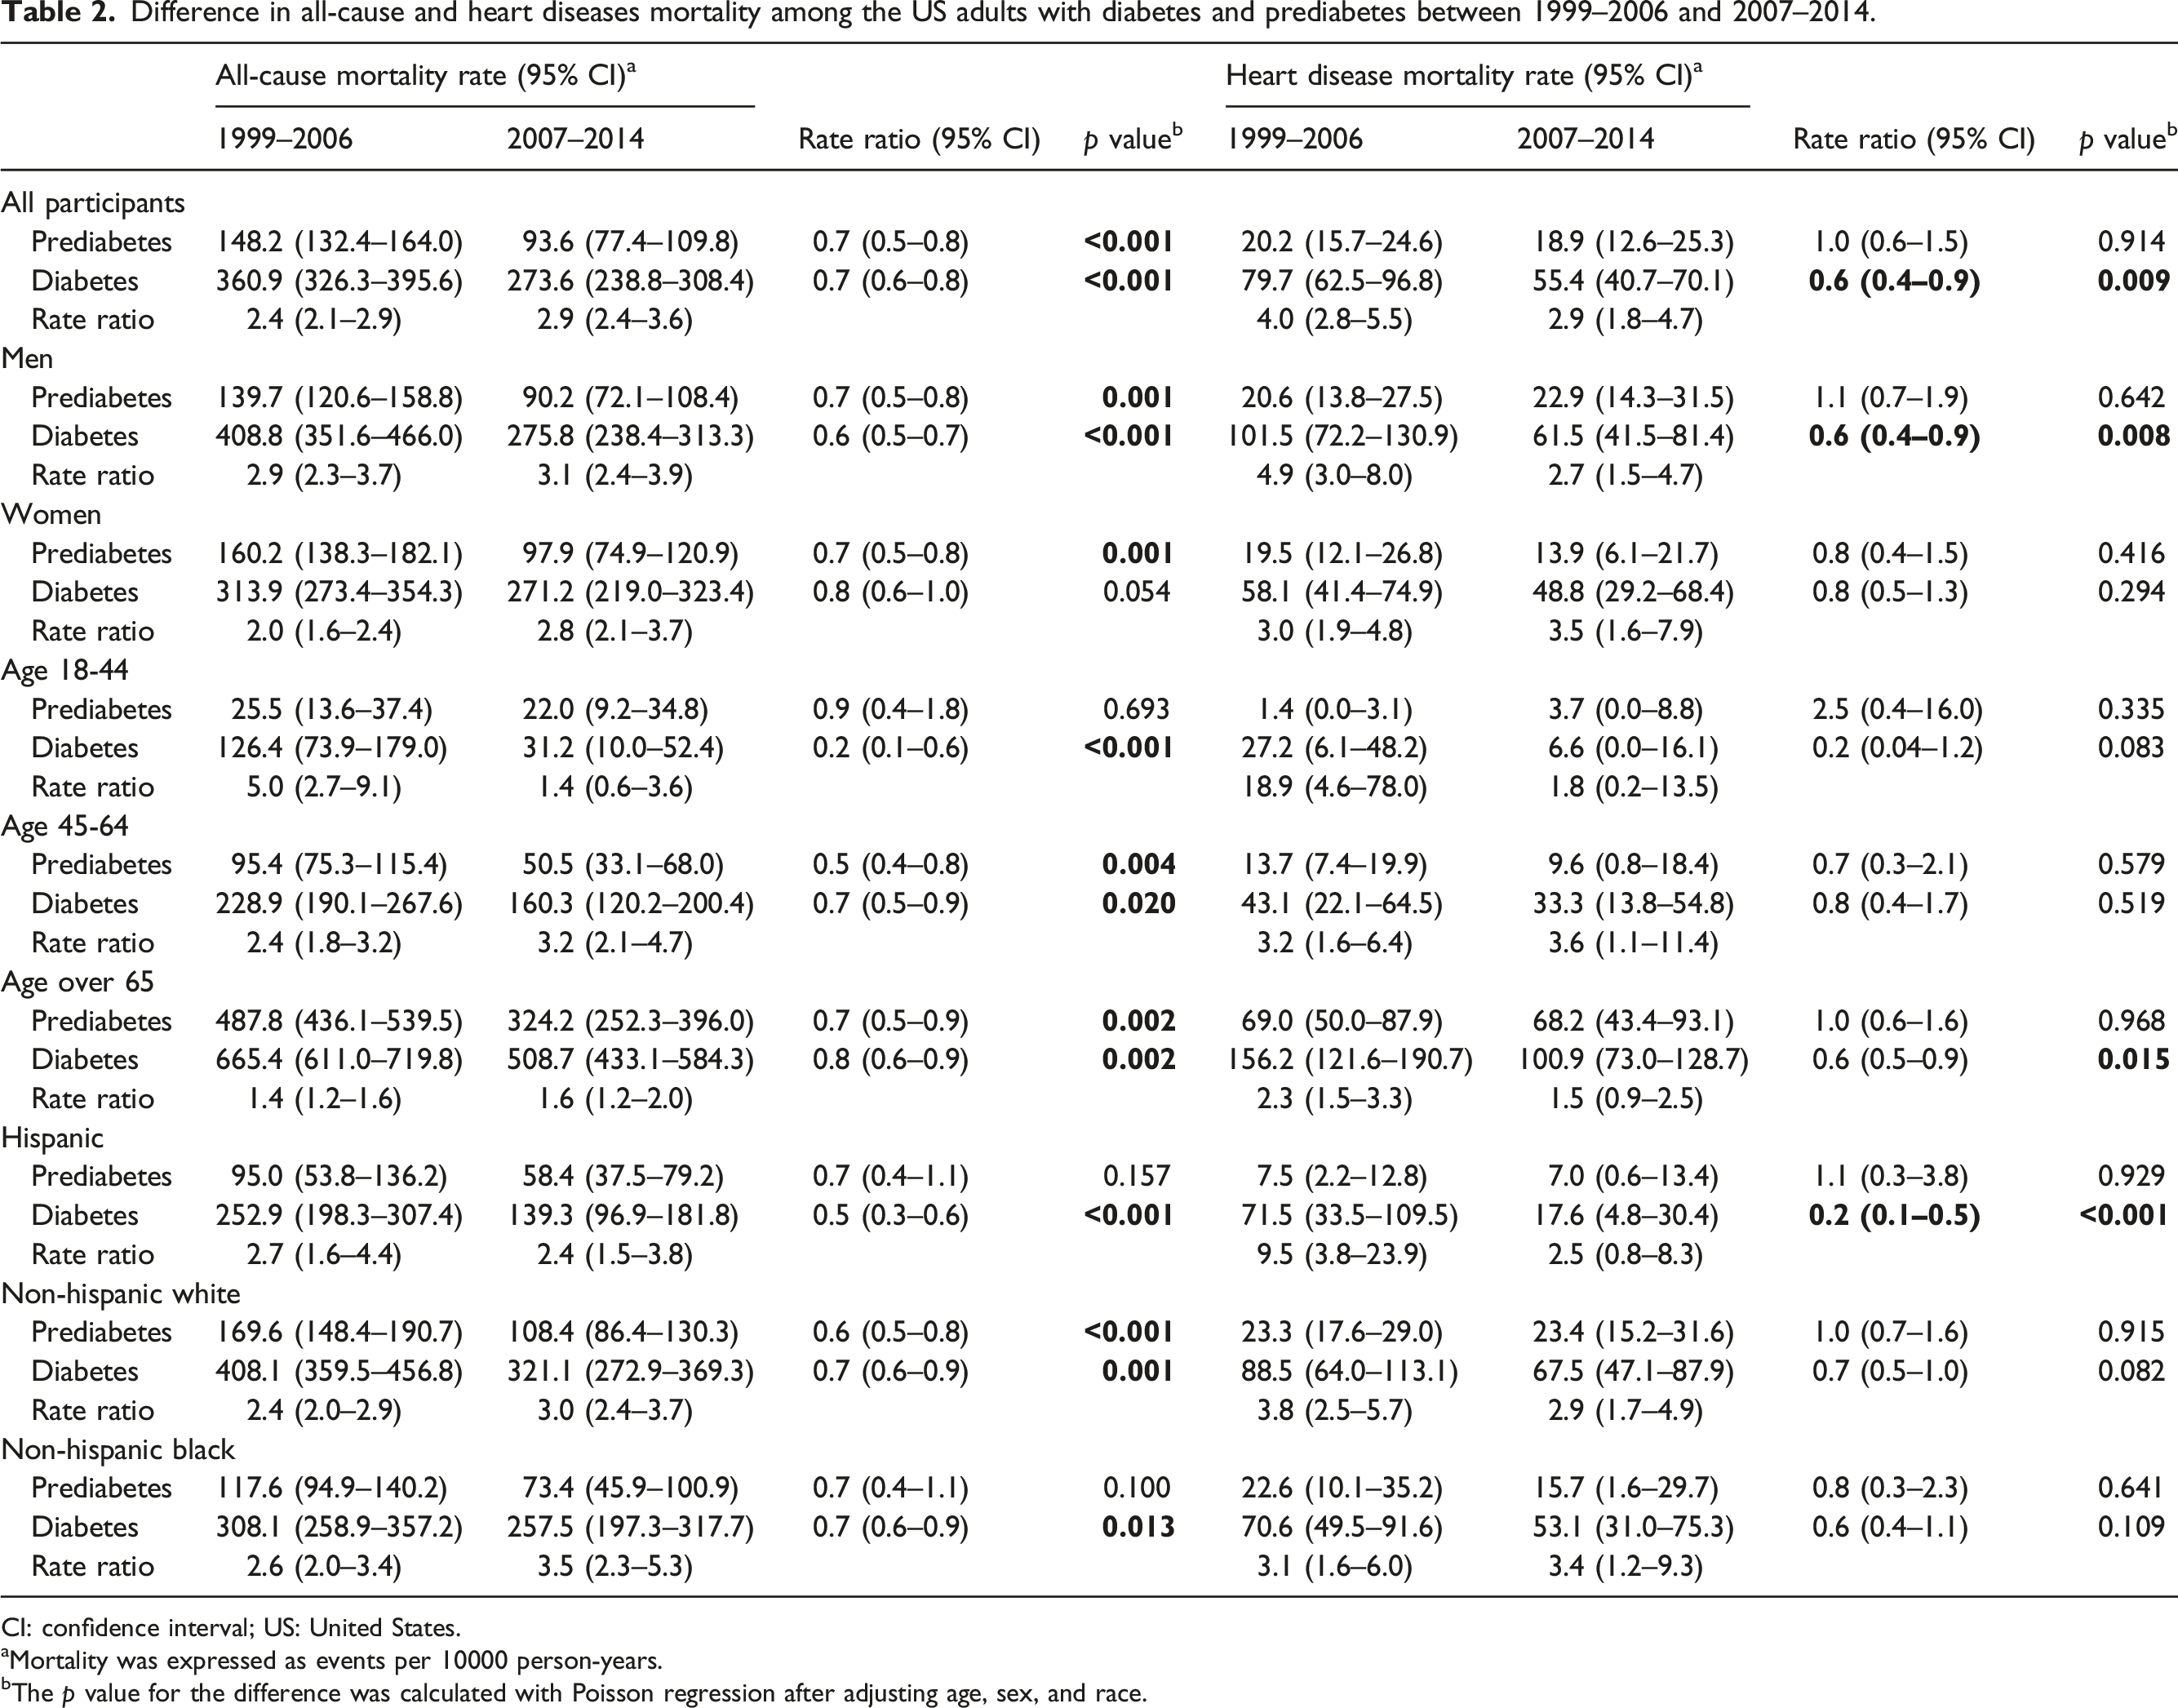
CI: confidence interval; US: United States.
aMortality was expressed as events per 10000 person-years.
bThe p value for the difference was calculated with Poisson regression after adjusting age, sex, and race.
Comparisons between p values for trend with 4-years and 2-years interval.
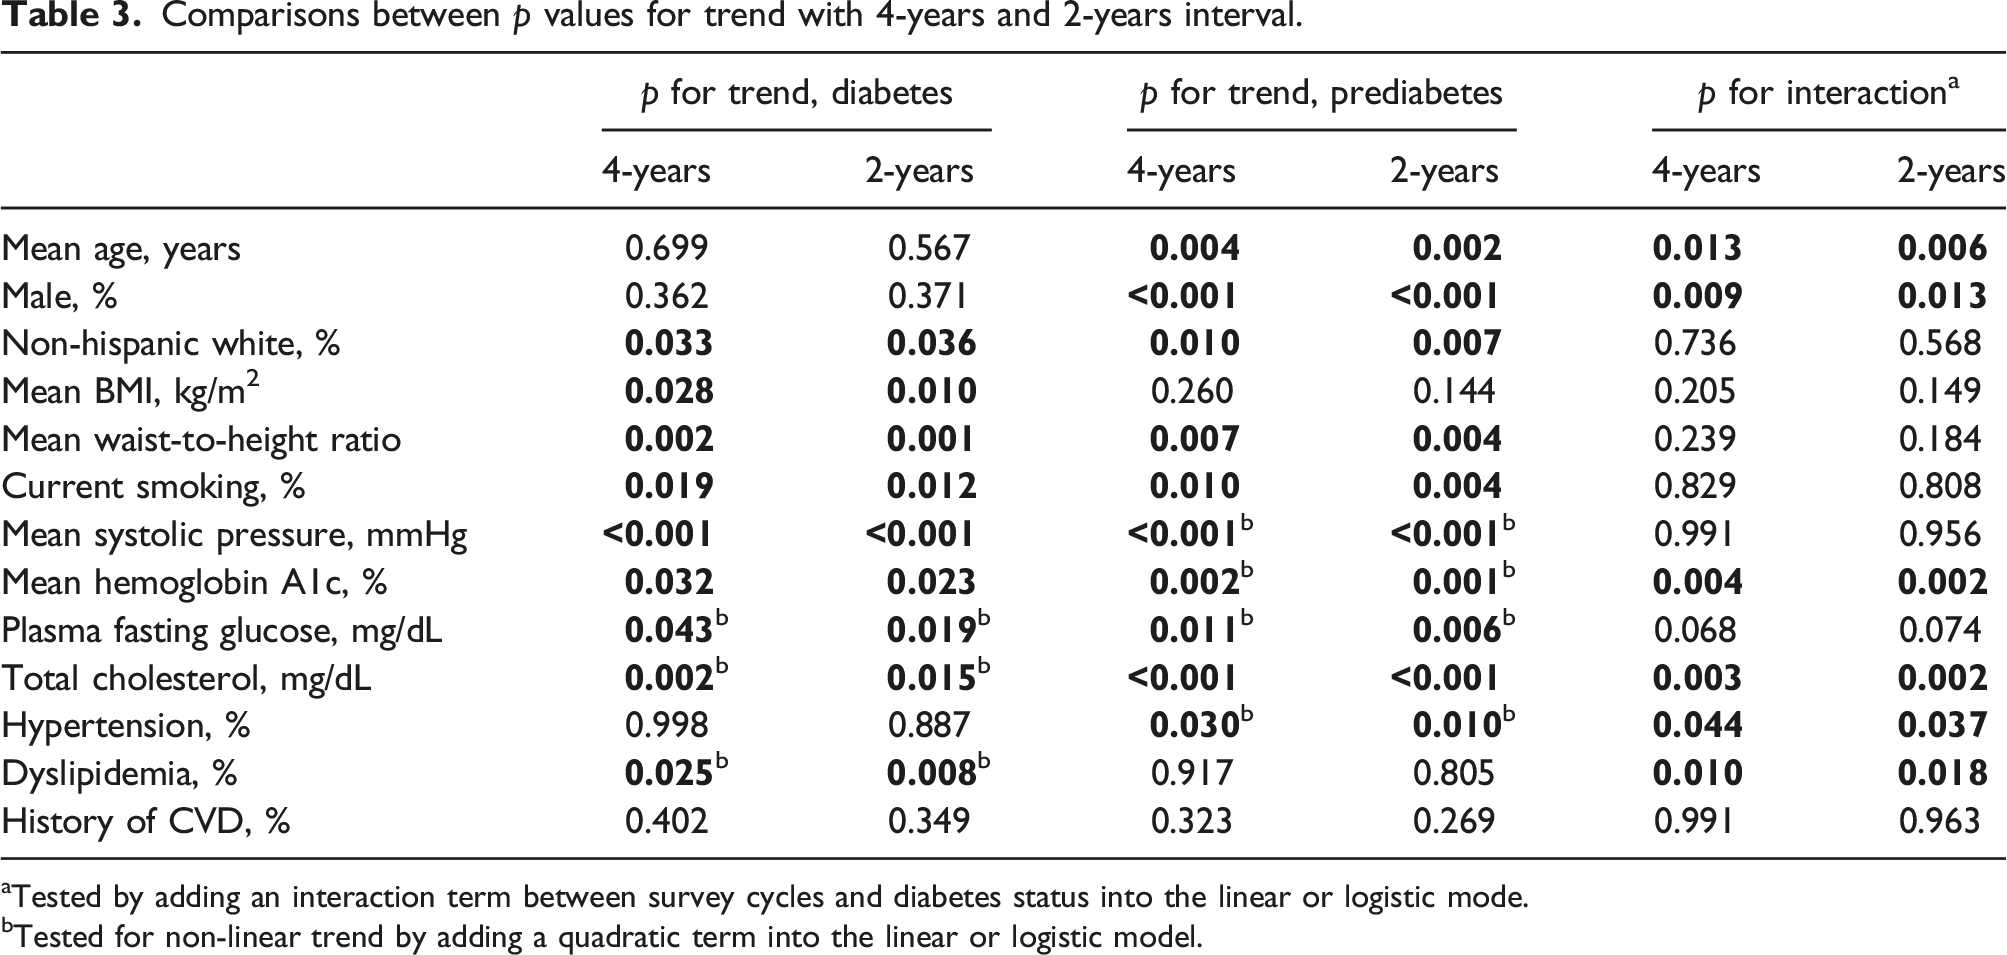
aTested by adding an interaction term between survey cycles and diabetes status into the linear or logistic mode.
bTested for non-linear trend by adding a quadratic term into the linear or logistic model.
When limited the survey to 1999 and 2010, there was also a significant decline in all-cause and heart diseases mortality among participants with diabetes from 1999–2004 to 2005–2010. For those with prediabetes, the all-cause mortality declined while the heart diseases mortality remained largely stable across the same period (Figure 1). Difference in all-cause and heart diseases mortality among the US adults with diabetes and prediabetes between 1999–2004 and 2005–2010. RR: Rate ratio; CI: Confidence interval.
Discussion
The prevalence and absolute numbers of people with diabetes and prediabetes in the US grew substantially over the last two decades, 8 making it an increasing health and economic burden. Reducing the CVD burden in diabetes is a major clinical imperative that should be prioritized since large benefits are witnessed when multiple CVD risk factors are addressed at the same time.20,21 For prevention and management of CVD, risk factors including obesity, hypertension, dyslipidemia, and smoking should be systematically assessed in diabetes. 22 The observations described in this nationally representative study of the US population from 1999–2000 to 2017–2018 offer a mix of welcome and troublesome findings. While a decrease in the rate of current smoke and mean total cholesterol was observed in the population with diabetes and prediabetes, the mean BMI and waist-to-height ratio increased and the prevalence of CVD remained stable among both groups. There were significant differences in the secular trends in the mean hemoglobin A1c and the prevalence of hypertension and dyslipidemia for the population with diabetes and prediabetes. Furthermore, consistent with previous studies,23,24 it seems like the decline in the BP and glycemic among the population with diabetes and prediabetes plateaued or even increased after a decade of progress in risk factor control from 1999 to 2010. These findings of secular trends in cardiovascular burdens might be a public health concern.
Our study found that all-cause and heart diseases mortality continues to decrease after 2000 in individuals with diabetes. This result was consistent with the epidemiological analysis using data from the National Health Interview Survey Linked Mortality files in which all-cause death rates declined by 20% every 10 years among US adults with diabetes. 7 A significant decline in the death rates from heart diseases was also identified in this study. Another similar study reported the trends in CVD mortality using the same data and the 10-years relative changes in mortality were significant for major CVD but not for the death of heart failure and arrhythmia. 25 However, unlike the current study in which the diabetes status was ascertained by both self-reported diagnosis and hemoglobin A1c and FPG values, these two studies relied on the self-reported diagnosis alone and the potential effects of undiagnosed diabetes on mortality were neglected.
To the best of our knowledge, the trends in mortality among participants with prediabetes have not been described in a nationally representative sample of the US. We found that between 1999–2006 and 2007–2014, there was a statistically significant decrease in all-cause mortality after adjusting for age, sex, and race. A similar trend was observed between 1999–2004 and 2005–2010. However, for heart diseases mortality, we didn’t find any evidence of decline across the periods. There are concerns about the current diagnostic thresholds for prediabetes which might be too low and labeling people as having prediabetes would lead to a medicalization of the condition. 26 However, a recent study has suggested that CVD burdens are highly prevalent in adults with prediabetes regardless of the different definitions used. 9 Early identification of individuals with prediabetes might increase the opportunity for CVD burdens and thus reduce the rate of mortality.
There are sex differences in the trends of all-cause and heart diseases mortality among the population with diabetes. A statistically significant reduction in mortality was observed only in men. This result was consistent with the previous finding in which neither all-cause nor CVD mortality declined between 1971 to 1986 and 1988–2000. Factors including less aggressive medical management, differences in the pathophysiology of coronary heart disease, or differences in inflammatory and hormonal responses to CVD risk factors might lead to the sex difference in the mortality trend, and the lack of improvement among females remains to be a concern. 6
The limitation of this study should be noted. First, this is a cross-sectional design. Even though successive surveys were used, they only reflected the profile of the population at the time of the survey. This design limits our ability to truly assess longitudinal associations between diabetes/prediabetes and excess CVD risk factors. Nevertheless, our study provided useful information about the prevalence and trends in CVD risk factors for US adults with diabetes and prediabetes. Second, the prediabetes in this study was defined by PFG and hemoglobin A1c, but not 2-h postprandial glucose concentrations since it’s challenging to collect these samples in a large epidemiological study. Another limitation was the relatively small samples in certain subgroups, which resulted in wide confidence intervals and therefore the point estimates should be interpreted with caution. Last, multiple statistical tests are performed in this study and the probability of finding at least one of them to be statistically significant just by chance might increase. However, we did not account for the problem of multiplicity during the statistical tests since there was currently no consensus on the need for multiplicity adjustment.27,28
Footnotes
Declaration of conflicting interests
The author(s) declared no potential conflicts of interest with respect to the research, authorship, and/or publication of this article.
Funding
The author(s) received no financial support for the research, authorship, and/or publication of this article.