
Abstract
The aim of this study was to test the hypothesis that cardiovascular disease occurs to the greatest extent in persons with prediabetes mellitus who are also insulin resistant. In 2003, 664 non-diabetic women (n = 457) and men (n = 207), aged 52 ± 16 and 53 ± 15 years, were surveyed during a programme for cardiovascular disease prevention. Fasting plasma glucose concentrations defined participants as having normal fasting plasma glucose (fasting plasma glucose <5.6 mmol/L) or prediabetes mellitus (fasting plasma glucose ⩾5.6 and <7.0 mmol/L). The tertile of prediabetes mellitus subjects with the highest fasting plasma insulin concentration was classified as insulin resistant. Baseline cardiovascular disease risk factors were accentuated in prediabetes mellitus versus normal fasting glucose, particularly in prediabetes mellitus/insulin resistant. In 2012, 86% of the sample were surveyed again, and the crude incidence for cardiovascular disease was higher in subjects with prediabetes mellitus versus normal fasting glucose (13.7 vs 6.0/100 persons/10 years; age- and sex-adjusted hazard ratio = 1.88, p = 0.052). In prediabetes mellitus, the crude incidences were 22.9 versus 9.6/100 persons/10 years in insulin resistant versus non-insulin resistant persons (age- and sex-adjusted hazard ratio = 2.36, p = 0.040). In conclusion, cardiovascular disease risk was accentuated in prediabetes mellitus/insulin resistant individuals, with a relative risk approximately twice as high compared to prediabetes mellitus/non-insulin resistant subjects.
Introduction
Uncertainty exists concerning the role of prediabetes mellitus (PreDM) as a risk factor for cardiovascular disease (CVD). Authors of the United States Preventive Services Task Force 1 concluded that prior to the development of diabetes, ‘no study consistently found that elevated fasting glucose level could predict coronary heart disease (CHD) events’. Similarly, results of a population-based prospective study 2 found that hazard ratios (HRs) for CHD risk ‘were generally modest and non-significant across tenths of glucose values below 7.0 mmol/L’. Consistent with these observations were the findings of Steele et al. 3 that the prevalence of macrovascular disease in individuals with ‘glucokinase mutations and prolonged hyperglycemia’ was no different than in a control population and lower when compared to ‘young-onset patients with type 2 diabetes’. In addition, patients with glucokinase mutations had lower blood pressure (BP) and triglyceride (TG) concentrations and higher concentrations of high-density lipoprotein cholesterol (HDL-C) as compared to patients with diabetes, leading to the conclusion ‘that isolated hyperglycemia is rarely associated with macrovascular disease’. In contrast, results of the Emerging Risk Factors Collaboration 4 analysis of published studies indicated that vascular disease was increased when fasting plasma glucose (FPG) concentration was ⩾5.6 mmol/L. However, they concluded that in people ‘without history of diabetes, information about fasting blood glucose concentration or impaired fasting glucose did not significantly improve metrics of vascular disease prediction when added to information about several conventional risk factors’. In this context, Faerch et al. 5 indicated that insulin resistance as quantified by the hyperinsulinemic, euglycemic clamp was independently related to Framingham risk score in non-diabetic individuals, whereas this was not true of either fasting or post-oral glucose challenge glucose concentrations. These findings led them to conclude, ‘the association between plasma glucose levels and CVD risk is mainly explained by insulin resistance’. The ‘several conventional risk factors’ referred to by the Emerging Risk Factors Collaboration 4 include the metabolic abnormalities associated with insulin resistance. 6 Thus, the observations by Steele et al., 3 the Emerging Risk Factors Collaboration 4 and those of Faerch et al. 5 can be subsumed under one pathophysiological umbrella. Specifically, a mild elevation of FPG, per se, has relatively little adverse effect on macrovascular disease, but the combination of glucose intolerance, insulin resistance and the abnormalities associated with this defect in insulin action 6 will lead to increased CVD. Our analysis was initiated to test this formulation and involved a prospective study comparing CVD risk and outcome in subjects with normal fasting glucose (NFG) concentrations versus individuals with PreDM, with a subsequent comparison of persons with PreDM, subdivided into insulin resistant (IR) and non-IR subgroups.
Methods
A prospective epidemiological study of cardio-metabolic risk factors was conducted between October 2003 and February 2012 in Rauch City, province of Buenos Aires. This city lies in the center-southeast region of the province of Buenos Aires, with an annual average temperature of 13.8°C, and has an economy based on agriculture and livestock production. The region had a substantial influx of immigrants primarily from Spain and Italy throughout the 19th and 20th centuries. Consequently, the vast majority of its inhabitants are of European ancestry, with individuals of African and Asian ethnicity comprising a small minority of the population. There is undoubtedly some genetic admixture between subjects of European ancestry and Amerindian. Although there are no quantitative data concerning the genetic admixture in Rauch, we can assume that it is comparable to that observed in the city of Buenos Aires. In a study performed in Buenos Aires in the year 2006, using eight erythrocyte genetic systems and GM/KM allotypes, the contributions to the genetic admixture were European, 79.9%; Amerindian, 15.8%; and African, 4.3%. 7 According to the National Census available at the moment of the survey, there were 13,909 inhabitants in the urban area of Rauch City, 8246 of whom were aged ⩾15 years (4166 men and 4080 women) in 2003 when the survey was initiated. Permission to perform these studies was provided by the relevant health authorities who approved the programme, all participants gave written informed consent and data anonymity was guaranteed; 1308 individuals (855 women, aged 51 ± 17 years and 453 men, aged 52 ± 16 years) aged between 15 and 80 years were randomly selected to take part in the survey. A total of 76% were homeowners; 1.2% of the population was illiterate, while the percentages with a level of education of incomplete primary, complete primary, incomplete secondary, complete secondary, tertiary or incomplete university and complete university level were 16.5%, 37.4%, 17.5%, 9.4%, 5.2% and 12.7%, respectively. Thus, ~17% of the sample had less than 7 years of formal education. The average alcohol intake was 163 ± 10 and 25 ± 42 g/week for men and women, respectively. The sample had a high prevalence of hypertension (43.20% in men and 28.50% in women) and obesity–overweight status (54.81% in men and 44.65% in women). 8
Methods used to measure experimental variables have been previously published.8,9 In brief, BP was measured sitting, after a minimum resting period of 5 min, using a mercury sphygmomanometer. Phase I and V Korotkoff sounds were used to identify systolic BP (SBP) and diastolic BP (DBP), respectively; SBP and DBP values were an average of three different measurements separated by 2 min from one another. Weight was determined with individuals wearing light clothes and no shoes, height was measured without shoes using a metallic metric tape and waist circumference (WC) was measured with a relaxed abdomen using a metallic metric tape on a horizontal plane above the iliac crest. Body mass index (BMI) was calculated using the formula weight (kg)/height2 (m). Concentrations of FPG, fasting plasma insulin (FPI), TG, total cholesterol and HDL-C were determined after an overnight (12 h) fast. Low-density lipoprotein cholesterol (LDL-C) levels were estimated by the Friedewald formula. 10 FPI concentrations were determined using an immunoradiometric assay, with two monoclonal antibodies against two different epitopes of the insulin molecule. The inter- and intra-assay coefficients of variation were 8.0% and 3.8%, respectively, with the lowest detectable level being 1.4 pmol/L. The homeostasis model assessment of insulin resistance (HOMA-IR) was calculated with the formula [(insulin (µU/mL) × glucose (mmol/L))/22.5]. 11 Personal information and self-reported medicine intakes were included in the epidemiological chart.
A total of 756 individuals had both FPG and FPI measurements (505 women, aged 53 ± 16 years and 251 men, aged 54 ± 15 years, p = 0.495). Individuals whose FPG concentrations were ⩾7.0 mmol/L, or receiving treatment with antidiabetic drugs (n = 61), were excluded from the analysis.
FPG concentrations were used to classify participants as having NFG (FPG <5.6 mmol/L) or PreDM (FPG ⩾5.6 and <7.0 mmol/L). At baseline, 425 individuals were classified as having NFG, whereas 270 individuals were classified as PreDM; 31 individuals were excluded because they did not have a complete lipid profile. The remaining 664 (457 women, aged 52 ± 16 years and 207 men, aged 53 ± 15 years, p = 0.516, 413 NFG and 251 PreDM) were included in the current analysis.
FPI concentrations were used to further subdivide subjects into IR and non-IR subgroups, with insulin resistance defined as being in the highest tertile of FPI concentrations in the PreDM group. The decision to identify the tertile with the highest FPI concentration as IR was based on the results of two prospective studies showing that the third of a non-diabetic population with the highest insulin concentration developed significantly more CVD.12,13 Although the homeostasis model of insulin resistance (HOMA-IR) was also calculated and presented, it was not used to classify individuals as IR or non-IR. FPG concentration is one of the two variables used to calculate HOMA-IR, and since FPG was the cut-point separating NFG from PreDM its use to also define IR status seemed inappropriate. Second, Abbasi et al. 14 have shown that values of HOMA-IR and FPI are almost perfectly correlated in non-diabetic individuals (r = 0.98), and we found this to be the case in our population (r = 0.93). The cut-point of FPI resulting from this approach was 62 pmol/L; it is almost identical to one that we used in a previously published study to define IR for Rauch’s entire population. 15 In consequence, we considered appropriate to apply this cut-point in NFG individuals.
The cohort was surveyed again in 2012 to obtain information concerning incident CVD events. The first CVD event, including angina pectoris, fatal or non-fatal myocardial infarction, myocardial revascularization and fatal or non-fatal stroke, was defined as the primary end point. A structured interview was conducted with each participant, or their relatives in case of death, by trained nurses and social workers, and the collected data were then evaluated by a qualified internist (blinded with respect to the subject’s baseline CVD risk factors) to assign a specific outcome for every event. When necessary, available medical records were reviewed.
Continuous variables were expressed as mean and standard deviation (SD) and proportions as percentage (%). Differences in baseline characteristics between groups were compared using Student’s t test for independent samples for continuous variables and Chi-square test for categorical variables. Crude incidences for CVD were expressed by 100 persons/10 years of follow-up; the relative risks for CVD events between individuals of each risk group were estimated using Cox proportional hazard models and plotted as event-free survival. The Cox model-building process takes place in three blocks. In the first block, groups (NFG vs PreDM or PreDM/IR vs PreDM/non-IR) were included as categorical variables; in the second block, age and sex were added; finally, FPG, LDL-C, BMI and WC were included in the equation as covariates. The risk was expressed as HR and its 95% confidence interval (95% CI).
All the significant tests were two-tailed, and p values <0.05 were considered to be statistically significant. Statistical analyses were performed using SPSS software (SPSS Inc., Chicago, IL, USA).
Results
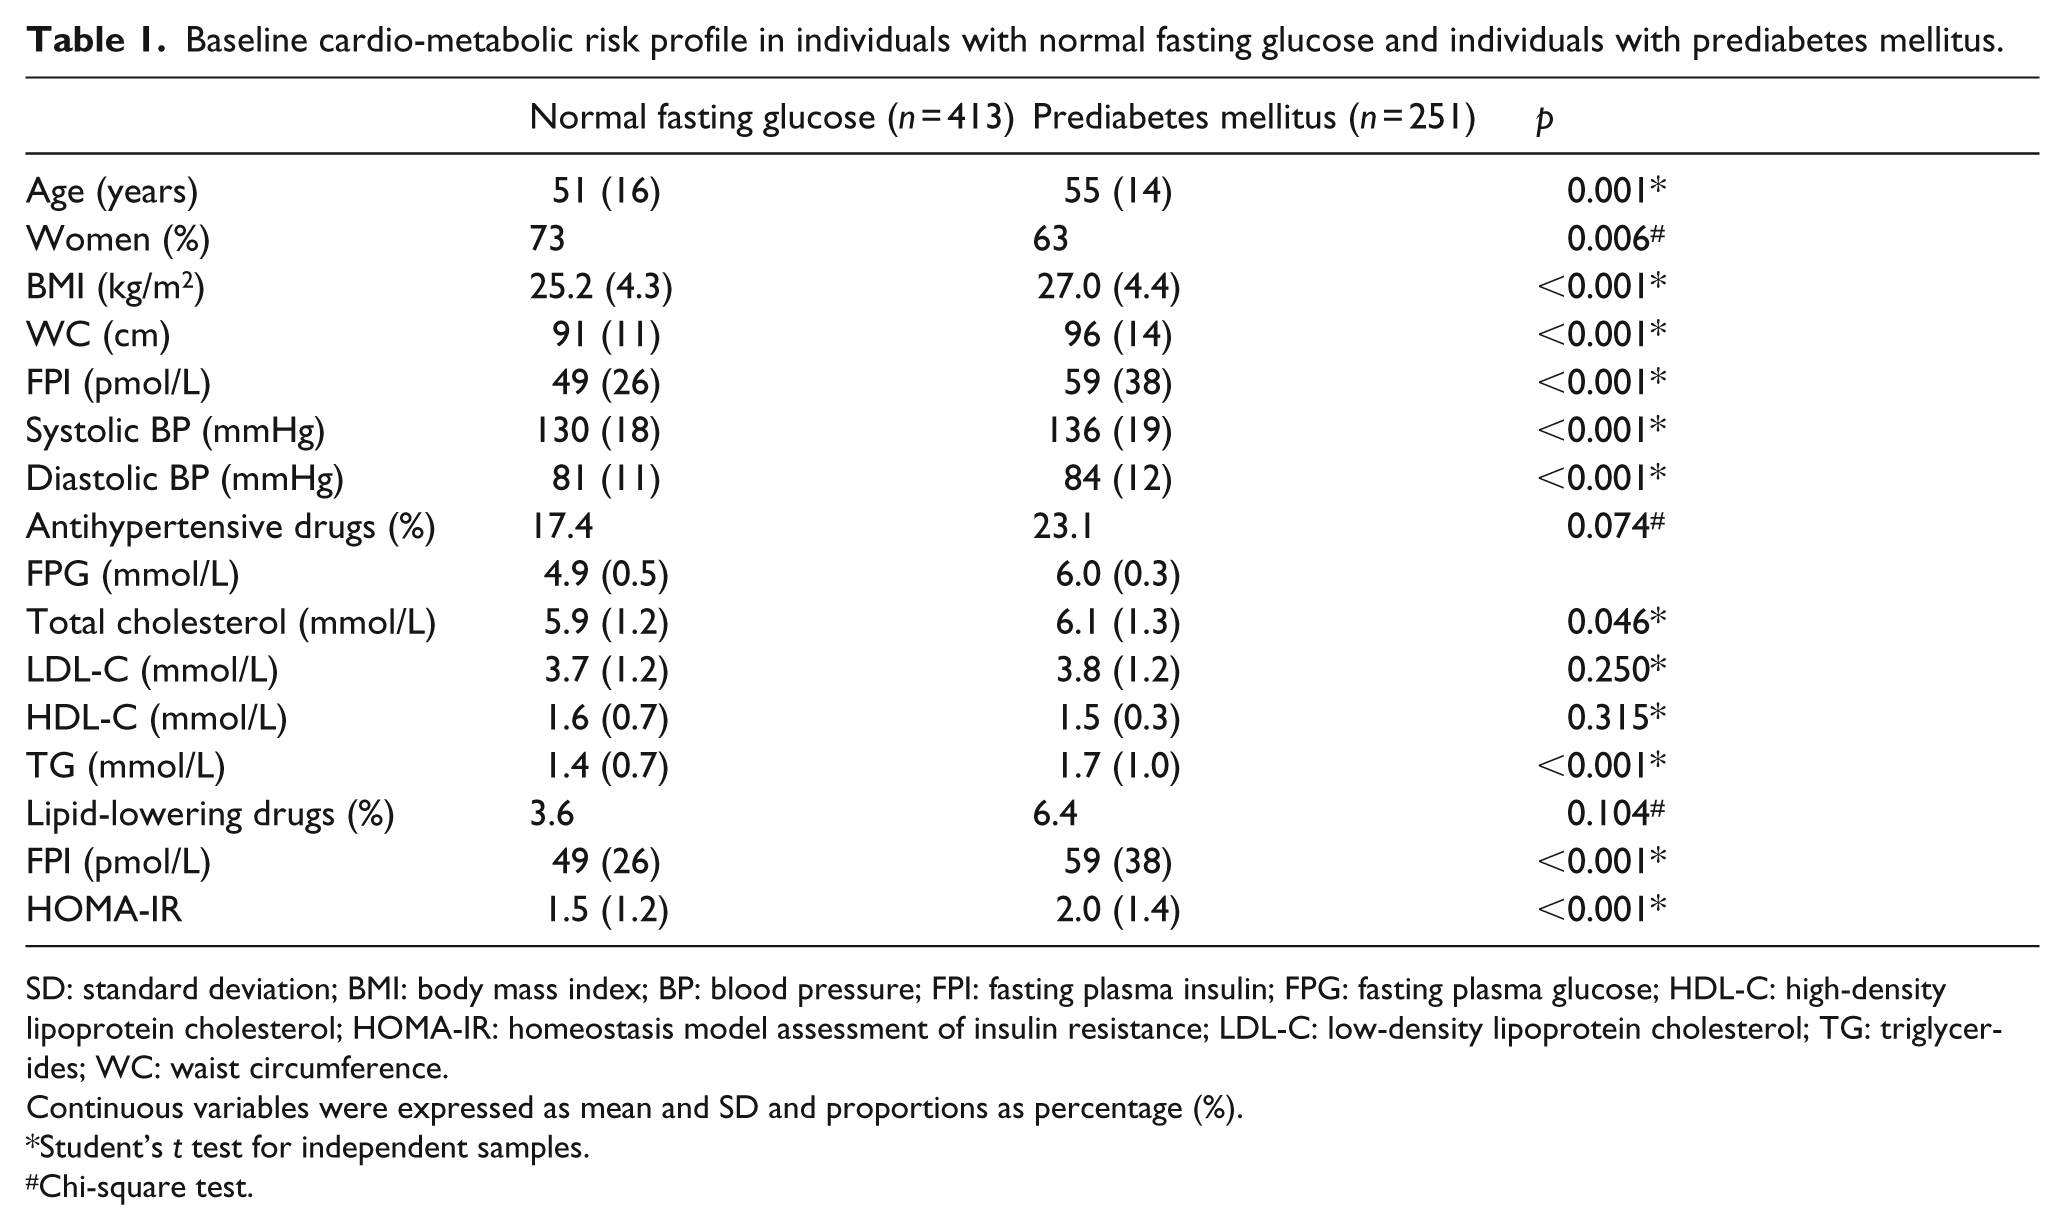
A comparison of the cardio-metabolic risk profile of the two main experimental groups in 2003 is shown in Table 1. Subjects with PreDM were somewhat older and contained relatively more men. Furthermore, subjects with PreDM were more obese, with significantly higher values for both overall (BMI) and abdominal (WC) obesity – differences that possibly contributed to their generally more adverse cardio-metabolic risk profile. By selection, FPG concentrations were higher in those with PreDM, associated with higher FPI and TG concentrations and elevated SBP and DBP values.
Baseline cardio-metabolic risk profile in individuals with normal fasting glucose and individuals with prediabetes mellitus.
SD: standard deviation; BMI: body mass index; BP: blood pressure; FPI: fasting plasma insulin; FPG: fasting plasma glucose; HDL-C: high-density lipoprotein cholesterol; HOMA-IR: homeostasis model assessment of insulin resistance; LDL-C: low-density lipoprotein cholesterol; TG: triglycerides; WC: waist circumference.
Continuous variables were expressed as mean and SD and proportions as percentage (%).
Student’s t test for independent samples.
Chi-square test.
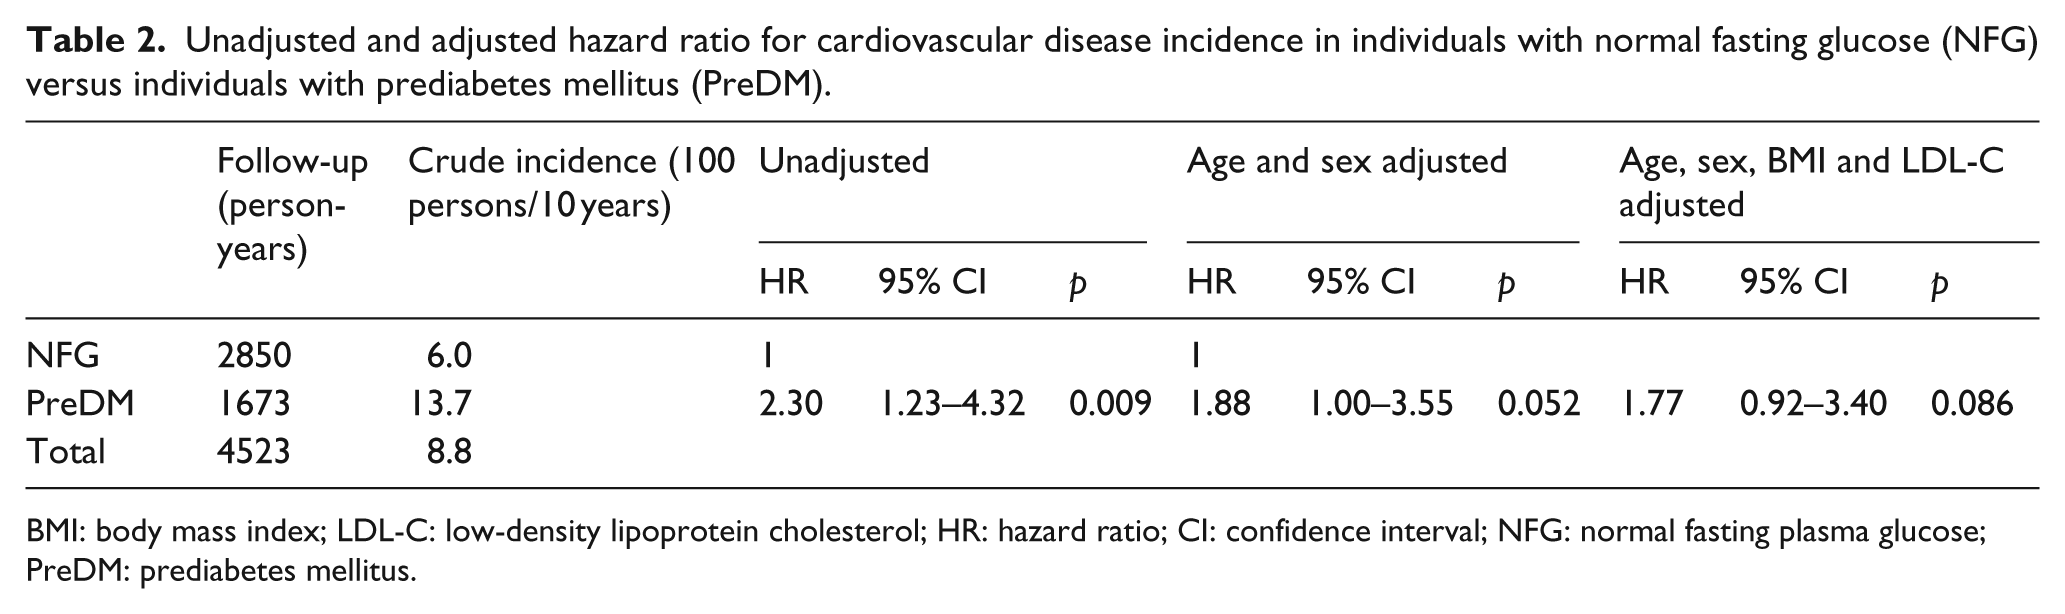
In 2012, 568 individuals, 355 with NFG and 213 with PreDM (86% of the baseline sample), or their relatives in case of death, could be surveyed again in order to obtain information concerning incident CVD events. During the follow-up period (4523 person-years, mean = 8 ± 1 years), there were 40 CVD events, 9 fatal and non-fatal strokes and 31 fatal and non-fatal coronary events (crude incidence of combined CVD outcomes = 8.8/100 persons/10 years). In addition, there were 23 non-cardiovascular deaths. There were 17 CVD events in individuals with NFG (crude incidence = 6.0/100 persons/10 years) and 23 in those with PreDM (crude incidence = 13.7/100 persons/10 year). Table 2 compares unadjusted and adjusted HRs between the two groups and indicates that the risk of developing CVD was somewhat increased in subjects with PreDM, but the age- and sex-adjusted difference is of borderline statistical significance.
Unadjusted and adjusted hazard ratio for cardiovascular disease incidence in individuals with normal fasting glucose (NFG) versus individuals with prediabetes mellitus (PreDM).
BMI: body mass index; LDL-C: low-density lipoprotein cholesterol; HR: hazard ratio; CI: confidence interval; NFG: normal fasting plasma glucose; PreDM: prediabetes mellitus.
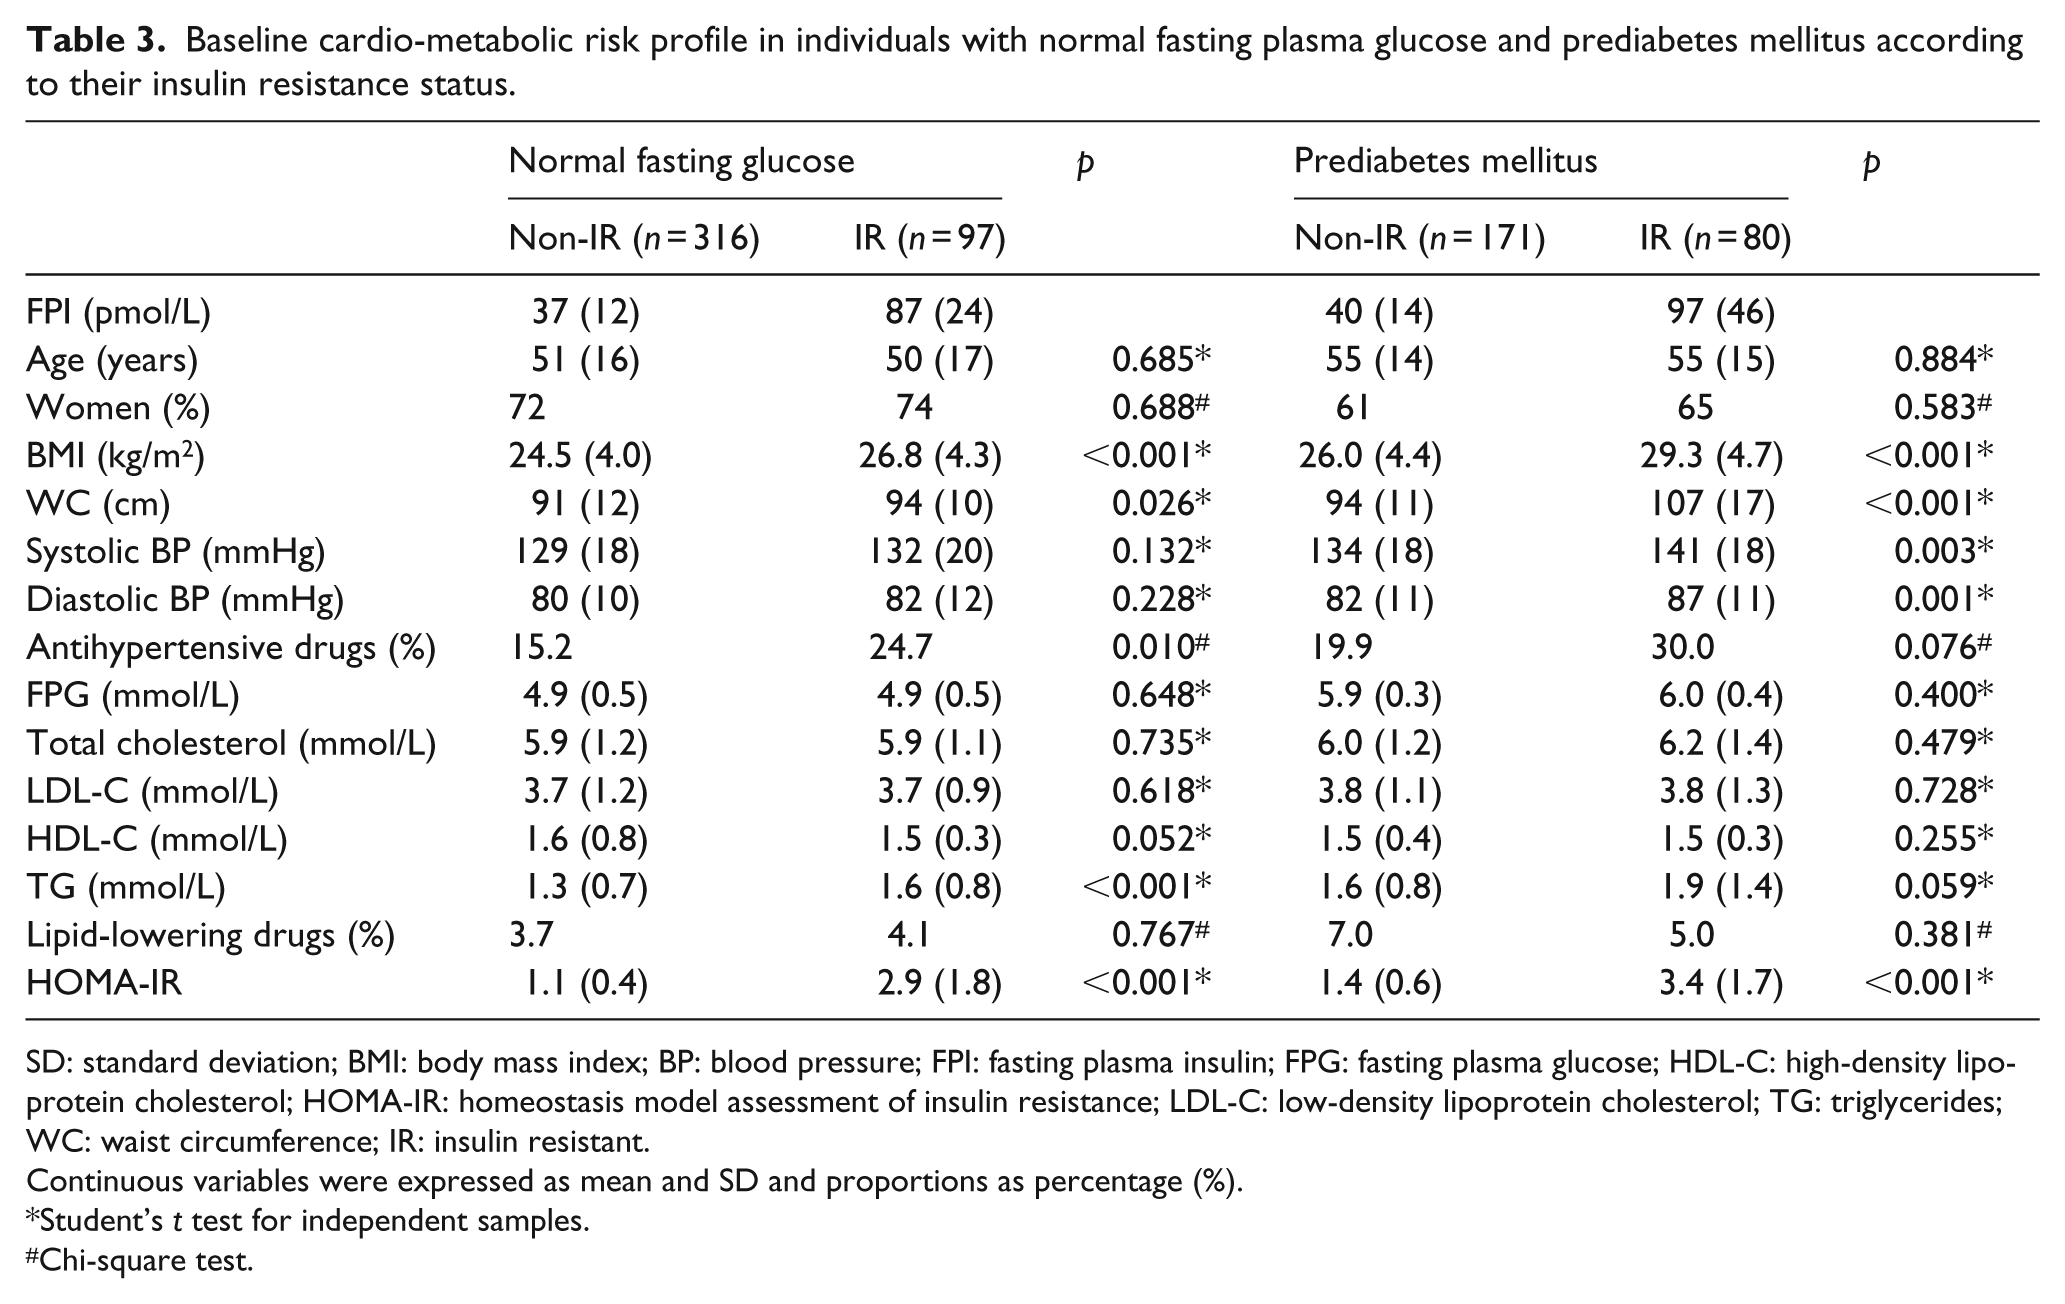
Table 3 begins our effort to address the metabolic heterogeneity in the NFG and PreDM groups, subdividing them into non-IR and IR groups on the basis of their FPI concentrations as outlined in the ‘Methods’ section. By selection, FPI concentrations and HOMA-IR values are significantly greater in the IR subgroups of those with either NFG or PreDM. The two IR subgroups were also more obese (higher values for BMI and WC). In general, they also had a more adverse cardio-metabolic risk profile, but it is important to note that there was no significant difference in FPG concentrations in either IR subgroup.
Baseline cardio-metabolic risk profile in individuals with normal fasting plasma glucose and prediabetes mellitus according to their insulin resistance status.
SD: standard deviation; BMI: body mass index; BP: blood pressure; FPI: fasting plasma insulin; FPG: fasting plasma glucose; HDL-C: high-density lipoprotein cholesterol; HOMA-IR: homeostasis model assessment of insulin resistance; LDL-C: low-density lipoprotein cholesterol; TG: triglycerides; WC: waist circumference; IR: insulin resistant.
Continuous variables were expressed as mean and SD and proportions as percentage (%).
Student’s t test for independent samples.
Chi-square test.
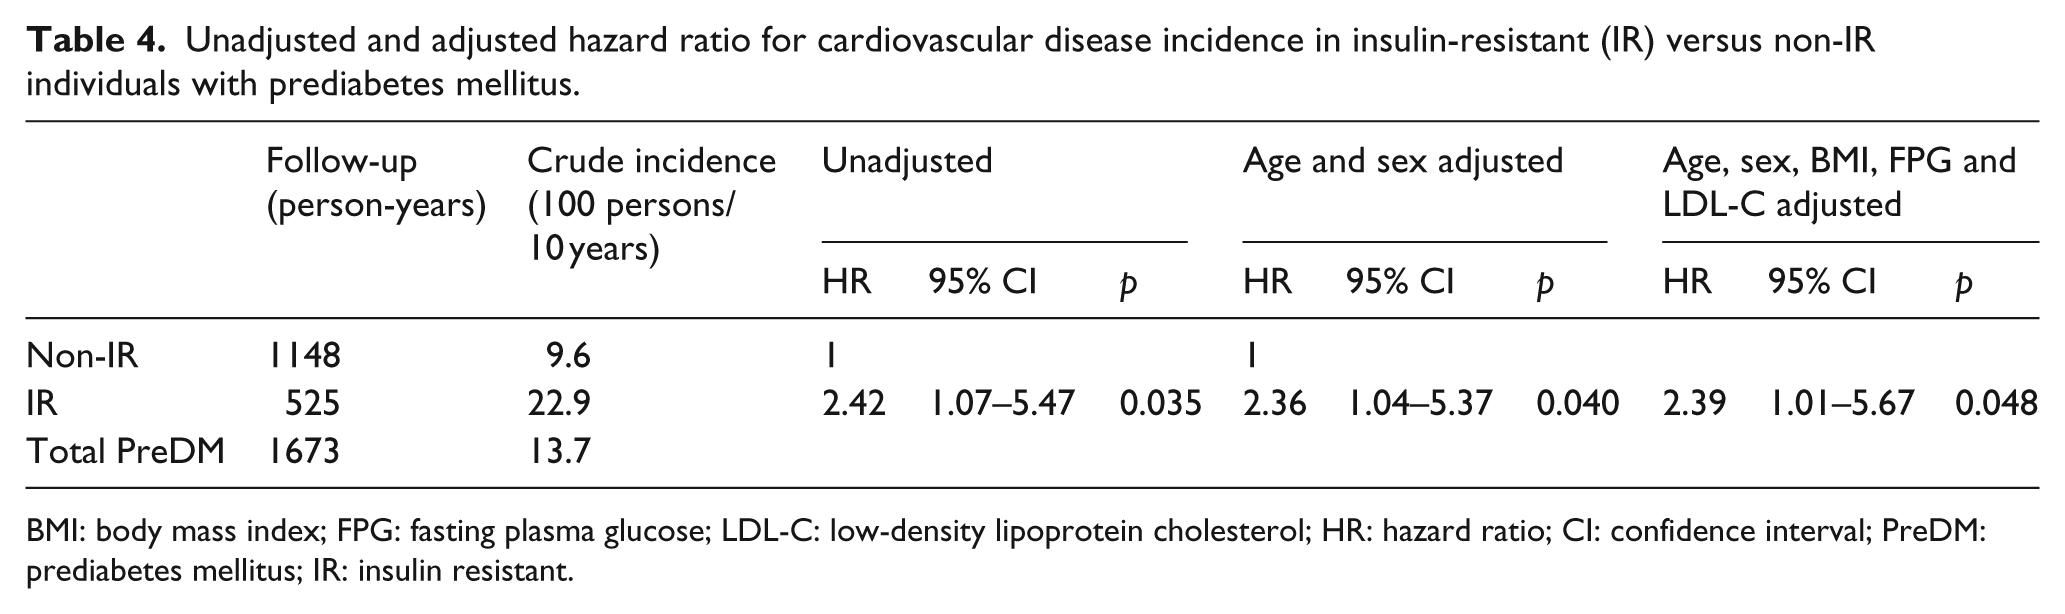
There were 23 CVD events in the PreDM population, 11 in non-IR and 12 in IR subjects, resulting in crude incidences of 9.6 and 22.9/100 persons/10 years, respectively. The event-free survival decreased significantly in the IR group, as illustrated in Figure 1(a) (unadjusted) and Figure 1(b) (age and sex adjusted). Relative risk was more than twice as high in the IR subgroup, as shown in the detailed HR calculations of Table 4. Thus, the unadjusted HR was 2.42 (p = 0.035), the sex- and age-adjusted HR was 2.36 (p = 0.040) and these values did not change significantly after further adjustment for FPG, LDL-C, BMI and WC. However, in the NFG group, IR individuals did not show a significant increase in the risk of CVD event compared with non-IR ones (crude incidence is 7.6 vs 5.4/100 persons/10 years for IR and non-IR, respectively; unadjusted HR = 1.29, 95% CI = 0.46–3.61, p = 0.632; sex- and age-adjusted HR = 1.17, 95% CI = 0.41–3.30, p = 0.769).
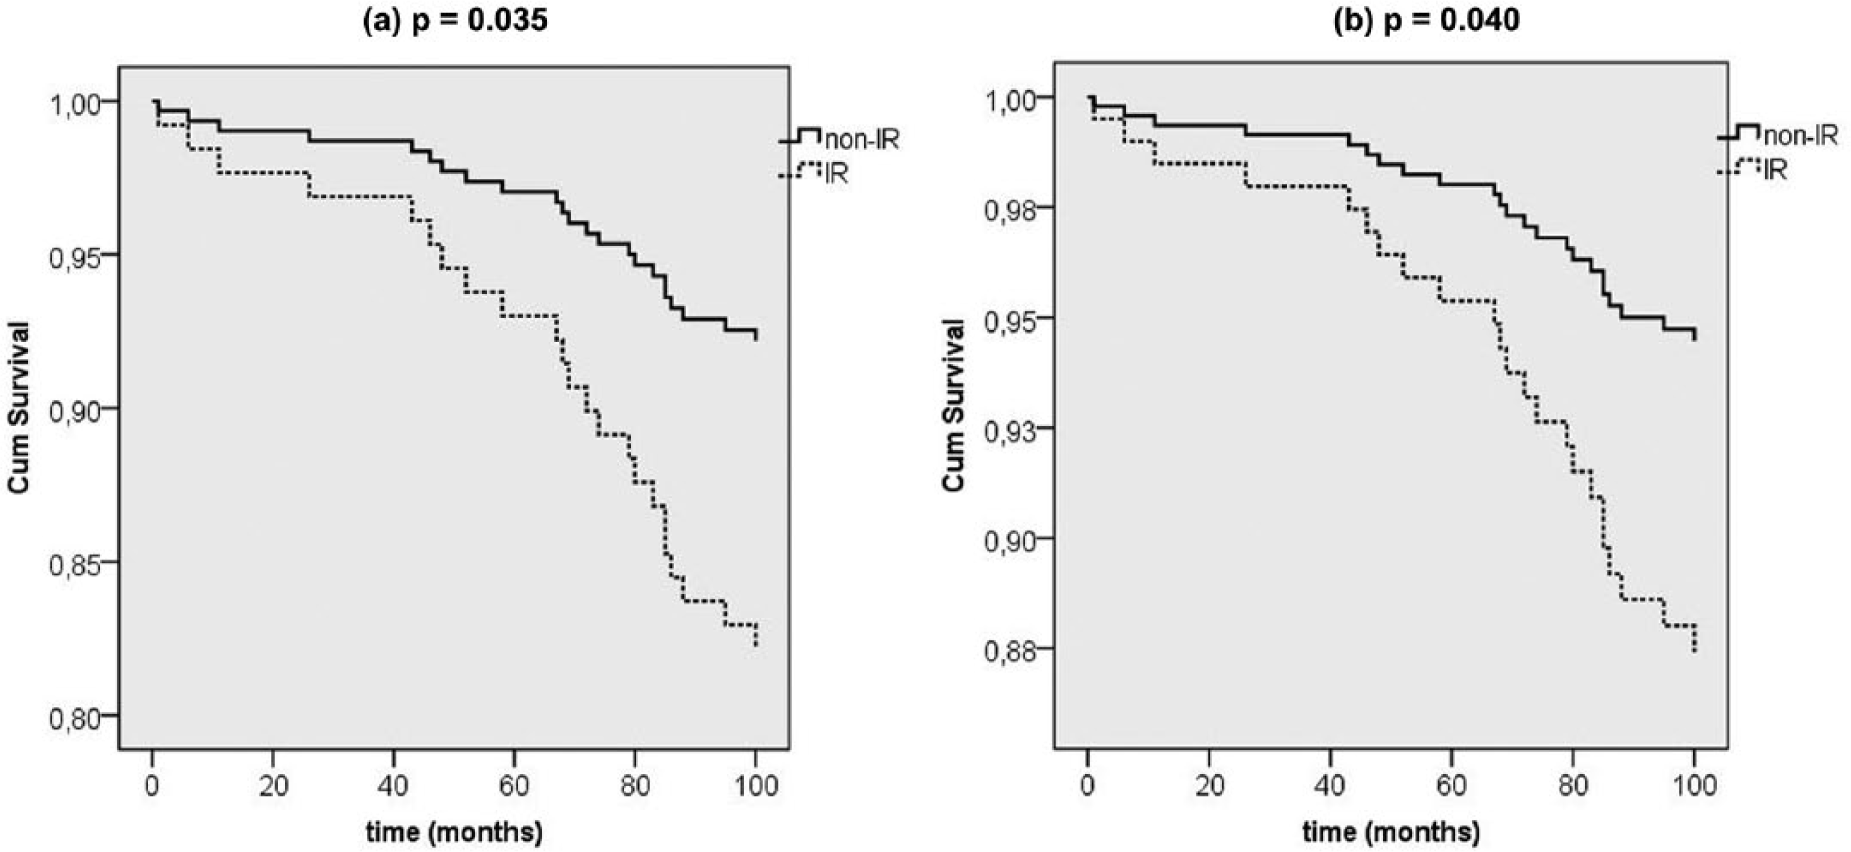
(a) Unadjusted and (b) adjusted by sex and age event-free survival of combined cardiovascular events (fatal and non-fatal strokes and fatal and non-fatal coronary events) in insulin-resistant (IR) and non-insulin resistant (non-IR) individuals with prediabetes mellitus (PreDM).
Unadjusted and adjusted hazard ratio for cardiovascular disease incidence in insulin-resistant (IR) versus non-IR individuals with prediabetes mellitus.
BMI: body mass index; FPG: fasting plasma glucose; LDL-C: low-density lipoprotein cholesterol; HR: hazard ratio; CI: confidence interval; PreDM: prediabetes mellitus; IR: insulin resistant.
Discussion
The results of this study again demonstrate that individuals with PreDM, as a group, are more IR than those with NFG, associated with a more adverse overall cardio-metabolic risk profile, as well as pointing out that this risk is significantly accentuated in the IR subset of those with PreDM.16,17 Although it is not a large study, and relatively few CVD events occurred, the findings are both consistent with previous studies, while at the same time possibly adding new pathophysiological insight to the relationship between PreDM and CVD.
Although incident CVD events occurred somewhat more commonly in subjects with PreDM as compared to NFG (Table 2), the difference did not reach conventional statistical significance. As such, these findings are consistent with the results of large epidemiological studies as analysed by the United States Preventive Services Task Force, 1 as well as the population-based findings of Sarwar et al. 2 that differences in plasma glucose concentration within the non-diabetic range do not predict CVD. Furthermore, substituting the phrase ‘insulin resistance’ for ‘several conventional risk factors’ also renders our results congruent with the findings of the Emerging Risk Factors Collaboration 4 that within a non-diabetic population, information about differences in glucose concentrations, per se, ‘did not significantly improve metrics of vascular disease prediction when added to information about several conventional risk factors’. More simply said, FPI concentration was more than twofold higher in the PreDM/IR subgroup (Table 2), and these individuals had significantly more CVD, despite having FPG concentrations that were essentially identical to those in the PreDM/non-IR group. Moreover, in the Cox models an adjustment for FPG levels did not change the risk estimation. Interestingly, despite the differences in BMI between IR and non-IR PreDM individuals (Table 3), an adjustment for this variable did not modify substantially the HR value (Table 4).
Our finding of the important role that differences in insulin sensitivity play in modulation of CVD risk in non-diabetic subjects is seemingly closest to the conclusion of Faerch et al. 5 that ‘the association between plasma glucose levels and CVD risk is mainly explained by insulin resistance’. We also show that CVD is increased in the IR subset of patients with PreDM despite FPG concentrations that are not different from the non-IR patients. Further support for the view that increase in incident CVD in PreDM is unlikely to be a simple function of enhanced glycaemia is evidence that patients with glucokinase deficiencies and many years of mild hyperglycaemia had essentially no increase in CVD when compared to a group of young patients with relatively mild type-2 diabetes mellitus (T2DM). 3 The patients with glucokinase deficiencies also had lower BP levels, and lower TG and higher HDL-C concentrations, than the young patients with T2DM, similar to the differences in CVD risk factors between the PreDM/non-IR and PreDM/IR groups in this study. Compared with NFG/non-IR, NFG/IR individuals showed an unfavourable risk profile characterized for high TG and low HDL-C levels but, given the scanty number of NFG subjects defined as IR and the relatively few CVD events, the results of the analysis did not identify a significant increase in CVD events. If insulin resistance is associated with increased CVD in persons with NFG, not just a more adverse risk profile, demonstration that such a relationship exists will likely require a study with larger sample size and a longer period of observation.
The findings in this prospective, population-based study of a South American population replicate results of somewhat smaller cross-sectional studies in apparently healthy populations from California that cardio-metabolic risk profile is significantly more adverse in individuals with PreDM as compared to those with NFG, and that there is considerable phenotypic heterogeneity in degree of cardio-metabolic risk in subjects with PreDM.16–18 More importantly, this study demonstrates that not only is cardio-metabolic risk increased in the IR subset of subjects with PreDM, but this subset also developed significantly more CVD.
There are several limitations of this study that must be acknowledged. First, although larger than earlier reports,16–18 the study population was relatively modest in size, numbering in the hundreds, not thousands, and relatively few CVD events occurred. Furthermore, the study population was almost entirely of European ancestry and contained significantly more women than men. Another possible confounder is that oral glucose tolerance tests (OGTTs) were not performed. For example, it is possible that subjects with a normal FPG might have had an elevated 2-h glucose value (⩾140 < 200 or ⩾200 mg/dL) and had an OGTT been performed, and thus would have been ‘mis-classified’ as having NFG rather than isolated impaired glucose tolerance (IGT) or T2DM, respectively. Isolated IGT is relatively uncommon, comprising <10% in populations of non-diabetic individuals of similar demographic characteristics as in this study. 19 Consequently, ‘mis-classification’ of subjects with isolated IGT as NFG would be quantitatively modest, and, if anything, make our finding that CVD events were increased in the PreDM subjects as compared to those with NFG less likely. Furthermore, data from a study in which two successive OGTTs were performed in non-diabetic individuals 48 h apart suggest that the ‘false’ classification of subjects with diabetes mellitus as having PreDM is less likely to occur if the decision is based on FPG concentration as compared to values 120 min after the glucose load. 20 Finally, differentiation of IR from non-IR was somewhat arbitrary, using values of FPI, rather than HOMA-IR, as the surrogate estimate of insulin action. As pointed out before, this was done because results in our sample, and those of a study of 758 apparently healthy, non-diabetic individuals, 14 demonstrated that FPI and HOMA-IR are highly correlated (r > 0.90), with, in the latter study, the same relationship (r ~ 0.6) to a direct measure of insulin-mediated glucose uptake. Second, FPG concentration is used in calculation of HOMA-IR, and the goal of this study was to focus on the impact of insulin resistance, independent of glycaemic status.
Although the concerns outlined above cannot be easily dismissed, the results provide evidence that differences in insulin resistance play a central role in determining the subset of subjects with PreDM most at risk of developing CVD. Perhaps, our findings are best viewed as a pilot study that will encourage investigators with large data bases, containing ample numbers of CVD events, to see whether the findings of this study can be replicated. If further studies support our findings, fundamental pathophysiological and clinical issues need to be addressed. There are multiple CVD risk factors linked to insulin resistance, 6 and the relative importance of each of them in the increased CVD needs exploration. Finally, improved ways to identify and improve insulin sensitivity in IR individuals with PreDM would seem to deserve increased attention.
Key Messages
Cardiovascular disease (CVD) risk varies with glycaemic status in non-diabetic persons.
CVD risk factor profiles vary with insulin sensitivity in prediabetes mellitus (PreDM).
Incident CVD in non-diabetics tends to be increased in general in PreDM.
Incident CVD in PreDM is accentuated in those with insulin resistance.
Footnotes
Acknowledgements
This study could not have been conducted without the help of the nurses from the ‘Hospital Municipal of Rauch’.
Declaration of conflicting interests
The author(s) declared no potential conflicts of interest with respect to the research, authorship and/or publication of this article.
Funding
The author(s) received no financial support for the research, authorship and/or publication of this article.