
Abstract
Objective:
To determine whether arterial elasticity differs between obese adolescents with clinical insulin resistance (IR), type 1 diabetes (T1D) and healthy non-obese controls.
Methods:
This cross-sectional study evaluated 69 adolescents with clinical IR, 91 with T1D and 63 age-matched (10- to 18-year-old) controls. Arterial elasticity was measured using radial tonometry pulse-wave analysis. Stepwise multiple regression analyses were performed to assess the determinants of the small and large arterial elasticity indices (SAEI and LAEI).
Results:
SAEI and LAEI raw values were higher in the IR group than the controls, and these did not differ between the T1D and control groups. Weight and diastolic blood pressure (DBP) were significant predictors of SAEI. After adjustment for weight and DBP, SAEI decreased by 0.65 mL/mmHg × 100 for each 1-year increase in age in the IR group. SAEI was not different across the groups after controlling for weight and DBP. Height was the strongest predictor of LAEI which remained higher in the IR group after controlling for height and blood pressure.
Conclusion:
Obese adolescents with clinical IR have a higher SAEI, which declines with age; this may reflect a pathway to an increased risk of premature cardiovascular disease.
Introduction
Cardiovascular disease (CVD) is the leading cause of disability and mortality in adult populations of many countries. It is now clear that the pathological processes and risk factors associated with atherosclerosis, including vascular endothelial dysfunction, begin during childhood and adolescence.1,2 Insulin resistance (IR), type 1 diabetes (T1D) and type 2 diabetes are recognized risk factors for CVD. T1D confers more than a 10-fold increase in risk of CVD compared with an age-matched non-diabetic population.3,4 Adolescents with obesity, IR and/or pre-diabetes are at increased risk for the development of type 2 diabetes and cardiovascular complications. Recent studies have shown that youth-onset type 2 diabetes is associated with more unfavourable CVD risk factors, a higher prevalence of complications and earlier mortality compared with T1D.5,6 Indeed, a significant proportion of adolescents with IR and newly diagnosed type 2 diabetes present with hypertension, hyperlipidaemia or microalbuminuria,7–9 suggesting that vascular pathology is established before a diagnosis of type 2 diabetes. A better understanding of both the timing and evolution of vascular dysfunction may permit those at high risk of developing CVD and other vascular complications to be identified in order to prevent and mitigate such complications.
Diastolic pulse-wave analysis is a non-invasive technique which studies vascular elastic behaviour and yields small and large arterial elasticity indices (SAEI and LAEI, respectively). SAEI reflects endothelial structure and function of the microcirculation, while LAEI measures compliance of large conduit arteries. 10 Higher SAEI and LAEI reflect greater arterial elasticity or compliance. Reduced SAEI is a useful prognostic indicator of future coronary heart disease, stroke and heart failure in adults.10,11 Recent data indicate that both SAEI and LAEI increase early in life during growth and puberty, with maximal elasticity being attained during the second and third decades after achieving final height and post-puberty, with a steady decline thereafter.12,13
Currently available adolescent studies investigating arterial compliance suggest that obese children and adolescents with type 2 diabetes have a paradoxical greater arterial elasticity than healthy controls, which may be related to accelerated growth and physical maturation.14–17 However, arterial elasticity in adolescents with T1D or with clinical features of IR and/or pre–type 2 diabetes (pre-diabetes) has not been studied using diastolic pulse-wave analysis. This study aimed at the following.
Determine whether arterial elasticity differs between adolescents with pre-diabetes and/or clinical features of IR, T1D and a group of age-matched healthy controls.
Assess associations of SAEI and LAEI with clinical variables in each study group.
Methods
Participants
This cross-sectional study compared the vascular elasticity of three groups of age- and sex-matched adolescents:
Adolescents with pre-diabetes and/or clinical features of IR (IR group)
A total of 69 adolescents who were overweight or obese, 18 with either pre-diabetes 19 and/or clinical features of IR, were recruited through a randomized controlled trial, the Researching effective strategies to improve insulin sensitivity in children and teenagers (RESIST) study. 20 Clinical features of IR were defined as a fasting insulin (pmol/L)/glucose (mmol/L) ratio >20 with one or more of the following: acanthosis nigricans, polycystic ovary syndrome, 21 hypertension, 22 fasting high-density lipoprotein (HDL) cholesterol <1.03 mmol/L 23 or fasting triglycerides ≥1.7 mmol/L. 23 Baseline measurements were used for this analysis. Median fasting insulin was 248 (range: 99–1012) pmol/L, and median whole-body insulin sensitivity index (ISI) was 1.20 (range: 0.27–3.34).
Adolescents with T1D (T1D group)
A total of 91 adolescents with T1D were recruited through the Diabetes Complications Assessment Centre at The Children’s Hospital at Westmead. Median glycated haemoglobin (HbA1c) was 8.2% (range: 5.4%–16.8%) and median diabetes duration 5.9 (range: 1.7–13.7) years.
Healthy (non-obese) controls (control group)
These adolescents were recruited from a convenience cohort through a school-population-based study (Sydney Adolescent Vascular Eye Study) and visitors to the hospital (n = 63). Medical history was conducted by a physician to ensure that they meet the inclusion criteria.
All participants were aged between 10 and 18 years. The study was approved by The Children’s Hospital at Westmead Ethics Committee. Written informed consent from parents and assent from the young people were sought prior to their enrolment in the study.
Anthropometric measures
Height was measured to the nearest 0.1 cm using a standard stadiometer, and weight was measured to the nearest 0.1 kg using a digital scale for all participants. Body mass index (BMI; weight/height2) was calculated from these measures and expressed as age- and sex-adjusted standard deviation scores (SDSs). 24
Biochemistry analysis
A 2-h oral glucose tolerance test (OGTT) was performed for the IR group after an overnight fast, using a glucose dose of 1.75 g/kg of body weight to a maximum of 75 g. Insulin sensitivity (whole-body ISI) was derived from the OGTT using the following formula: 10,000/√ [(fasting insulin × fasting glucose) × (mean 2-h glucose × mean 2-h insulin)]. 25 The fasting blood samples obtained from the IR group were also analysed for lipids (total cholesterol, HDL-cholesterol and triglycerides).
Arterial elasticity
Arterial elasticity was measured using diastolic pulse-wave analysis (HDI/PulseWave™ CR-2000; Hypertension Diagnostics, Eagan, MN, USA). This technique correlates with invasive measures of arterial compliance, and it has high reproducibility.26–29 It analyses the diastolic decay wave of the radial artery pressure waveform. Following approximately 5–10 min of rest in the supine position, an appropriately sized upper arm blood pressure cuff was placed on the left arm. An ergonomically padded splint was applied to the right wrist in order to minimize wrist movement and to stabilize the radial artery during the measurement. A tonometric sensor was placed over the right radial artery at the point of the strongest pulse. The sensor was adjusted to the highest relative signal strength. Once optimal waveforms and a stable baseline were achieved, arterial waveforms were recorded for 30 s and then digitized at 200 samples per second and stored by the device. The CR-2000 software uses a modified Windkessel third-order differential equation to calculate LAEI and SAEI. The HDI-PulseWave analysis instrument also provided arterial blood pressure readings. The mean of three replicates for each participant was used for data analyses. The intra-class correlation coefficients were 0.96 and 0.86 for the SAEI and LAEI, respectively.
Statistical analysis
Data were assessed for normality and analysed using PASW statistical software for Windows, version 20 (SPSS Inc., Chicago, IL, USA). As the outcomes were normally distributed, differences between continuous data were examined using a one-way between-group analysis of variance (ANOVA) with Tukey’s test for post hoc comparison. Chi-squared tests were used to test for differences in categorical data. Correlations between variables were assessed by Pearson’s correlation coefficients. Stepwise multiple regression analysis was conducted to identify regression models that best predicted SAEI and LAEI in control, IR and T1D groups. A multiple regression model was then built to identify variables that best accounted for between-group differences in the measures of arterial elasticity. Dummy variables were created to represent the study groups and included in the regression model: Group-IR (1 = IR group, 0 = otherwise) and Group-T1D (1 = T1D group, 0 = otherwise); hence, both of these values will be zero for the control group. 30 Outliers, defined as being ≥3 SDs from the regression line, were omitted from the multiple regression analysis (six (four in the IR control, and one each from the T1D and control groups) for the SAEI analysis and two (one in the IR group and another from the control group) for the LAEI analysis). The assumptions of modelling were tested and met. A dummy variable describing sex (0 = male, 1 = female) was tested in the multivariable models and was not significant. Hence, analyses presented are not stratified by sex. When a significant group difference was detected in the multiple regression models, an analysis of covariance (ANCOVA), with Bonferroni correction for multiple comparisons, was conducted as a post hoc test to determine which groups were significantly different.
Results
Clinical characteristics of the adolescents are summarized in Table 1. There was no significant difference in age, sex and height between the three groups, but the IR group had a significantly greater height SDS (p < 0.001). As expected, the IR group was significantly heavier than the T1D and control groups. Almost all (94%) of the participants in the IR group were obese, the rest being overweight, whereas 28% of participants in the T1D group were overweight and none were obese. Systolic blood pressure (SBP) was not different between the three groups. Pulse pressure (PP) was lower in the T1D group (mean difference: −3.9 (95% confidence interval (CI): −6.6 to −1.3) mmHg, p = 0.002) due to a higher diastolic blood pressure (DBP) compared to that in the IR group (mean difference: 2.5 (0.6–4.5) mmHg, p = 0.008). DBP and PP did not differ between the IR and control groups. Seven adolescents (10%) in the IR group had pre-diabetes.
Clinical characteristics by group.
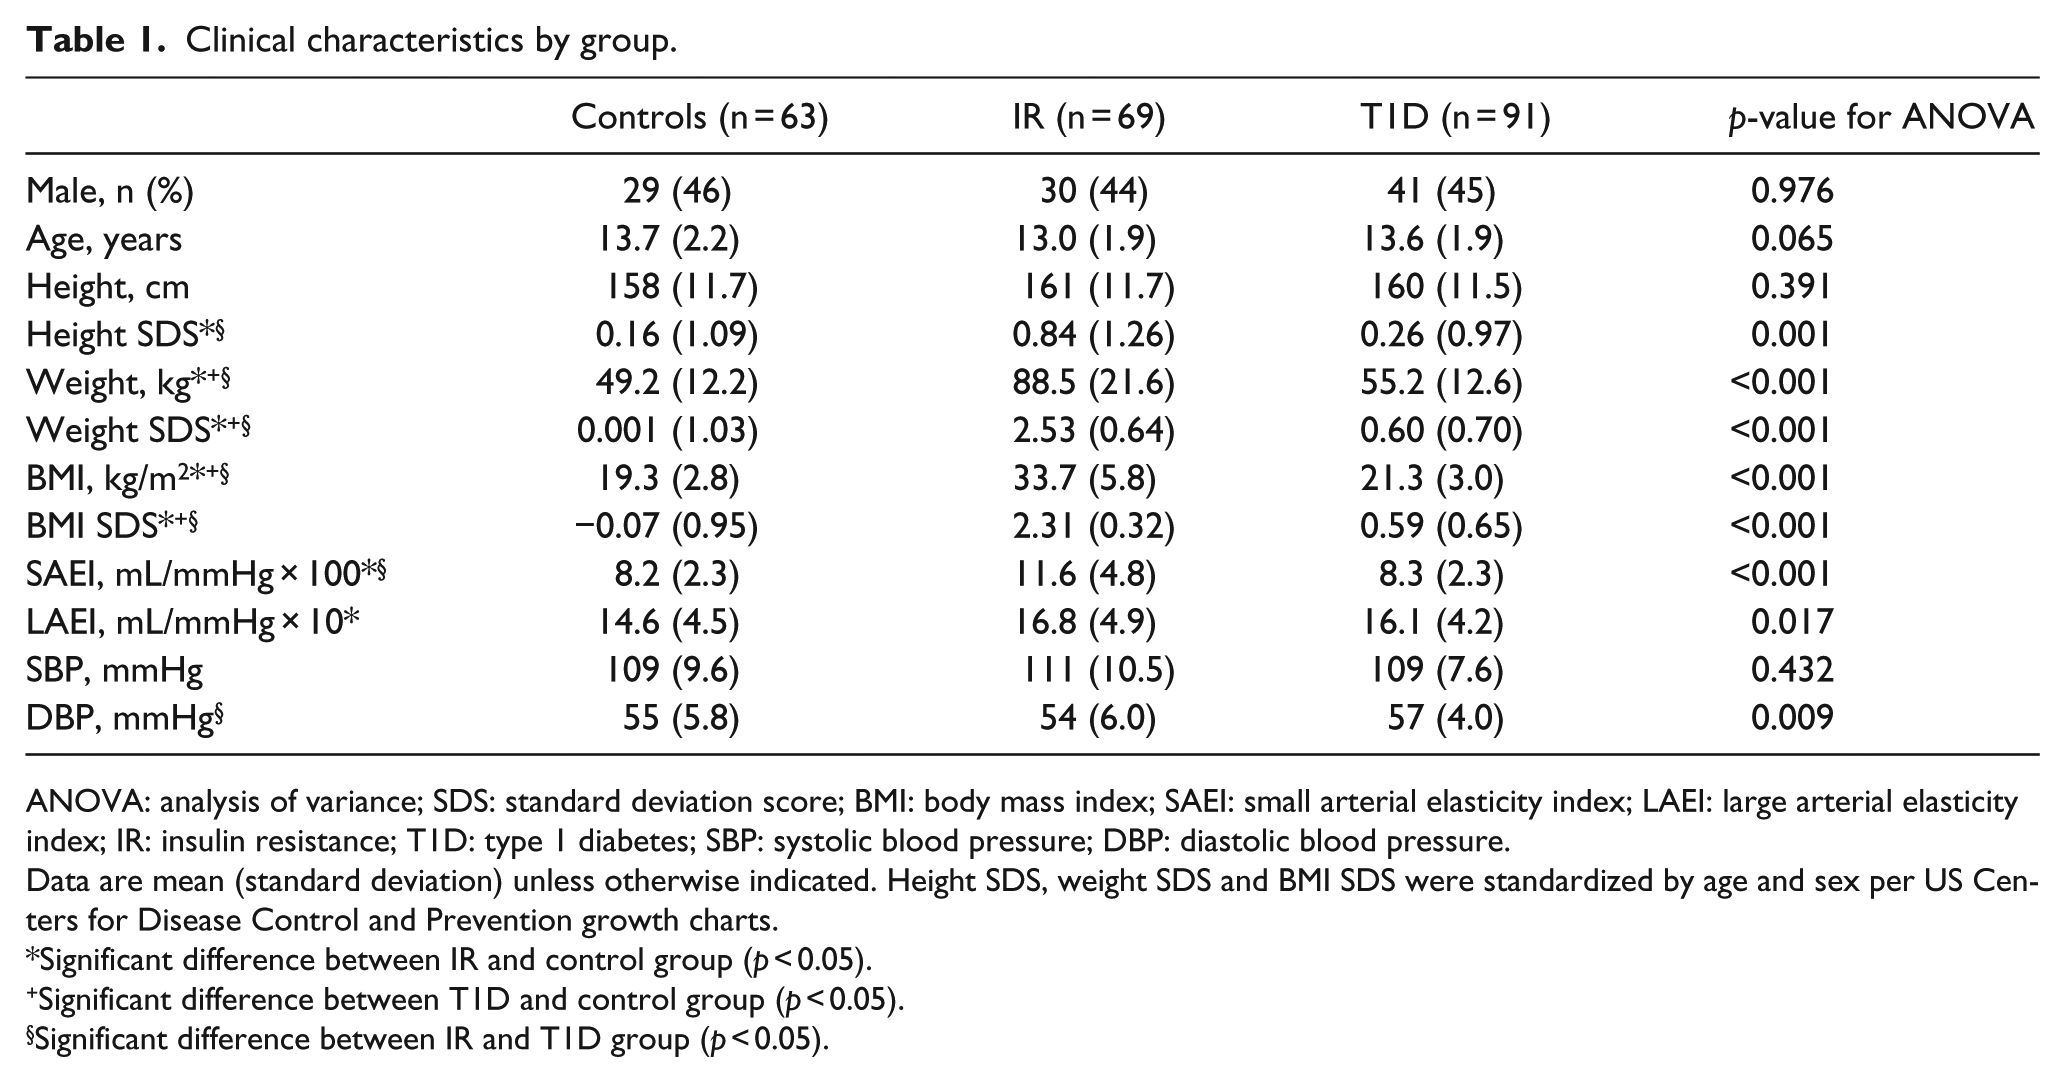
ANOVA: analysis of variance; SDS: standard deviation score; BMI: body mass index; SAEI: small arterial elasticity index; LAEI: large arterial elasticity index; IR: insulin resistance; T1D: type 1 diabetes; SBP: systolic blood pressure; DBP: diastolic blood pressure.
Data are mean (standard deviation) unless otherwise indicated. Height SDS, weight SDS and BMI SDS were standardized by age and sex per US Centers for Disease Control and Prevention growth charts.
Significant difference between IR and control group (p < 0.05).
Significant difference between T1D and control group (p < 0.05).
Significant difference between IR and T1D group (p < 0.05).
The SAEI and LAEI were not different between boys and girls in any of the groups. The unadjusted SAEI was significantly higher in the IR group compared with the other two groups (mean difference between IR and control: 3.4 (2.0–4.7) mL/mmHg × 100, p < 0.001; mean difference between IR and T1D: 3.3 (2.0–4.5) mL/mmHg × 100, p < 0.001). The unadjusted LAEI was also significantly higher in the IR group compared with the control group (mean difference: 2.2 (0.4–4.0) mL/mmHg × 10, p = 0.014), but not significantly different from that in the T1D group (p = 0.578; Figure 1). Both SAEI and LAEI did not differ between the control and the T1D groups (p = 0.976 and 0.108, respectively).
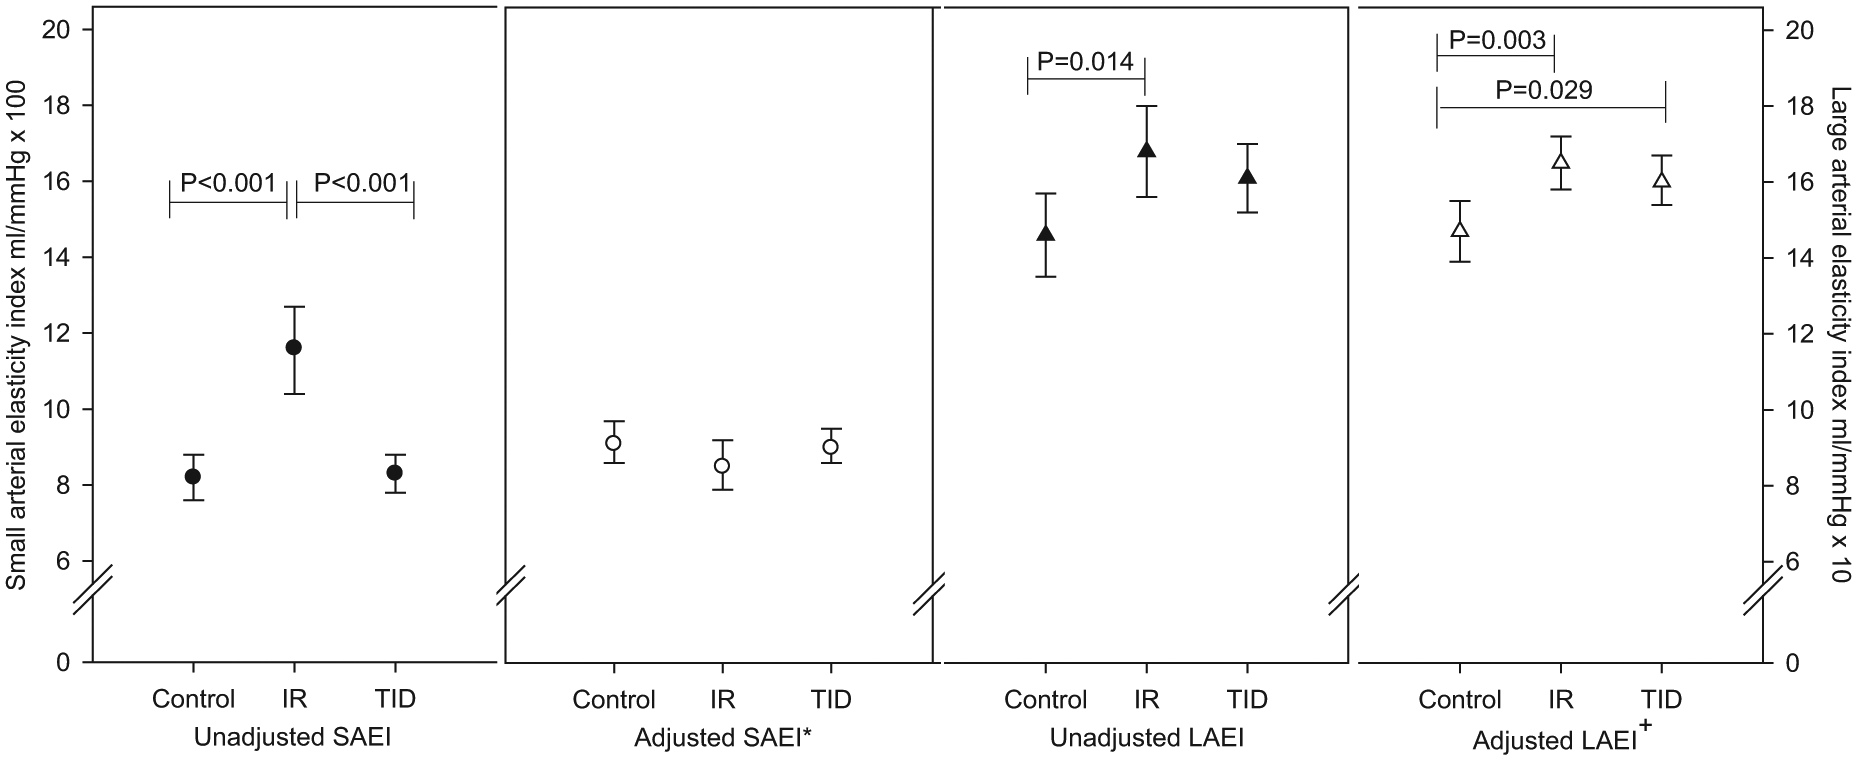
Arterial elasticity in adolescents with clinical IR and/or pre-diabetes, T1D and age-matched healthy controls.
Small arterial elasticity
Correlation analysis
Correlation coefficients between measures of anthropometry, blood pressure and arterial elasticity are shown in Table 2. Age was positively correlated with SAEI in both the control and T1D groups, but not in the IR group. Weight and height were positively correlated with SAEI in all groups. There was no significant association between SAEI and fasting insulin, whole-body ISI or blood lipids in the IR group, nor was there a significant association with HbA1c or duration of diabetes in the T1D group.
Pearson’s correlation coefficients of arterial elasticity indices by groups.
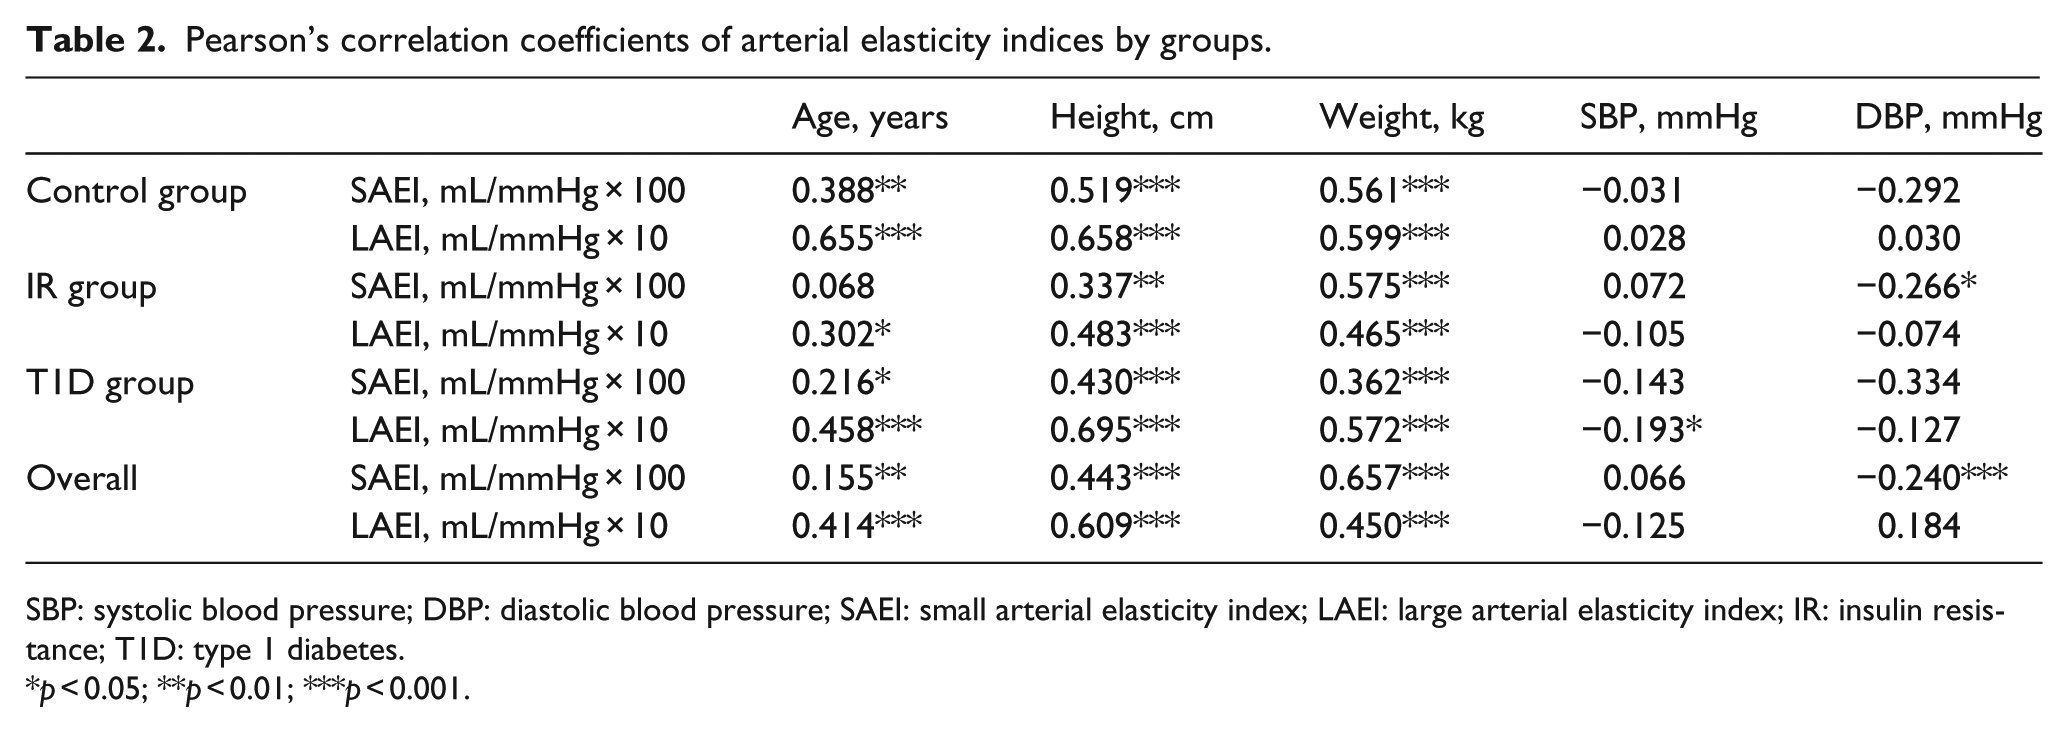
SBP: systolic blood pressure; DBP: diastolic blood pressure; SAEI: small arterial elasticity index; LAEI: large arterial elasticity index; IR: insulin resistance; T1D: type 1 diabetes.
p < 0.05; **p < 0.01; ***p < 0.001.
Multiple regression analysis
Body weight alone explained 31%, 33% and 13% of variance in SAEI in the control, IR and T1D groups, respectively. When DBP was included as an independent variable, the variation explained by the models increased to 52%, 38% and 28% for the control, IR and T1D groups, respectively. After adjustment for weight and DBP, for every 1-year increase in age, the SAEI decreased by 0.65 mL/mmHg × 100 in the IR group (R2 change = 0.056, p = 0.014). However, after adjustment, the association between SAEI and age was no longer significant in the other two groups.
Pooling the data of all groups, the best predictive model for SAEI, which explained 48% of the variation, included weight and DBP (Table 3). Group and age were not significant predictors in the model.
Predictive models explaining the variance in arterial elasticity indices.
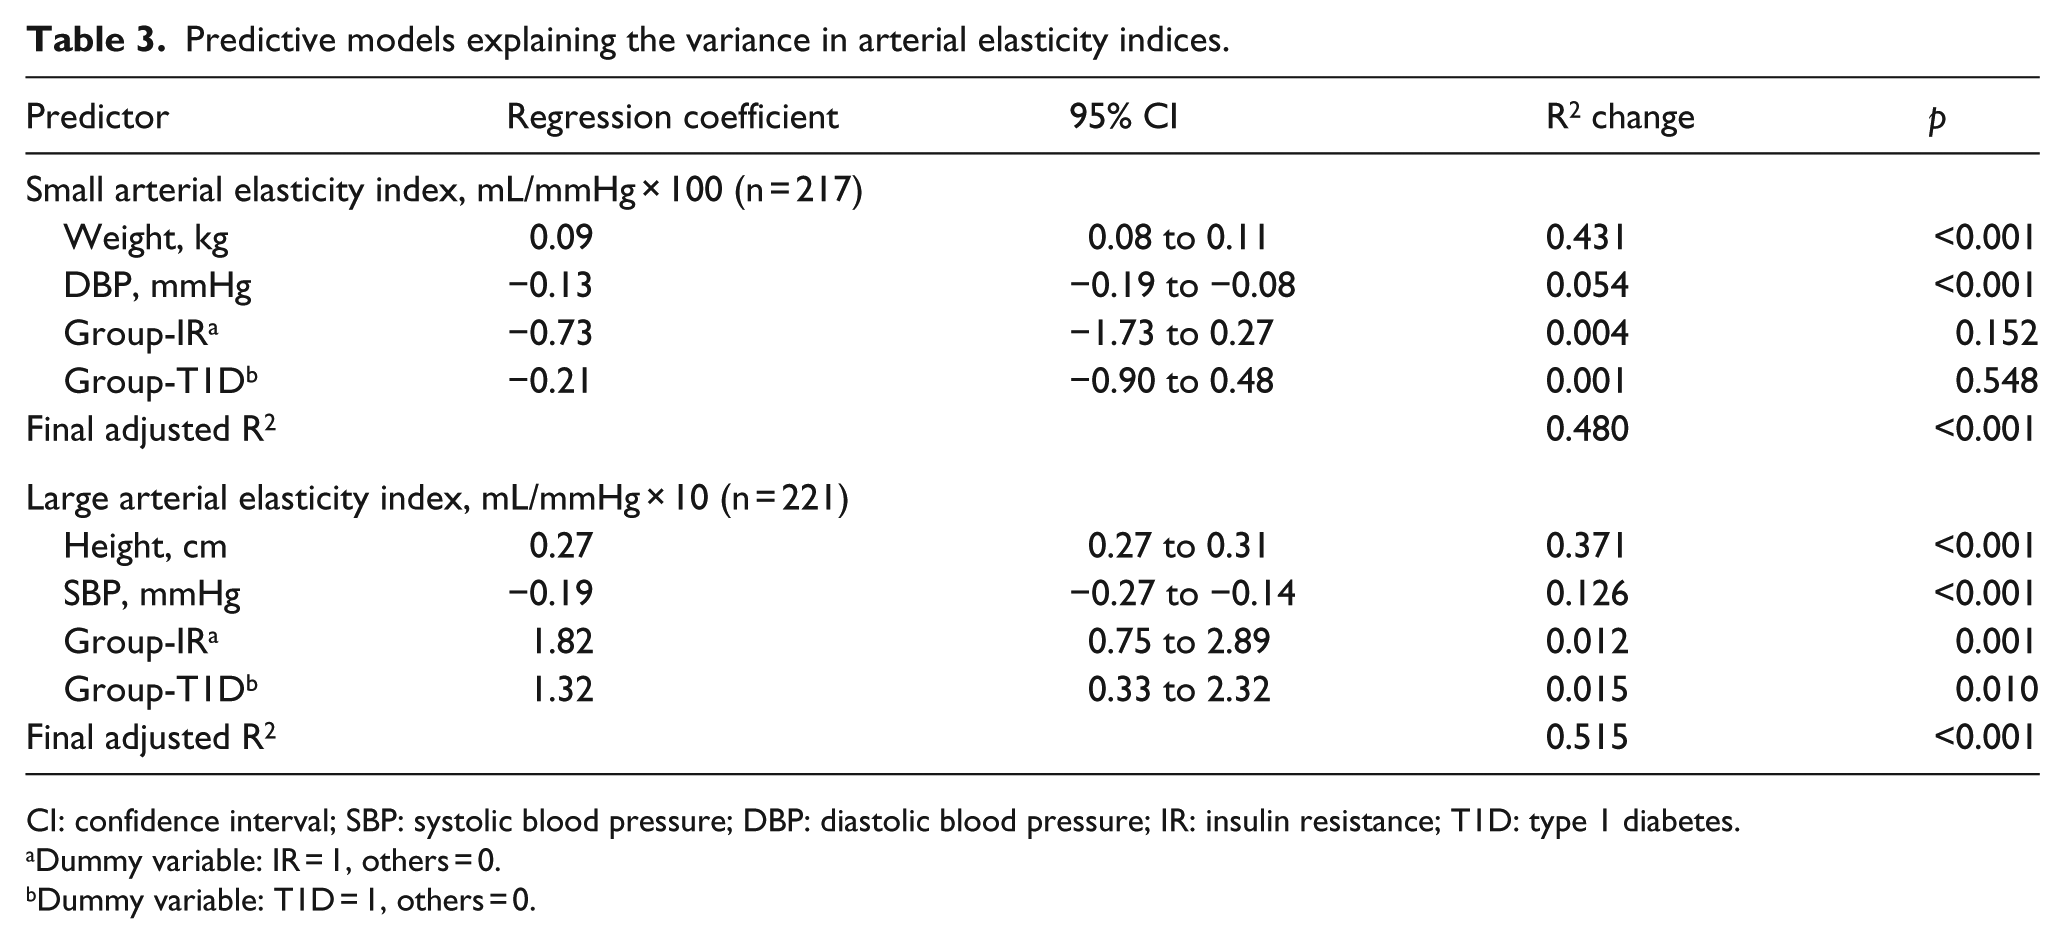
CI: confidence interval; SBP: systolic blood pressure; DBP: diastolic blood pressure; IR: insulin resistance; T1D: type 1 diabetes.
Dummy variable: IR = 1, others = 0.
Dummy variable: T1D = 1, others = 0.
Large arterial elasticity
Correlation analysis
Age, height and weight were positively correlated with LAEI in all groups, although with different magnitudes. As with SAEI, there was no correlation between LAEI and glycaemic control reflected by HbA1c in the T1D group, nor measures of insulin sensitivity in the IR groups, Table 2.
Multiple regression analysis
Height was the strongest predictor of LAEI in all groups and predicted 45%, 23% and 48% of variations in the control, IR and T1D groups, respectively. SBP was also a significant predictor of LAEI and explained a further 11%, 7% and 14% of variance in the control, IR and T1D groups, respectively.
The best predictive model for LAEI, which explained 52% of the variation, included height, SBP and group (Table 3). This model demonstrates that LAEI was significantly lower in the control group compared to both the IR and T1D groups after adjusting for height and SBP. The adjusted mean of the LAEI in the control group was 14.7 (95% CI: 13.9–15.5) mL/mmHg × 10 compared to 16.5 (15.8–17.2) mL/mmHg × 10 in the IR group and 16.0 (15.4–16.7) mL/mmHg × 10 in the T1D group (Figure 1). There was no significant difference in LAEI between the IR and the T1D groups (p = 0.448).
Comparison between BMI-matched T1D and control groups
To control for the impact of body weight, a secondary analysis was conducted on a subset of 120 participants in which T1D and control groups were BMI-matched as well as age-matched (control group n = 60 and T1D group n = 60; Table S1). The findings were consistent with the primary analysis which included all participants. The unadjusted SAEI (p = 0.537) did not differ between the T1D and control groups. Body weight explained 33% and 10% of variance in SAEI in the control and T1D groups, respectively. DBP was also a significant predictor of SAEI and explained a further 12% of variance in both groups. After adjusting for weight and DBP, age was not a predictor of SAEI in either group, and the SAEI did not differ between groups (control group: mean 8.3 (7.8–8.8) mL/mmHg × 100; T1D group: mean 7.94 (7.5–8.4) mL/mmHg × 100).
Height and SBP were significant predictors of LAEI in both groups. Both the unadjusted (p = 0.121) and the adjusted LAEI (controlling for height and SBP, p = 0.325) did not differ between groups.
Discussion
This cross-sectional study of arterial compliance in obese adolescents with pre-diabetes and/or clinical IR compared with adolescents with T1D and non-obese controls provides evidence that body size is the best predictor of arterial elasticity in adolescents. Obese adolescents with pre-diabetes and/or IR have a higher SAEI compared to age-matched adolescents with T1D and non-obese controls. However, after adjusting for weight and DBP, SAEI was lower with increasing age in obese adolescents with pre-diabetes and/or IR. Arterial compliance of adolescents with T1D did not differ from that of age-matched adolescents without diabetes.
Body weight was the most significant predictor of SAEI, while height was the best predictor of LAEI. These findings are consistent with recently published data in healthy and obese adolescents.15,17 Our study extends the evidence to adolescents with T1D as well as obese adolescents with pre-diabetes and/or clinical IR.
In contrast to findings in adults, 24 obesity was associated with increased arterial elasticity in adolescents, a finding that may be related to accelerated growth and physical maturation, and the extra vasculature in the fat.12,14,25 However, little is known about the effects of IR and obesity on the vasculature in early pre-diabetes. One important observation of this study is that SAEI, a measure of microvascular function, decreased in association with increasing age in the obese pre-diabetes and/or IR adolescents after controlling for body weight and blood pressure. This was in contrast to previous studies which reported no association of SAEI with age in obese adolescents without IR after controlling for weight/body composition.15,17,31 Furthermore, the current finding that the adjusted SAEI was not different between the IR and control groups is also in contrast to previously published data in which obese 8- to 17-year-olds were described as having a higher SAEI compared to that of normal weight peers, even after adjustment for body size, blood pressure and Tanner stage. These findings suggest that IR may have an effect on arterial elasticity in adolescents, independent of, and/or additive to, those of obesity.
A significant decline in arterial compliance in 17- and 18-year-olds with type 2 diabetes has been reported recently. 16 The decline in SAEI with older age in the IR group in this study suggests that premature vascular changes may have occurred even before the onset of type 2 diabetes.
The SEARCH for Diabetes in Youth Study compared arterial stiffness in T1D and type 2 diabetes participants (10- to 23-year-olds) and found that youth with type 2 diabetes have worse arterial stiffness than age-matched T1D participants. 32 Study on the long-term clinical outcomes and survival in young-onset T1D and type 2 diabetes (age of onset between 15 and 30 years) demonstrated that type 2 diabetes is associated with higher cardiovascular death (50% vs 30%) and greater overall mortality than T1D. 5 The observation in this study of the early decline of SAEI in the IR group but not in the T1D group, and the presence of a higher mean PP in the IR group compared with T1D group, could indicate that obese adolescents with pre-diabetes and/or IR have a worse preclinical precursor of atherosclerosis than do age-matched adolescents with T1D.
The lack of significant difference in SAEI in our T1D group compared with the non-obese controls is in contrast to previous results obtained from pulse-wave velocity, flow-mediated dilatation and/or augmentation index, showing youth with T1D have increased arterial stiffness.33–35 Differences in methodology and study populations may explain the discrepancies. Most of the published data on arterial stiffness in children and adolescents with T1D have used pulse-wave velocity and flow-mediated dilatation which represents local vascular function. 33 To our knowledge, this is the first study evaluating the influence of T1D on arterial elasticity using diastolic pulse-wave analysis, a measure of systemic vascular function, in adolescents. A detailed investigation of arterial function using multiple techniques, including high-resolution ultrasound, would be of value to better understand the biological and mechanical behaviour of the arterial system in children. Another potential explanation of the null finding in SAEI among adolescents with T1D is that our participants were younger, with shorter disease duration and better glycaemic control. Disease duration is an important contributing factor for the development of vascular pathological changes. A recent study comparing arterial stiffness (measured by brachial–ankle pulse-wave velocity) between adolescents with T1D and healthy adolescents (aged 10–18 years) also showed that arterial stiffness was not elevated in adolescents with T1D with a median disease duration of 5 years. 36
There are limitations to our study. First, the cross-sectional nature of this study does not prove causality. Longitudinal studies are required to provide the natural history and causality of IR, diabetes and vascular changes, as well as an assessment of the predictive value of arterial elasticity of cardiovascular risk and/or CVD in people with childhood-onset IR and pre-diabetes. Second, as this study did not have a comparison group of obese adolescents without IR, our comments on the potential effect of IR on SAEI in addition to obesity remain speculative. Future studies should compare obese children with and without IR. A larger study would also improve statistical power. Furthermore, our control group did not have biochemistry data available, making it impossible to determine the relationship between arterial compliance and the classic cardiovascular risk factors across the study groups. The best predictive model for SAEI, which included body weight and DBP, explained 52% and 38% of variance in the control and IR groups, respectively. In contrast, it only explained 29% of SAEI variations in the T1D group, suggesting that other factors beyond anthropometric measures and blood pressure may contribute, but have not yet been investigated. While HbA1c was not associated with SAEI and LAEI, we did not explore other measures of glycaemic load, such as glycaemic variability, or short-term measures of glycaemia such as blood glucose or fructosamine levels. The lack of biochemistry data in the control group also means that we cannot confirm that the control group is a homogeneous sample.
In summary, obese adolescents with pre-diabetes and/or IR have a higher SAEI, which declines with age after controlling for body weight and blood pressure. This earlier decline in SAEI, however, was not evident in the age-matched adolescents with T1D. Early identification and adequate interpretation of the relevant indices may yield useful clinical tools for risk stratification and inform the early treatment and prevention of cardiovascular complications in persons at high risk. Further research is required to fully assess the influences of obesity, IR and diabetes on arterial compliance and to monitor the pathological and therapeutic changes in arterial compliance in these high-risk groups of adolescents.
Footnotes
Acknowledgements
We are extremely grateful to all the adolescents and their families who contributed their time to take part in this study.
Declaration of conflicting interests
All authors have no conflicts of interest to disclose.
Funding
The RESIST study was funded by BUPA Foundation Australia Pty Limited (2008–2012), Diabetes Australia Research Trust (DART, 2008) and Heart Foundation, Australia (2009–2010). M.H. is supported by a National Health and Medical Research Council (NHMRC) Australian Dora Lush Postgraduate Research Scholarship. S.P.G. was supported by an Early Career Research Fellowship, Cancer Institute NSW (2011–2013). The remaining authors have no financial relationships relevant to this article to disclose.
References
Supplementary Material
Please find the following supplemental material available below.
For Open Access articles published under a Creative Commons License, all supplemental material carries the same license as the article it is associated with.
For non-Open Access articles published, all supplemental material carries a non-exclusive license, and permission requests for re-use of supplemental material or any part of supplemental material shall be sent directly to the copyright owner as specified in the copyright notice associated with the article.