
Abstract
Background
Diabetes mellitus is a chronic multisystem disease with a high global prevalence, including in Saudi Arabia. The Glucagon-like Peptide (GLP-1) receptor agonist liraglutide is known to lower glucose levels, reduce weight and improve cardiovascular outcome. However, mechanisms underlying the benefits of liraglutide treatment in patients with type 2 diabetes mellitus (T2DM) remain unclear.
Methods
In the present study, a 2D-DIGE MALDI-TOF mass spectrometric approach combined with bioinformatics and network pathway analysis explore the plasma proteomic profile. The study involved 20 patients with T2DM with mean age of 54.4 ± 9.5 years and Hemoglobin A1c (HbA1c) between 8% and 11% (inclusive).
Results
A statistically significant change (p < .006) was observed in HbA1c with no significant changes in body weight, renal function, or markers of dyslipidemia post-treatment with liraglutide. 2 D-DIGE gel analysis identified significant changes (⩾1.5-fold change, Analysis of variance (ANOVA), p ⩽ 0.05) in 72 proteins, (62 down and 10 up) in liraglutide pre-treatment compared to the post-treatment state. Proteins identified in our study were found to regulate metabolic processes including acute phase response proteins, enzymes, apolipoproteins with involvement of the inflammatory signaling pathways, NF-κB, AKT, and p38 MAPK
Conclusion
Liraglutide treatment decreased levels of acute phase response that to reduce the systemic chronic inflammatory state and oxidative stress, and eventually improve the cardio-metabolic profile in these patients.
Keywords
Introduction
Diabetes mellitus (DM) is a major health problem affecting individuals around the world. According to the IDF 2013 published data, Saudi Arabia has the highest prevalence (23.9%, excluding prediabetes). 1 Approximately 90% of patients develop type 2 diabetes mellitus (T2DM) due to environmental (lifestyle including diet and lack of exercise) and genetic factors. 2 T2DM is associated with major complications that include cardiovascular disease (CVD), mainly fatal and non-fatal myocardial infarction, heart failure, and cerebrovascular disease.
The UK Prospective Diabetes Study reported a significant correlation between intense glycemic control and rates of complication. Improved glycemic control, measured by reductions in HbA1c levels, were associated with reduction in microvascular complications (37%), reduction in myocardial infarction (14%) and a reduction in total mortality (21%). 2
Recent studies have shown that Liraglutide, a GLP-1 analog, improves glycemic control through suppression of appetite, delayed gastric emptying, inhibition of glucagon release, and stimulation of insulin release in response to meal ingestion. 3 In addition to improving beta cell function a decreasing progression of prediabetes to diabetes liraglutide also helps in weight loss. 4 Besides its action on the pancreas, GLP-1 receptor expression is widely detected in various cells and organs suggesting that GLP-1 may have additional roles other than its glucose-lowering effects. 5 One such action has been its role in improving cardiovascular safety as shown in large randomized trilas.6,7 In general, the cardioprotective benefits of liraglutide in T2DM and the effect of GLP-1 agonists on adipokines have resulted in an improvement in visceral fat and insulin sensitivity. 8 GLP-1 infusion over 72 h has been studied in patients with acute myocardial infarction with left ventricular ejection fraction (LVEF) less than 35% (established cardiovascular disease), which after treatment resulted in improvement in ejection fraction. Although the effect of GLP-1 agonists on metabolism and fat distribution has been studied in animals, 9 there is still limited number of studies in humans. The mechanism underlying the reduction in cardiovascular risk in patients with diabetes caused by GLP-1 remains unclear, and future studies are required to understand this further.
Proteomics is a powerful tool for the study of body metabolism for two main reasons. First, changes in protein expression reflect physiological situations better than the genes themselves and represent the overall changes in the body at the metabolic level. Second, given the complex multifactorial nature of the metabolism, an approach directed at assessing many targets rather than just a few will provide additional (and sometimes unexpected) insights. Untargeted proteomic profiling identifies changes that represent overall metabolic changes and is not limited to a single organ or system. Several studies have utilized proteomics techniques to understand complex metabolic diseases in humans10–12 and identify biomarkers for monitoring the prediction and progression of the disease. 13 This novel analytical approach is able to pinpoint individual proteins and interaction pathways, providing explanatory clues for the potential cardiovascular and metabolic benefits of liraglutide, as well as a strong basis for future biomarkers and drug discovery research. In this study, we evaluated the circulatory and excretory proteins in patients treated with liraglutide using a proteomics approach and identified protein pathways that are altered by the use of liraglutide through bioinformatics and network pathway analysis.
Materials and methods
Ethical considerations and informed consent
All study procedures were performed in accordance with the ethical standards of the Declaration of Helsinki and the universal International Conference on Harmonization-Good Clinical Practice Guidelines. The Institutional Review Board, College of Medicine, King Saud University Hospital approved the study protocol (no. E-18-3075). Written informed consent was obtained from all the participants.
Study subjects
Twenty patients with T2DM followed up in the endocrine outpatient clinic at King Saud University Medical City with a history of uncontrolled diabetes (HbA1c between 8% and 11%) were recruited. Patients with indications for add-on liraglutide were started on treatment by their physician in a scaled-up dose from 0.6 mg to 1.8 mg once daily subcutaneous injection over a period of 3 weeks. Besides the medication the patients were advised to follow similar diet control and exercise routine that included suggestion for walking for minimum of 30 min daily. The follow-up visit was scheduled 3 months after receiving the full dose (1.8 mg) of liraglutide. Blood samples were collected by venipuncture into plain tubes (Vacutainer, BD Biosciences, San Jose, CA, USA) from each patient after a 10 h fast at two time points: one sample before and another sample after treatment with liraglutide. The plasma was separated by centrifugation (15 min, 3000 × g), divided into several aliquots, and stored at −80°C for further analysis. The primary endpoint was a reduction of baseline HbA1c of ⩾0.5%. The sample size was determined by carrying out a power analysis using the Progenesis SameSpots nonlinear dynamics statistical software (version 3.3, Nonlinear Dynamics Ltd., UK) for determination of the minimum number of required biological replicates.
Biochemical analysis
Biochemical analyses were carried out using a Dimension Xpand Plus integrated clinical chemistry autoanalyzer (Siemens Healthcare Diagnostics, Molecules 2020, 25, 2831 13 of 18 Deerfield, IL, USA). 14 HbA1c was analyzed using high-performance liquid chromatography and ion-exchange chromatography assay (normal range 4.3–5.8%; Tosoh Bioscience, San Francisco, USA).
Protein extraction and 2D-DIGE
Proteins were extracted using trichloroacetic acid/acetone precipitation, as described by Chen et al. 15 The protein concentrations were measured in triplicate using a 2D-Quantkit (GE Healthcare, Chicago, IL, USA). Equal amounts of protein (50 μg) from each sample (20 liraglutide pre-treatment and 20 liraglutide post-treatment samples) was labeled with 400 pmol of CyDyes (CyDyeTM Difference gel electrophoresis (DIGE) Fluor dyes, GE Healthcare, UK) on ice for 30 min in the dark following manufacturer’s instructions. A mixture of an equal amount of all samples was pooled, labeled with Cy2, and used as an internal standard, which was normalized and matched across gels to avoid gel-to-gel variation. A dye-switching strategy was applied during labeling to avoid dye-specific bias (Supplementary Table S1). First-dimension analytical gel electrophoresis was performed, followed by second-dimension sodium dodecyl sulfate polyacrylamide gel electrophoresis (SDS-PAGE) on 12.5% fixed concentration gels, as previously described.10,12 The gels were scanned with Sapphire Biomolecular Imager (Azure Bio systems, Dublin, OH, USA) and digitalized via the image analysis software Sapphire Capture system (Azure Biosystems, Dublin, OH, USA). For the preparative gel, total protein (1 mg) was obtained from a pool of equal amounts of protein from the 40 samples. Then, the proteins samples were separated by first and second dimensions with the same conditions in the DIGE section. The gels were fixed in 40% (v/v) ethanol containing 10% acetic acid overnight and then washed (3 ×, 30 min each, ddH2O). The gels were incubated (1 h, 34% (v/v) CH3OH containing 17% (w/v) ammonium sulfate and 3% (v/v) phosphoric acid) prior to the addition of 0.5 g/L Coomassie G-250. After 5 days, the stained gels were briefly rinsed with Milli-Q water and stored until the spots were picked and identified by mass spectrometry.10–12
Statistical analysis
Data for the laboratory values are presented as the mean ± SD. The statistical significance of the difference between two groups was analyzed by paired Student’s t-test, with a value of p < .05 considered as significant. In terms of statistical analyses for gel image analysis, the 2D-DIGE gel images were uploaded into the Progenesis SameSpots software (Nonlinear Dynamics, UK) and analyzed using an automated spot detection method. Although automatic analysis was performed to detect all the spots across all 20 gels, each selected spot was verified and manually analyzed wherever necessary. Normalized volumes were used to identify the differentially expressed spots. A cutoff ratio of ⩾1.5-fold was considered significant using ANOVA with a p-value ⩽ .05.
ID Protein by MALDI-TOF mass spectrometry analysis
The Coomassie blue-stained gel spots were washed and digested, as previously described.10–12 Finally, a mixture of tryptic peptides (0.8 μL) derived from each protein was spotted onto a Matrix Assisted Laser Desorption/Ionization (MALDI) target (384 MTP Anchorchip) (800 μm Anchorchip; Bruker Daltonics, Bremen, Germany). The spectra were obtained using an UltraflexTerm time-of-flight (TOF) mass spectrometer equipped with a LIFT-MS/MS device (Bruker Daltonics) at reflector and detector voltages of 21 kV and 17 kV, respectively, as described previously.10–12 The peptide mass fingerprints (PMFs) were calibrated against a standard peptide calibration standard II (Bruker Daltonics). The PMFs were assessed using Flex Analysis software (version 2.4, Bruker Daltonics). The MS data were interpreted using BioTools v3.2 (Bruker Daltonics). The peptide masses were searched against the Mascot search algorithm (v2.0.04, updated on 09/05/2020; Matrix Science Ltd., UK). The identified proteins were screened for Mascot scores higher than 56 and p ⩽ .05.
Bioinformatics analysis
Ingenuity pathway analysis (IPA) version 9.0 (Ingenuity Systems, Redwood City, CA, USA) was used to analyze protein interaction networks and the functions of the plasma proteins differentially expressed in liraglutide pre-treatment and post-treatment samples. IPA software maps UniProt Identification of proteins (IDs) into the ingenuity knowledge base, the largest manually curated resource combining information from all published scientific studies. This software aids in determining the functions and pathways that are most strongly associated with the MS-generated protein list by overlaying the experimental expression data onto networks constructed from published interactions. The identified proteins were additionally classified into different categories according to their function and location using the protein analysis through evolutionary relationships (PANTHER) classification system (http://www.pantherdb.org) according to their function and location.
Immunoblotting assay
Immunoblotting assay was performed in the current study to further confirm the findings. Two proteins with statistically significant differential abundance were chosen and determined by immunoblotting. Primary monoclonal antibodies against Apolipoprotein A-I (mouse, cat # SC-376818), retinol-binding protein (RBP, mouse, cat # SC-69795) were used. An equal amount of protein (2.5 μg) from each sample from the two groups (pre-treatment, n = 20; post-treatment, n = 20, i.e., 50 μg from each sample) was taken, pooled together, and then separated by One-dimensional discontinuous slab gel electrophoresis (12% sodium dodecyl sulfate (SDS)-polyacrylamide gel) was used to separate an equal amount of protein from each sample (50 μg). A mini trans-blot electrotransfer cell (BioRad, California, CA, USA) was employed to transfer proteins from the run gels to an Immobilon-P, polyvinylidene difluoride (PVDF) transfer membrane (Millipore, Massachusetts, MA, USA). To test the efficiency of the transfer, the membranes were stained with Ponceau-S. Subsequently, the membranes were blocked with tris-buffered saline (TBS)–containing 5% fat-free milk (FFM), for 1 h at room temperature, and then the membranes were rinsed three times with TBS-T in 10 m
Results
Clinical and biochemical data
The baseline characteristics of the study group are presented in Table 1. The mean age of the study participants was 54.4 ± 9.5 years. After treatment with liraglutide, we did not observe any significant changes in body weight, BMI, renal function markers, or markers of dyslipidemia compared to the pre-treatment data. A statistically significant change after treatment with liraglutide was noted in the HbA1c levels (p ⩽ .006) with a change of 1.1% from the baseline (Supplementary Figure S1). This change was clinically significant considering the short duration (3 months) of treatment in these patients.
Clinical and biochemical characteristics of the study population before and after liraglutide treatment.
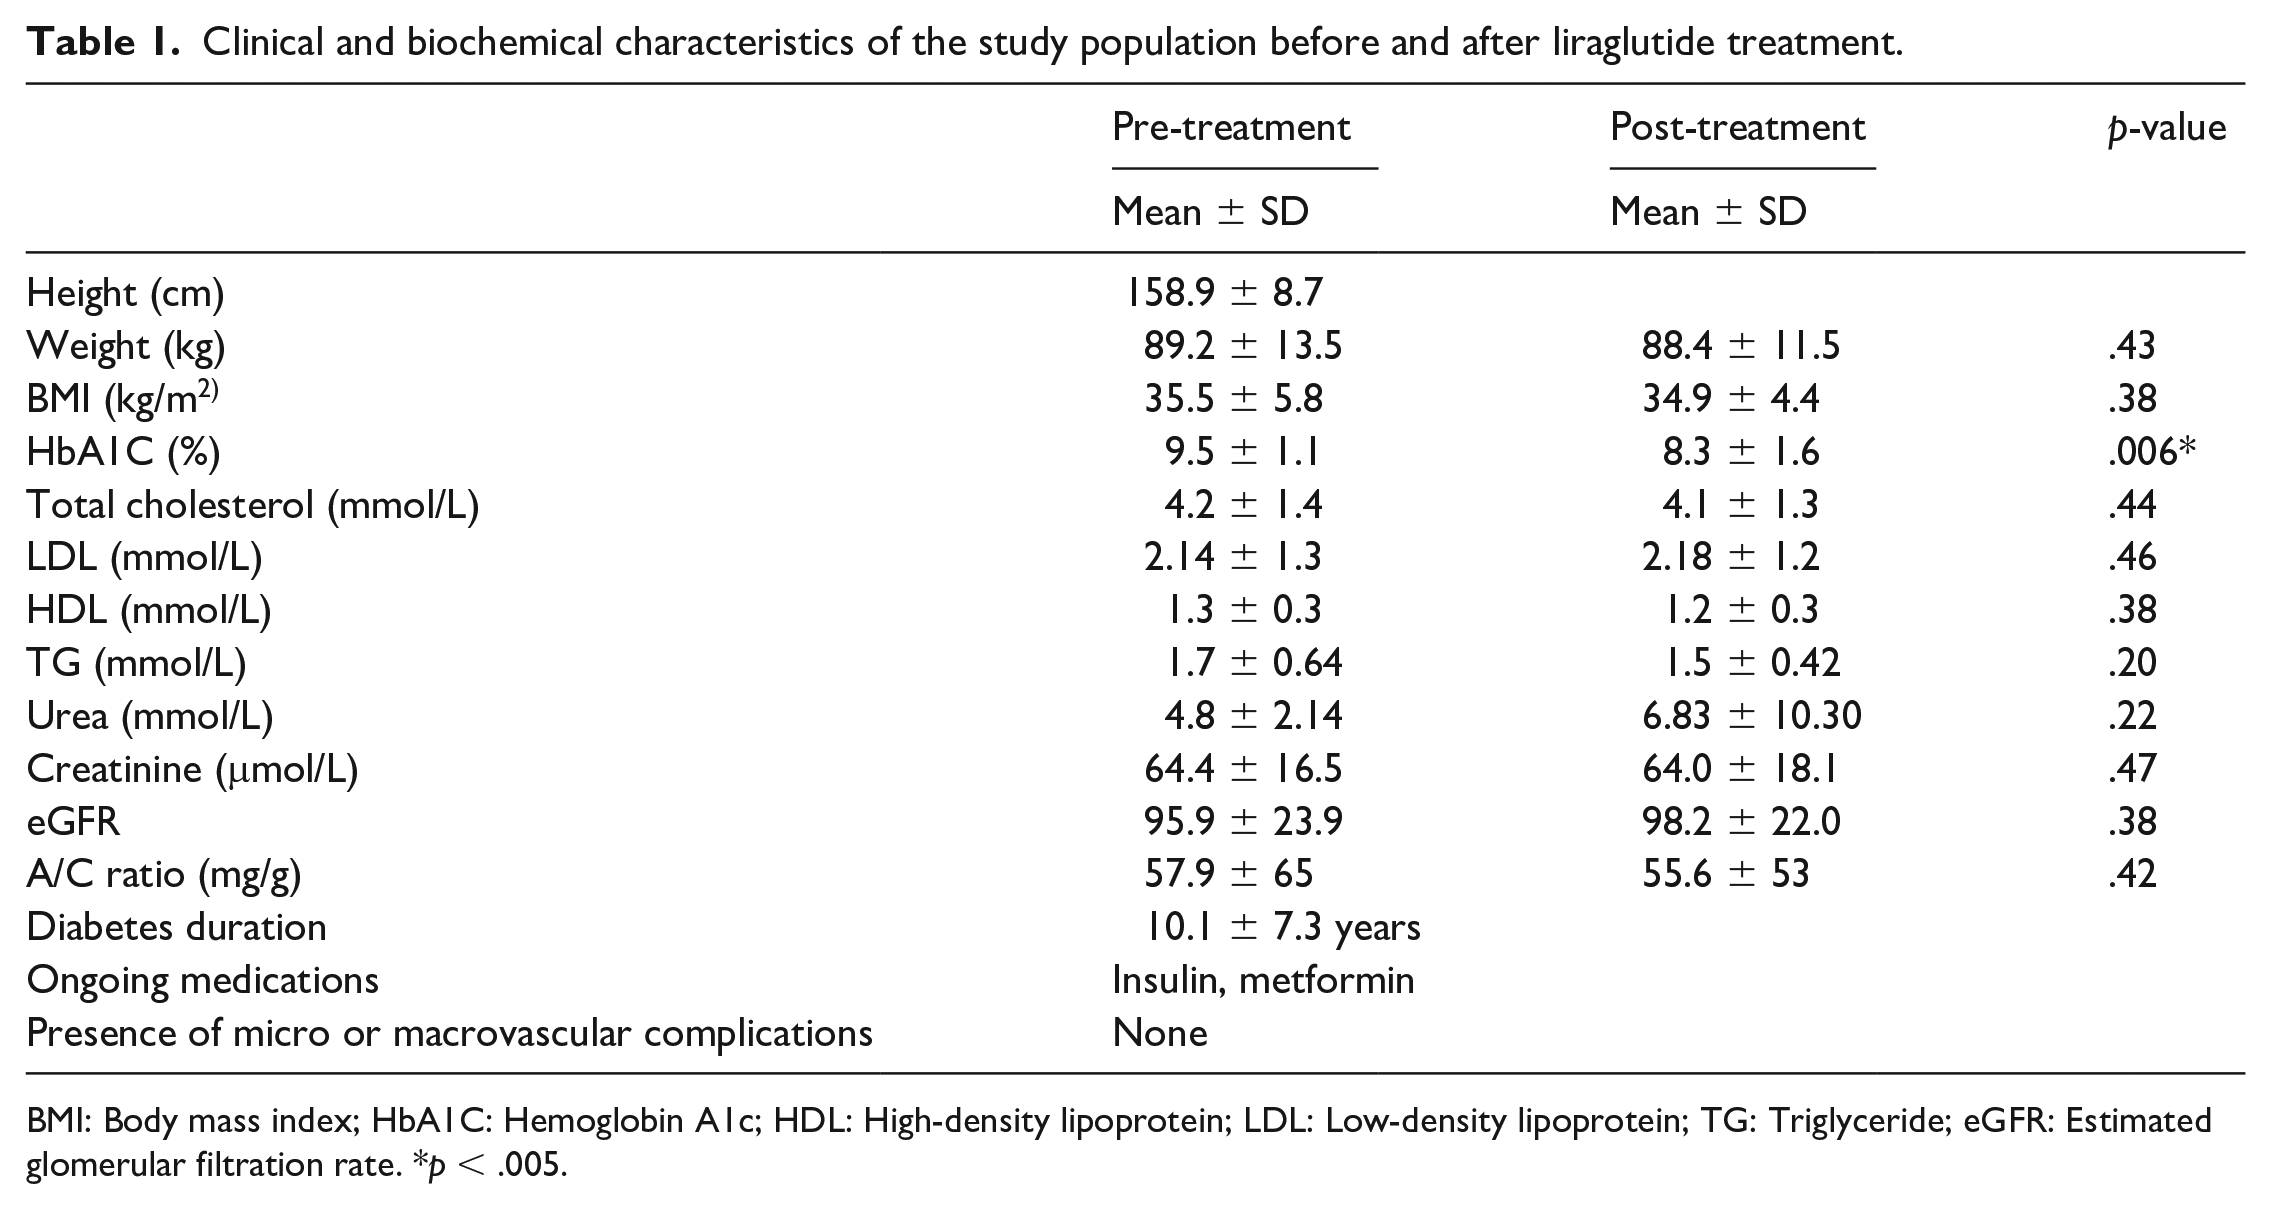
BMI: Body mass index; HbA1C: Hemoglobin A1c; HDL: High-density lipoprotein; LDL: Low-density lipoprotein; TG: Triglyceride; eGFR: Estimated glomerular filtration rate. *p < .005.
Proteomic analysis and identification of differentially expressed proteins
To assess the differential protein expression among 20 liraglutide-treated individuals (40 samples from 20 gels), we performed 2D-DIGE and MALDI-TOF MS. Supplementary Figure S2 shows the representative fluorescent protein profiles of a 2D-DIGE of pre-treatment samples labeled with Cy3 (Supplementary Figure S2(a)), post-treatment samples labeled with Cy5 (Supplementary Figure S2(b)), pooled internal control labeled with Cy2 (Supplementary Figure S2(c)), and merged 2D-DIGE gels of samples labeled with Cy3/Cy5 (Supplementary Figure S2(d)). Supplementary Figure S2 shows a total of 1100 spots identified on the gels, among which 128 were significantly different (ANOVA, p ⩽ .05; fold change ⩾ 1.5) between the pre-treatment and post-treatment samples. The spot patterns were reproducible across all 20 gels, leading to alignment and further analysis. Normalization across the complete set of gels and quantitative differential analysis of the protein levels were achieved using an internal standard with Cy2-labeling. The 128 spots showing statistical significance between the two conditions were then manually excised from the preparative gel for protein identification by MS.
Peptide mass fingerprints successfully identified 72 out of the 128 protein spots excised from the preparative gel. MALDI-TOF mass spectrometry identified 29 spots to be unique protein sequences that were matched to entries in the SWISS-PROT database by Mascot with high confidence scores (Supplementary Table S2). The sequence coverage of the proteins identified by PMF ranged from 11% to 95%. In a few cases, variants of the same protein were found at several locations on the gel (Supplementary Table S2, Supplementary Figure S3). Among the 72 proteins identified, 10 protein spots were upregulated and 62 were downregulated following treatment with liraglutide (Figure 1, Supplementary Table S2, Supplementary Figure S3). The significantly upregulated proteins included SAHH3 (2.02-fold, p = .003), HBB (1.66-fold, p = .003), IC1 (1.71-fold, p = .007), AACT (2.72-fold, p = .008), CDK10 (1.53-fold, p = .015), and A1AT (1.5-fold, p = .018). The significantly downregulated proteins included APOA1 (1.61-fold, p = .019), TRFE (1.69-fold, p = .019), CO3 (1.64-fold, p = .024), APOH (1.67-fold, p = .041), RET4 (1.54-fold, p = .003), A2MG (1.61-fold, p = .004), AKAP9 (2.05-fold, p = .006), and HPT (2.31-fold, p = .014); the full list is provided in Supplementary Table S2. Among the identified proteins, APOA1, TRFE, CO3, CFAB, A2MG, HPT, ALBU, TTHY, APOH, HEMO, K2C1, HBB, AACT, and A1AT were found in more than one spot on the gels, which could be associated with their post-translational modifications, cleavage by enzymes, or the presence of different protein species (Supplementary Tables S2 and S3).
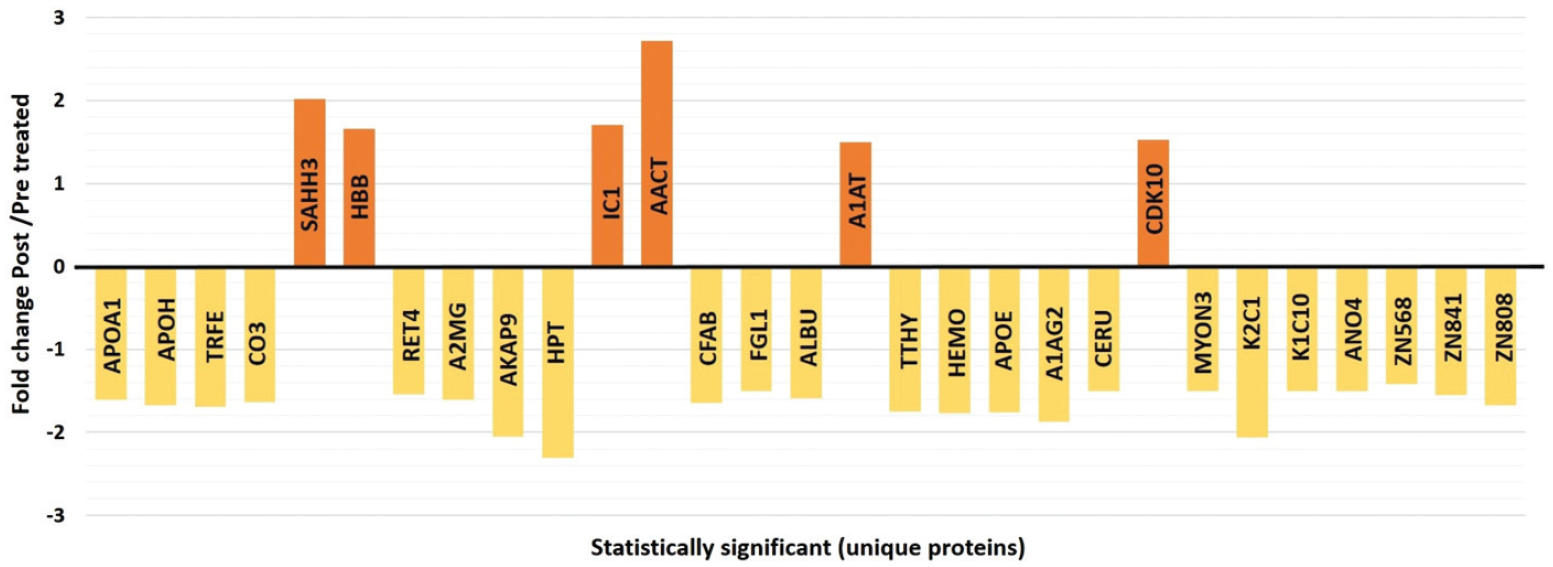
Graphical representation of the alterations in abundance statistically significant unique proteins identified by 2D-DIGE MALDI-TOF analysis between liraglutide pre-treatment and post-treatment states.
Principal component and cluster analysis
Principal component analysis was carried out on all 72 spot features, revealed that the two groups clustered distinctly from one another with 68% cutoff score (Figure 2). The clustering pattern showed that the change in protein intensity for selected spots between liraglutide pre-treatment and post-treatment states were significantly different. Clusters of expression patterns were exhibited by differentially abundant spots based on hierarchical clustering analysis (Supplementary Figure S4(a)–(b)).
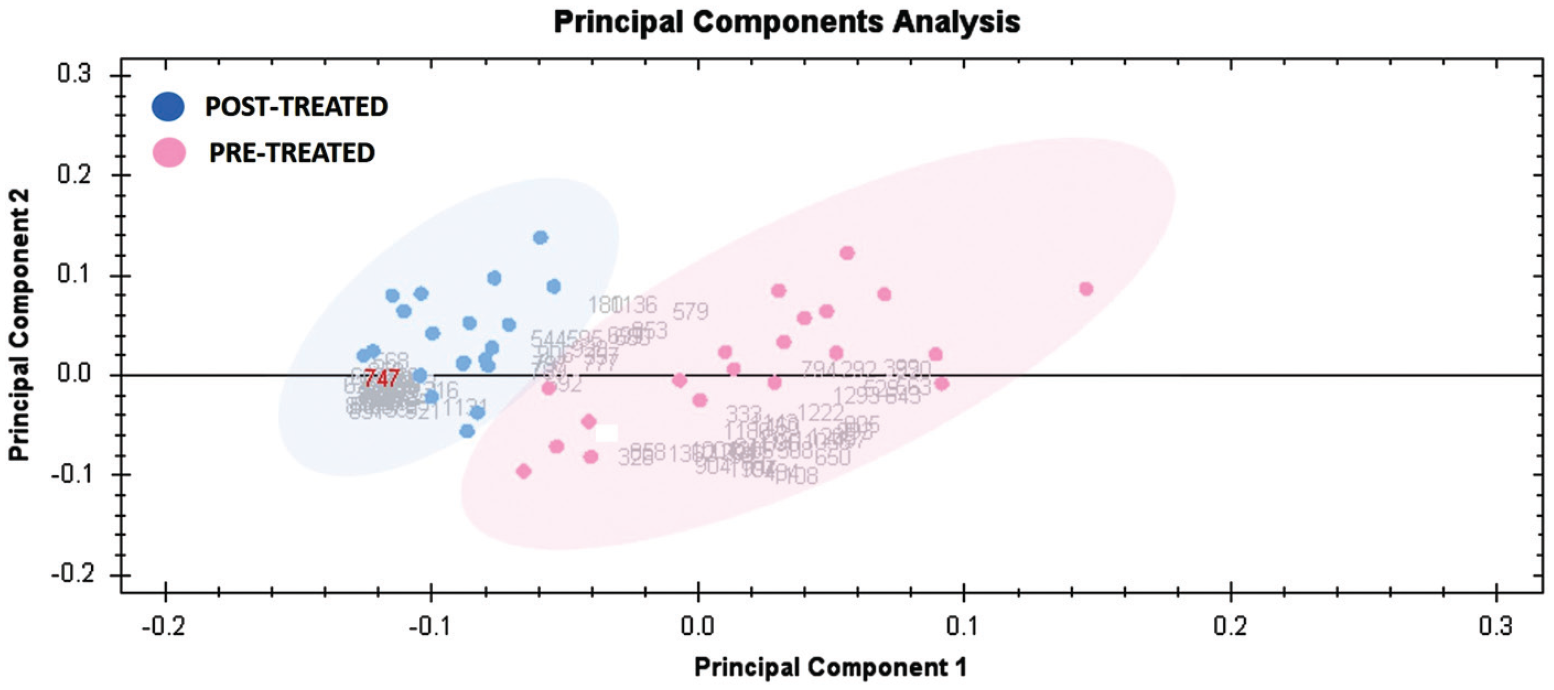
Principal component analysis plot of the two first principal components. Both together explained 68% of the selected spot’s variability. Pink dots denote the plasma samples pre-treatment and blue dots the post-treatment.
Network pathway analysis and functional classification of proteins
Bioinformatic analysis using IPA was performed for all 72 differentially regulated proteins. The analysis revealed that among 72 proteins, 18 proteins interacted either directly or indirectly via protein networks (Figure 3). The software computes a score based on the best fit obtained from the input data set of proteins and the biological functions database to generate a protein-protein interaction network. The generated network is preferentially enriched for proteins with specific and extensive interactions, in which the interacting proteins are represented as nodes and their biological relationships as a line. Based on the data, five interaction networks were identified for proteins exhibiting differential expression profiles. The highest scoring network (score = 42) (Figure 3, Supplementary Figure S5(a)–(b)) incorporated 18 proteins.
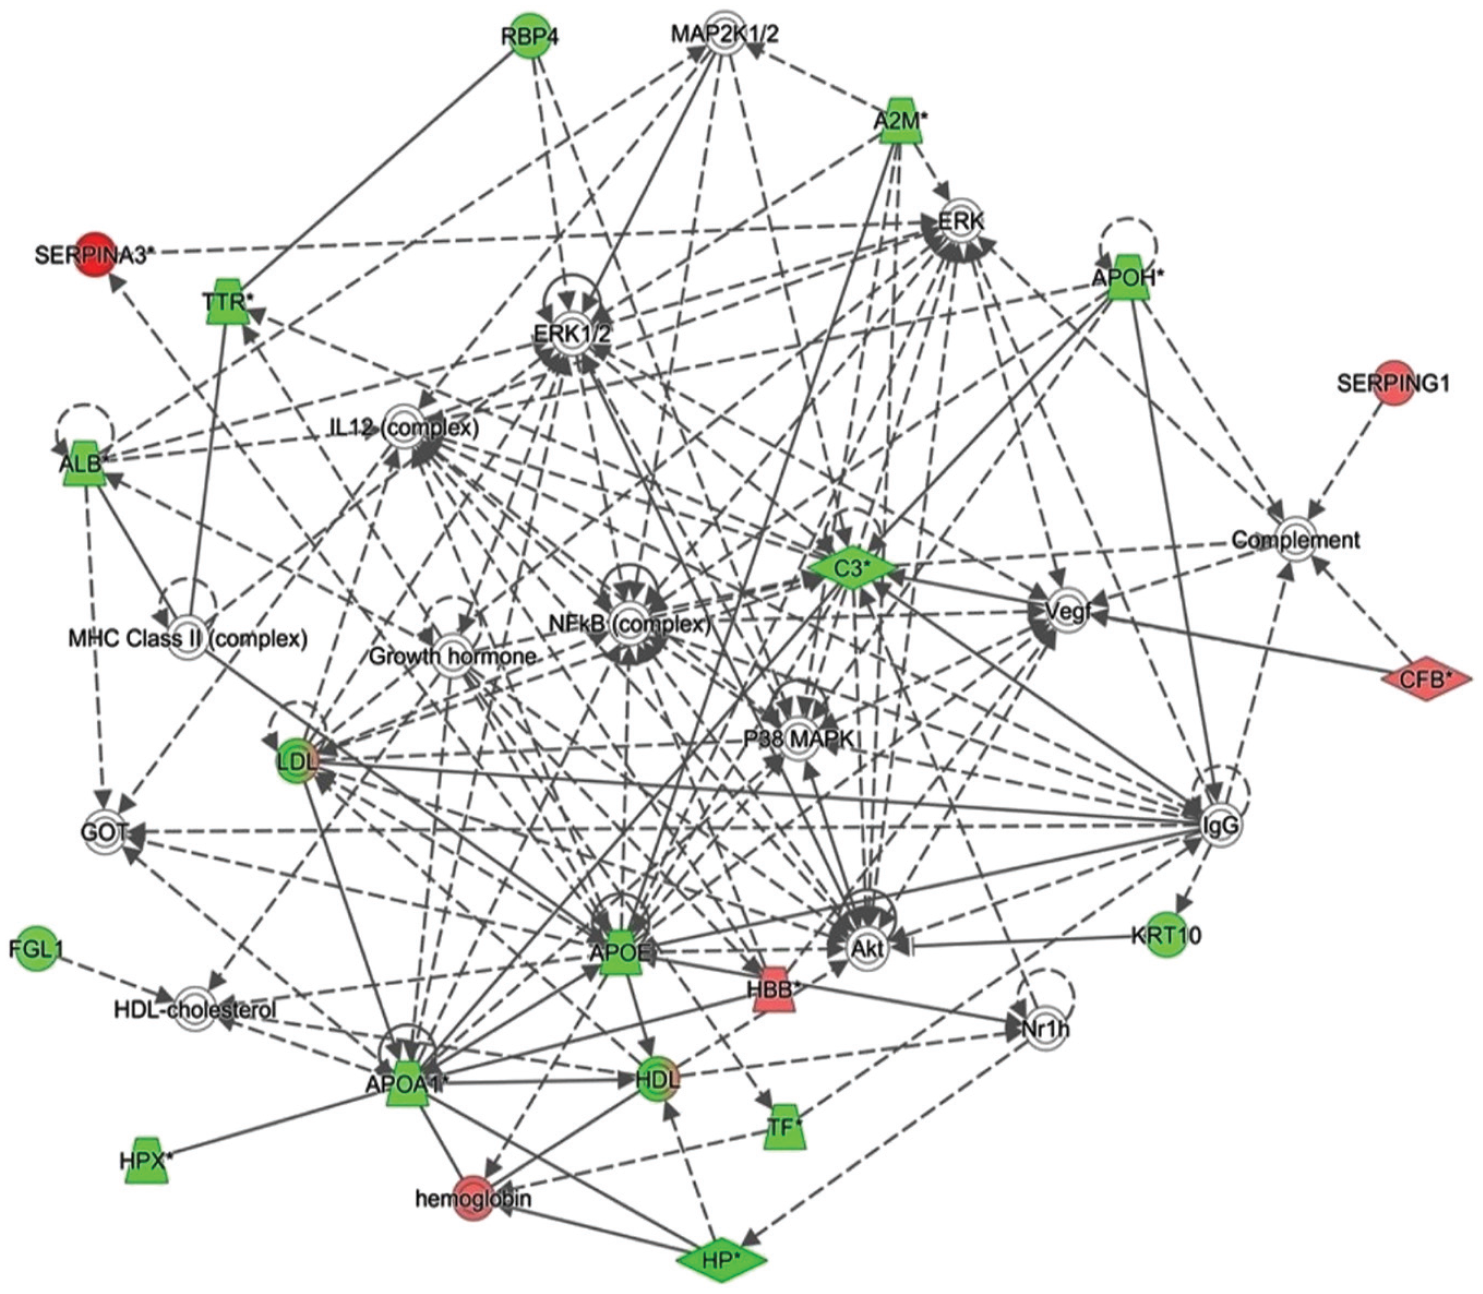
The most enriched interaction network of the differentially expressed proteins in liraglutide pre-treatment compared to the post-treatment states. Red nodes indicate upregulated expression; green nodes indicate downregulated expression. The central nodes of the pathway related to signaling of the NFKB, ERK1/2, and P38 MAPK were found to be deregulated between the two states. Uncolored nodes are proposed by ingenuity pathway analysis and indicate potential targets that were functionally coordinated with the differentially expressed proteins. Solid lines indicate direct molecular interactions, and dashed lines represent indirect interactions.
The PANTHER system was used for the classification of identified proteins according to their molecular functions (Supplementary Figure 6(a)), biological processes (Supplementary Figure 6(b)), cellular components (Supplementary Figure 6(c)), and protein classes (Supplementary Figure 6(d)). The functional category showed that most of the differentially expressed proteins identified were enzymes with catalytic activity (35%), followed by binding proteins (34%) (Supplementary Figure S6(a)). With regards to biological processes, the majority of the identified proteins were involved in cellular processes (29%), followed by biological regulation and adhesion (26%) (Supplementary Figure S6(b)). The majority of the identified proteins were located in the cytoskeleton region (64%), followed by the intracellular region (29%) (Supplementary Figure S6(c)). Regarding the protein class, the majority of the proteins belonged to transfer/carrier proteins (26%) and modulators of protein binding activity (26%) (Supplementary Figure S6(d)).
Confirmation of changes in selected proteins by immunoblotting
Immunoblot assay confirmed the expression of the selected proteins that were differentially abundant by 2D-DIGE analysis (Supplementary Figure S7). The proteins selected for confirmation were Apolipoprotein A-I and retinol-binding protein 4. Immunoblots revealed that the plasma protein expression of Apolipoprotein A-I and retinol-binding protein 4 were decreased respectively, in post-treatment group as compared with pre-treatment group (p ⩽ .05).
Discussion
In the present study, we aimed to demonstrate alterations in the plasma proteome in patients with T2DM before and after receiving add-on liraglutide treatment using an untargeted proteomics approach. We found that post-treatment with liraglutide, the patients showed a significant improvement in their HbA1c levels indicating an improvement in their glycemic control. This improvement was seen irrespective of the minimal change in patient’s weight or in the lipid markers. The patients in our study were given 1.8 mg of Liraglutide that is recommended for glycemic control, while the recommended dose for effective weight loss is 3 mg. This could be a reason as to why the weight loss in our group of patients was not appreciated while another factor could also be due to the short duration of the study. Previous studies have shown that changes in weight and lipid profile are influenced with duration of liraglutide and the dose given. Peradze et al. showed that short-term treatment with high dose liraglutide (3 mg) improved the lipid profile while Rondanelli et al. showed that using it in the short term did not alter the lipid profile significantly.16–18 Treatment with liraglutide was also found to improve the cardiovascular outcomes6,7,9,19–22 although the underlying mechanisms remain unclear. Changes in the plasma proteome reflect changes in whole-body metabolism and provide an unbiased view of protein dynamics with treatment. Our untargeted plasma profiling identified the dysregulation of 72 proteins (62 down and 10 up) between the liraglutide pre-treatment compared to the post-treatment states, which included proteins involved in regulating the acute phase response proteins (APP), enzymes, apolipoproteins, complement proteins, cytoskeletal proteins, and others.
Proteins decreased post-liraglutide treatment
We identified a decrease in the level of abundance of 62 proteins in the liraglutide pre-treatment compared to the post-treatment states (Supplementary Table S2, Figure 3). Liraglutide treatment has been shown to improve the lipid and atherogenic profile with dyslipidemia. Following treatment with liraglutide, a decrease in the levels of two apolipoproteins, Apo A1 and Apo E, are together known to be associated with high-density lipoprotein (HDL) particles. Apo E besides HDL is associated with very low-density lipoproteins (VLDL), intermediate density lipoproteins (IDL), and chylomicron remnants. 23 Previous studies have reported diverging views regarding the role of HDL in CVD, and a few studies have reported decreased HDL levels with liraglutide treatment.16,24 Ariel et al. in their study showed that liraglutide administration had a minimal effect on the lipoprotein profile in overweight/obese persons with prediabetes. 25 On the other hand, Engelbrechtsen et al. in their study identified 80 lipid particles altered with long-term liraglutide treatment. Although their main focus was on the reduced levels of ApoB (an atherogenic marker), their results also showed a simultaneous significant reductions in the levels of ApoA1, similar to our findings. 24 The implications of these changes need to be confirmed by other studies. In contrast, the decrease in ApoE in the post-liraglutide treatment group may reflect a decrease in the levels of triglyceride-rich lipoproteins (VLDL1, VLDL2, and IDL) and LDL, as noted by other studies 26
Another protein identified with a decreased abundance in our study was beta-2-glycoprotein 1/Apolipoprotein H (APOH). APOH is a plasma glycoprotein involved in a range of physiological processes. It is known to have role in atherosclerosis, clot formation, and fibrinolysis being at the interface of inflammation and oxidative stress, making it a clinical marker of cardiovascular risk.27,28 Previous studies have shown that levels of APOH have been associated with development of metabolic syndrome, macrovascular and microvascular complications of T2DM.29–32 Recently, APOH has been shown to interact with proprotein convertase subtilisin/kexin-9, a well-known indirect regulator of circulating LDL in the bloodstream, whose inhibition leads to reductions in LDL cholesterol and improvements in CVD 33 post-treatment with liraglutide. 34 Although there was a significant reduction in the levels of APOH in our study we did not find any associated changes in the serum TG levels. Further mechanistic studies are needed to evaluate this association further.
It has been reported that GLP-1 has anti-inflammatory effects on pancreatic islets and adipose tissue, contributing to lowering glucose levels in individuals with diabetes. 35 The anti-inflammatory benefit of liraglutide was observed as early as 3 months after treatment initiation. A decrease in the acute phase proteins (APP) was noted post-liraglutide treatment group; namely ceruloplasmin, complement C3, complement factor B, haptoglobin, fibrinogen-like protein 1 (positive APP), retinol-binding protein 4, serotransferrin, transthyretin, and hemopexin (negative APP). Atherosclerotic CVD is the major cause of morbidity and mortality in patients with T2DM, and is one of the causes of hyperglycemia and oxidative stress. An increase in the CVD risk is accompanied by increase in levels of fibrinogen, 36 ceruloplasmin, 37 and haptoglobin which are accepted independent determinants in individuals with T2DM. 38 A decrease in the levels of these proteins indicates a decrease in the systemic inflammatory response and indirectly point to a decrease in the development of CVD. In addition to the above-mentioned proteins, albumin, alpha-1-acid glycoprotein, and alpha 2 macroglobulin, also classified as APP, were found to decrease in the liraglutide post-treatment group. A reduction in the levels of these proteins could indicate a reduction in the inflammatory state post-treatment with liraglutide. In addition to the reduction in systemic inflammation, liraglutide is also known to reduce inflammation in vascular endothelial cells and protect against inflammation-triggered endothelial dysfunction. Treatment with liraglutide has been shown to ameliorate inflammatory pathways. Our findings are in line with Bouchi et al. who reported an improvement in the micro-inflammation in individuals treated with liraglutide for 6 months. 39
Two complement proteins Complement C3 (CO3) and Complement Factor B (CFAB) were noted to have significant decreased abundance after liraglutide treatment. CO3 is an emerging risk marker for cardiovascular and metabolic diseases while CFAB is known to be elevated in adipose tissue and serum from patients with T2DM and CVD. 40 Interestingly, the reduction of both these proteins, whose increase reflects a worsening cardio-metabolic profile, was decreased after short-term liraglutide treatment in the present study.
Proteins increased in abundance post-liraglutide treatment
Proteomic profiling before and after treatment with liraglutide resulted in a significant differential increase in proteins, namely; adenosylhomocysteinase-3, alpha-1-plasma protease C1 inhibitor, antichymotrypsin, alpha-1-antitrypsin, hemoglobin subunit beta, and cyclin-dependent kinase 10. Among these, an interesting protein identified in our study was S-adenosyl homocysteinase (SAHH3). SAHH3 is an enzyme that participates in the reversible hydrolysis of S-adenosyl homocysteine (SAH) to adenosine and homocysteine. Increased plasma homocysteine and SAH levels have been associated with an increased risk of CVD and heart failure.41,42 Furthermore, elevated cellular concentrations of SAH are likely to precede and accompany all forms of hyperhomocysteinemia, an independent risk factor for CVD. 43 Atherogenic mouse models have shown that the inhibition of SAHH3 results in elevated plasma SAH levels and induces endothelial dysfunction 44 more than homocysteine. We did not identify any previous studies that have identified alterations in the levels of SAHH3 after liraglutide treatment. Further studies will be needed to establish its role as a marker of CVD in patients treated with liraglutide.
Network pathway analysis highlighted NfKb, p38 kinases, Akt, ERK1/2, and MAPK1/2 as the central signaling molecules with the highest connectivity to the significantly differentially abundant proteins in our data set. The identified pathways are mainly responsible for the regulation of the inflammatory pathogenic process contributing to the progression of T2DM and the development of CVD. NF-κB is recognized as a key nuclear transcriptional factor that regulates the expression of a number of inflammation-related genes. Post-treatment with liraglutide is known to ameliorate inflammation, and one of its mechanisms of action is through the inhibition of NF-κB phosphorylation and its translocation from the cytoplasm to the nucleus. This mechanism may underlie the potential anti-inflammatory and anti-atherosclerotic effects of GLP-1 agonists. Previous studies have shown that liraglutide’s action via the GLP-1 receptor modulates the ERK1/2 and PI3K/Akt signaling pathways and helps in reducing hyperglycemia.45,46 Liraglutide is known to inhibit NF-κB activation 30 and ERK1/2 and JNK, which are also involved in its activation and the induction of inflammatory cytokines and chemokines. 35
The strength of the study lies in the fact our study is the first to identify proteomics changes in diabetic patients treated with liraglutide. On the other hand, limitations of study are that the 2D-DIGE mass spectrometry technique is both expensive and labor and time intensive that greatly increases the cost and time for carrying out the experiments. Another weakness of the study is the smaller number of patients and the small duration of the treatment for the patients.
Conclusion
To summarize, in this study, we report the plasma proteomic profile of patients with T2DM altered with the use of liraglutide, a GLP-1 agonist. Benefits of liraglutide treatment may stem from the combined effects of alterations in proteins related to inflammation, altered apolipoprotein regulation, and decreased oxidative stress. These changes together help to improve not only glycemia and weight loss, but also effectively mediate the anti-atherosclerotic and cardio-metabolic effects of liraglutide. The findings of our study need to be validated in a larger cohort of patients to support the findings of our pilot study and also carry out the same for patients using the medication for a longer duration of time. The findings from our study can be used as potential biomarkers for assessing the cardiovascular benefit post-treatment with Liraglutide.
Supplemental Material
sj-docx-1-dvr-10.1177_14791641221094322 – Supplemental material for Plasma proteomics reveals an improved cardio-metabolic profile in patients with type 2 diabetes post-liraglutide treatment
Supplemental material, sj-docx-1-dvr-10.1177_14791641221094322 for Plasma proteomics reveals an improved cardio-metabolic profile in patients with type 2 diabetes post-liraglutide treatment by Aishah A Ekhzaimy, Afshan Masood, Hicham Benabdelkamel, Tasnem Elhassan, Mohthash Musambil and Assim A Alfadda in Diabetes & Vascular Disease Research
Footnotes
Acknowledgements
We wish to acknowledge Mr Shahid Nawaz, Mr Ousman Mahmoud Ousman, and Ms Amina Fallata for their assistance in the laboratory work.
Author contributions
AAE, AAA, AM, and HB conceived and designed the study. AAA, AAE, and TE were involved in patient recruitment. HB and MM performed the proteomic lab work. AM, HB, MM, and AAA conducted the data analysis and wrote the manuscript. All authors have read and agreed to the published version of the manuscript.
Declaration of conflicting interests
The author(s) declared no potential conflicts of interest with respect to the research, authorship, and/or publication of this article.
Funding
The author(s) disclosed receipt of the following financial support for the research, authorship, and/or publication of this article: This project was funded by Dallah HealthCare, Kingdom of Saudi Arabia and Grant number CMRC-DHG-1/003.
Ethical approval
All procedures and protocols, including clinical samples, were reviewed and approved by the Institutional Review Board of the College of Medicine, King Saud University, Riyadh, Saudi Arabia (registration no. E-18-3075)
Informed consent
Informed consent was obtained from all participants involved in the study.
Data availability
All data generated or analyzed in the current study are included in this article.
Supplemental Material
Supplemental Material - Plasma proteomics reveals an improved cardio-metabolic profile in patients with type 2 diabetes post-liraglutide treatment
Supplementary Material for Plasma proteomics reveals an improved cardio-metabolic profile in patients with type 2 diabetes post-liraglutide treatment by Aishah A Ekhzaimy, Afshan Masood, Hicham Benabdelkamel, Tasnem Elhassa, Mohthash Musambil, and Assim A Alfadda in Diabetes and Vascular Disease Research.
References
Supplementary Material
Please find the following supplemental material available below.
For Open Access articles published under a Creative Commons License, all supplemental material carries the same license as the article it is associated with.
For non-Open Access articles published, all supplemental material carries a non-exclusive license, and permission requests for re-use of supplemental material or any part of supplemental material shall be sent directly to the copyright owner as specified in the copyright notice associated with the article.