
Abstract
Purpose
Triglyceride-glucose (TyG) index is a reliable and inexpensive alternative indicator of insulin resistance. Previous studies have shown that elevated TyG index increases the risk of diabetes, coronary heart disease, and other diseases, but the relationship between TyG index and cardiac hemodynamics in patients with type 2 diabetes mellitus (T2DM) is not clear. This study was conducted in patients with T2DM to assess the relationship between TyG and cardiac hemodynamics and its predictive ability for T2DM.
Methods
A total of 647 individuals (348 males and 299 females) were enrolled in this study, including 446 T2DM patients and 201 healthy controls. The clinical data and related laboratory variables were assessed and recorded, and TyG index was calculated. Cardiac hemodynamics was measured by echocardiography. Pearson or Spearman correlation analysis and linear regression analysis were conducted to explore the association between TyG and cardiac hemodynamics. The receiver operating characteristics (ROC) curve was used to evaluate the efficacy of TyG index in the diagnosis of T2DM.
Results
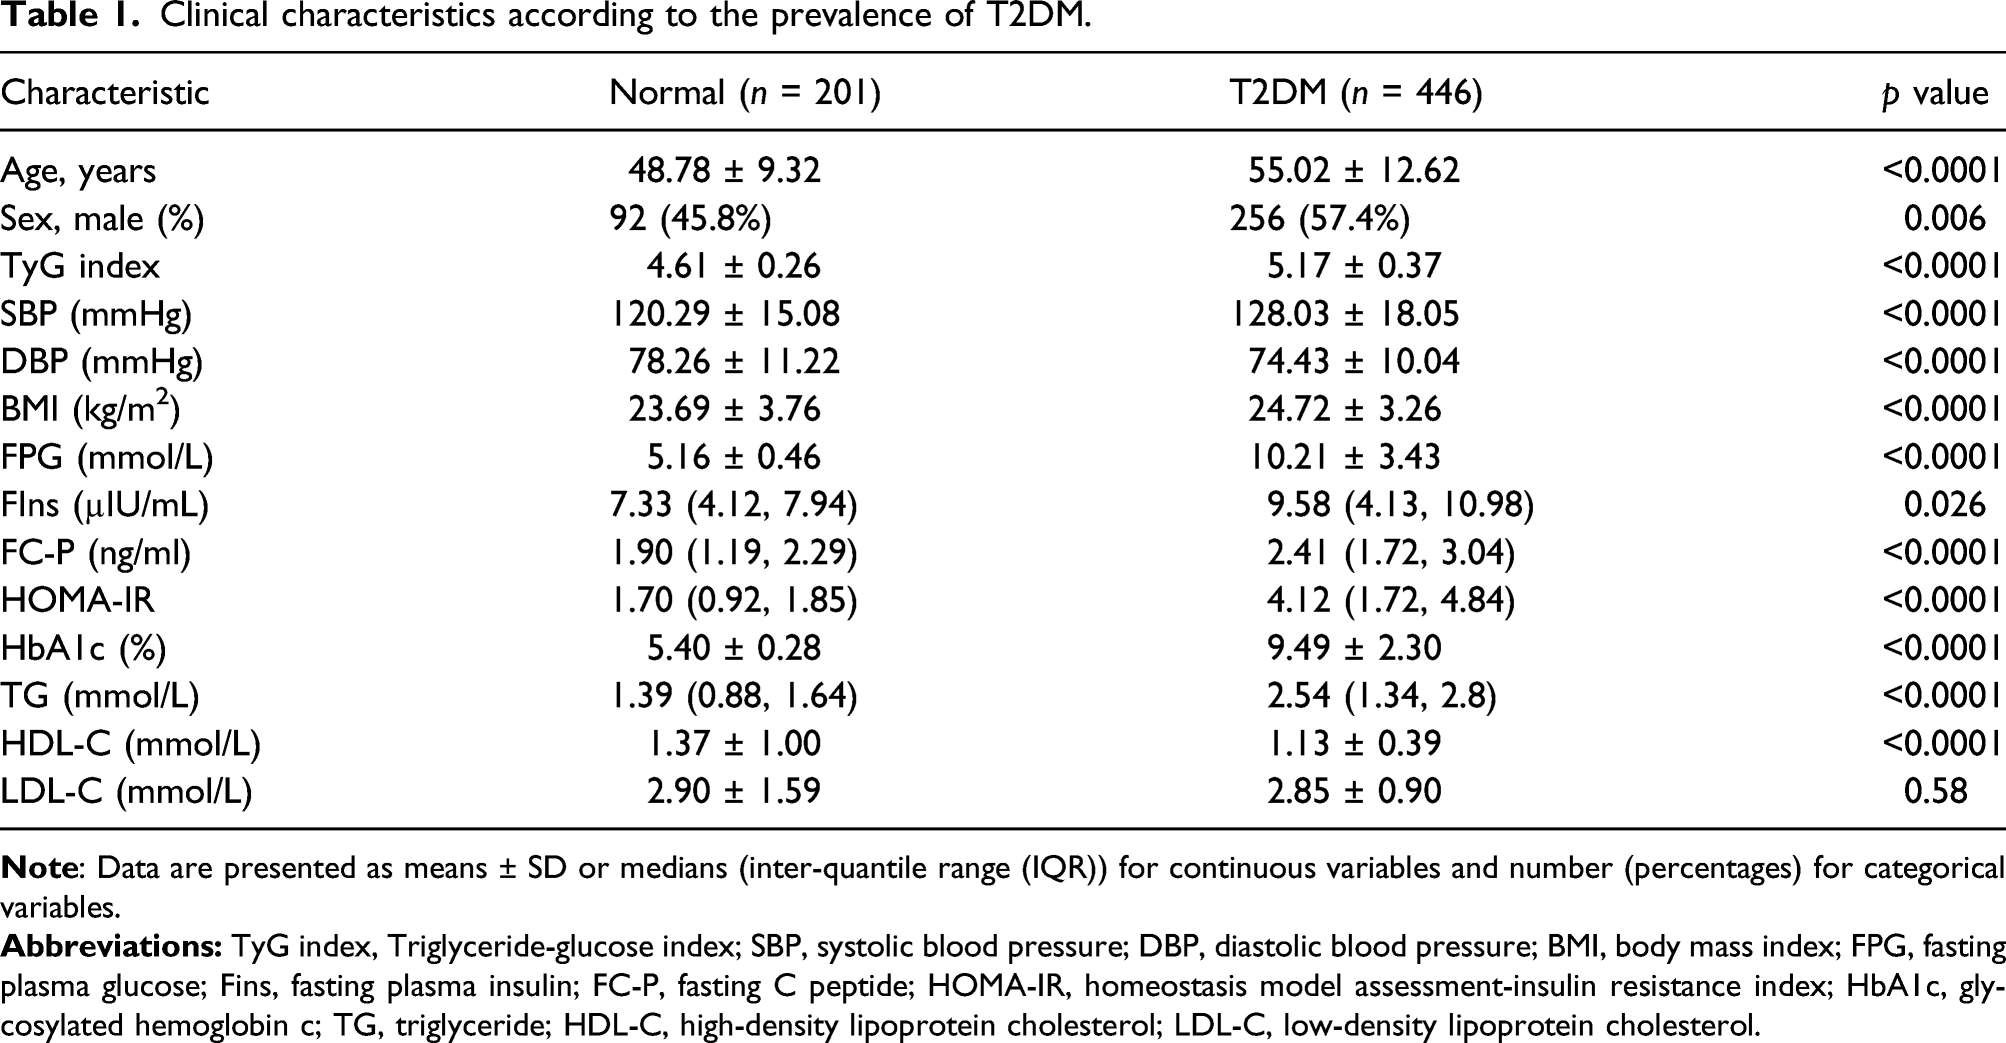
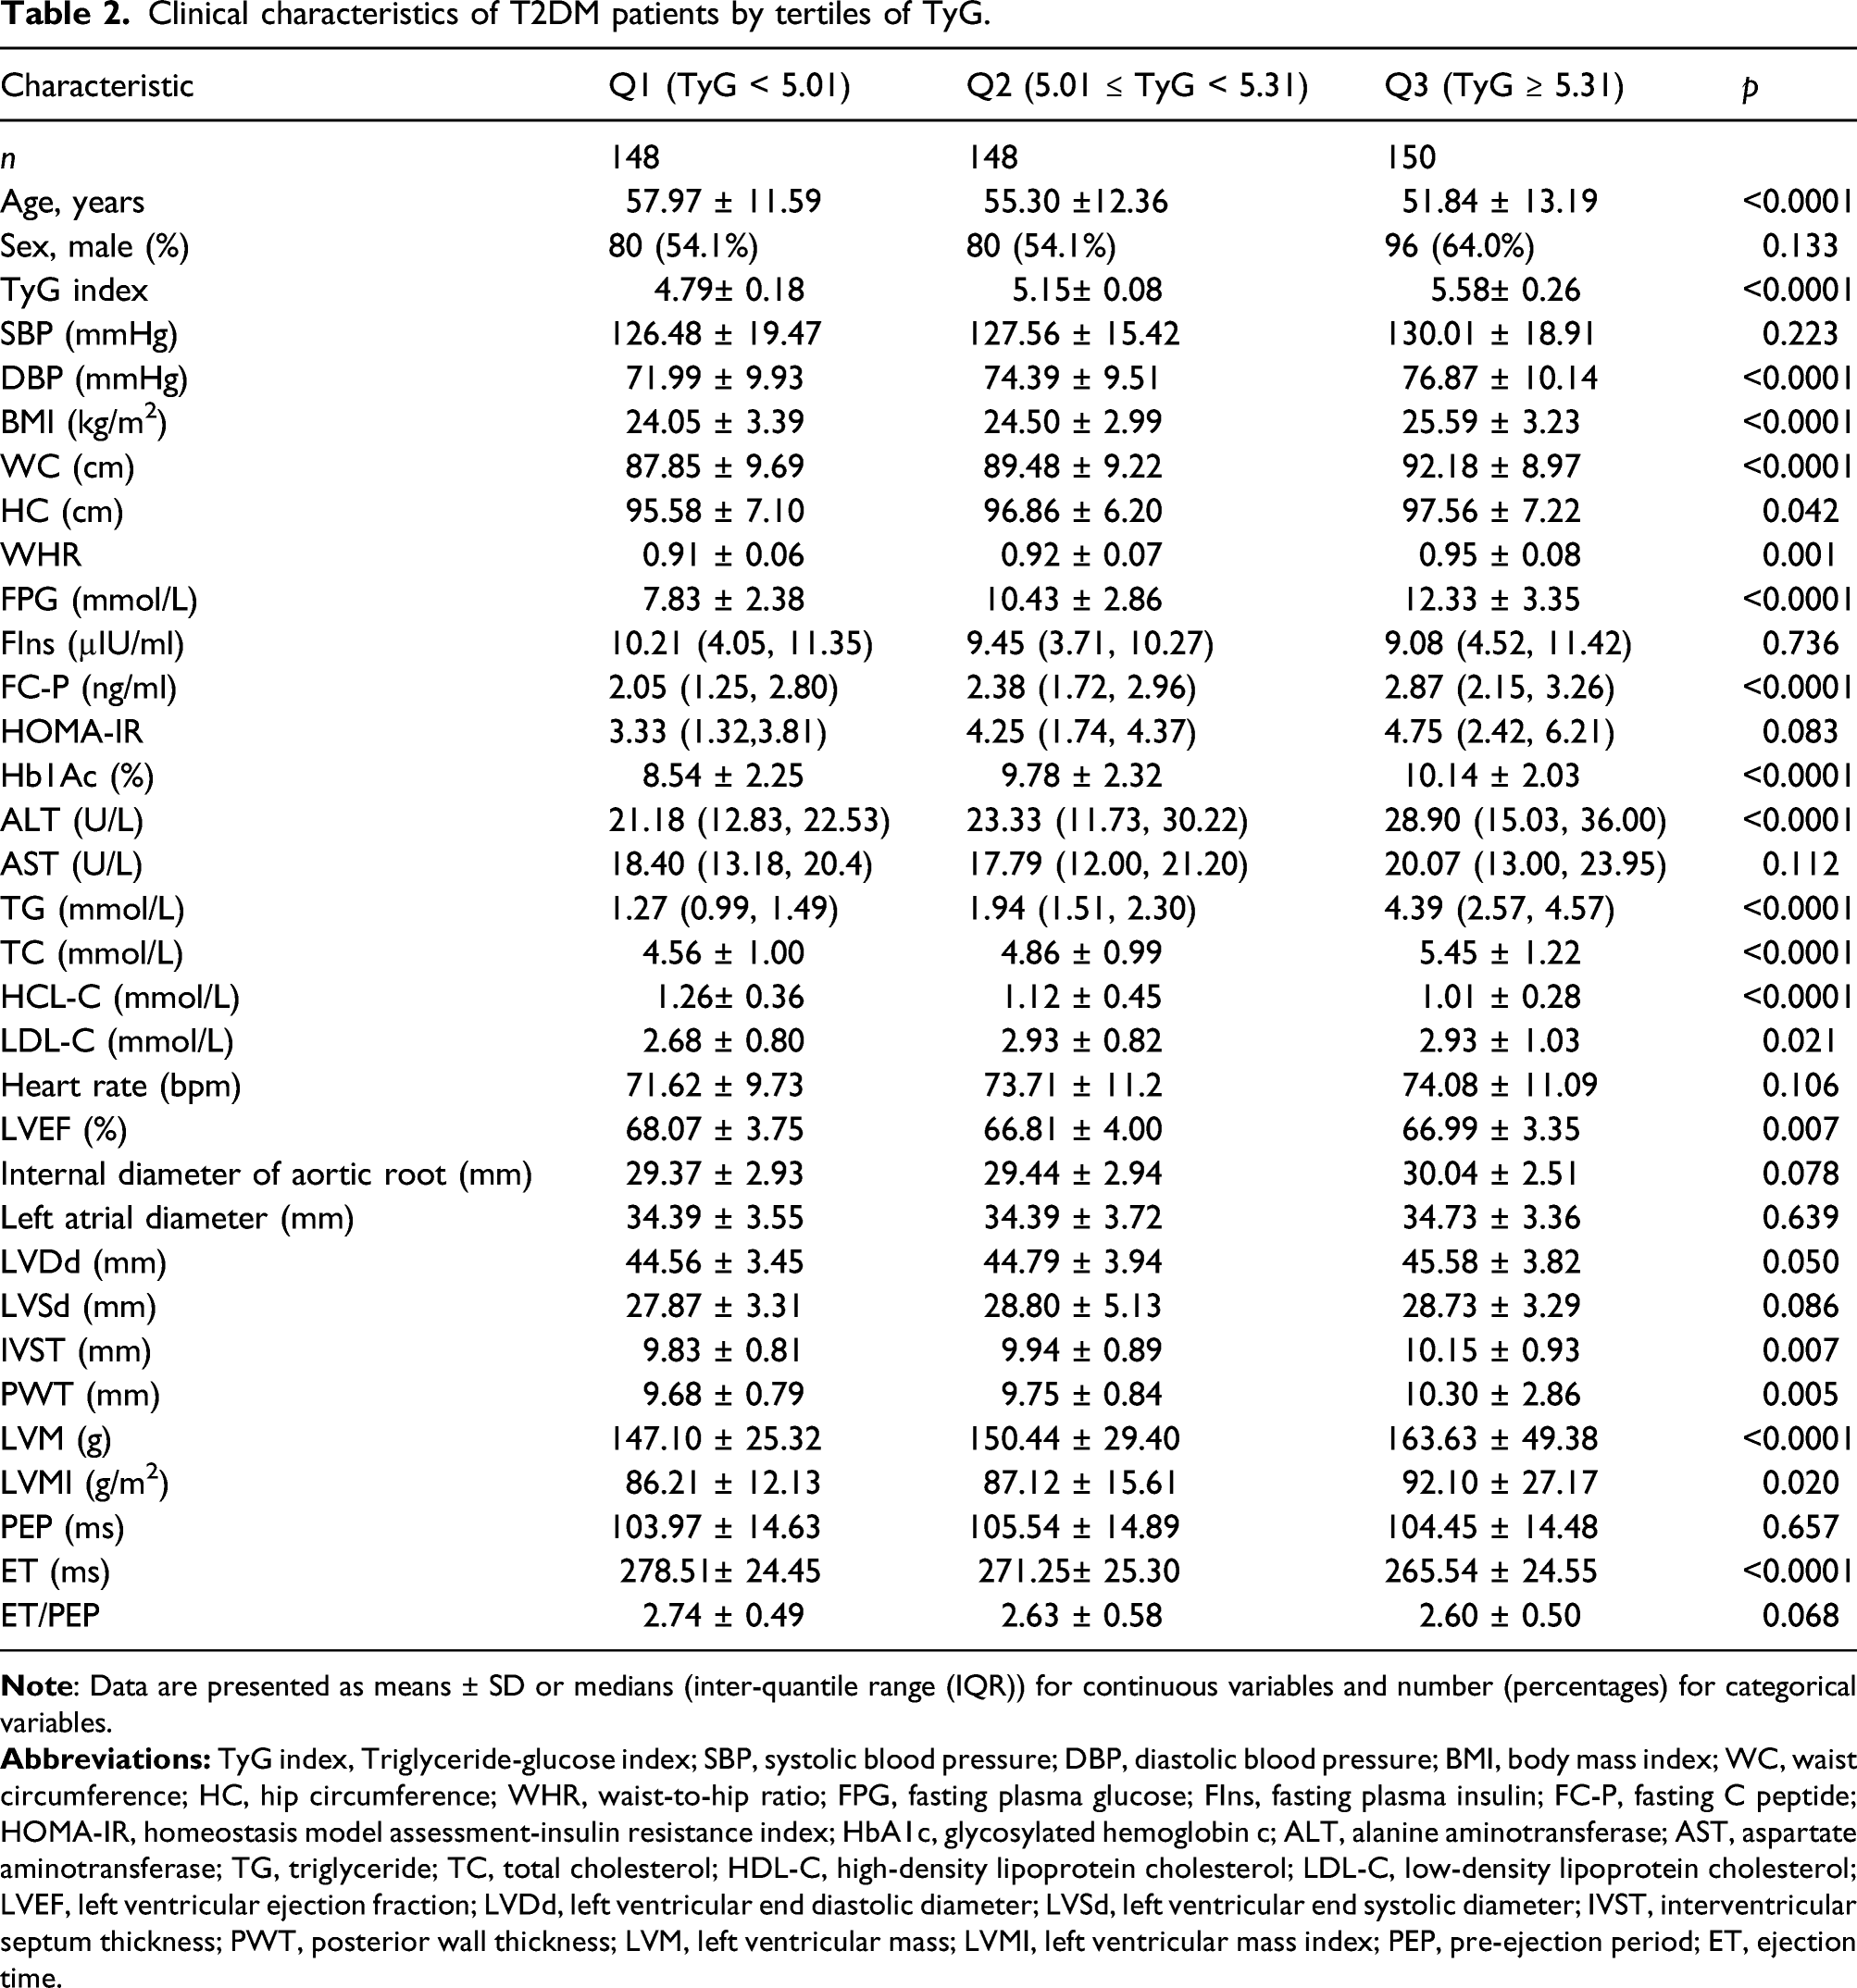
Compared with healthy controls, the systolic blood pressure (SBP), body weight, body mass index (BMI), waist circumference (WC), hip circumference (HC), HOMA-IR, and TyG levels were higher in patients with T2DM. With the increase of TyG, the levels of left ventricular mass index (LVMI), left ventricular mass (LVM), left ventricular end diastolic diameter (LVDd), posterior wall thickness (PWT), and interventricular septum thickness (IVST) were also increased in T2DM individuals. Multivariate linear regression analysis showed that TyG was an independent determinant of LVEF, PWT, IVST, and ejection time (ET) after adjusting for confounding factors. In addition, individuals with visceral obesity had higher TyG and TyG can be used as a predictor of T2DM with an AUC of 0.903 (95% CI:0.879–0.927).
Conclusions
The increase of TyG index is closely related to cardiac hemodynamics of T2DM patients, which is expected to be a simple and practical biological index to predict the changes of cardiac function in patients with T2DM.
Keywords
Introduction
Type 2 diabetes mellitus (T2DM) has become a global public health problem. With the improvement of people’s living standards and the change of lifestyle, the prevalence of T2DM is increasing year by year. According to the latest data of the International Diabetes Federation (IDF) in 2019, about 463 million adults worldwide suffer from diabetes, and it is estimated that by 2045, the number of diabetic patients may reach 700 million. The number of deaths resulting from diabetes and its complications in 2019 is estimated to be 4.2 million, 1 among which diabetic macrovascular disease was the leading cause of death in patients with T2DM. 2 Diabetic macrovascular disease mainly refers to coronary heart disease, cerebrovascular disease, and peripheral artery disease caused by or combined with T2DM, which is the main cause of death and disability of T2DM. 3 The occurrence of diabetic macrovascular disease is a complex process involving many factors. Its etiology and pathogenesis are very complicated, which has not been fully elucidated. The main pathological manifestation of diabetic macrovascular disease is atherosclerosis and its sequelae of vascular injury. 4 Studies have shown that insulin resistance is a high-risk factor in the occurrence and development of atherosclerosis.5,6 Therefore, early screening and diagnosis of insulin resistance is of great significance in the detection and treatment of cardiovascular diseases in T2DM patients.
At present, the gold standard of clinical evaluation of insulin resistance is hyper insulinemic-euglycemic clamp (HIEC), but this method requires high cost.
7
Therefore, a simplified mathematical model triglyceride-glucose index (TyG) was proposed to evaluate insulin resistance.
8
TyG is a formula for evaluating insulin resistance based on serum triglyceride (TG) levels and fasting plasma glucose (FPG) levels, which was calculated as
Methods
Study design and patients
A total of 647 individuals were enrolled in this study, including 201 healthy controls and 446 asymptomatic T2DM patients who received diabetes health education in the Department of Endocrinology of Affiliated Hospital of Jiangsu University from June 2019 to February 2020. Among them, there were 348 males and 299 females, ranging from 15 to 76 years old, and the average age was 53 ± 12 years old. T2DM patients all met the diagnostic criteria of diabetes recommended by the World Health Organization (WHO) in 1999. 18 The following conditions should be excluded for all included patients: (1) patients with incomplete clinical and biochemical data; (2) patients with type 1 diabetes mellitus, special type diabetes mellitus, gestational diabetes mellitus, acute complications of diabetes mellitus and infectious diseases; (3) patients with severe liver or thyroid dysfunction, or with renal diseases caused by urinary tract infection, kidney stones, lupus nephritis, renal malignancy, hypertension, etc; (4) patients with severe cardiovascular diseases such as coronary atherosclerotic heart disease, congestive heart failure, severe arrhythmia, cardiac valve replacement, and cardiac pacemaker; (5) patients with definite familial hyperlipidemia and familial hypertension; (6) patients who have recently used glucocorticoids or antipsychotics; (7) patients with tumor, autoimmune diseases, or hematological diseases. This study was approved by the Ethics Committee of Affiliated Hospital of Jiangsu University, and all individuals’ written informed consent was obtained.
Physical examination
All individuals maintained a normal diet and stable exercise, avoided high-fat diet other than daily life, and fasted for 8–12 h the night before the examination. The gender, age, course of T2DM, hypertension, and other general clinical characteristics were collected in the morning. Height, weight, waist circumference (WC), hip circumference (HC), heart rate, and blood pressure (BP) were measured by professionals according to the standard method. Fasting venous blood was collected 4–5 mL and centrifuged at 4000 R/min for 5 min with a centrifugal force of 2860 × g, and then serum was collected.
Laboratory measurement
Fasting plasma insulin (FIns) and fasting C-peptide (FC-P) were measured by radioimmunoassay, and fasting plasma glucose (FPG) was measured by glucose oxidase method. Hemoglobin glycosylated (HbA1c) was determined by high performance liquid chromatography (HPLC). The total cholesterol (TC), TG, HDL-C, and LDL-C were measured by enzyme method.
Measurement of triglyceride-glucose and cardiac hemodynamics
Data measurements
The homeostasis model assessment of insulin resistance index (HOMA-IR) was calculated as
Statistical analysis
Statistical analysis was performed using SPSS 20.0(SPSS Inc, Chicago, IL, USA). Categorical variables were expressed as percentages, and continuous variables were expressed as mean ± standard deviation (SD). Univariate analysis of variance (ANOVA) was used for comparison between groups, and Bonferroni adjusted post-test was performed. According to the TyG index, patients with T2DM were divided into low TyG (Q1) group (TyG < 5.01, n = 148), middle TyG (Q2) group (5.01 ≤ TyG < 5.31, n = 148), and high TyG (Q3) group (TyG ≥ 5.31, n = 150). Pearson or Spearman correlation analysis was used to analyze the relationship between variables. Linear regression analysis was performed to determine the correlation between clinical and laboratory variables with cardiac function parameters. The cardiac hemodynamics were used as the dependent variable and the TyG index as the independent variable to carry out the multivariate linear regression analysis. Four models were set up, unadjusted model did not adjust the confounding factors, model 1 adjusted gender and age; model 2 adjusted gender, age, SBP, DBP, and BMI; and model 3 further adjusted smoking history, drinking history, and diabetes medication history. Moreover, in order to compare the differences of clinical characteristics and cardiac hemodynamics among the groups, SBP ≥ 140 mmHg and/or DBP ≥ 90 mmHg were regarded as hypertension group, and the rest of the individuals were regarded as non-hypertension group. The male WHR ≥ 0.9 and female WHR ≥ 0.85 were regarded as visceral obesity group, and the other individuals were regarded as visceral obesity group. All significance tests were performed by two-tailed test, and p < 0.05 was considered statistically significant.
Results
Comparison of clinical characteristics between two groups of individuals
Clinical characteristics according to the prevalence of T2DM.
Comparison of clinical characteristics and cardiac hemodynamics according to the tertiles of triglyceride-glucose in type 2 diabetes mellitus individuals
Clinical characteristics of T2DM patients by tertiles of TyG.
Linear regression analysis of triglyceride-glucose and cardiac hemodynamics
Multivariate linear regression analysis between cardiac hemodynamics and TyG.
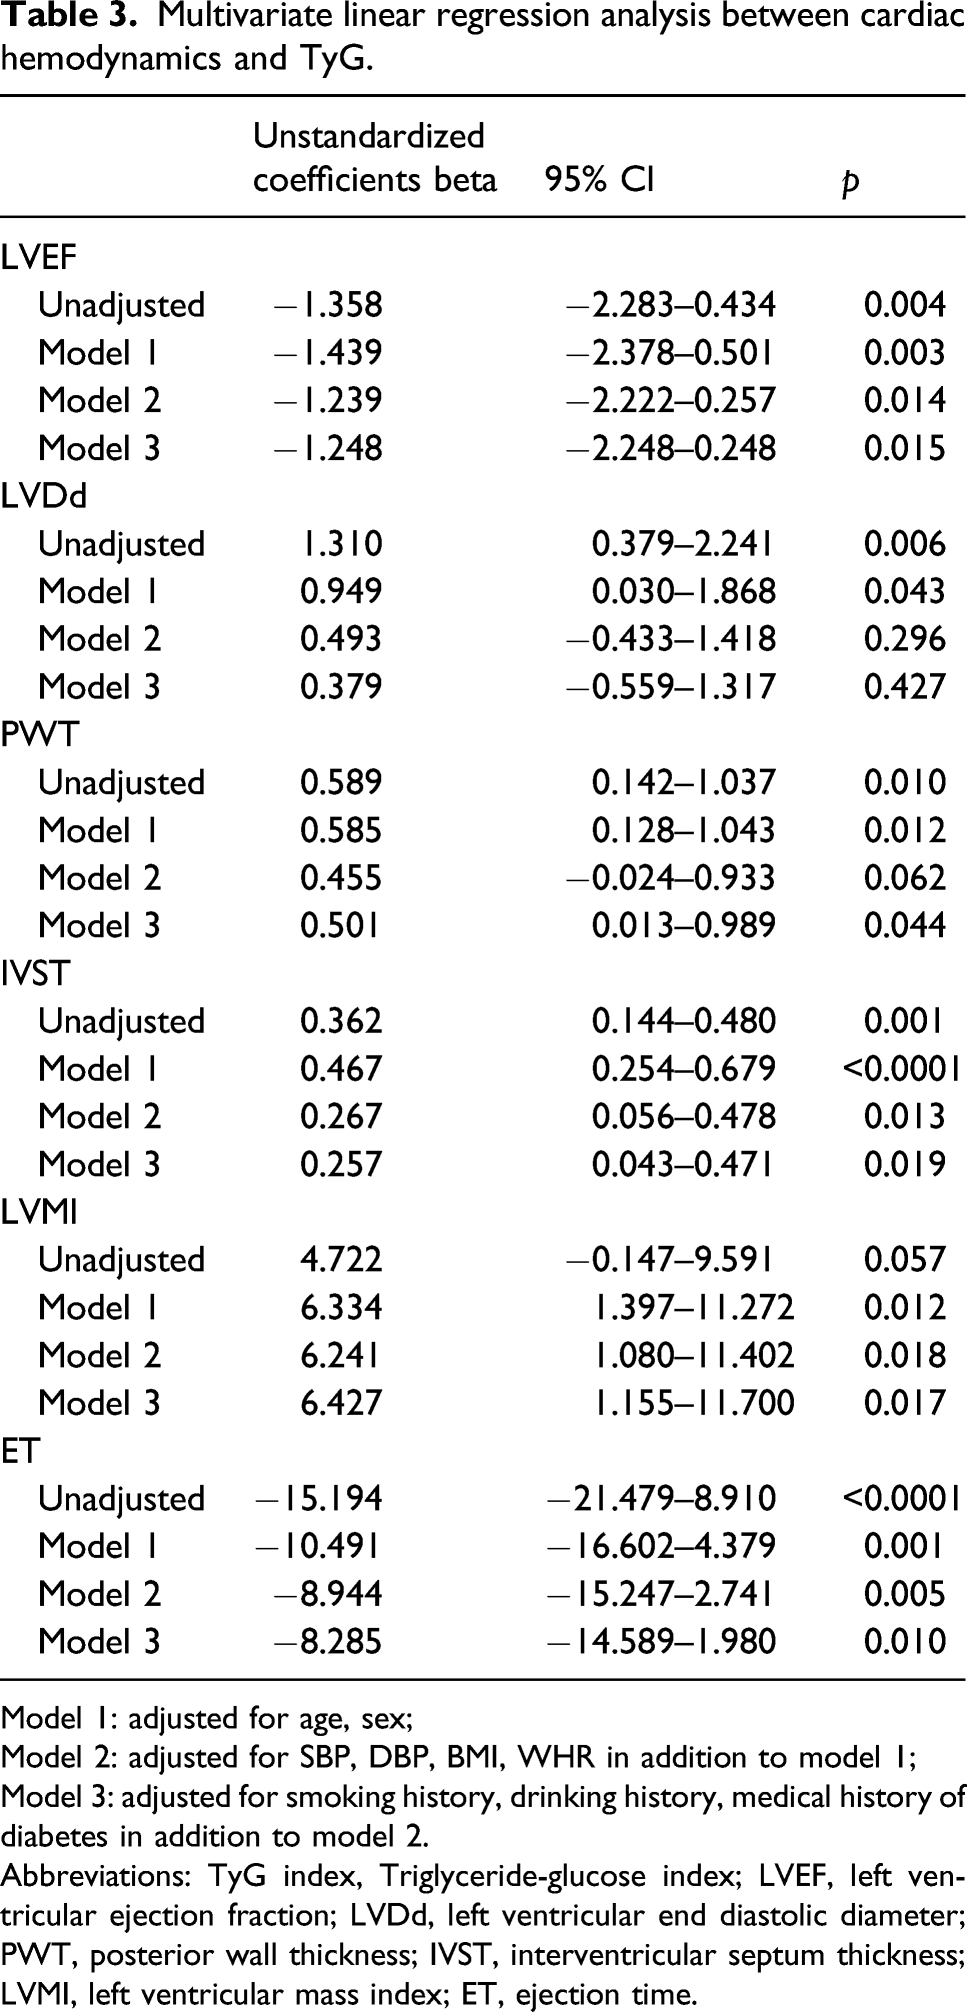
Model 1: adjusted for age, sex;
Model 2: adjusted for SBP, DBP, BMI, WHR in addition to model 1;
Model 3: adjusted for smoking history, drinking history, medical history of diabetes in addition to model 2.
Abbreviations: TyG index, Triglyceride-glucose index; LVEF, left ventricular ejection fraction; LVDd, left ventricular end diastolic diameter; PWT, posterior wall thickness; IVST, interventricular septum thickness; LVMI, left ventricular mass index; ET, ejection time.
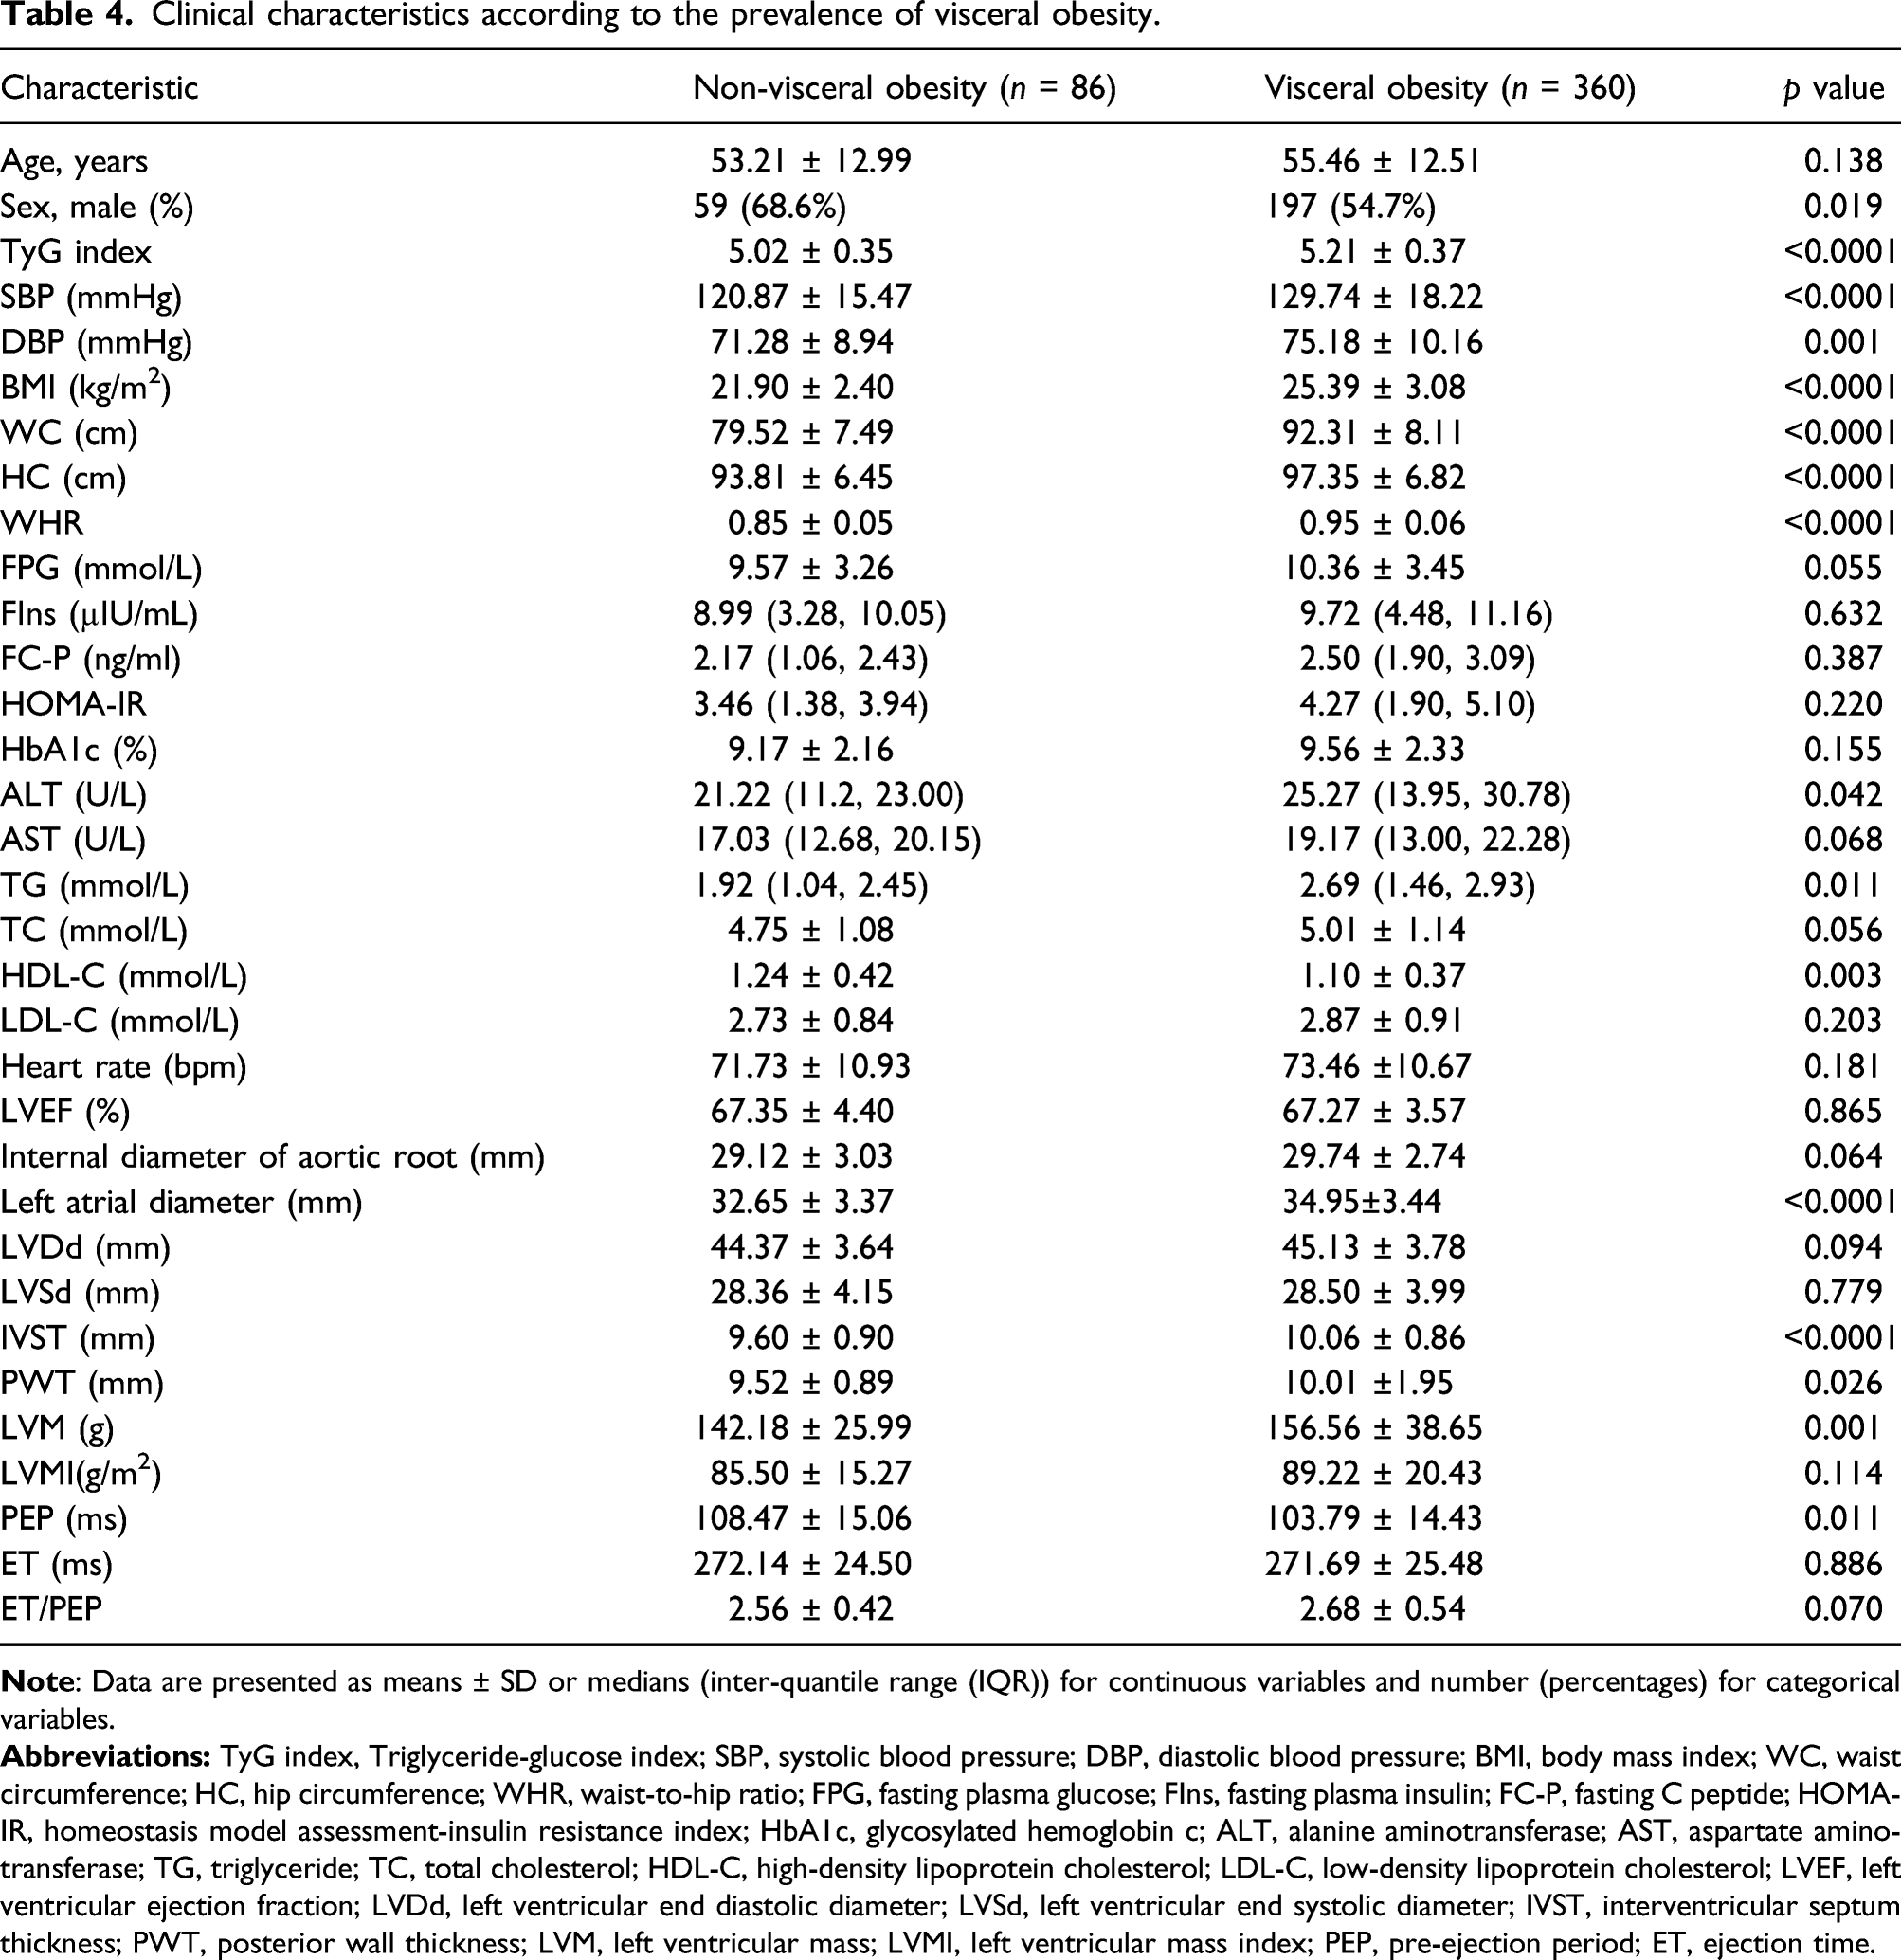
Comparison of clinical characteristics according to the prevalence of hypertension and visceral obesity
Clinical characteristics according to the prevalence of visceral obesity.
Receiver operating characteristics curve analysis of triglyceride-glucose prediction of type 2 diabetes mellitus risk
Figure 1 shows the performance of TyG for predicting the risk of T2DM. The results showed that the area under ROC curve (AUC) predicted by TyG was 0.903 (95%CI: 0.879–0.927) and the difference was considered statistically significant (p < 0.0001). When TyG was 4.83, the maximum Youden index was 0.667, so 4.83 was the optimal cut-off value, with a sensitivity of 84.1% and a specificity of 82.6%. ROC curve analysis of TyG prediction of T2DM risk.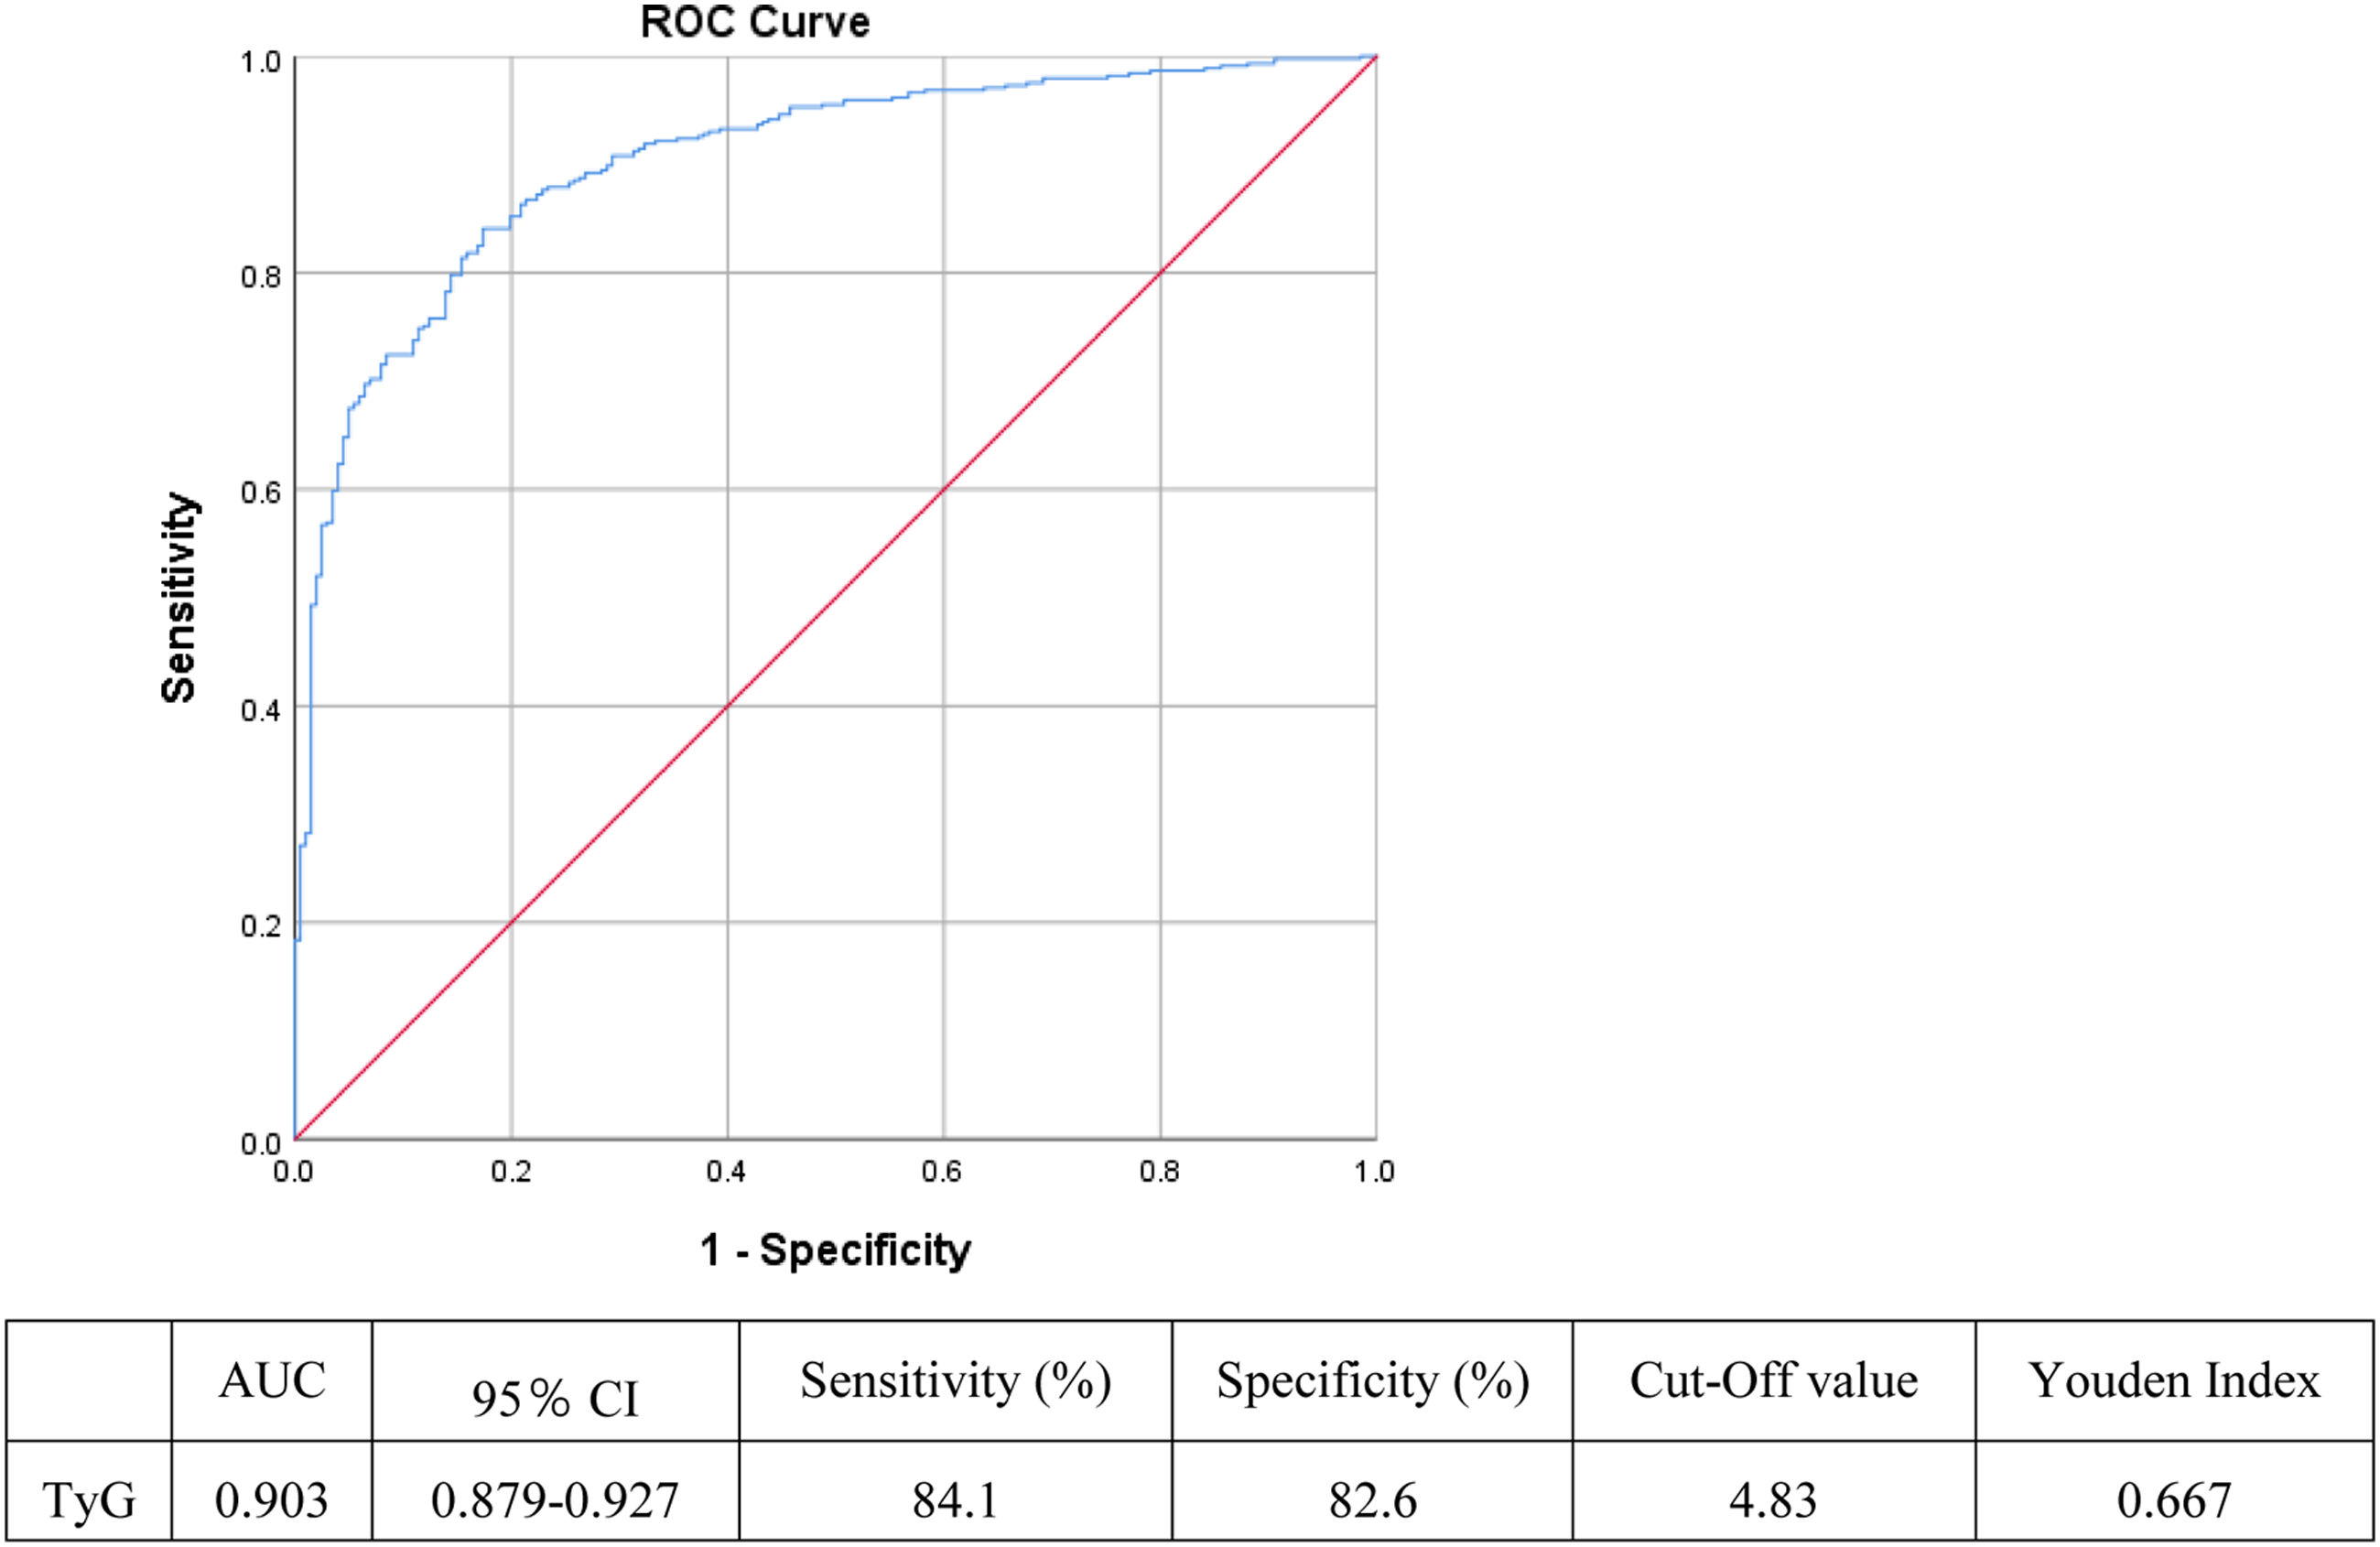
Correlation between triglyceride-glucose and cardiac hemodynamics
As is shown in Supplementary Table 1, TyG was positively correlated with LvDd, LVSD, PWT, IVST, LVM, and aortic root diameter and was negatively correlated with LVEF, ET, and ET/PEP.
Correlation between cardiac hemodynamics and other clinical characteristics
In Supplementary Table 2, we analyzed the correlation between cardiac hemodynamics and general clinical characteristics and the results showed that these hemodynamic parameters were all correlated with WHR (p < 0.05). Parameters including LVEF, LVDd, LVSd, LVM, PWT, IVST, and aortic root diameter were positively correlated with DBP, SBP, and BMI (p < 0.05). LVM was also significantly correlated with TG (r = 0.155, p = 0.001) and FPG (r = 0.125, p = 0.009). LVEF was significantly correlated with TG (r = − 0.110, p = 0.020) and WHR (r = − 0.117, p = 0.014).
Discussion
The results of our study showed that TyG index of T2DM patients was significantly higher than that of healthy controls, which is consistent with the previous results.21,22 More importantly, this study observed the relationship between TyG index and cardiac hemodynamics in patients with T2DM for the first time. The results showed that BMI, SBP, DBP, and HOMA-IR in Q3 group were higher than those in the other two groups, and TyG index was correlated with cardiac hemodynamics. In addition, this study also found that TyG is closely related to visceral obesity, which is a risk factor of cardiovascular complications in T2DM. These results together indicated that TyG index is significantly associated with the development of cardiovascular risk factors in T2DM patients.
Insulin resistance is one of the earliest metabolic abnormalities leading to T2DM, and it is the key factor of the pathogenesis of T2DM. 23 This study first observed the difference of TyG index between normal people and patients with T2DM. The results showed that compared with healthy controls, HOMA-IR and TyG levels in patients with T2DM were higher, which was consistent with other existing studies.24–26 HOMA-IR is calculated based on fasting insulin level and is not suitable for clinical patients who are currently using insulin therapy. Therefore, TyG index may be more suitable as an indicator of metabolic syndrome and T2DM than HOMA-IR or TG/HDL-C. 25 It has been found in different studies that TyG index can predict the risk of diabetes. A 6-year follow-up study of 5706 rural Chinese with normal BMI showed that the risk of T2DM rises with the increase of TyG index. 12 A cohort study of metabolic diseases in Korea found that the incidence rate of diabetes increased proportionally with the TyG index quartile. After adjusting for age, gender, BMI, WC, SBP, HDL-C, family history of diabetes, smoking, drinking, and FIns, the risk of diabetes of the highest TYG index quartile was more than four times higher than that of the lowest TyG index quartile. A retrospective analysis conducted by Li et al. 21 showed that the increased TyG index was independently correlated with the increased risk of diabetes in Chinese adults. The ROC curve of our Study also showed that the predictive value of TyG for T2DM risk is 0.903. In conclusion, the TyG index may be a reliable predictor of early risk screening of diabetes, especially in the population without high-risk factors, such as old age, hypertension, and obesity. 21
As an indicator of insulin resistance, the relationship between TyG and cardiovascular disease is also widely concerned. Studies have shown that higher TyG index level is associated with poor prognosis in patients with acute ST-segment elevation myocardial infarction, 27 higher cardiovascular mortality in patients with peritoneal dialysis, 28 and future cardiovascular adverse events in patients with diabetes mellitus and acute coronary syndrome. 29 High TyG index is also associated with micro and macrovascular lesions in patients with T2DM. 30 Many studies have investigated the relationship between TyG index and the occurrence of cardiovascular events in different patient groups, including non-diabetic and diabetic patients.31–33 In patients with T2DM, the TyG index has also been proved to be a better predictor of cardiovascular events than HbA1c. 34 Similar studies in South Korea confirmed TyG’s independence in describing potential cardiovascular disease.35,36 However, few studies have explored the relationship between TyG index and cardiac hemodynamics, which can be used to assess cardiac function and may predict the risk of cardiovascular disease. This study found that TyG was positively correlated with cardiac hemodynamics such as LVDd, LVSd, PWT, IVST, LVM, and aortic root diameter and negatively correlated with LVEF. This result is partly consistent with the study of Chiu, 37 in which TyG was considered to be negatively correlated with LVEF in the general population. The inconsistent part is that TyG is not correlated with LVM in that research, while in our study, TyG is positively correlated with LVM. The reasons for this difference may be attributed to different individuals recruited, different diseases of the tested population, and the influence of drugs used by the individuals. In future clinical practice, patients with T2DM and elevated TyG can be recommended to undergo comprehensive clinical assessment of their cardiovascular risk profile and be considered for echocardiography when necessary. Meanwhile, research exploring the diagnostic performance of TyG index to early detect structural heart disease in people with diabetes is further required.
It is well known that long-term and sustained obesity can significantly increase the incidence of diabetes, 38 and obesity, hypertension, and hyperlipidemia play vital role in the occurrence and development of macrovascular complications of T2DM. Chronic hypertension may cause endothelial dysfunction and inflammation, accelerate lipid deposition, and lead to the occurrence and development of atherosclerosis and ventricular hypertrophy.39,40 In addition, adipose tissue dysfunction caused by visceral fat accumulation can also produce angiotensin, which may lead to systemic hypertension. 41 Therefore, we further grouped the individuals according to whether there was hypertension or visceral obesity, to explore whether these two factors would affect the value of TyG in T2DM patients. The results showed that TyG was not related to blood pressure, but closely related to visceral obesity. The TyG index, DBP, SBP, TG, PWT, IVST, LVM, and left atrial diameter of visceral obesity individuals were higher than those of non-visceral obesity individuals, the difference was statistically significant. This is consistent with previous findings of our research group. It showed that visceral obesity has a certain impact on exploring the relationship between TyG and hemodynamic index in T2DM patients, which further proved the necessity of adjusting confounding factors such as BMI and WHR in linear regression analysis.
Few studies have discussed the relationship between TyG index and cardiac hemodynamics. The advantage of this study is that we can evaluate the relationship between TyG index and cardiac function by cardiac hemodynamics, which may provide a certain theoretical basis for early diagnosis and intervention of cardiac failure. Meanwhile, the study also has some limitations. First of all, the results of this study are only applicable to patients with early T2DM, because patients with confirmed macro and microvascular diseases have been excluded from the study population according to the exclusion criteria. Second, when comparing healthy controls with T2DM, there was a significant difference in age and gender between the study population—T2DM patients were older and more men. These two factors may have some effects on the differences between groups. Third, because this is a cross-sectional study, we cannot conclude the causal relationship between TyG and cardiac hemodynamics so that further longitudinal follow-up studies are needed to verify their relationship.
Conclusion
In conclusion, the increase of TyG index is closely related to the cardiac hemodynamics of T2DM patients and is expected to be a new and practical biological indicator for predicting the changes of cardiac function in T2DM patients.
Supplemental Material
sj-pdf-1-dvr-10.1177_14791641221083396 – Supplemental Material for Association of triglyceride-glucose with cardiac hemodynamics in type 2 diabetes
Supplemental Material, sj-pdf-1-dvr-10.1177_14791641221083396 for Association of triglyceride-glucose with cardiac hemodynamics in type 2 diabetes by Chenxi Wang, Zhicong Zhao, Xia Deng, Zhensheng Cai, Tian Gu, Lian Li, Chang Guo, Dong Wang, Ling Yang, Li Zhao and Guoyue Yuan in Diabetes and Vascular Disease Research
Footnotes
Author Contributions
Guoyue Yuan designed the study;
Chenxi Wang, Zhicong Zhao, Xia Deng, Zhensheng Cai, Tian Gu, Lian Li, and Chang Guo participated in acquisition of data;
Ling Yang, Dong Wang, and Li Zhao evaluated the literature and edited and revised the manuscript;
Chenxi Wang and Zhicong Zhao performed data collation and statistical analysis;
Chenxi Wang wrote the first draft of the manuscript.
All authors read and approved the final manuscript for publication.
Declaration of conflict of interest
The authors declare that the research was conducted in the absence of any commercial or financial relationships that could be construed as a potential conflict of interest.
Funding
The author(s) disclosed receipt of the following financial support for the research, authorship, and/or publication of this article: This work was supported by the National Natural Science Foundation of China (81870548, 81570721), the Social Development Project of Jiangsu Province (BE2018692), the Natural Science Foundation of Jiangsu Province, China (BK20191222), the Scientific Research Projects of Jiangsu Health and Family Planning Commission (Y2018109), the High Caliber Medical Personnel Foundation of Jiangsu Province (LGY2016053), the Six Talent Peaks Project in Jiangsu Province (2015-WSN-006), the Social Development Project of Zhenjiang City (SH2019041) and the Fifth “169 project” Scientific Research Project of Zhenjiang City, Jiangsu Province.
Supplemental Material
Supplemental material for this article is available online.
References
Supplementary Material
Please find the following supplemental material available below.
For Open Access articles published under a Creative Commons License, all supplemental material carries the same license as the article it is associated with.
For non-Open Access articles published, all supplemental material carries a non-exclusive license, and permission requests for re-use of supplemental material or any part of supplemental material shall be sent directly to the copyright owner as specified in the copyright notice associated with the article.