
Abstract
Aim:
To evaluate the hypothesis that measurement of fasting plasma triglyceride concentration identifies individuals at enhanced risk of statin-induced type 2 diabetes mellitus.
Methods:
A retrospective analysis of data collected from routine health examinations in non-diabetic, East Asian individuals (n = 5790) with low-density lipoprotein cholesterol concentrations of ⩾3.4 mmol/L. Subjects were stratified into those with or without a triglyceride concentration of ⩾1.7 mmol/L, and comparisons made of risk factors for type 2 diabetes mellitus.
Results:
Approximately 40% of men and 20% of women with elevations of both low-density lipoprotein cholesterol and triglyceride concentrations were more insulin resistant (homeostatic model assessment of insulin resistance), associated with higher plasma concentrations of HbA1c, glucose and insulin.
Conclusion:
Apparently, healthy, non-diabetic East Asian men and women with combined elevations of low-density lipoprotein cholesterol and triglyceride concentrations are glucose intolerant and insulin resistant, and thereby at enhanced risk of type 2 diabetes mellitus. Measurement of plasma triglyceride concentration can identify within a hypercholesterolemic population a subset of individuals at enhanced risk of statin-induced type 2 diabetes mellitus.
Keywords
Introduction
In 1993, it was shown in a relatively small study that apparently healthy East Asian individuals who had elevations of both low-density lipoprotein cholesterol (LDL-C) and triglyceride (TG) concentrations were glucose intolerant and insulin resistant as compared to those with only a high LDL-C concentration. 1 The current analysis was initiated to re-visit this evidence of metabolic heterogeneity in hypercholesterolemic individuals in light of the observations that incident type 2 diabetes mellitus (T2DM) is increased in statin-treated patients with elevated LDL-C concentrations.2–5 Since glucose intolerance and insulin resistance predict the development of T2DM,6,7 it seemed reasonable to raise the possibility that individuals with elevated concentrations of LDL-C and TG, since they were reported to be both glucose intolerant and insulin resistant, 1 would be the statin-treated subjects most likely to develop T2DM. As the first step in pursuing this notion, we thought it would be useful to confirm the findings of the relatively small original study in much larger East Asian population. In order to accomplish this goal, we analysed data obtained as part of a comprehensive health examination in 13,117 non-diabetic individuals, not taking any drugs to affect lipid metabolism.
Subjects, materials and methods
The study population consisted of individuals who participated in a comprehensive health examination in 2010 at Kangbuk Samsung Hospital, College of Medicine, Sungkyunkwan University. Initially, 13,117 non-diabetic individuals, not taking any drugs to affect lipid metabolism, were included. From these individuals, 5790 subjects were identified as having a LDL-C concentration of ⩾3.4 mmol/L. The institutional review board at Kangbuk Samsung Hospital approved the study, and informed consent requirement was waived as personal identifying information was not accessed.
Measurements of height and weight were made by trained nurses with the participants wearing a lightweight hospital gown and no shoes. Body mass index (BMI) was calculated as weight in kilograms divided by height in meters squared. Waist circumference (WC) was measured at the midpoint between the bottom of the rib cage and the top of the iliac crest with the subjects standing, their weight equally distributed on both feet, their arms at their sides and head facing straightforward. Blood pressure was quantified by skilled nursing personnel after subjects had been seated for at least 5 min, and the average of two values reported.
Blood samples were collected after an overnight fast. An enzymatic calorimetric test was used to measure total cholesterol (TC) and TG concentrations. The selective inhibition method was used to measure high-density lipoprotein cholesterol (HDL-C), and a homogeneous enzymatic calorimetric method used to measure LDL-C concentration (Advia 1650 Autoanalyzer; Bayer Diagnostics, Leverkusen, Germany). Homeostatic model assessment of insulin resistance (HOMA-IR) was calculated (HOMA-IR = [fasting insulin (µU/mL) × fasting glucose (mmol/L)]/22.5.
Participants with a LDL-C concentration were further subdivided into two group based on their TG concentration: LDL-C ⩾ 3.4 mmol/L/TG < 1.7 mmol/L versus LDL-C ⩾ 3.4 mmol/L/TG ⩾ 1.7 mmol/L. Statistical analysis of the data were performed using SPSS version 15.0 (SPSS, Point Richmond, CA, USA). Continuous variables were expressed as mean ± standard deviation (SD) and compared using independent t-tests. Categorical variables were expressed as percentages and compared between groups using the χ2 test. p values less than 0.05 were considered statistically significant.
Results
Table 1 compares demographic and metabolic characteristics of the two subgroups of men. Although the ages were similar, every other variable was different in the group with elevations of both LDL-C and TG. They were heavier, with significantly higher blood pressures and plasma TC, LDL-C and TG concentrations and lower concentrations of HDL-C. Most relevant to the goal of this study, individuals with combined increases in LDL-C and TG had modest but significantly higher plasma glucose (~2%) and HbA1c (~4%). Furthermore, they were hyperinsulinemic, and the combination of increases in both plasma glucose and insulin concentrations contributed to 1.5-fold higher values for HOMA-IR. Put most succinctly, they were significantly more insulin resistant.
Mean (±SD) demographic and metabolic characteristics in persons with a LDL-C of ⩾130 mg/dL in men.
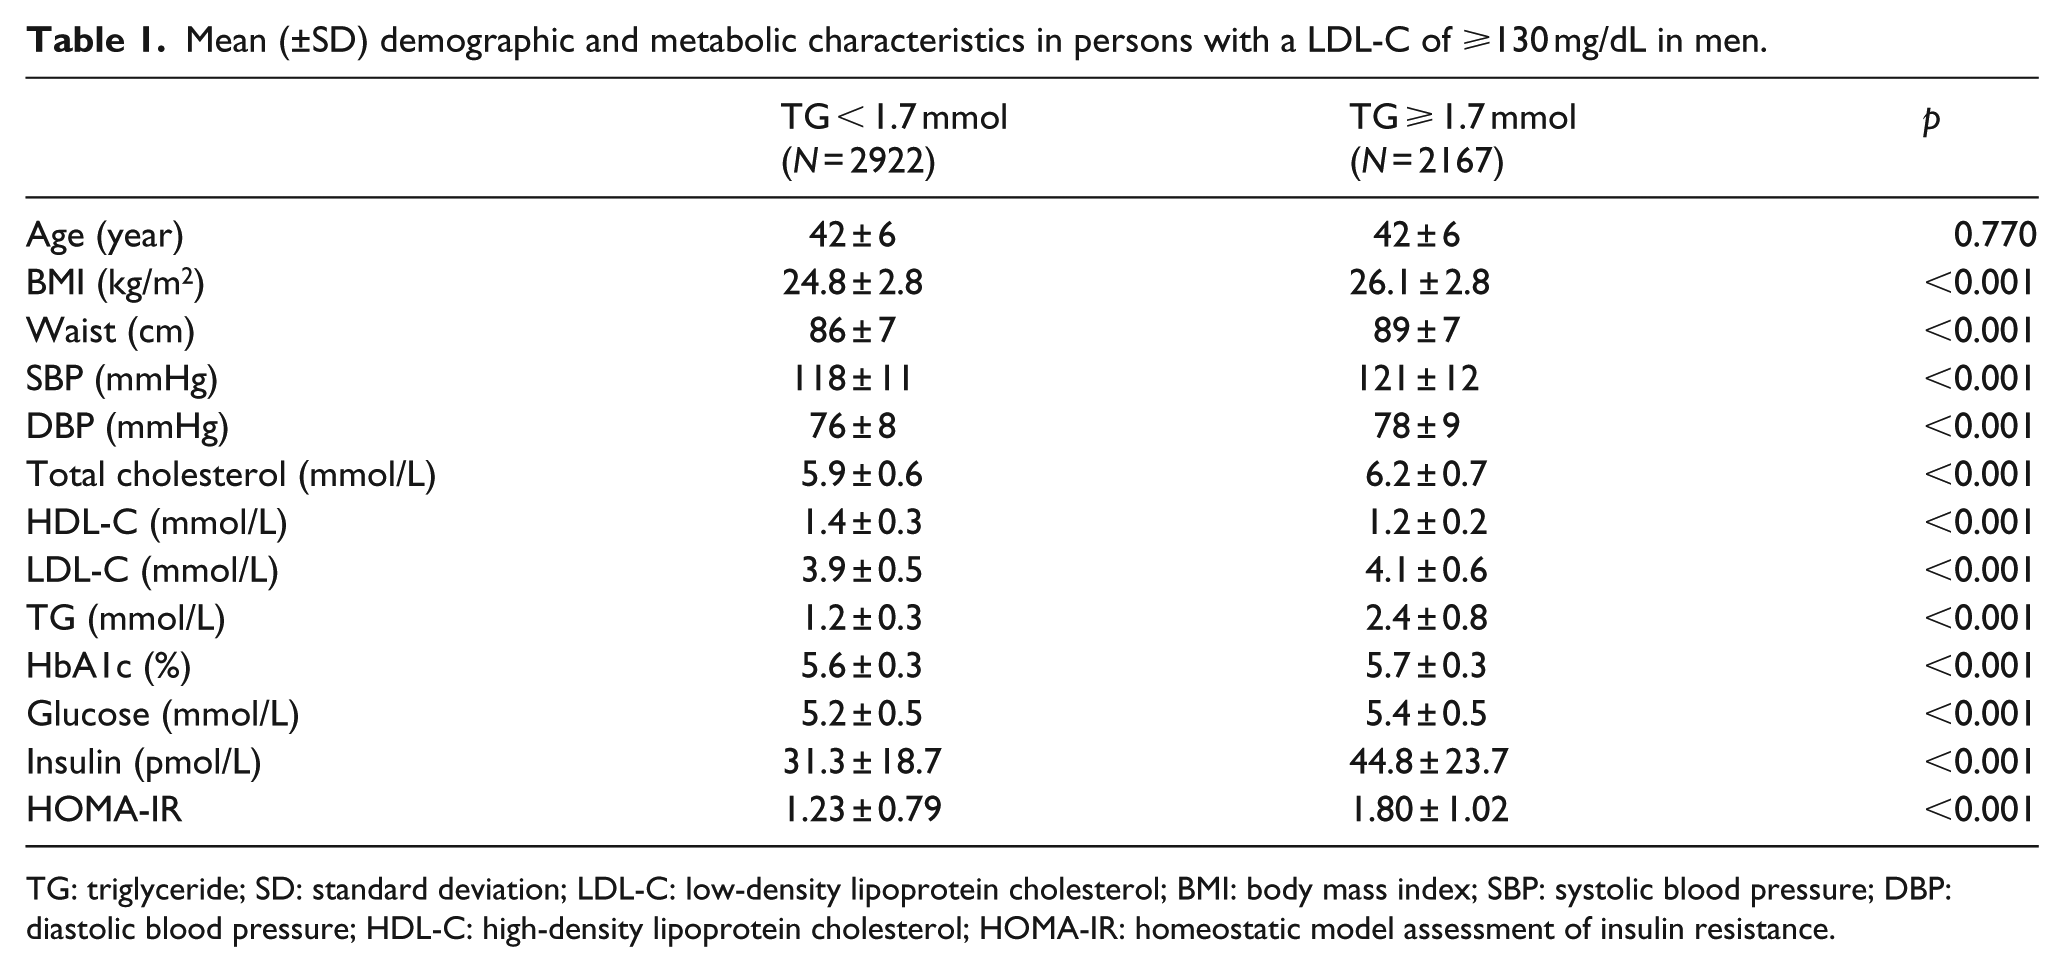
TG: triglyceride; SD: standard deviation; LDL-C: low-density lipoprotein cholesterol; BMI: body mass index; SBP: systolic blood pressure; DBP: diastolic blood pressure; HDL-C: high-density lipoprotein cholesterol; HOMA-IR: homeostatic model assessment of insulin resistance.
Measurements in the two subgroups of women are shown in Table 2 and appear very similar to the results in the men. The only exception to this generalization was a mean age difference of 2 years between the two subgroups of women. Thus, women with elevations of both LDL-C and TG were heavier and had higher blood pressures, TC, LDL-C and TG concentrations and lower HDL-C concentrations. Most importantly, these women were also hyperinsulinemic (31.8 vs 50.3 pmol/L) and insulin resistant (HOMA-IR:1.22 vs 2.00), and the magnitude of the elevations in plasma glucose, HbA1c, insulin and HOMA-IR between the two subgroups of women was comparable to that seen when comparing men with elevated LDL-C and TG concentrations to those with only a high LDL-C.
Mean (±SD) demographic and metabolic characteristics in persons with a LDL-C of ⩾130 mg/dL in women.
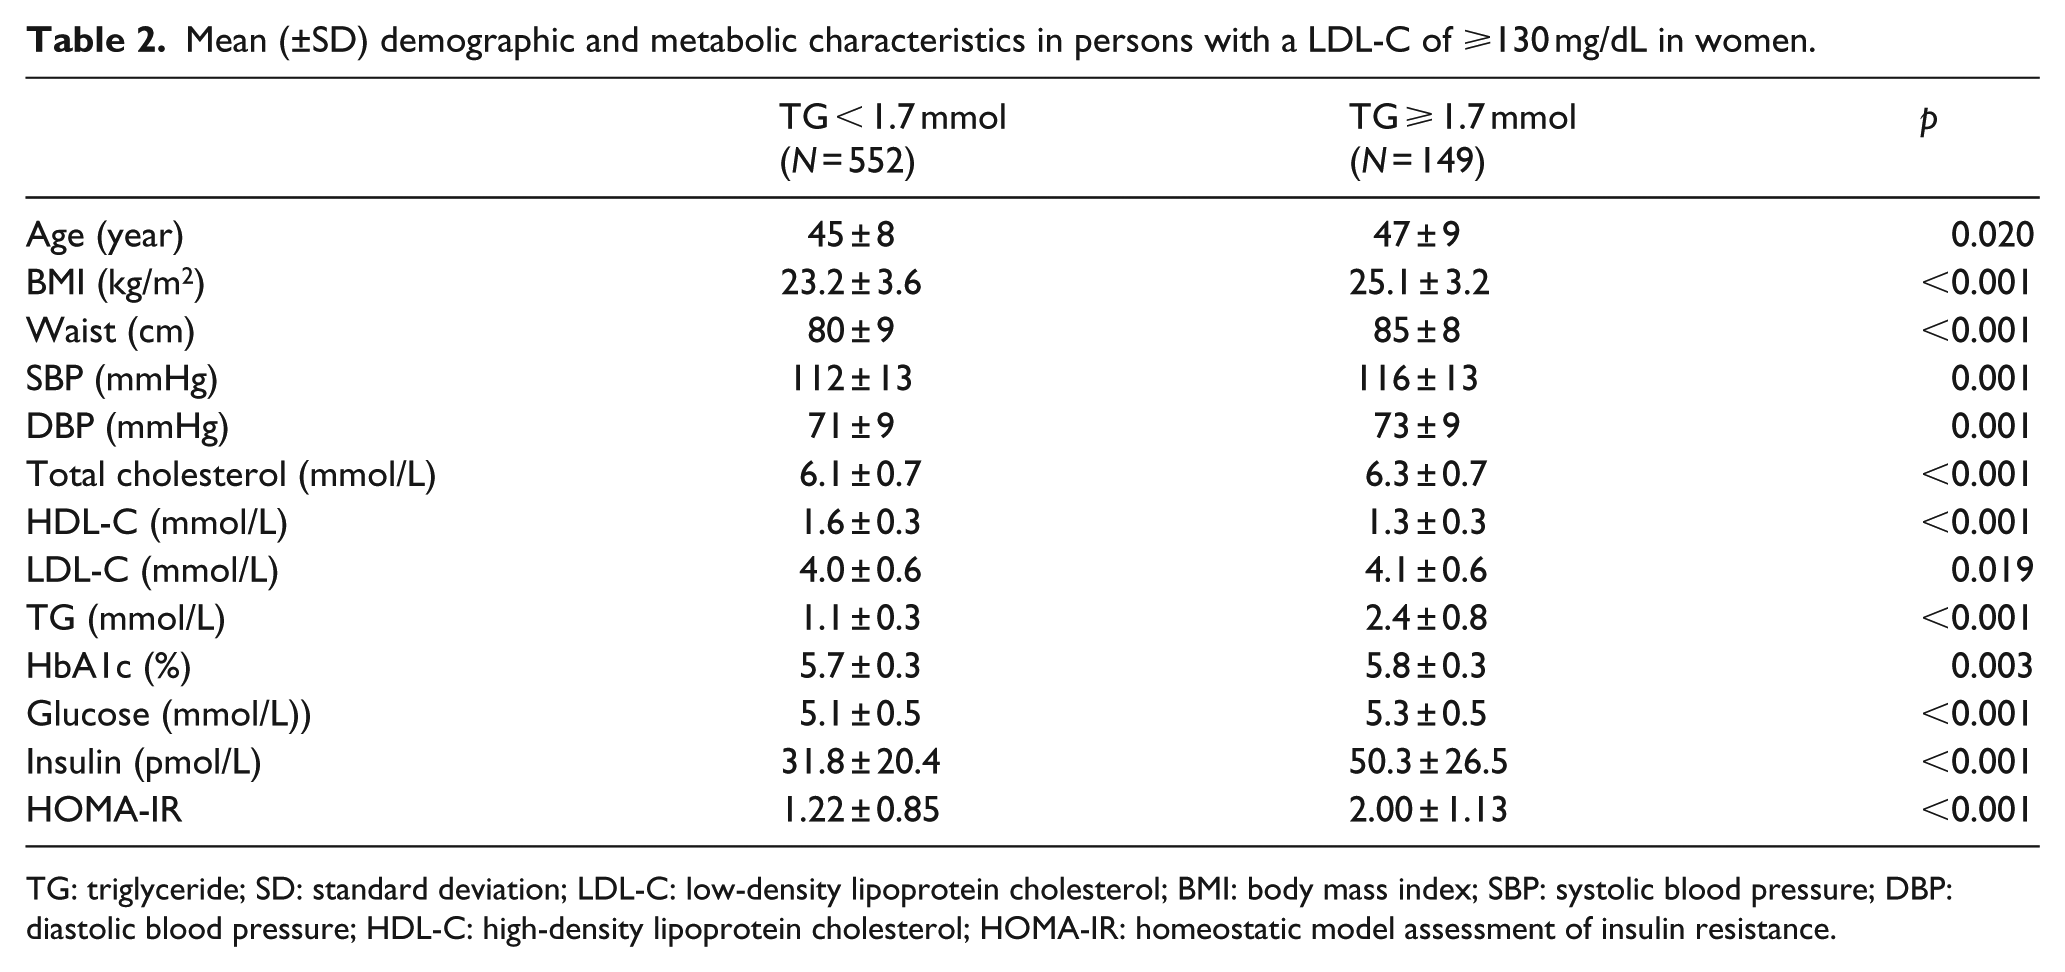
TG: triglyceride; SD: standard deviation; LDL-C: low-density lipoprotein cholesterol; BMI: body mass index; SBP: systolic blood pressure; DBP: diastolic blood pressure; HDL-C: high-density lipoprotein cholesterol; HOMA-IR: homeostatic model assessment of insulin resistance.
Discussion
The results presented demonstrate in a large population of East Asians that significant numbers of apparently healthy men (42%) and women (21%) with hypercholesterolemia also have an elevated plasma TG concentration (⩾1.7 mmol/L). The subset of individuals with combined elevations of LDL-C and TG concentrations, men and women, have higher values for BMI and WC, with significantly higher fasting plasma glucose and HbA1c concentrations, and are insulin resistant (HOMA-IR), as compared to those with only a high LDL-C concentration. Given these changes, it seems justified to conclude that prior to statin treatment they are, as a group, at increased risk of developing T2DM.6,7
It also could be speculated that these are also the individuals most likely to develop statin-induced T2DM, a notion totally consistent with the observations of Waters et al., 8 who identified elevations of fasting glucose and TG concentrations as predictors of 2DM in statin-treated individuals. On the other hand, it could be argued that although the increases in plasma glucose concentration and HbA1C were statistically significant in those with combined elevations of TG and HDL-C, the magnitude of the differences (increases of ~2%–4%) may not be biologically significant. However, estimates of insulin resistance (fasting plasma insulin concentration and HOMA-IR) were 1.5-fold higher in these individuals, and the role that increases in insulin resistance plays in the pathogenesis of T2DM is well-supported. 6
The major clinical benefit from recognizing those statin-treated persons at increased risk of T2DM would be to modify their treatment program. Closer monitoring of the glycemic status of such persons would help in early identification and treatment of new-onset T2DM. Aggressive efforts to overcome excess adiposity and encourage more physical activity would seem justified in these individuals to improve insulin sensitivity and decrease the risk of T2DM. 9 Furthermore, since these persons are insulin resistant/hyperinsulinemic, it would seem prudent to avoid using low fat/high carbohydrate diets in order to prevent accentuation of the daylong increase in insulin concentration and postprandial hypertriglyceridemia that such diets lead to in individuals with this cluster of metabolic abnormalities.10,11
Although the findings are straightforward, they have limitations. To begin with, the results represent a retrospective analysis of data collected as part of a routine health exam. Furthermore, since the majority of the subjects were of East Asian ancestry, the findings do not necessarily apply to all racial/ethnic groups. The TG cut-point of ⩾1.7 mmol/L was selected as it is the concentration at which plasma TG concentrations are conventionally no longer considered normal.12–14 It is certainly possible that some other cut-point would more effectively identify subjects with a high LDL-C who are at accentuated risk of statin-induced T2DM, particularly in groups of African origin. 15
Finally, not knowing the pathophysiological mechanism(s) responsible for statin-induced diabetes makes efforts to identify those at highest risk depend on surrogate estimates. The current analysis presents one approach to accomplish this task. However, major questions remain unanswered. For example, although measurement of plasma TG concentration can identify risk of statin-induced diabetes, will it also identify those who go on to develop T2DM? This crucial question can be answered if investigators with data from statin-trails evaluated the ability of a TG concentration of ⩾1.7 mmol/L to predict incident T2DM. Another important question, and one harder to answer, is whether use of plasma TG measurements to identify individuals most likely to develop statin-induced diabetes lead to clinical interventions that decrease incident T2DM. In the absence of answers to these questions, results of this analysis suggest that the presence of a plasma TG concentration of ⩾1.7 mmol/L can at least serve as the first step in developing a therapeutic program that has the potential to decrease the adverse clinical impact of statin-induced diabetes.
Footnotes
Acknowledgements
All the authors declare that (1) the paper is not under consideration elsewhere, (2) none of the paper’s contents have been previously published, (3) all the authors have read and approved the manuscript and (4) the full disclosure of any relationship with industry. K.-C.S. contributed to the hypothesis, wrote methods and contributed to discussion, G.R. contributed to the hypothesis, reviewed the results as prepared by K.-C.S. and were actively engaged in interpretation of the data and preparation of the manuscript.
Declaration of conflicting interests
All the authors have no relevant conflicts of interest.
Funding
This research received no specific grant from any funding agency in the public, commercial or not-for-profit sectors.