
Abstract
Objective
The objective of this study was to investigate the relationship between the triglyceride glucose index and time in range in patients with type 2 diabetes mellitus.
Methods
This is a cross-sectional study based on patients with type 2 diabetes mellitus. The time in range was measured in all patients using continuous glucose monitoring. Differential analyses were performed to compare the differences in clinical information between groups. Linear regression and logistic regression techniques were employed to construct a novel predictive model that encompassed the triglyceride glucose index, with the aim of assessing time in range attainment. The predictive value of the new model was then assessed using receiver operator characteristic curves.
Results
Linear and logistic regression analyses showed a significant negative correlation between the triglyceride glucose index and time in range, identifying the triglyceride glucose index as an independent risk factor for time in range attainment. Furthermore, restricted cubic spline plots indicated a nonlinear correlation between the triglyceride glucose index and time in range. The area under the curve of the novel prediction model constructed on the basis of the triglyceride glucose index for predicting time in range attainment was 0.81, thus demonstrating efficacious clinical application.
Conclusions
The study revealed a nonlinear relationship between the triglyceride glucose index and time in range, highlighting the triglyceride glucose index as a crucial indicator of time in range attainment.
Keywords
Introduction
Data from the International Diabetes Federation’s Diabetes Atlas 2025 show that in 2024, 589 million adults aged 20–79 years worldwide had diabetes, of which about 90%–95% had type 2 diabetes mellitus (T2DM). The number of people with diabetes worldwide is predicted to rise to 853 million by 2050. 1 This suggests that T2DM has become the most significant public health problem worldwide. China is among the top five countries with the highest absolute global burden of T2DM, and patients with T2DM frequently experience multiorgan damage, with renal, retinal, and cardiovascular diseases being the primary factors influencing the quality of life and reducing lifespan.2–4 In clinical practice, effective glycemic control in patients with T2DM can significantly delay complication onset, enhance patient outcomes, and reduce healthcare costs. Patients with T2DM are characterized by a combination of insulin resistance and relative insulin deficiency, with the former being a major impediment to achieving and maintaining optimal glycemic control. Currently, several clinical indicators are available for assessing insulin resistance. Among these, the triglyceride glucose (TyG) index, a recently developed indicator of insulin resistance, has proven efficacious in multiple clinical studies. The formula for calculating the TyG index is as follows: TyG index = ln(triglycerides (mg/dL) × fasting glucose (mg/dL)/2).
Previous studies have shown that the TyG index is strongly associated with all-cause and cardiovascular mortality in patients with T2DM.5,6 Moreover, the TyG index is a valid tool for assessing glycemic control in patients with T2DM, exhibiting a positive correlation with both glycated hemoglobin (HbA1c) and the Homeostatic Model Assessment for Insulin Resistance (HOMA-IR). 7 Consequently, the TyG index is more readily available and less costly than HbA1c and HOMA-IR, and it can be used as a simple, cost-effective method for assessing glycemic control in diabetic patients. Previous research has demonstrated that effective glycemic control is associated with a favorable cardiovascular prognosis in diabetic patients, particularly in those with an elevated TyG index. This finding contributes to the risk grading of glycemic management in diabetic patients with cardiovascular disease. 8
Time in range (TIR), a newly emerging indicator of blood glucose monitoring, is usually recommended for maintaining the blood glucose level between 3.9 and 10 mmol/L. The control target for TIR is >70%.9,10 This indicates that blood glucose levels should ideally be maintained between 3.9 and 10 mmol/L for a minimum of 16.8 h per day. Although HbA1c can effectively reflect glycemic control over the past 3 months, TIR can assess blood glucose levels in real time on a daily basis, which is more conducive to patient glycemic control. However, it remains unclear whether the relationship between the TyG index and TIR is comparable to that observed between HbA1c and glycemic control. The present study sought to explore the relationship between the TyG index and TIR in hospitalized patients with T2DM using continuous glucose monitoring (CGM). The objective of this study was to construct a predictive model based on the TyG index, with the aim of providing novel insights into improving glycemic control in patients with T2DM within a clinical context.
Materials and methods
Research objectives
The study adopted a cross-sectional research design. The study population comprised 749 patients with T2DM admitted to the Department of Endocrinology, The First Hospital of Zhangjiakou City, between October 2024 and February 2025. It is important to note that sample size calculations were not performed, which represents one of the study’s limitations. Patients were screened according to the following inclusion criteria: hospital admission for continuous blood glucose testing and a confirmed diagnosis of T2DM according to the 2011 World Health Organization diabetes diagnostic criteria. The exclusion criteria were as follows: (a) patients with type 1 diabetes mellitus or other specific types of diabetes mellitus; (b) acute diabetic complications or acute stress status; (c) severe cardiac, hepatic, and renal insufficiency (alanine aminotransferase (ALT)/aspartate transaminase (AST) levels usually >5 times the upper limit of normal values; estimated glomerular filtration rate (eGFR) <30 mL/min/1.73 m2); (d) patients who did not undergo continuous blood glucose monitoring; and (e) incomplete fundamental clinical data. The final study population comprised 650 patients with T2DM (Figure 1). All patient details have been deidentified. This study was conducted in accordance with the Declaration of Helsinki 1975, as revised in 2024, and relevant EQUATOR guidelines. 11 The study was approved by the Ethics Committee of the First Hospital of Zhangjiakou City (no. 2024100).

Flowchart of the population included in our study.
Information collection
The data were collected by a specialist nurse during hospital admission. The information collected included details such as patients’ sex, age, smoking and alcohol consumption histories, and chronic diseases. Patients’ blood pressure (systolic blood pressure and diastolic blood pressure (DPB)) and body mass index (BMI) were measured. The duration of hyperglycemia in patients with T2DM was documented in years, with durations less than 1 year recorded as 1 year. Medication history on admission was recorded, including metformin, glucagon-like peptide-1 agonists (GLP-1A), sodium–glucose cotransporter 2 inhibitors (SGLT2i), dipeptidyl peptidase-4 inhibitors (DPP4i), and insulin. Furthermore, a comprehensive array of fasting blood markers was collected, including HbA1c, white blood cell (WBC) count, red blood cell (RBC) count, hemoglobin (HGB), platelet (PLT) count, blood urea nitrogen (BUN), uric acid, total cholesterol (TC), triglycerides (TG), high-density lipoprotein cholesterol (HDL-C), low-density lipoprotein cholesterol (LDL-C), fasting blood glucose (FBG), ALT, and AST. The length of hospitalization at discharge was also recorded. The TyG index was calculated using serum TG (mg/dL) and FBG (mg/dL) levels. The eGFR was calculated using the CKD-EPI formula.
Continuous glucose monitoring
The CGM system (Silicon Bionics Ltd) uses a subcutaneous sensor with advanced sensing technology to monitor interstitial glucose concentrations in real time and convert them to blood glucose concentration values. Measurements were recorded every 5 min throughout the day, generating a complete report for analysis. All patients with T2DM underwent CGM to assess their glycemic control and record TIR levels.
Statistical analysis
All collected data were statistically analyzed using R 4.2. Continuous variables were expressed as mean ± standard deviation or median (interquartile range), depending on their distribution. Categorical variables were expressed as percentages. Between-group comparisons were conducted using the unpaired t-test, Mann–Whitney U-test, or chi-square test to determine the between-group variability, with the choice of test determined by the nature of the data. Linear and logistic regression models were used to investigate potential correlations between different variables. The restricted cubic spline (RCS) analysis was employed to analyze the nonlinear relationship between the variables. Four nodes were placed at the 5th, 35th, 65th, and 95th percentiles to identify the inflection points.
Multivariate linear and logistic regression models were utilized to identify the factors influencing TIR. Significant risk factors were used to create nomograms and construct predictive models. The clinical utility of the nomograms was assessed using calibration and decision curves. Receiver operating characteristic (ROC) curves were utilized to evaluate the diagnostic efficacy of the model. A p value of <0.05 was considered statistically significant in all statistical analyses.
Results
Comparison of basic clinical information in patients with T2DM based on TyG index grouping
A total of 749 patients diagnosed with T2DM were included in this study, of whom 650 were selected for further analysis based on the established inclusion and exclusion criteria. These 650 patients were divided into high and low TyG index groups based on the median TyG index value. Patients in the high TyG index group were older and had higher BMI, augmented DBP, and prolonged hospitalization duration than those in the low TyG index group. Laboratory indicators demonstrated higher levels of HbA1c, FBG, WBC, HGB, UA, TG, TC, LDL-C, ALT, and AST in patients within the high TyG index group. Conversely, TIR and HDL-C levels were lower in the high TyG index group. Furthermore, the utilization of medications such as SGLT2i, DPP4i, and insulin was found to be more prevalent among patients in the low TyG index group. The fundamental clinical information is displayed in Table 1.
Baseline clinical information based on median TyG index.

ALT: alanine aminotransferase; AST: aspartate transaminase; BMI: body mass index; BUN: blood urea nitrogen; CAD: coronary artery disease; DBP: diastolic blood pressure; DPP4i: dipeptidyl peptidase-4 inhibitors; FBG: fasting blood glucose; GLP-1A: glucagon-Like peptide-1 agonists; Hb: hemoglobin; HbA1c: glycated hemoglobin; HDL-C: high-density lipoprotein cholesterol; LDL-C: low-density lipoprotein cholesterol; PLT: blood platelet; RBC: red blood cell; SBP: systolic blood pressure; Scr: serum creatinine; SGLT2i: sodium–glucose cotransporter2 inhibitors; TC: total cholesterol; TG: triglyceride; TIR: time in range; UA: uric acid; WBC: white blood cell.
Linear regression analysis of TIR in patients with T2DM
TIR was analyzed as a continuous variable using linear regression. Univariate regression analyses yielded positive associations between TIR and BMI, DBP, and HGB, along with GLP-1A and SGLT2i usage. Concurrently, a negative correlation was identified between TIR and the diabetes duration, hospital stay, HbA1c, BUN, serum creatinine (Scr), TC, LDL-C, FBG, and insulin use. Notably, a significant negative correlation was observed between TyG and TIR, which reached statistical significance (P < 0.001). The results of all univariate linear regression analyses presented in Table 2.
Univariate linear regression analysis of TIR.

ALT: alanine aminotransferase; AST: aspartate transaminase; BMI: body mass index; BUN: blood urea nitrogen; CAD: coronary artery disease; CI: confidence interval; DBP: diastolic blood pressure; DPP4i: dipeptidyl peptidase-4 inhibitors; FBG: fasting blood glucose; GLP-1A: glucagon-Like peptide-1 agonists; Hb: hemoglobin; HbA1c: glycated hemoglobin; HDL-C: high-density lipoprotein cholesterol; LDL-C: low-density lipoprotein cholesterol; OR: odds ratio; PLT: blood platelet; RBC: red blood cell; SBP: systolic blood pressure; Scr: serum creatinine; SE standard error; SGLT2i: sodium–glucose cotransporter2 inhibitors; TC: total cholesterol; TG: triglyceride; TIR: time in range; UA: uric acid; WBC: white blood cell.
Multivariate linear regression analysis revealed that TIR was positively associated with GLP-1A use and BMI, and inversely associated with insulin use, duration of diabetes, days of hospitalization, HbA1c, BUN, and TyG index (Figure 2). Of particular note, the strongest correlation was observed between TIR and TyG index (Figure 2).
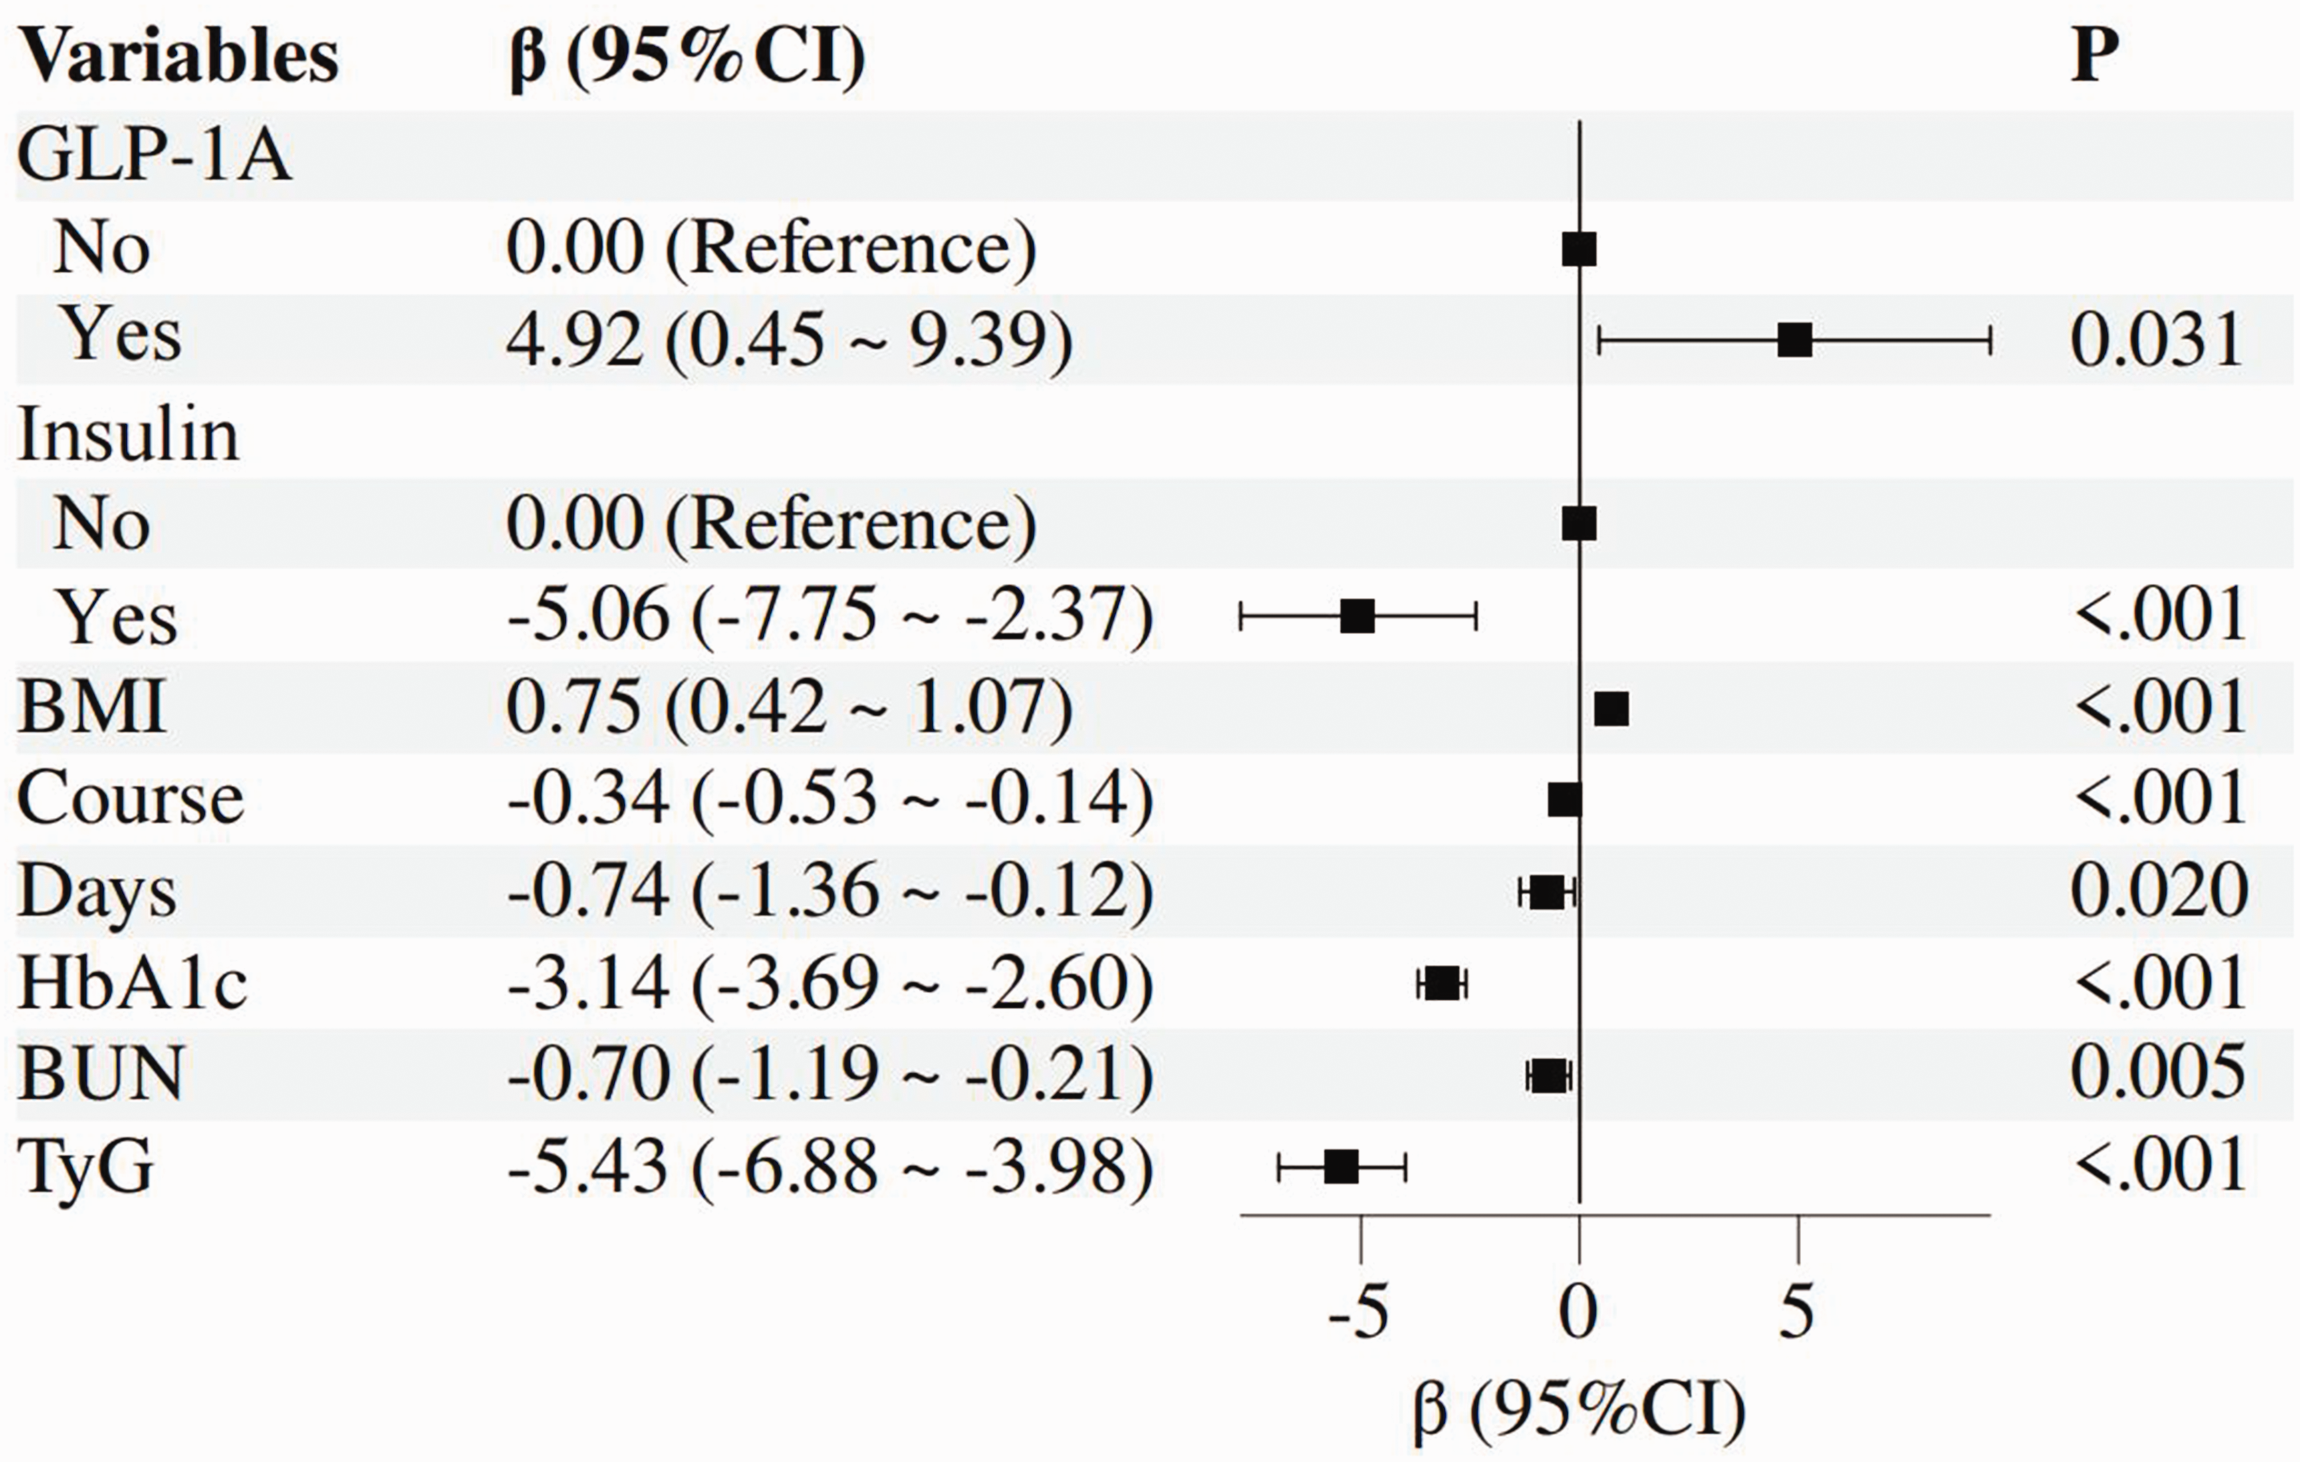
Multivariate linear regression analysis of TIR in patients with T2DM. TIR: time in range; T2DM: type 2 diabetes mellitus.
Comparison of basic clinical information in patients with T2DM based on TIR grouping
Patients with T2DM were divided into two groups based on their TIR values: those with TIR values of <70% (n = 291) and those with TIR values of 70% or more (n = 359). The patients in the high TIR group exhibited higher BMI, DBP, Hb, male predominance, a shorter duration of diabetes, and a shorter period of hospitalization when compared with the low TIR group. Laboratory results demonstrated that patients in the high TIR group had lower levels of HbA1c, FBG, BUN, Scr, TG, TC, LDL-C, and TyG index when compared with those in the low TIR group. Conversely, patients with a high TyG index exhibited lower levels of TIR and HDL-C. Furthermore, the utilization of GLP-1A and SGLT2i medications was more prevalent in the high TIR group, while the probability of insulin use was lower. Basic clinical information is presented in Table 3.
Baseline clinical information based on TIR.

ALT: alanine aminotransferase; AST: aspartate transaminase; BMI: body mass index; BUN: blood urea nitrogen; CAD: coronary artery disease; DBP: diastolic blood pressure; DPP4i: dipeptidyl peptidase-4 inhibitors; FBG: fasting blood glucose; GLP-1A: glucagon-Like peptide-1 agonists; Hb: hemoglobin; HbA1c: glycated hemoglobin; HDL-C: high-density lipoprotein cholesterol; LDL-C: low-density lipoprotein cholesterol; PLT: blood platelet; RBC: red blood cell; SBP: systolic blood pressure; Scr: serum creatinine; SGLT2i: sodium–glucose cotransporter2 inhibitors; TC: total cholesterol; TG: triglyceride; TIR: time in range; UA: uric acid; WBC: white blood cell.
Logistic regression analysis of TIR in patients with T2DM
Univariate logistic regression results demonstrated a positive association between TIR and BMI, DBP, and Hb, as well as the utilization of GLP-1A and SGLT2i. TIR was also found to be negatively correlated with the duration of diabetes, the number of days spent in hospital, the percentage of females, HbA1c, BUN, Scr, TC, LDL-C, TG, FBG, and insulin use. A noteworthy finding, consistent with the linear regression results, was that the TyG index was significantly negatively correlated with TIR. A comprehensive overview of the outcomes from all univariate logistic regression analyses can be found in Table 4.
Univariate logistic regression results of TIR.

ALT: alanine aminotransferase; AST: aspartate transaminase; BMI: body mass index; BUN: blood urea nitrogen; CAD: coronary artery disease; CI: confidence interval; DBP: diastolic blood pressure; DPP4i: dipeptidyl peptidase-4 inhibitors; FBG: fasting blood glucose; GLP-1A: glucagon-Like peptide-1 agonists; Hb: hemoglobin; HbA1c: glycated hemoglobin; HDL-C: high-density lipoprotein cholesterol; LDL-C: low-density lipoprotein cholesterol; OR: odds ratio; PLT: blood platelet; RBC: red blood cell; SBP: systolic blood pressure; Scr: serum creatinine; SE standard error; SGLT2i: sodium–glucose cotransporter2 inhibitors; TC: total cholesterol; TG: triglyceride; TIR: time in range; UA: uric acid; WBC: white blood cell.
Multivariate logistic regression analyses demonstrated positive correlations between TIR, BMI, and Hb and inverse correlations with duration of diabetes, days of hospitalization, HbA1c, Scr, and TyG index (Figure 3). Notably, the strongest association was observed between TIR and TyG index (Figure 3).
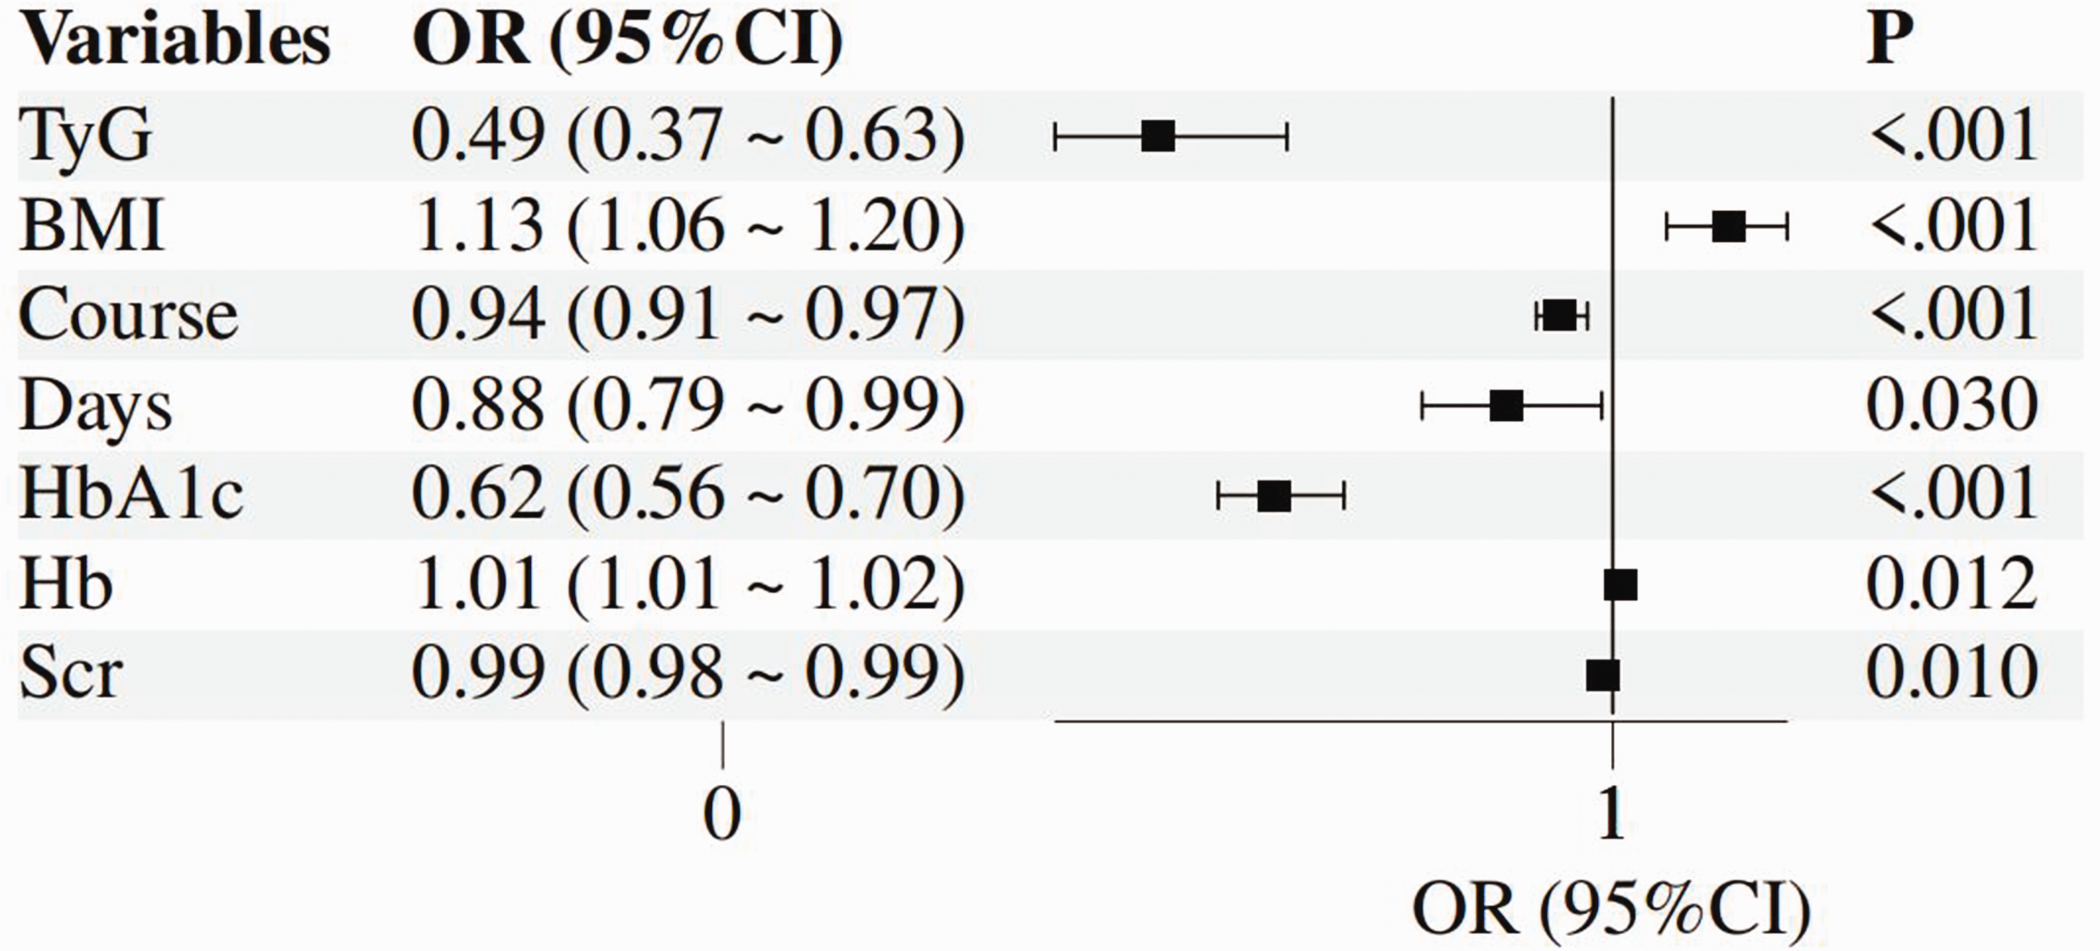
Multivariate logistic regression analysis of TIR in patients with T2DM. TIR: time in range; T2DM: type 2 diabetes mellitus.
Nonlinear relationship analysis between the TyG index and TIR in patients with T2DM
To investigate the existence of a nonlinear relationship between the TyG index and TIR, RCS plots were employed utilizing both linear regression and logistic regression models. The findings of the RCS analysis based on linear regression demonstrated a nonlinear correlation between TIR and TyG index (p for nonlinear = 0.002) (Figure 4(a)), which remained consistent after adjusting for BMI, duration of diabetes, days of hospitalization, HbA1c, BUN, GLP-1A, and insulin use (p for nonlinear = 0.002) (Figure 4(b)). The findings of the logistic regression-based RCS demonstrated an identical nonlinear association between TIR and TyG index (p for nonlinear = 0.039) (Figure 4(c)); this correlation remained consistent following the implementation of adjustments for BMI, duration of diabetes mellitus, duration of hospitalization, HbA1c, Hb, and Scr (p for nonlinear = 0.004) (Figure 4(d)). The inflection points of RCS in the four models occurred at TyG index = 8.532, 8.591, 8.5, and 8.603 (p < 0.05).

Nonlinear correlation analysis between the TyG index and TIR in patients with T2DM. (a) Univariate nonlinear correlation analysis based on linear regression. (b) Multivariate nonlinear correlation analysis based on linear regression. (c) Univariate nonlinear correlation analysis based on logistic regression and (d) multivariate nonlinear correlation analysis based on logistic regression. TyG: triglyceride glucose; TIR: time in range; T2DM: type 2 diabetes mellitus.
Predictive model development
The construction of a model for predicting the TIR Stonewall attainment table in hospitalized patients with T2DM was based on the results of linear and logistic regression. The model incorporates factors such as BMI, duration of diabetes mellitus, days of hospitalization, HbA1c, TyG index, GLP-1A, and insulin use. The results of the nomograms are presented in Figure 5. The results of the ROC curve analysis demonstrated that the TyG index alone predicted an area under the curve (AUC) of 0.68 for TIR attainment (Figure 6(a)), whereas the new prediction model incorporating multiple factors yielded an AUC of up to 0.81 for TIR attainment (Figure 6(b)). In addition, calibration curves and decision curve analysis (DCA) demonstrated the reliability of the new prediction model (Figure 7).

Prediction of TIR using a nomogram. TIR: time in range.

TyG index and new model for predicting the ROC curve of TIR. (a) TyG index for predicting the ROC curve of TIR and (b) new model for predicting the ROC curve of TIR. TyG: triglyceride glucose; ROC: receiver operating characteristic; TIR: time in range.

Calibration curves and decision curve analysis of the nomogram. (a) Calibration curves and (b) decision curve analysis.
Discussion
In this study, we sought to ascertain the correlation between the TyG index and TIR by including patients with T2DM and screening risk factors based on the findings of regression analyses. We then constructed a validated clinical prediction model to determine whether TIR was achieved. Utilizing a cross-sectional study design, we determined that the TyG index has an inverse association with TIR, with an AUC value of 0.68 for predicting the achievement or nonachievement of TIR. Furthermore, when factors other than the TyG index were taken into consideration, such as the duration of diabetes, the number of days spent hospitalized, HbA1c, GLP-1A, and insulin usage, the newly developed prediction model attained an AUC value of 0.81. The calibration and DCA curves confirmed the reliability of the model.
TIR is usually measured by a CGM system and reflects the amount of time that a patient’s glucose is in a specific range over a 24-h period. A substantial body of research has demonstrated a close correlation between TIR and a variety of diabetic complications, thus substantiating its use as an effective indicator of glycemic control.12–14 HbA1c is currently regarded as the gold standard for glycemic control and plays a pivotal role in its evaluation as well as in clinical decision-making. The TyG index, as a surrogate marker for the assessment of insulin resistance, exhibits a strong correlation with the gold standard hyperglycemic clamp. A substantial body of previous research has demonstrated a close relationship between TyG and glycemic control, especially HbA1c.15–18 Consequently, no study has reported on the relationship between TyG and TIR. The present study examined the correlation between TyG and TIR in patients with T2DM and found that increased TyG was associated with poor glycemic control, which is consistent with previous studies.19,20 Furthermore, both HbA1c and a longer duration of diabetes have been identified as risk factors for substandard TIR, a phenomenon that is clinically predictable. In the present study, BMI, a major risk factor for T2DM,21,22 was shown to be associated with better TIR in patients with higher admission BMI. This finding appears to contradict previous perceptions. However, in clinical practice, obese patients with T2DM tend to exhibit poor dietary habits and a shorter duration of diabetes, while higher GLP-1A use in these patients appears more favorable for glycemic control. Conversely, insulin use has been observed to be inversely associated with TIR, a phenomenon that may be attributed to the propensity of insulin-using patients with T2DM to have a protracted duration of diabetes and diminished pancreatic islet function. Moreover, these patients exhibit greater glycemic fluctuations, which can adversely impact TIR.
In recent years, the TyG index has been extensively studied in a variety of disease fields. A substantial body of research has emerged demonstrating the superiority of the TyG index in the context of T2DM and cardiovascular disease, in addition to a robust correlation between the index and estimated glucose handling rate.23–26 The present study demonstrated that the TyG index has the greatest impact on TIR, and there also appears to be a nonlinear correlation between the two. The prediction model constructed by combining the TyG index has good predictive value for TIR. To the best of the authors’ knowledge, there has been no exploration of the relationship between TyG and TIR, and the present study can provide new ideas for clinical glycemic control in patients with T2DM. The construction of a new prediction model is conducive to better clinical practice.
To investigate the existence of a nonlinear relationship between the TyG index and TIR, the RCS plot technique was employed, utilizing both linear and logistic regression models. Linear regression analysis revealed a nonlinear correlation between TIR and the TyG index, which remained consistent after adjusting for BMI, duration of diabetes, hospital stay, HbA1c, BUN, GLP-1A, and insulin use. Similarly, the logistic regression-based RCS results demonstrated a nonlinear association between TIR and the TyG index, which persisted after adjustment for confounders, including BMI, duration of diabetes, length of hospitalization, HbA1c, Hb, and Scr. The RCS inflection points for the four models occur at TyG index values of 8.532, 8.591, 8.5, and 8.603, respectively. The findings indicate that TIR exhibits an upward trend and subsequently declines as the TyG value rises, with the RCS curve displaying a discernible inflection point at TyG index values of 8.5–8.6. These findings suggest the presence of a nonlinear relationship between the TyG index and TIR. The findings of this study indicate that a lower TyG index appears to be associated with optimal glycemic control and a higher rate of TIR attainment. Conversely, a higher TyG index within a certain range is associated with poorer glycemic control and lower TIR.
The present study is not without its limitations. First, the study was conducted at a single center, lacked external data to validate the predictive model, and did not include sample size calculations. To corroborate the findings of this study, additional data and a more substantial sample are required. Second, the inherent limitations of cross-sectional studies preclude the ability to derive causal relationships between variables. Finally, the potential influence of confounding variables, such as diet, exercise, and glucose-lowering medications, on the results needs to be explored in future studies.
Conclusion
The present study showed a nonlinear relationship between the TyG index and TIR, with TIR initially increasing and then decreasing as TyG values rose, and the RCS curve displaying a significant inflection point at TyG index values of 8.5–8.6. These findings suggest that the TyG index may have an independent effect on TIR and could be a valuable predictor.
Supplemental Material
sj-pdf-1-imr-10.1177_03000605251381190 - Supplemental material for Relationship between the triglyceride glucose index and time in range: A cross-sectional study based on patients with type 2 diabetes mellitus
Supplemental material, sj-pdf-1-imr-10.1177_03000605251381190 for Relationship between the triglyceride glucose index and time in range: A cross-sectional study based on patients with type 2 diabetes mellitus by Hongbo Shang, Xiaoli Qin, Wenxian Li, Yanrong Xu and Weixuan Wang in Journal of International Medical Research
Footnotes
Acknowledgments
Not applicable.
Author contributions
Hongbo Shang and Weixuan Wang designed the study and contributed the original data. Xiaoli Qin conducted the statistical analyses and prepared the initial draft of the manuscript. Wenxian Li and Yanrong Xu conducted the literature review and helped in writing the manuscript. The final version of the manuscript has been read and approved by all authors.
Data availability statement
The data that support the findings of this study are available from the corresponding author upon reasonable request.
Declaration of conflicting interests
The authors declare that the research was conducted in the absence of any commercial or financial relationships that could be construed as a potential conflict of interest.
Ethics statement
This study was performed in line with the principles of the Declaration of Helsinki. Approval was granted by the Ethics Committee of The First Hospital of Zhangjiakou (no. 2024100).
Funding
This work was supported by 2024 Zhangjiakou Key R&D Programme Projects (2421097 D).
Supplemental material
Supplemental material for this article is available online.
References
Supplementary Material
Please find the following supplemental material available below.
For Open Access articles published under a Creative Commons License, all supplemental material carries the same license as the article it is associated with.
For non-Open Access articles published, all supplemental material carries a non-exclusive license, and permission requests for re-use of supplemental material or any part of supplemental material shall be sent directly to the copyright owner as specified in the copyright notice associated with the article.