
Abstract
Background
Chronic kidney disease (CKD) comorbid with cardiovascular disease (CVD) results in substantial mortality. The predictive value of the triglyceride-glucose (TyG) index for mortality in this population remains unverified. We aimed to evaluate the association of the TyG index with mortality in individuals with CKD and CVD.
Methods
Using National Health and Nutrition Examination Survey (NHANES) data (1999–2018), we analyzed 1104 adults with CKD and CVD. Multivariable Cox proportional hazards models and restricted cubic splines assessed associations between the TyG index and mortality. Threshold effects were evaluated.
Results
Over a median 10.3-years follow-up, 623 all-cause and 311 cardiovascular deaths occurred. A significant U-shaped association existed between the TyG index and both all-cause (p-nonlinear = 0.002) and cardiovascular mortality (p-nonlinear = 0.014). Above a threshold of 8.91, higher TyG index predicted increased all-cause mortality risk (HR 1.34, 95% CI 1.07–1.67; p = 0.01). Below 8.91, the association was non-significant (HR 0.82, 95% CI 0.62–1.28; p = 0.537). This U-shaped relationship was significant in males (p-nonlinear < 0.05) but not females.
Conclusions
The TyG index demonstrates a U-shaped association with all-cause and cardiovascular mortality in patients with comorbid CKD and CVD. Maintaining TyG index within a specific range may reduce mortality risk, highlighting its potential role in risk stratification and targeted management.
Introduction
Chronic kidney disease (CKD) affects approximately 9.1% of the global population (around 700 million individuals) and significantly contributes to mortality, disability and morbidity worldwide.1,2 Beyond the directly attribution for kidney, patients with CKD have an elevated risk of comorbidity with cardiovascular disease (CVD) and type 2 diabetes mellitus (T2DM).3,4 This elevated risk is associated with the tight connection among CKD, CVD, and T2DM, as diseases in each system often share underlying pathogenesis like hypertension, dysglycemia, and excess or dysfunctional adiposity. 5 A recent study based on the National Health and Nutrition Examination Survey (NHANES) found the multimorbidity of CKD, CVD and T2DM increased significantly (from 5.3% to 8.0%) between 1999 and 2020. 6 The growing burden of CKD and related comorbidity is illustrated by its increasing attribution to mortality and related care costs. In 2017, the Global Burden of Diseases, Injuries, and Risk Factors study (GBD) projected that kidney disease resulted in 1.4 million deaths related to cardiovascular disease and caused a loss of 25 million CVD-related disability-adjusted life years (DALYs). 1 Accordingly, the American Heart Association (AHA) released a Presidential Advisory statement for advocating for comprehensive, multidisciplinary care of patients at risk for developing cardiovascular-kidney-metabolic (CKM) syndrome. 5 Critical to the reduction for the burden of morbidity and mortality is the identification of residual risk factors among CKM individuals.
The triglyceride-glucose (TyG) index, a composite marker of insulin resistance derived from fasting triglyceride (TG) and glucose levels,7,8 has garnered increasing attention for its prognostic value in assessing mortality or cardiovascular mortality risk across diverse CKM populations, like patients with T2DM, 9 cardiometabolic syndrome, 10 heart failure 11 and stroke. 12 A recent study of patients with CKD and coronary artery disease (CAD) elucidated that TyG index was nonlinearly associated with 1-year mortality risk within the specified range. 13 However, the patients included in the study were admitted to the intensive care unit (ICU), and they might have severe complication, thus representing only a partial CKD population. Additionally, cardiovascular-related mortality was not estimated in this population. There is still insufficient evidence of the relationship between the TyG index and mortality among CKD patients with CVD and distinct conditions of CKM.
To address these gaps, this study investigates the predictive value of TyG index for all-cause and cardiovascular mortality in patients with CKD and CVD. The primary objective is to explore the utility of the TyG index within chronic disease management, particularly in contrast to its established role in acute care settings. Additionally, the study seeks to clarify the specific associations between the TyG index and mortality outcomes in this high-risk population, while investigating potential non-linear relationships that may provide insights for identifying clinical thresholds. Using a longitudinal cohort design, the study aims to establish clinically relevant thresholds for the TyG monitoring, contributing to the precision medicine framework for CKD and CVD management, and informing targeted interventions to mitigate mortality risk in this vulnerable cohort.
Materials and methods
Study design and study population
NHANES is a program conducted by the Centers for Disease Control and Prevention (CDC) to assess the health and nutritional status of adults and children in the United States. The NHANES protocols have received official approval from the Research Ethics Review Board at National Center for Health Statistics. Informed consent was obtained from all NHANES participants, and data were deidentified to ensure confidentiality and privacy. We obtained the data between 1999 and 2018 from the official NHANES website (https://wwwn.cdc.gov/nchs/nhanes/Default.aspx). This study adhered to the Strengthening the Reporting of Observational Studies in Epidemiology (STROBE) reporting guideline for cohort studies. In this study, we excluded individuals if they: (1) missed data for diagnosis of CKD and CVD; (2) were younger than 20-years-old; (3) had incomplete information for calculating TyG index (Figure 1). Flowchart of the sample selection from National Health and Nutrition Examination Survey (NHANES) 1999–2018
Definition of CKD, CVD and the TyG index
In our study, we defined CVD based on self-reported diagnoses provided by healthcare professionals. These diagnoses included heart failure, coronary heart disease, myocardial infarction, heart attack, angina pectoris and stroke. 14
The CKD status was defined by estimated glomerular filtration rate (eGFR) and albuminuria. 15 We had access to urinary albumin-to-creatinine ratio (ACR) and serum creatinine measurements from the medical examination for NHANES participants. Participants were then categorized into four CKD risk groups: low, moderate, high, and very high. In our analysis, we defined moderate (eGFR 45-59 and ACR <3 mg/mmol, or eGFR ≥60 and ACR 3–30 mg/mmol), high (eGFR 30–44 and ACR <3 mg/mmol, eGFR 45–59 and ACR 3–30 mg/mmol, or eGFR ≥60 and ACR >30 mg/mmol) and very high (eGFR <30 and ACR <3 mg/mmol, eGFR <45 and ACR 3–30 mg/mmol, or eGFR <60 and ACR >30 mg/mmol) groups as indicative of CKD, which were used for estimating CKD prevalence in previous study based on NHANES. 6
The TyG index was computed using TG and FBG concentrations according to the equation: Ln [TG (mg/dL) × FBG (mg/dL)/2].
Ascertainment of mortality
Data on follow-up and mortality status were obtained by linking the NHANES data to the National Death Index records through December 31, 2019. All-cause mortality was defined as death from any cause. The specific causes of death were determined using the International Statistical Classification of Diseases and Related Health Problems, Tenth Revision (ICD-10) codes. Cardiovascular disease (CVD) mortality was classified as death resulting from heart diseases (ICD-10 codes I00-I09, I11, I13, and I20-I51) and cerebrovascular diseases (ICD-10 codes I60-I69).
Covariates
We collected information on a variety of demographic and clinical factors from the NHANES database, including age, sex, race and ethnicity, education level, smoking status, drinking status, body mass index (BMI) and medication use. We categorized race and ethnicity as Hispanic, non-Hispanic White, non-Hispanic Black, and other. Education level was classified as less than high school, high school grad or equivalent, college or above, refused, and unknown. Smoking status was categorized as current, former and never smoker. Drinking status was recorded as former, moderate (consuming ≥2 drinks per day for females or ≥3 drinks per day for males, or engaging in binge drinking on ≥2 days per month), heavy (consuming ≥3 drinks per day for females or ≥4 drinks per day for males, or engaging in binge drinking [≥4 drinks on the same occasion for females or ≥5 drinks on the same occasion for males] on 5 or more days per month), mild (not meeting the above criteria), and never drinking. Hypertension was defined as systolic blood pressure ≥140 mmHg, or diastolic blood pressure ≥90 mmHg, or self-reported antihypertensive medicine use, or self-report history of being told twice previously by a healthcare professional that one has high blood pressure. T2DM was defined as either a self-reported diagnosis of diabetes by a healthcare professional, or no self-reported diagnosis but glycated hemoglobin A1c (HbA1c) ≥6.5% or fasting blood glucose (FBG) ≥126 mg/dL. Participants classified as having type 1 diabetes (taking only insulin and starting within 1 year of diabetes diagnosis) and individuals with an indeterminate status were not included. Prediabetes mellitus (Pre-DM) was defined as not having diabetes (fitting the definition mentioned above) and having either a self-reported diagnosis of prediabetes by healthcare professional, HbA1c between 5.7 and 6.4%, or having FBG between 100 mg/dL and 125 mg/dL. Hypercholesterolemia was identified by total cholesterol ≥239 mg/dL or self-reported use of prescription medicine to lower cholesterol. The antihypertensive medications included ACE inhibitors, ARBs, diuretics, calcium channel blockers, β-blockers, adrenergic receptor antagonists, and mineralocorticoid receptor blockers. Oral antidiabetic agents included biguanides, sulfonylureas, thiazolidinediones, DPP-4 inhibitors, GLP-1 receptor agonists, SGLT2 inhibitors, alpha-glucosidase inhibitors, metformin, and glinides. In addition, the result of laboratory test including fasting insulin, HbA1c, total cholesterol, low-density lipoprotein cholesterol (LDL-cholesterol), high-density lipoprotein cholesterol (HDL-cholesterol), lactate dehydrogenase (LDH), blood urea nitrogen (BUN), alanine transaminase (ALT), aspartate aminotransferase (AST), gamma-glutamyl transferase (GGT) at baseline was included in this study.
Statistical analysis
Statistical analysis was conducted using R software (version 4.3.2; https://www.r-project.org). Given the complex sampling design of NHANES, sample weights, clustering, and stratification were incorporated into all analyses as required to account for the survey design. 16 Multiple imputation was performed for BMI, which had missing values for 38 participants. Participants were classified into four groups based on quartiles (Q1–Q4) of the TyG index. Continuous variables were summarized as mean and standard deviation (SD), while categorical variables were presented as frequency and percentage. Baseline characteristics across TyG quartile groups were compared using one-way ANOVA for continuous variables and Pearson chi-square test for categorical variables.
To assess the independent predictive value of the TyG index for mortality, multivariate Cox proportional hazards regression models were developed, for calculating hazard ratios (HRs) and 95% confidence intervals (CIs). Three models were constructed to control for confounding factors, Model 1 was unadjusted; Model 2 was adjusted for age, race, and gender; Model 3 was adjusted for age, gender, race, education, smoking, BMI, alcohol use, hypertension, T2DM, Pre-DM, medication (including antihypertensive drugs; oral glucose lowering drugs; statins; aspirin; fibrates; insulin), and hypercholesterolemia.
The nonlinear relationship between the TyG index and mortality was investigated using Cox proportional hazards regression models with restricted cubic splines and smooth curve fitting (penalized spline method). The use of restricted cubic splines allowed us to flexibly model the relationship without prespecifying a linear association, ensuring that the analysis captured any potential saturation effects or inflection points. The relationship was visualized using the rms package in R, which plotted the association between the TyG index and mortality risk. Given the observed nonlinear pattern, where mortality risk initially decreased and subsequently increased, a threshold value (inflection point) was estimated using a maximum likelihood-based approach. To further explore this threshold effect, we applied a two-piecewise Cox proportional hazards model, dividing the data into two segments based on the inflection point. This approach enabled us to evaluate the TyG index’s effect on mortality risk separately for values below and above the threshold. The two-piecewise model offers greater interpretative flexibility, allowing us to assess how the TyG index’s impact on all-cause and cardiovascular mortality varies across the identified threshold. We further conducted stratified analyses to explore the associations between the TyG index and mortality based on gender and CKD risk groups. A p-value of less than 0.05 was considered statistically significant.
Result
Baseline characteristics
Demographic and clinical characteristics at baseline according to the TyG index quartiles.

TyG, triglyceride glucose; BMI, body mass index; Pre-DM, pre-diabetes mellitus; T2DM, type 2 diabetes mellitus; SD, standard deviation.
Laboratory data of involved participants based on the quartiles of TyG index.

TyG, triglyceride glucose; HbA1c, hemoglobin A1c; eGFR, estimated glomerular filtration rate; LDL, low-density lipoprotein; HDL, high-density lipoprotein; LDH, lactate dehydrogenase; BUN, blood urea nitrogen; ALT, alanine transaminase; AST, aspartate aminotransferase; GGT, gamma-glutamyl transferase; SD, standard deviation.
The association between the TyG index and mortality
The association between the various TyG index quartile groups and mortality.
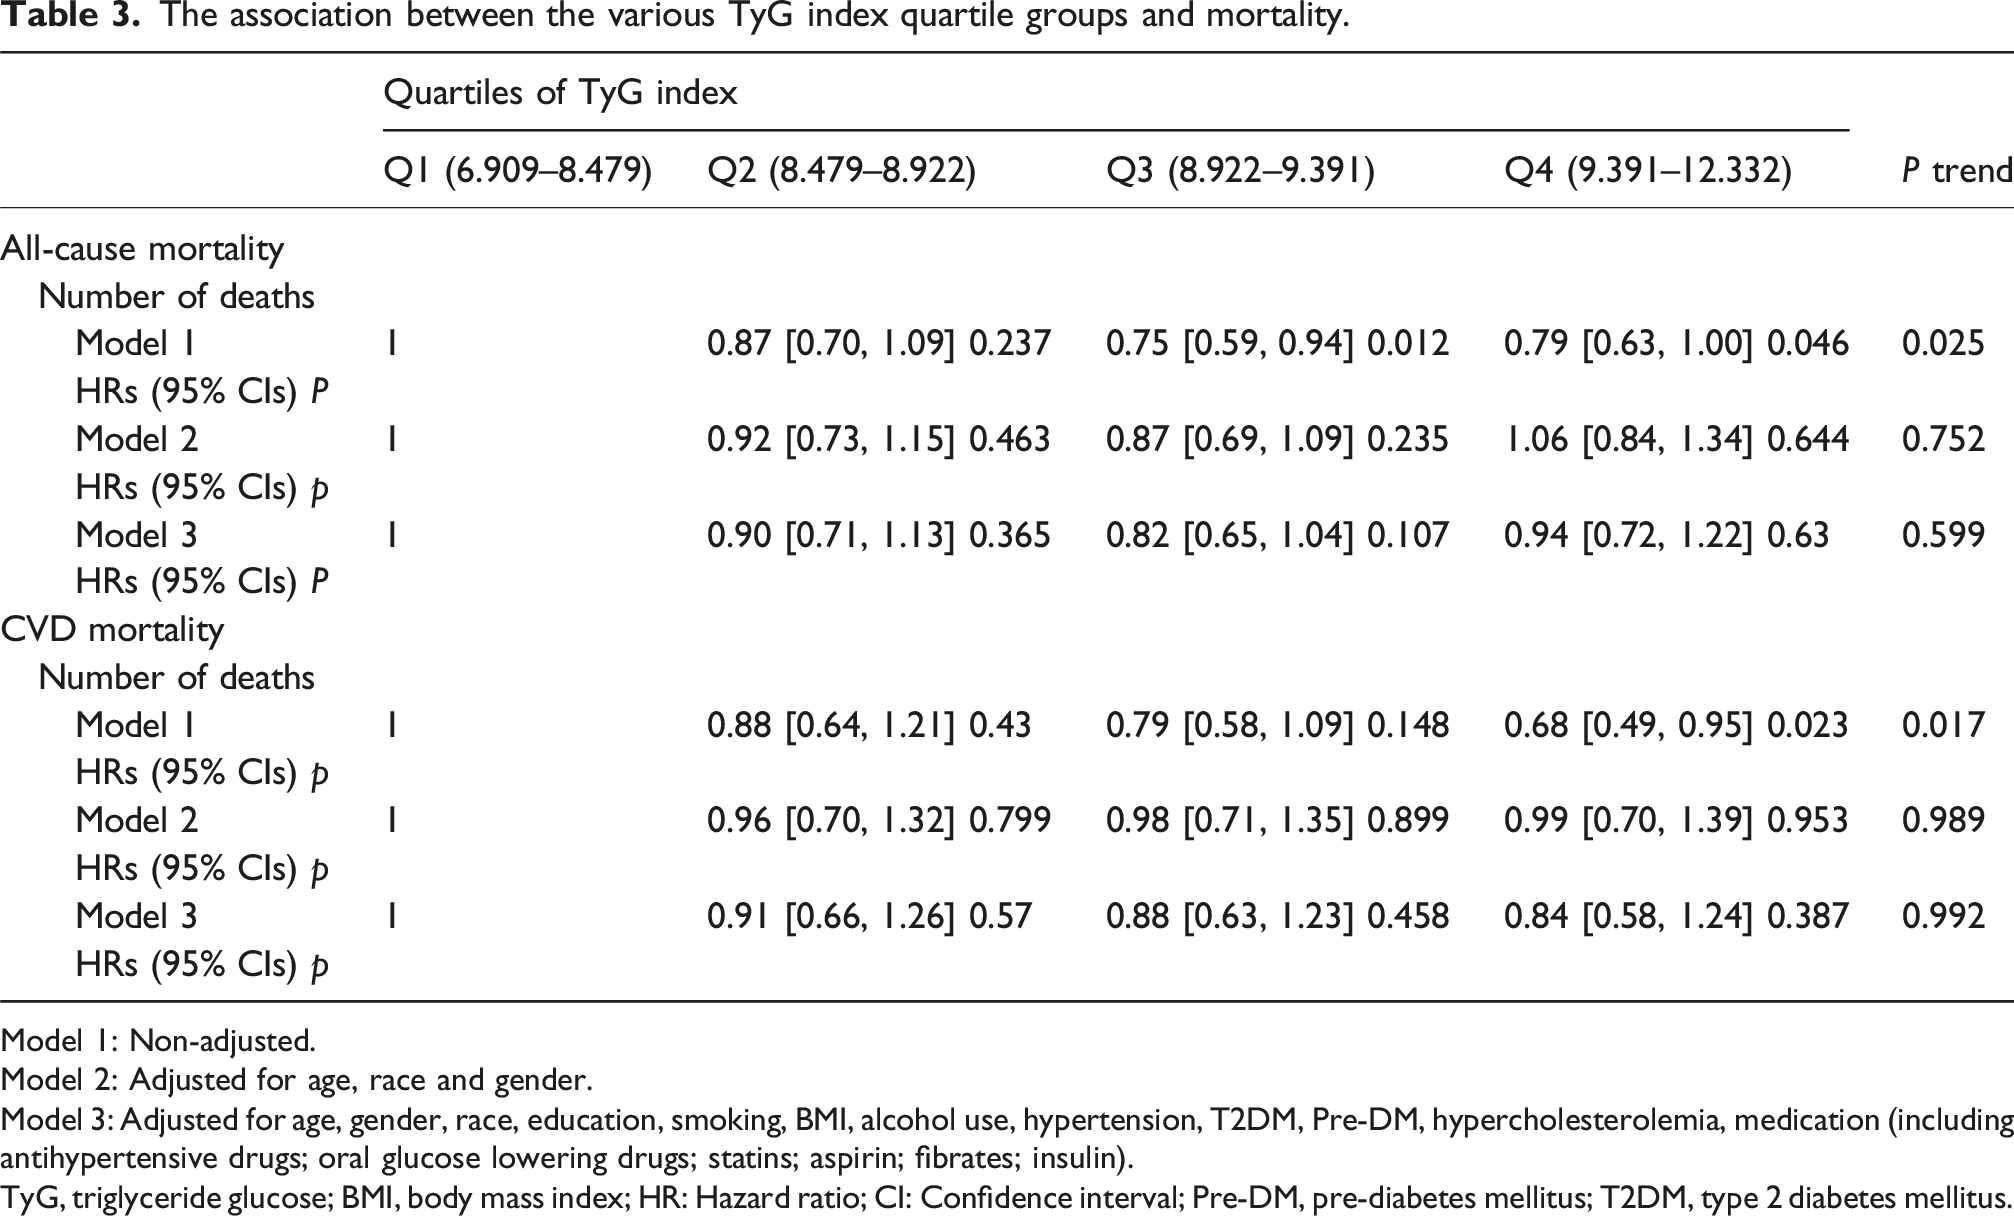
Model 1: Non-adjusted.
Model 2: Adjusted for age, race and gender.
Model 3: Adjusted for age, gender, race, education, smoking, BMI, alcohol use, hypertension, T2DM, Pre-DM, hypercholesterolemia, medication (including antihypertensive drugs; oral glucose lowering drugs; statins; aspirin; fibrates; insulin).
TyG, triglyceride glucose; BMI, body mass index; HR: Hazard ratio; CI: Confidence interval; Pre-DM, pre-diabetes mellitus; T2DM, type 2 diabetes mellitus.
The nonlinear relationships between TyG index and mortality
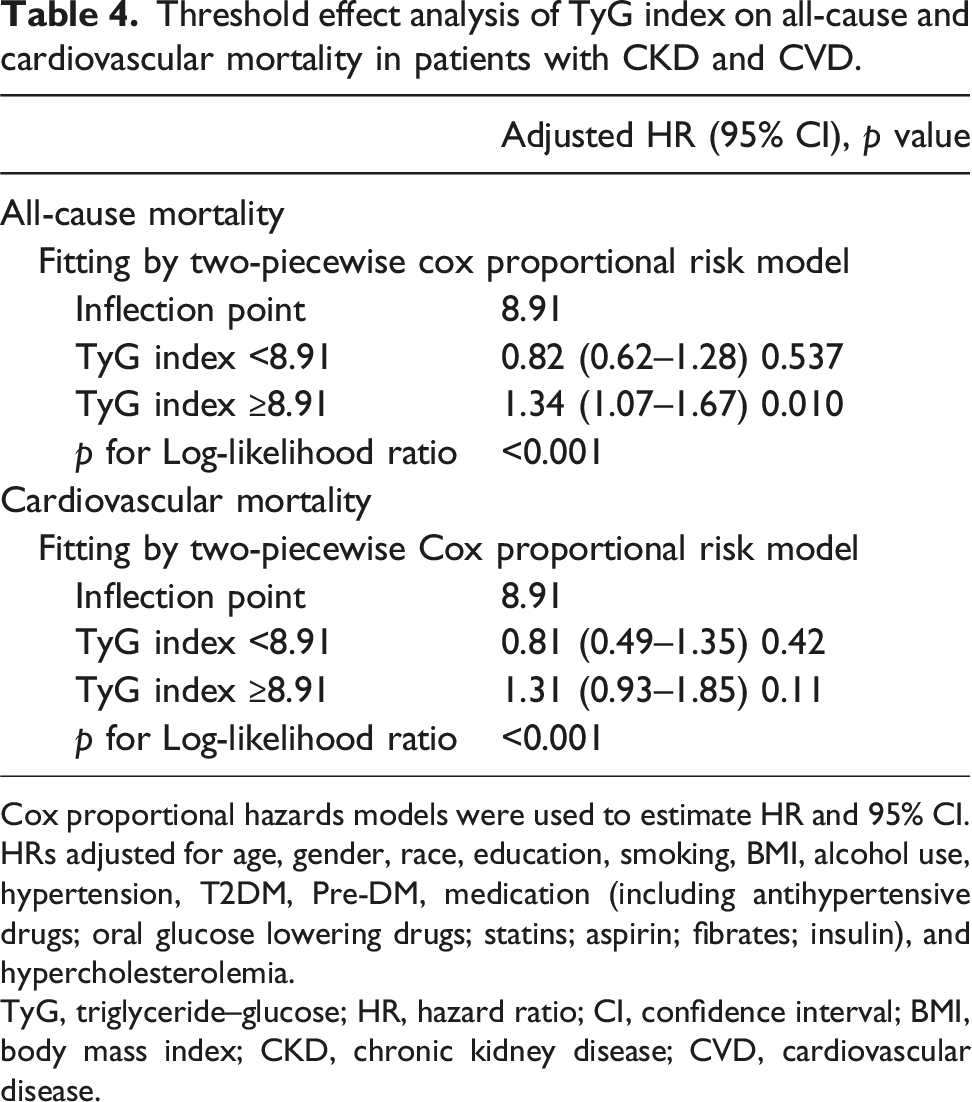
We used a Cox proportional hazards regression models with restricted cubic splines to explore the relationship between the TyG index and all-cause and cardiovascular mortality. The adjusted smoothed plots indicated U-shaped associations between the TyG index and all-cause (p for nonlinear association = 0.002, p for overall significance = 0.009, Figure 2(a)) and cardiovascular mortality (p for nonlinear association = 0.014, p for overall significance = 0.04, Figure 2(b)). In two-piecewise Cox proportional hazards regression models (Table 4), the inflection points for both all-cause and cardiovascular mortality were 8.91 (both p for Log-likelihood ratio <0.001). The baseline TyG index and the risk of all-cause mortality showed a significantly positive association when the TyG index were above 8.91 (HR 1.34, 95% CI 1.07–1.67; p = 0.01) after adjustments for age, gender, race, education, smoking, BMI, alcohol use, hypertension, T2DM, Pre-DM, medication, and hypercholesterolemia, while the TyG index below the threshold value showed an approximately negative association with the risk of all-cause mortality (HR 0.82, 95% CI 0.62–1.28; p = 0.537). The baseline TyG index and the risk of cardiovascular mortality showed approximately negative association (HR 0.81 95% CI = 0.49–1.35, p = 0.42) when the TyG index did not reach the threshold value; when the TyG index exceeded the threshold value, it was nearly positively associated with the risk of cardiovascular mortality (HR 1.31 95% CI = 0.93-1.85, p = 0.11). The association between the TyG index and mortality Threshold effect analysis of TyG index on all-cause and cardiovascular mortality in patients with CKD and CVD. Cox proportional hazards models were used to estimate HR and 95% CI. HRs adjusted for age, gender, race, education, smoking, BMI, alcohol use, hypertension, T2DM, Pre-DM, medication (including antihypertensive drugs; oral glucose lowering drugs; statins; aspirin; fibrates; insulin), and hypercholesterolemia. TyG, triglyceride–glucose; HR, hazard ratio; CI, confidence interval; BMI, body mass index; CKD, chronic kidney disease; CVD, cardiovascular disease.
Subgroup analysis
We conducted the subgroup analysis of all-cause and cardiovascular mortality based on gender and different CKD risk groups among the included individuals. No significant interaction was found between these stratified variables and baseline TyG index. A U-shaped relationship between baseline TyG index and all-cause (Figure 3(a)) and cardiovascular mortality (Figure 3(c)) was also found in male patients (p for non-linear <0.05) after adjustments for age, race, education, smoking, BMI, alcohol use, hypertension, pre-DM, T2DM, CKD groups, medication and hypercholesterolemia. Although a statistically significant nonlinear association between the TyG index and mortality was observed in female patients (p = 0.02), no significant overall association was detected (p > 0.05). In stratified analyses of CKD risk groups, the TyG index and all-cause mortality also presented nonlinear relationship among patients with high (Figure 4(b)) and very high (Figure 4(c)) CKD risk group (p for non-linear <0.05) though no significant overall association was observed (p > 0.05). The association between the TyG index and mortality stratified by genders The associations between the TyG index and mortality stratified by CKD risk groups

Discussion
This study identified a U-shaped relationship between the TyG index and both all-cause and cardiovascular mortality in individuals with CKD and CVD from NHANES 1999–2018. When the TyG index exceeded 8.91, it was significantly associated with the increasing risk of all-cause mortality. Males exhibited a nonlinear U-shaped association, but this was not observed in females. These findings suggest that the TyG index can serve as a valuable risk indicator for mortality in this population, potentially aiding in the development of targeted prevention strategies.
We found a U-shaped relationship between the TyG index and all-cause mortality, with a significant positive association when the index exceeded 8.91, consistent with previous studies. For example, a TyG index over 9.36 in the general population 17 and over 9.05 in diabetic populations was associated with increased mortality risk. 9 Among young diabetic patients (age ≤65 years), the threshold for all-cause mortality was identified as 9.18. 18 A similar pattern was seen in cardiometabolic syndrome patients. 10 Although the underlying mechanisms linking the TyG index to mortality are not yet fully understood, biologically plausible explanations can be proposed based on the role of the TyG index as a surrogate marker of insulin resistance (IR).8,19 IR is known to trigger inflammation, oxidative stress and metabolic disturbances, leading to the development of CKM, all of which significantly elevate mortality risk. 20 However, below the threshold of 8.91, the association with mortality was negative but not statistically significant, consistent with findings from Liu et al. 18 and Yao et al. 21 While some studies aforementioned found that the TyG index lower than particular threshold value were negative associated with mortality risks.9,10 Discrepancies may stem from several factors. In this study, the mean age of patients with TyG index values below 8.91 was higher than that of patients with TyG index values above 8.91. Furthermore, our study had a higher mean age than those in prior studies. Older individuals tend to have more comorbidities and poorer organ function compared to younger patients, potentially diminishing the TyG index’s predictive power. Racial differences also play a role. The proportion of non-Hispanic Black patients in our study was higher than in previous studies. Compared to Caucasians, African Americans have reduced mitochondrial oxidative capacity and metabolic flexibility, key contributors to insulin resistance, 22 which may limit the TyG index’s predictive accuracy for mortality. Lastly, although our study found no significant association below the threshold, evidence from this and other studies suggests that very low TyG values may increase mortality risk, potentially due to reduced TG levels reflecting energy deficiency, vitamin insufficiency, immune impairment, or metabolic dysregulation—elevating risks of malnutrition, neurological dysfunction, and death.23,24 The U-shaped relationship reflects the balance between optimal metabolic reserves and the harms of excess or deficiency, with the threshold effect underscoring its complexity and warranting further study to clarify its biological and clinical implications.
We also found a significant nonlinear and U-shaped relationship between the TyG index and cardiovascular mortality. However, no significant result emerged from two-piecewise Cox regression models. Some studies have also shown no significant association between TyG index and cardiovascular mortality among older populations.25–27 The mean age of participants in our study reached 70.78 years. We initially intended to perform a stratified analysis by age, however, due to the limited number of younger participants, we did not perform this age subgroup analysis. Additionally, Yao and colleagues did not find significant associations between the TyG index and cardiovascular mortality in general T2DM patients. 21 Given the evidence above, the lack of significance may be due to differences in age, comorbidities, and lifestyle factors among participants. Thus, the TyG index’s predictive value for cardiovascular mortality requires further investigation in larger, more diverse cohorts (varying CKM profiles).
We found a nonlinear association between the TyG index and cardiovascular mortality in males, whereas no significant association was observed in females, consistent with previous findings. 28 This disparity could be attributed to several factors. First, estrogen exerts protective effects on lipid metabolism and glucose homeostasis by enhancing insulin sensitivity, reducing hepatic triglyceride synthesis, and modulating inflammation 29 —potentially mitigating extreme TyG-related risks in women. Second, men typically have higher visceral fat deposition than women, which is strongly associated with IR, inflammation, and atherogenic dyslipidemia.30,31 This predisposition may amplify the risks linked to a high TyG index in males. Third, behavioral differences such as higher rates of smoking, alcohol use, and poor diet in men 32 may exacerbate metabolic risks associated with an elevated TyG index. These results highlight the need for sex-specific risk assessment and intervention strategies.
As life expectancy increases, the prevalence of multiple chronic diseases rises. The complex interactions among CKD, CVD, and metabolic diseases substantially elevate the risk of adverse outcomes, necessitating integrated management rather than a single-disease approach. Recently, the American Heart Association (AHA) president introduced the concept of cardiovascular-kidney-metabolic syndrome (CKM), emphasizing multidisciplinary collaboration and effective screening strategies. 5 The TyG index, calculated using fasting glucose and triglyceride levels, is a simple, accessible tool easily integrated into routine clinical practice. Its accessibility and strong association with CKM-related risks make it valuable for identifying at-risk individuals and guiding comprehensive management.
Strengths and limitations
Our study has several notable strengths. Firstly, it assessed the association between the TyG index and all-cause as well as cardiovascular mortality in patients with CKD and CVD for the first time, thus contributing valuable insights to the utility of the TyG index in the CKM population. Secondly, the study population was derived from a nationally representative NHANES cohort, which was identified through a sophisticated multistage probability sampling methodology. However, there were several limitations to consider. Firstly, while NHANES provides valuable population-level data, our study is subject to the inherent limitations of observational research, which may lead to residual confounding. Secondly, the study used baseline TyG index values and could not assess changes over time. Third, the limited number of younger participants and insufficient data on cardiovascular events in this subgroup restricted more detailed age-stratified analyses. Future research should focus on more diverse populations to better understand the TyG index’s predictive value across age groups and CKM conditions.
Conclusion
This study demonstrated a non-linear and U-shaped association between the TyG and both all-cause and cardiovascular mortality among patients with CKD and CVD. Males exhibited a non-linear association between the TyG and cardiovascular mortality, while this pattern was not observed in females. These findings suggest that maintaining an optimal TyG index is crucial for minimizing mortality risks in these patients, and sex differences should be considered for early intervention. Further studies are warranted to explore the mechanisms underlying this relationship and to confirm the predictive value of the TyG index values in different combination of CKM conditions.
Footnotes
Acknowledgments
We are grateful to all staff and the participants of the NHANES study for their valuable contributions.
Ethical considerations
Consent to participate
All participants provided written consent after being fully informed.
Author contributions
Conceptualization: JL and YH. Acquisition, analysis, or interpretation of data: JL, YH, LT, YL and XL. Drafting of the article: JL, YH, LT and KG. Critical revision of the article for important intellectual content: All authors. Obtained funding: JL and KG. Supervision: JL.
Funding
The authors disclosed receipt of the following financial support for the research, authorship, and/or publication of this article: This work was supported by the Science and Technology Innovation Committee of Shenzhen Municipality (No. JCYJ20220531102202005) and Shenzhen Natural Science Foundation (No. 20231121155815002). The funder had no role in study design, data collection, analysis, reporting, or the decision to submit for publication.
Declaration of conflicting interests
The author declared no potential conflicts of interest with respect to the research, authorship, and/or publication of this article.