
Abstract
Objective:
To investigate the relationship of 1-h postload plasma glucose during the oral glucose tolerance test with the severity of coronary artery lesions and risk of 1-year re-admission in coronary heart disease patients with normal glucose tolerance.
Methods:
A total of 266 consecutive coronary heart disease patients who underwent coronary angiography and had normal glucose tolerance confirmed by oral glucose tolerance test during hospitalization were prospectively enrolled and followed in two groups according to the 1-h postload plasma glucose cut-off point (1-h postload plasma glucose <155 mg/dL, n = 149 and 1-h postload plasma glucose ⩾155 mg/dL, n = 117). Angiographic severity was assessed by number of diseased vessels, lesion morphology and Gensini score. The risk of 1-year re-admission with adverse cardiovascular events after discharge was analysed.
Results:
Subjects with a 1-h postload plasma glucose ⩾155 mg/dL had higher incidence of multivessel disease and complex lesions, Gensini score and risk of 1-year re-admission than subjects with a 1-h postload plasma glucose <155 mg/dL (all p < 0.05). In the stepwise multivariate regression analysis, 1-h postload plasma glucose was the major determinant of the Gensini score. Subgroup analyses by sex showed that men with a 1-h postload plasma glucose ⩾155 mg/dL had higher incidence of complex lesions and risk of 1-year re-admission than men with a 1-h postload plasma glucose <155 mg/dL (all p < 0.05).
Conclusion:
Coronary heart disease patients with normal glucose tolerance and elevated 1-h postload plasma glucose levels had a greater severity of coronary artery lesions and an increased risk of re-admission with adverse cardiovascular events, particularly in men.
Keywords
Introduction
It is well known that individuals with impaired fasting glucose (IFG) and/or impaired glucose tolerance (IGT) are at increased risk for both type 2 diabetes and cardiovascular disease (CVD), with the oral glucose tolerance test (OGTT) being the standard method for diagnosis. 1 However, longitudinal epidemiological studies have shown that a significant portion of individuals who develop type 2 diabetes have normal glucose tolerance (NGT) at baseline, 2 and several studies have demonstrated a significant risk for CVD even in individuals with NGT. Therefore, it is essential that individuals with NGT at increased cardiovascular risk are identified at an early stage to establish early intervention programmes for reducing the incidence of CVD.
Recently, a cut-off point of 155 mg/dL for 1-h postload plasma glucose (1-h PG) during the OGTT is able to identify subjects with NGT at high risk for future type 2 diabetes.3–5 Moreover, in individuals with NGT, a 1-h PG ⩾155 mg/dL is strongly associated with worse cardiometabolic risk profiles such as dyslipidaemia, 6 hyperuricaemia 7 and sub-clinical target organ damage, including early carotid atherosclerosis, 8 left ventricular hypertrophy 9 and non-alcoholic fatty liver disease, 10 all of which are independent predictors of CVD. Furthermore, it has been demonstrated that an elevated 1-h PG level is associated with increased risk of CVD and mortality and that 1-h PG is a better predictor of cardiovascular morbidity and adverse outcomes than the 2-h PG level.11–14 With respect to coronary heart disease (CHD), Orencia et al. 12 reported that 1-h PG was an independent risk factor for fatal CHD in nondiabetic subjects. In the Reykjavik study, an elevated 1-h PG level was associated with higher CHD risk in people without diabetes. 15 However, studies regarding 1-h PG are lacking in CHD patients with NGT.
Therefore, the aim of this study was to investigate the relationship of 1-h PG levels during the OGTT with the severity of coronary artery lesions and risk of 1-year re-admission with adverse cardiovascular events in CHD patients with NGT.
Methods
Study subjects and design
Patients diagnosed with CHD by coronary angiography at the First Affiliated Hospital of Xi’an Jiaotong University from January 2015 to January 2017 were prospectively enrolled if they had NGT according to OGTT during hospitalization. NGT was defined on the basis of OGTT using the following criteria of the American Diabetes Association (ADA): 16 an fasting plasma glucose (FPG) concentration <100 mg/dL, a 2-h postload plasma glucose (2 h PG) concentration <140 mg/dL and an HbA1c level <5.7%. The exclusion criteria were as follows: diabetes mellitus, IFG, IGT, pregnancy, recent trauma, cancer, cardiomyopathy, rheumatic heart disease, severe heart failure, chronic lung disease, hepatic or renal disease, immune disease, chronic gastrointestinal disease, chronic pancreatitis, a history of any malignant disease or a history of treatments altering glucose metabolism.
According to the 1-h PG cutoff point of 155 mg/dL, all the included patients (n = 266) were divided into two groups for data analysis, and then followed up until 1 year after discharge for re-admission with adverse cardiovascular events. The study was approved by the Ethical Committee of the First Affiliated Hospital of Xi’an Jiaotong University, and all participants gave informed consent.
Laboratory tests
Baseline laboratory data were obtained from venous blood samples taken on the second day of hospitalization after a 12-h overnight fast. Levels of high- and low-density lipoprotein (HDL and LDL, respectively) cholesterol, triglycerides, total cholesterol, apolipoprotein A, apolipoprotein B, lipoprotein(a), high-sensitivity C-reactive protein (hs-CRP), HbA1c and serum creatinine, white blood cell (WBC) counts, neutrophil (NEUT) counts, lymphocyte (LYMPH) counts and monocyte (MONO) counts were measured. The estimated glomerular filtration rate (eGFR) was calculated using the Chronic Kidney Disease Epidemiology Collaboration (CKD-EPI) equation: 17 eGFR = 141 × min (Scr/k,1)α × max (Scr/k,1)−1.209 × 0.993Age × 1.018 (if female), where Scr is serum creatinine, k is 0.7 for females and 0.9 for males, α is −0.329 for females and −0.411 for males, min indicates the minimum of Scr/k or 1 and max indicates the maximum of Scr/k or 1.
After 12-h of fasting, a 75-g OGTT was performed with 0-, 60-, 120- and 180-min sampling for plasma glucose and insulin. The Matsuda index [insulin sensitivity index (ISI)] was calculated as follows: 18 10,000/square root of [fasting glucose (mmol/L) × fasting insulin (mU/L)] × [mean glucose × mean insulin during OGTT]. The homeostasis model assessment of insulin resistance (HOMA-IR) index was calculated as follows: 19 plasma insulin (mU/L) × plasma glucose (mmol/L)/22.5.
Coronary angiography
Coronary angiography was performed in patients with symptoms of angina pectoris and positive results of various examinations [e.g. exercise treadmill test, coronary computerized tomography (CT), myocardial perfusion imaging], who were strongly suspected of having CHD and were admitted to the hospital from the outpatient or emergency department.
Coronary angiograms were assessed by two experienced cardiologists blindly. CHD was defined as the presence of one or more coronary arteries with the luminal diameter stenosis reaching or more than 50%. In this study, angiographic severity was assessed by the number of diseased vessels, lesion morphology and Gensini score. The number of diseased vessels was coded as 1, 2 or 3 according to the number of major coronary arteries with luminal diameter stenosis reaching or more than 50%. Multivessel disease was defined as at least two major coronary arteries involved. Lesion categorization into Type A, Type B or Type C was determined by a joint American College of Cardiology/American Heart Association (ACC/AHA) task force. A Type A lesion was defined as simple, and Type B and C lesions were defined as complex. 20 The Gensini score considered the degree of luminal narrowing and the importance of the site of coronary stenosis, as previously described. 21
Definition of 1-year re-admission with adverse cardiovascular events
The adverse cardiovascular events, including cardiac death, myocardial infarction, unstable angina pectoris, malignant arrhythmia, cardiac arrest, cardiogenic shock, cardiogenic syncope, coronary revascularization and stroke, were ascertained from a review of medical records and confirmed by direct dialogue with the patients, their families and physicians following discharge. When a patient was re-admitted to the hospital more than once within 1 year after discharge, only the first re-hospitalization was included.
Statistical analysis
Continuous variables were expressed as the mean values and the standard deviation for normally distributed data, and as the median (interquartile range) for values non-normally distributed data. Categorical variables were expressed as frequencies and percentages. For statistical comparisons, a t test or Mann–Whitney U test was used for continuous variables, and the chi-square test was used for categorical variables. Relationships between variables were examined by stepwise multivariate linear regression analysis to assess their independent contribution to the Gensini score, which was log transformed to normally distribute the data. Kaplan–Meier analysis was performed to assess the risk of 1-year re-admission with adverse cardiovascular events. A p value of <0.05 was considered statistically significant. All analyses were performed using the SPSS software program version 20.0 for Windows.
Results
Baseline characteristics
The study subjects consisted of 200 men (75.2%) and 66 women (24.8%), between 30 and 78 years old (mean age 59.6 ± 9.9 years). A 1-h PG cut-off point of 155 mg/dL during the OGTT was used to divide subjects into two groups: 1-h PG ⩾155 mg/dL (n = 117) and 1-h PG <155 mg/dL (n = 149). The baseline characteristics of the patients in the two groups are shown in Table 1. Subjects with a 1-h PG ⩾155 mg/dL had significantly higher HOMA-IR and lower ISI values compared with subjects with a 1-h PG <155 mg/dL [2.6 (1.9–3.6) vs 1.8 (1.2–2.8), p < 0.001 and 3.2 (2.4–4.5) vs 5.7 (4.1–8.1), p < 0.001]. Compared to subjects with a 1-h PG <155 mg/dL, subjects with a 1-h PG ⩾155 mg/dL exhibited higher inflammatory marker levels, including levels of hs-CRP, WBCs and NEUTs [1.5 (0.8–2.8) vs 0.8 (0.4–1.2), p < 0.001; (6.6 ± 1.7) × 109/L vs (6.0 ± 1.5) × 109/L, p = 0.01; and (4.3 ± 1.5) × 109/L vs (3.8 ± 1.2) × 109/L, p = 0.009, respectively]. There were no significant differences between the two groups with respect to age, sex, smoking status, body mass index, blood pressure, heart rate, eGFR, lipid profiles or medical history (all p > 0.05).
Baseline characteristics of the study subjects.
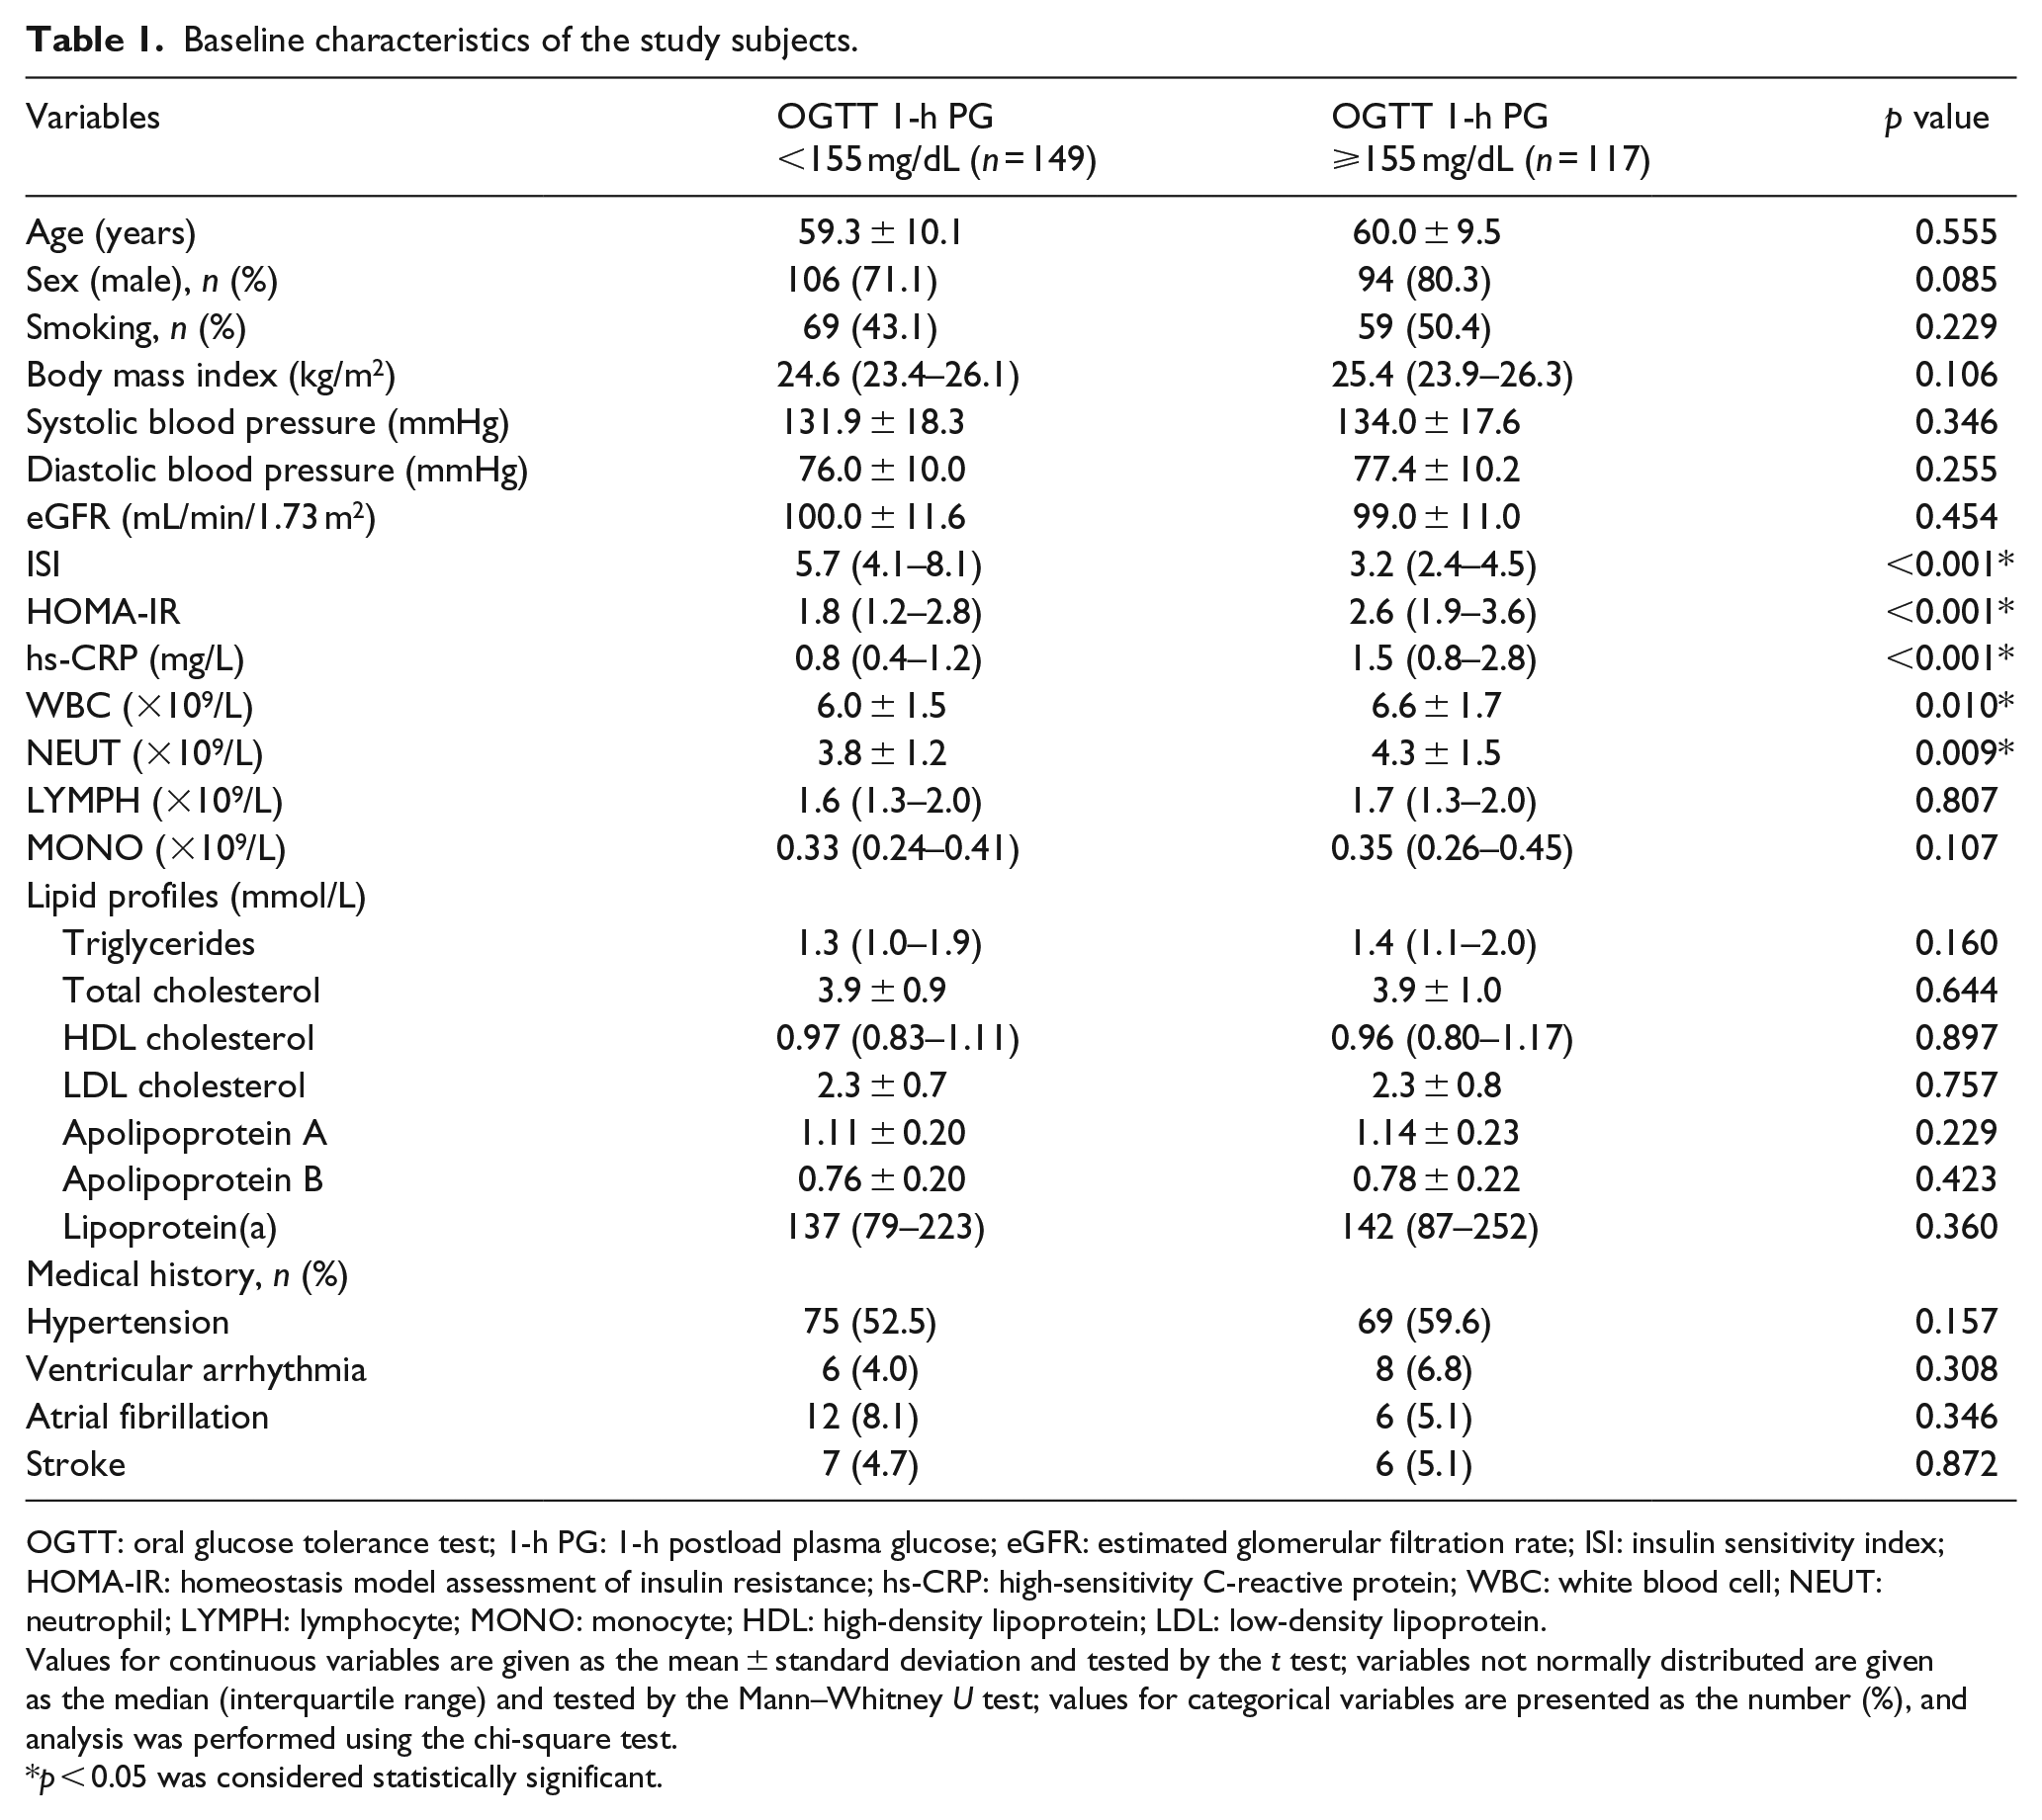
OGTT: oral glucose tolerance test; 1-h PG: 1-h postload plasma glucose; eGFR: estimated glomerular filtration rate; ISI: insulin sensitivity index; HOMA-IR: homeostasis model assessment of insulin resistance; hs-CRP: high-sensitivity C-reactive protein; WBC: white blood cell; NEUT: neutrophil; LYMPH: lymphocyte; MONO: monocyte; HDL: high-density lipoprotein; LDL: low-density lipoprotein.
Values for continuous variables are given as the mean ± standard deviation and tested by the t test; variables not normally distributed are given as the median (interquartile range) and tested by the Mann–Whitney U test; values for categorical variables are presented as the number (%), and analysis was performed using the chi-square test.
p < 0.05 was considered statistically significant.
Angiographic characteristics
The angiographic characteristics of all study subjects are shown in Table 2. Subjects with a 1-h PG ⩾155 mg/dL had a significantly higher percentage of three-vessel and multivessel disease than subjects with a 1-h PG <155 mg/dL (49.5% vs 20.2%, p < 0.001 and 76.9% vs 47.7%, p < 0.001). Regarding lesion morphology, the incidence of complex lesions in subjects with a 1-h PG ⩾155 mg/dL was significantly higher than that in subjects with a 1-h PG <155 mg/dL (48.7% vs 32.2%, p = 0.002). Specifically, the incidence of total occlusion lesions in subjects with a 1-h PG ⩾155 mg/dL was higher than that in subjects with a 1-h PG <155 mg/dL (21.4% vs 11.4%, p = 0.027), but the incidence of diffuse lesions or calcification lesions was not significantly different between the two groups. Moreover, subjects with a 1-h PG ⩾155 mg/dL had significantly higher Gensini scores than subjects with a 1-h PG <155 mg/dL [60 (33–88) vs 28 (16–44), p < 0.001].
Angiographic characteristics of all subjects.
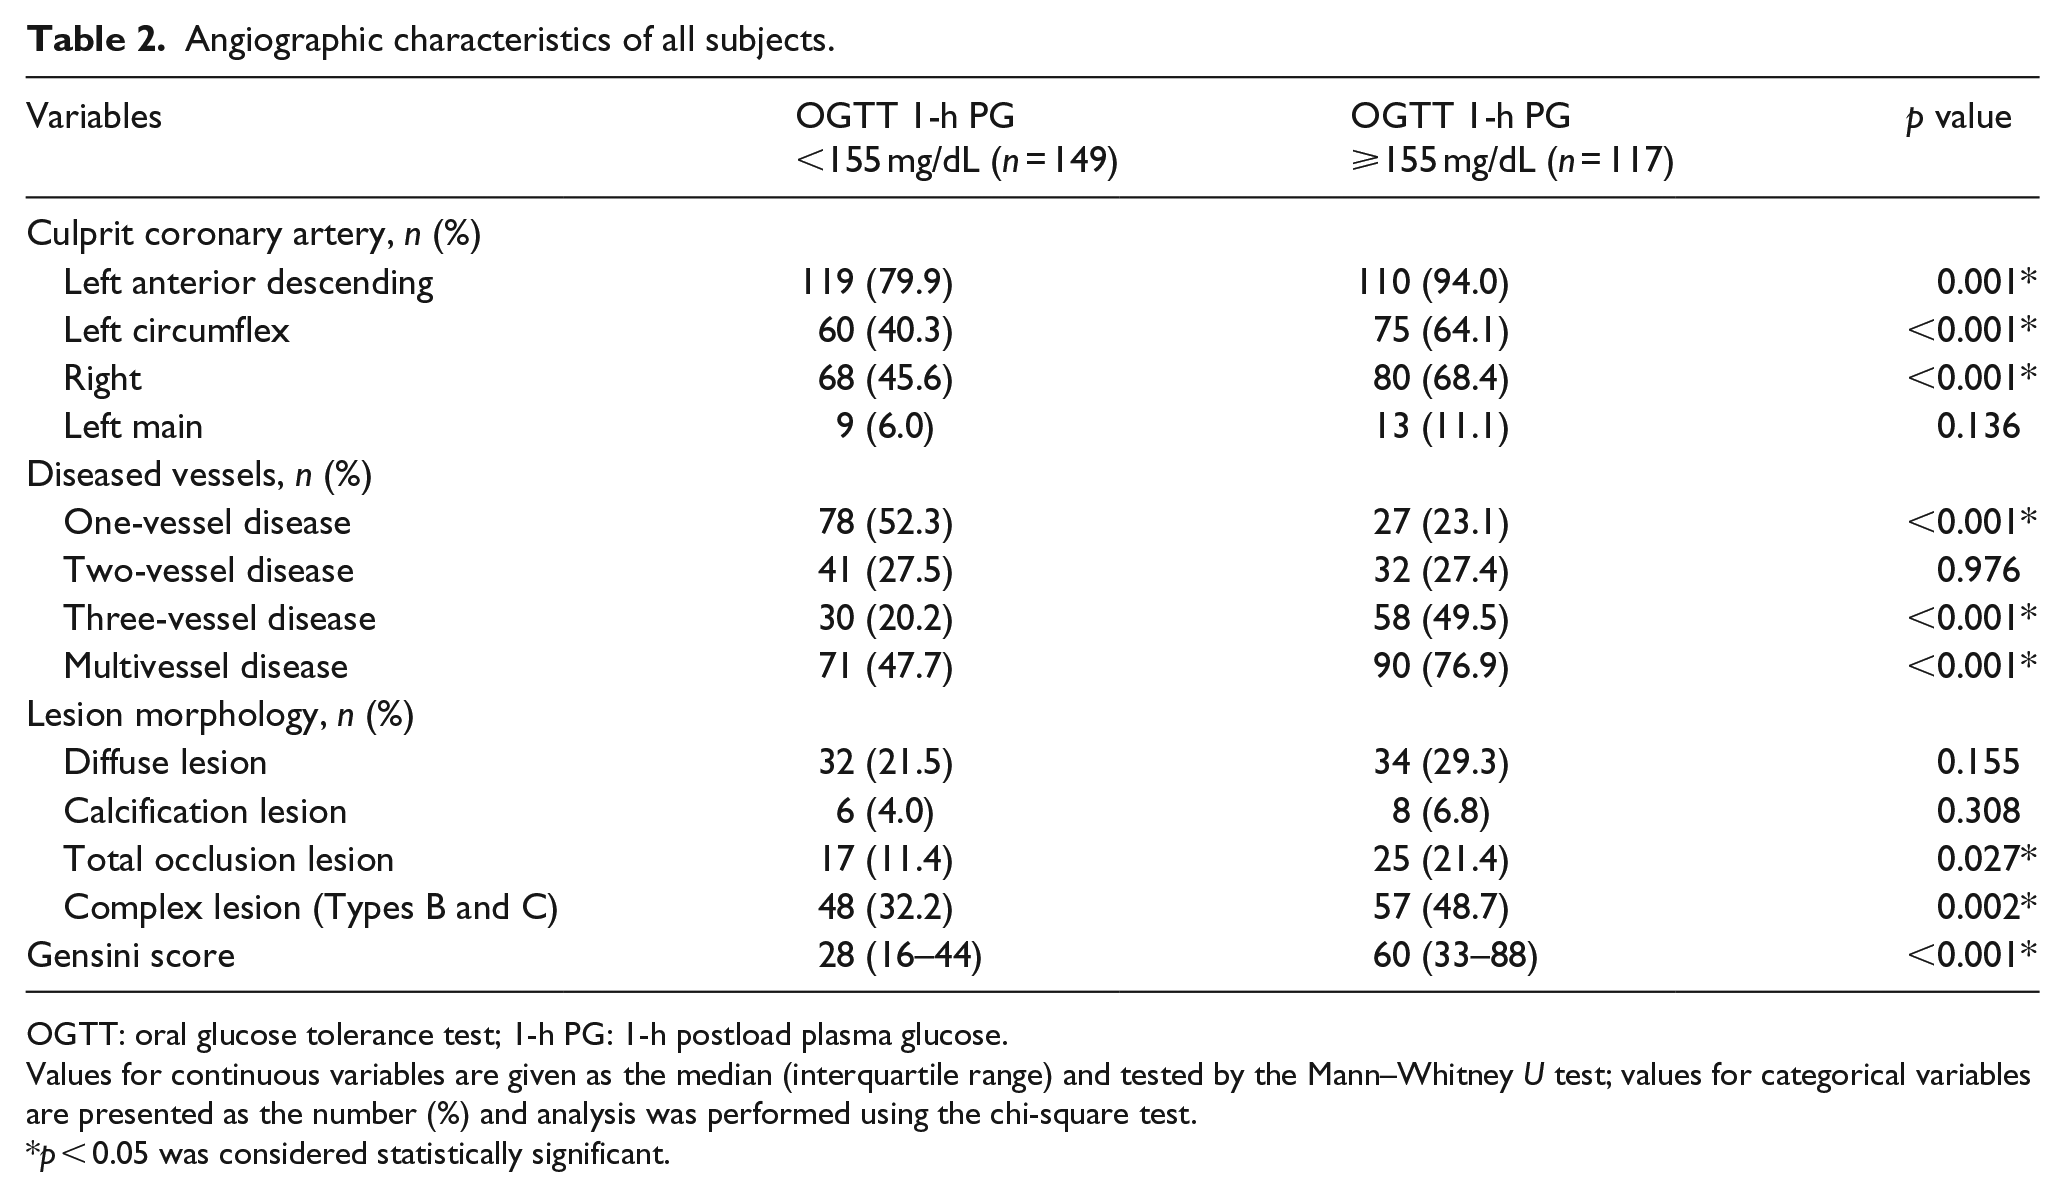
OGTT: oral glucose tolerance test; 1-h PG: 1-h postload plasma glucose.
Values for continuous variables are given as the median (interquartile range) and tested by the Mann–Whitney U test; values for categorical variables are presented as the number (%) and analysis was performed using the chi-square test.
p < 0.05 was considered statistically significant.
Next, angiographic characteristics were stratified by sex (Table 3). Men with a 1-h PG ⩾155 mg/dL had higher involvement of major coronary arteries (all p < 0.05), while women with a 1-h PG ⩾155 mg/dL only had higher involvement of the right coronary artery (65.2% vs 30.2%, p = 0.006). In both men and women, increasing 1-h PG levels were statistically associated with higher incidence of multivessel disease and Gensini score (all p < 0.01). However, regarding lesion morphology, male subjects with a 1-h PG ⩾155 mg/dL had a higher incidence of complex lesions than subjects with a 1-h PG <155 mg/dL (46.8% vs 32.1%, p = 0.033), but this trend was not seen in women. Moreover, male subjects with a 1-h PG ⩾155 mg/dL had a higher incidence of total occlusion lesions, while female subjects with a 1-h PG ⩾155 mg/dL had a higher incidence of calcification lesions (24.5% vs 11.3%, p = 0.015 and 21.7% vs 4.7%, p = 0.033, respectively).
Angiographic characteristics according to sex.
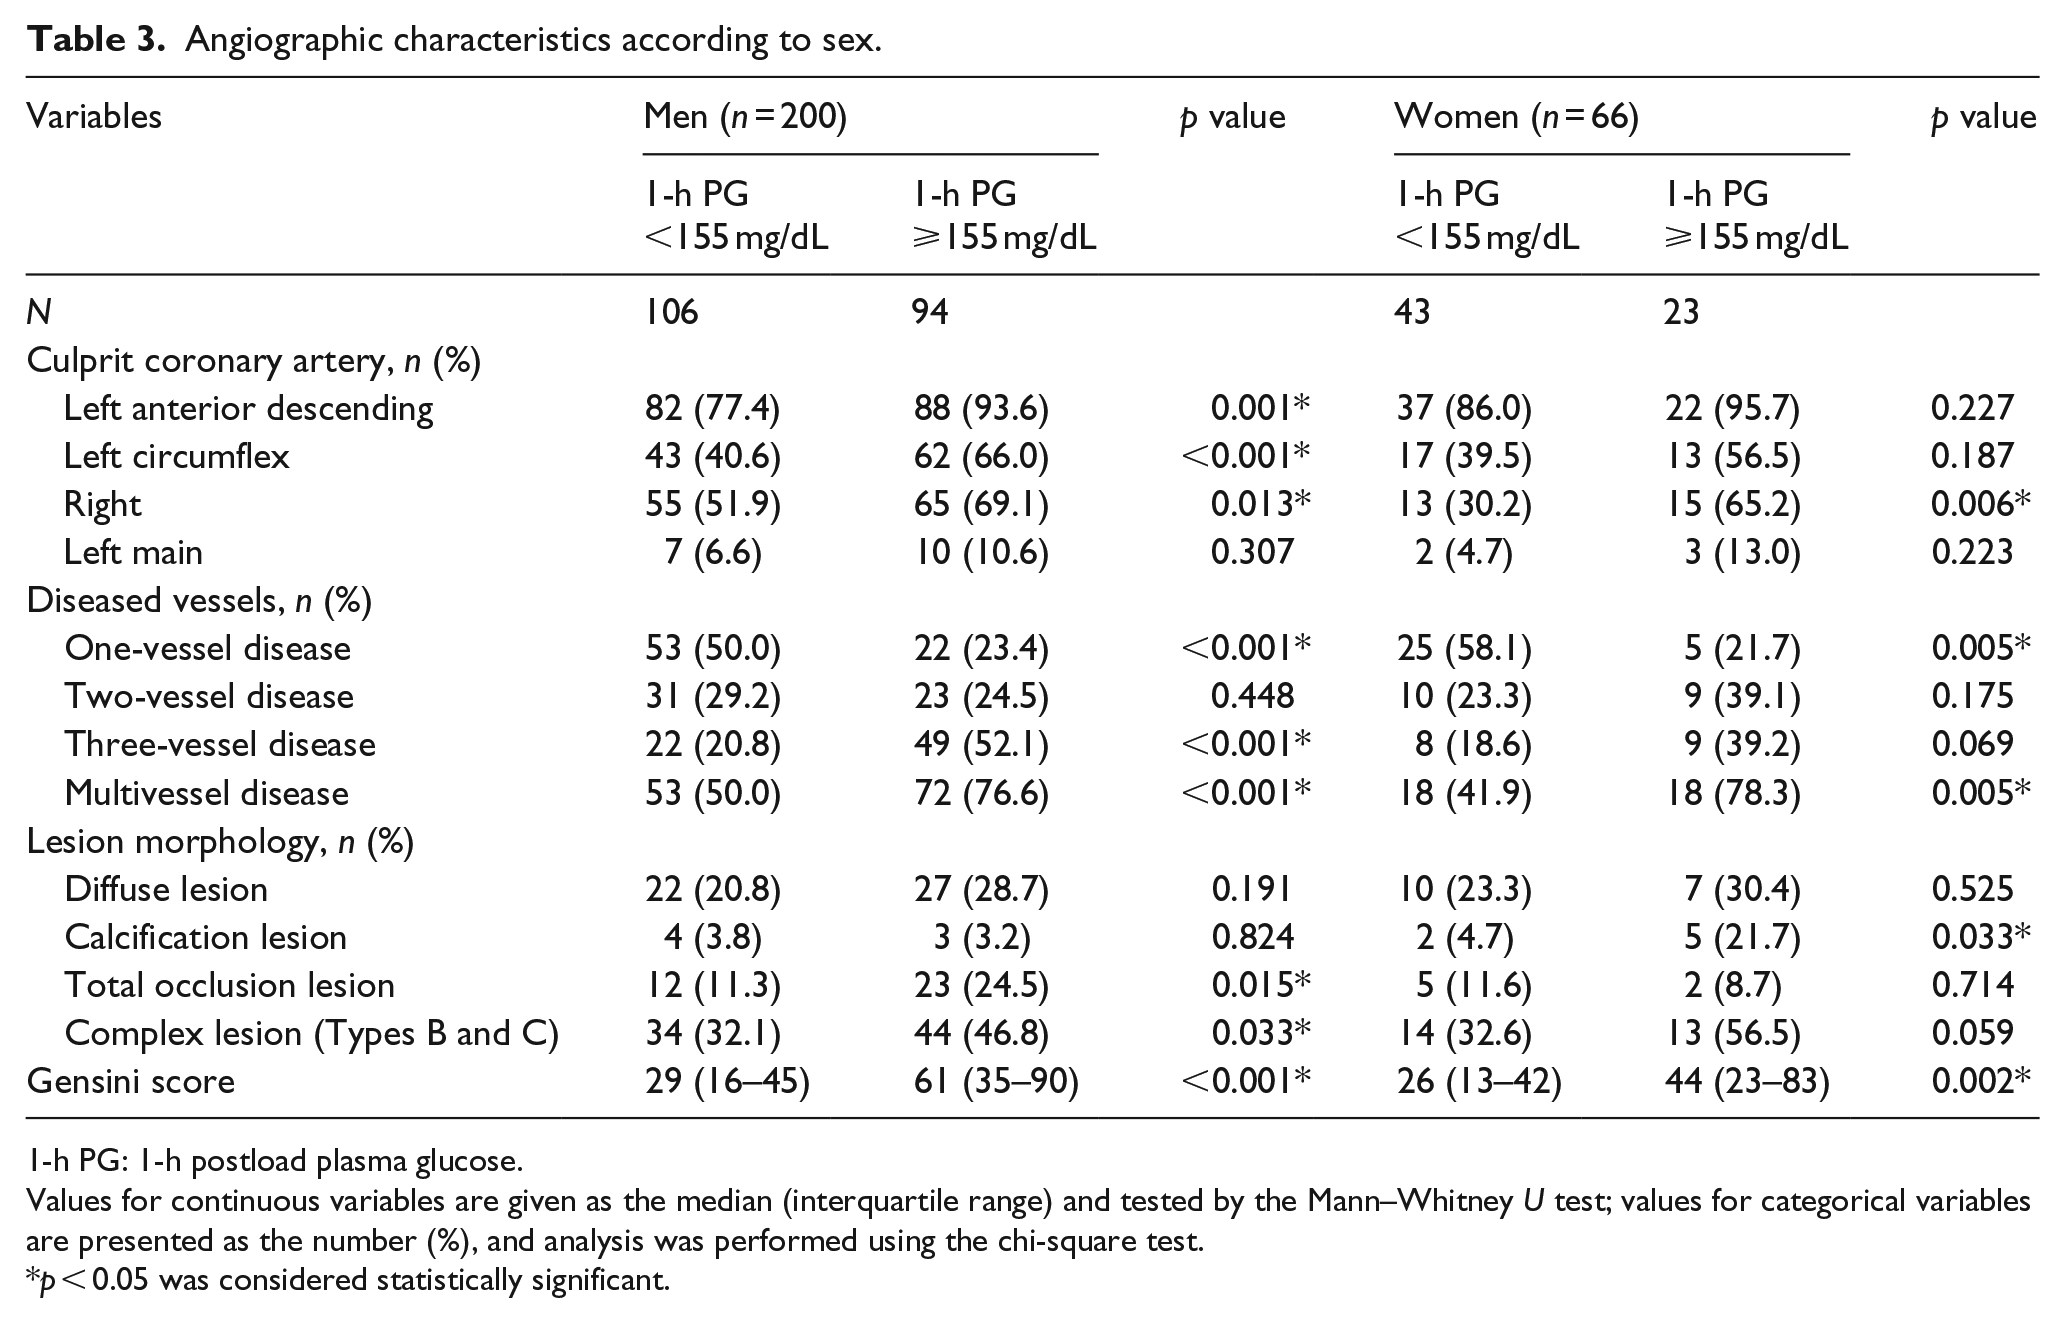
1-h PG: 1-h postload plasma glucose.
Values for continuous variables are given as the median (interquartile range) and tested by the Mann–Whitney U test; values for categorical variables are presented as the number (%), and analysis was performed using the chi-square test.
p < 0.05 was considered statistically significant.
Regression analysis of variables with Gensini score
The 1-h PG value positively correlated with the Gensini score in all subjects (r = 0.367, p < 0.001). To determine the independent predictors of Gensini score, variables reaching statistical significance and traditional or possible risk factors for CHD were examined in a stepwise multivariate linear regression model. This analysis was performed for all subjects. As shown in Table 4, 1-h PG was the major determinant of the Gensini score, explaining 13.1% of its variation (p < 0.001). Other independent predictors were hs-CRP and HOMA-IR, explaining another 1.2% (p = 0.023) and 1.1% (p = 0.034) of the Gensini score variation.
Stepwise multivariable linear regression analysis with Gensini score as the dependent variable in all subjects.
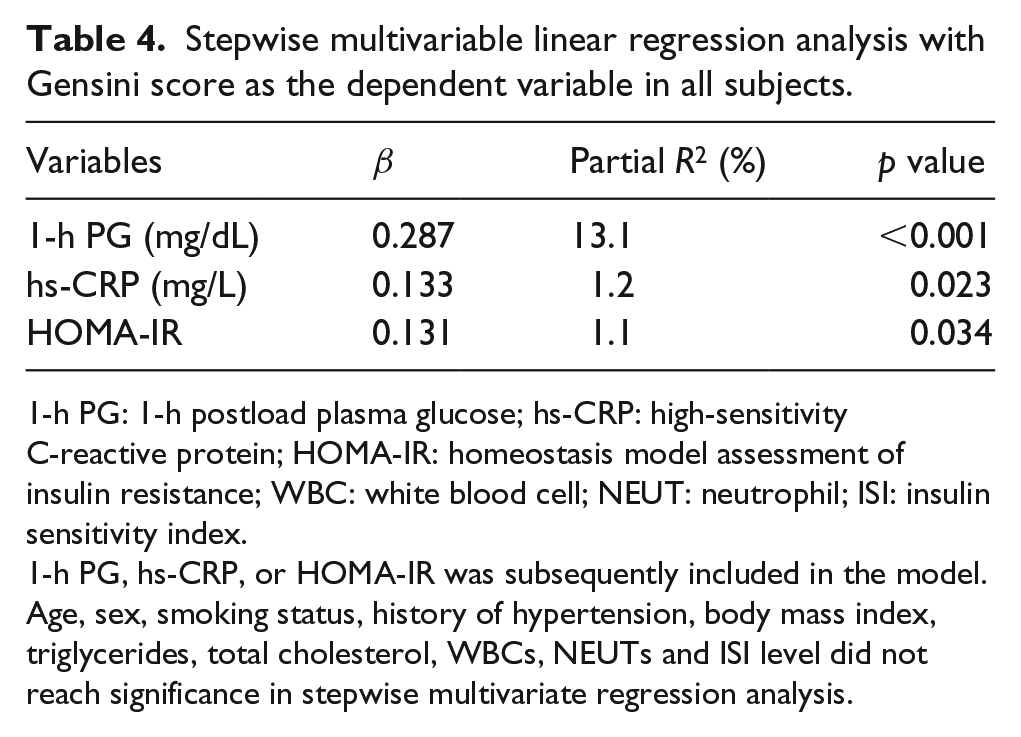
1-h PG: 1-h postload plasma glucose; hs-CRP: high-sensitivity C-reactive protein; HOMA-IR: homeostasis model assessment of insulin resistance; WBC: white blood cell; NEUT: neutrophil; ISI: insulin sensitivity index.
1-h PG, hs-CRP, or HOMA-IR was subsequently included in the model. Age, sex, smoking status, history of hypertension, body mass index, triglycerides, total cholesterol, WBCs, NEUTs and ISI level did not reach significance in stepwise multivariate regression analysis.
Analysis of 1-year re-admission with adverse cardiovascular events after discharge
Compared with subjects with a 1-h PG <155 mg/dL, subjects with a 1-h PG ⩾155 mg/dL exhibited a higher rate of 1-year re-admission with adverse cardiovascular events (17.9% vs 8.7%, p < 0.05). The results of the Kaplan–Meier analysis are shown in Figure 1. The cumulative incidences of 1-year re-admission with adverse cardiovascular events in subjects with a 1-h PG ⩾155 mg/dL and a 1-h PG <155 mg/dL were 19.8% and 8.9%, respectively, which was statistically significant (Breslow test p = 0.016).
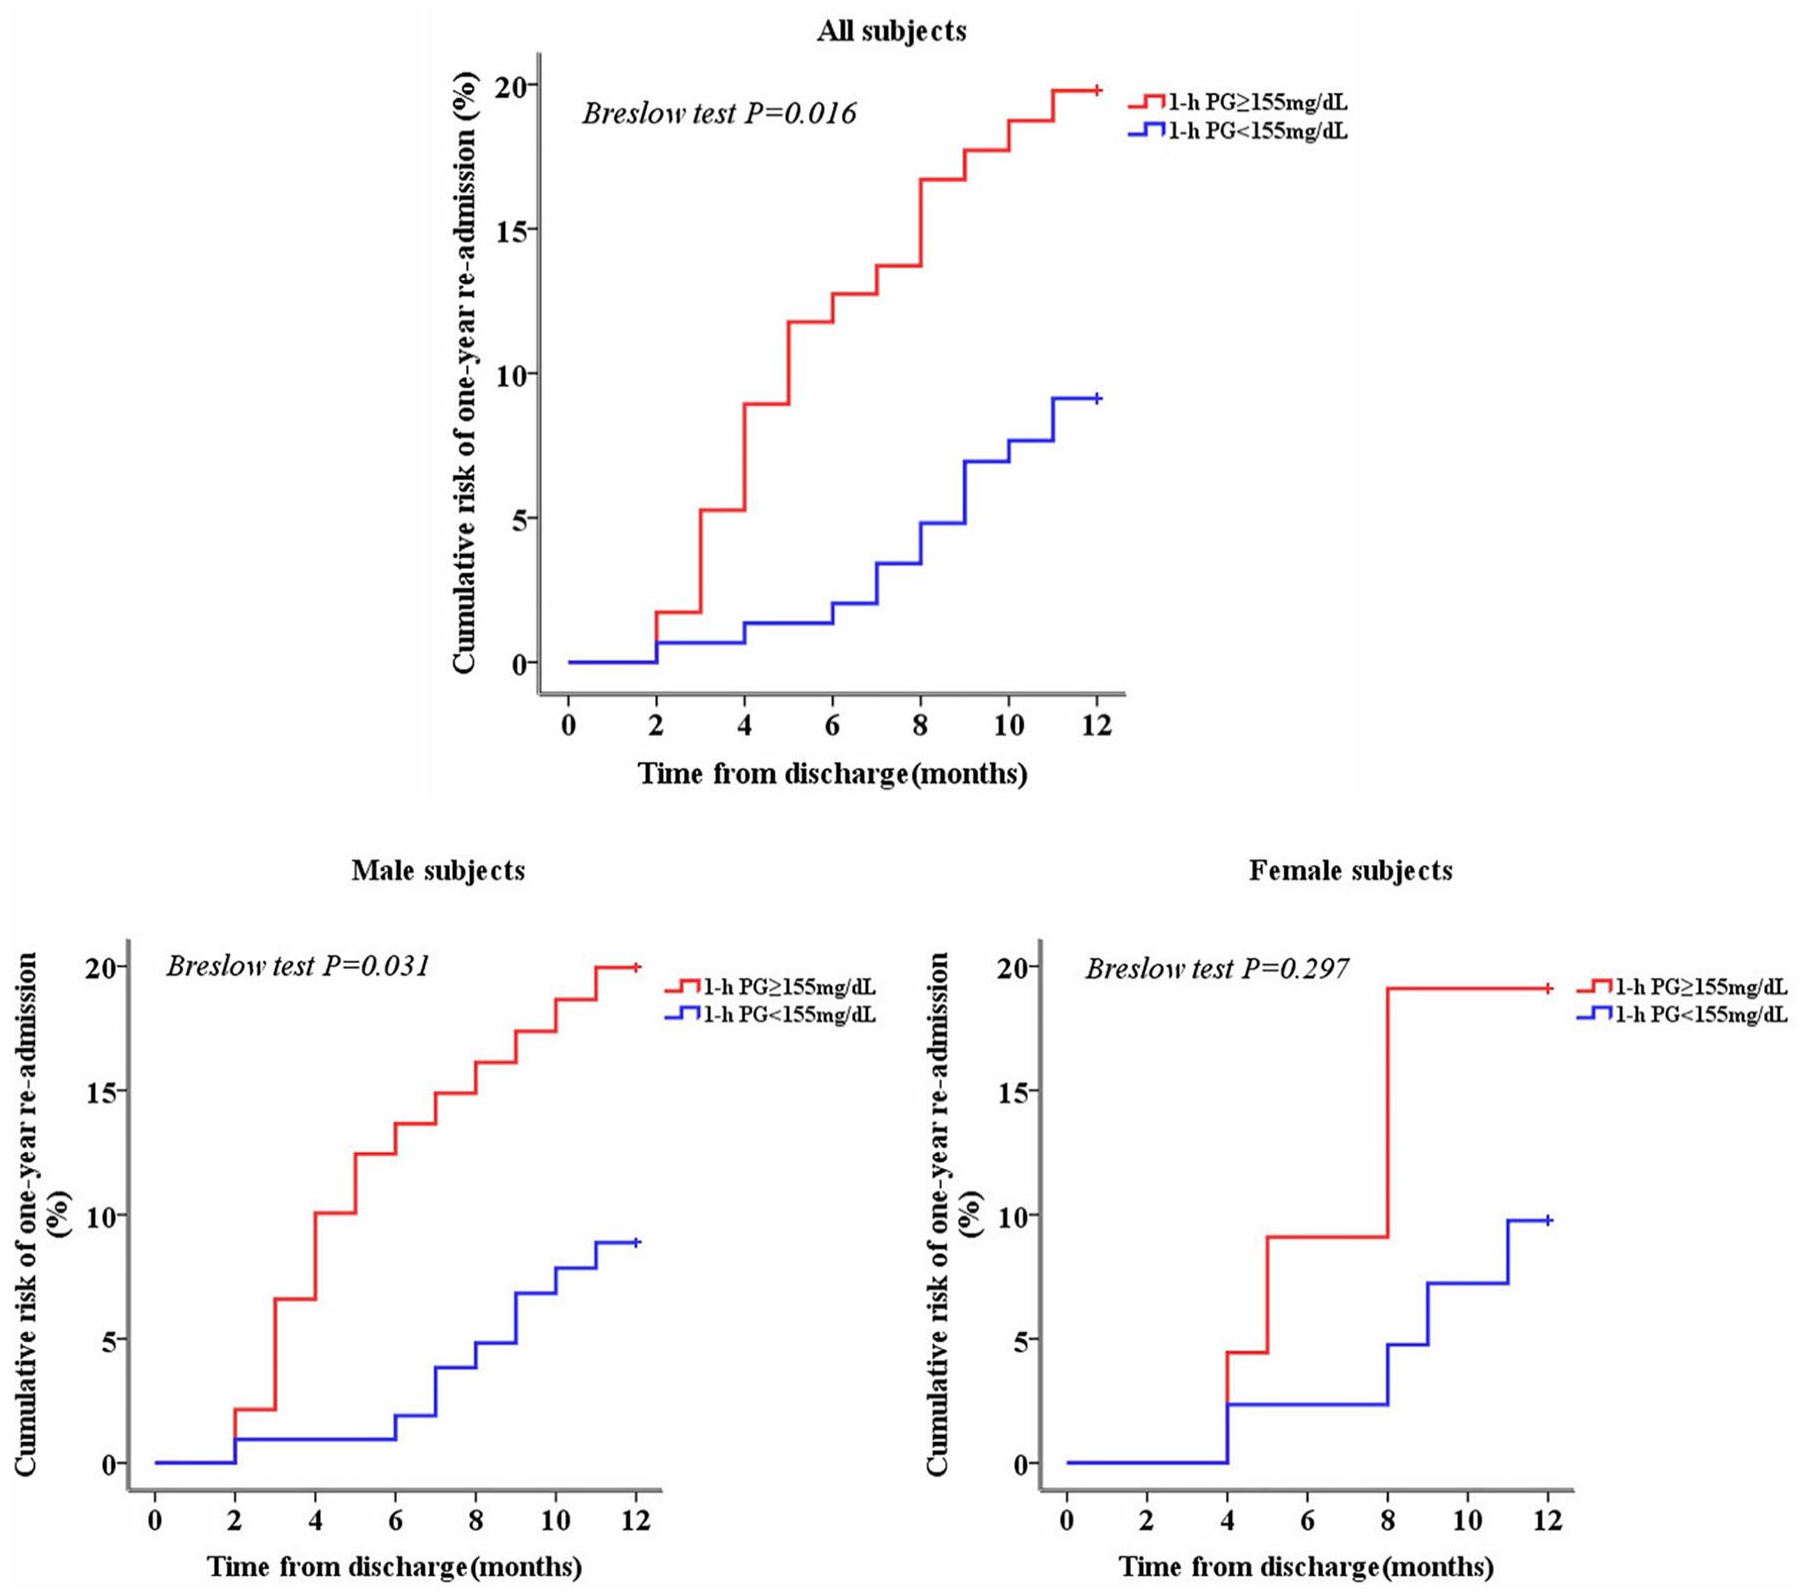
Kaplan–Meier curves showing the cumulative risk of 1-year re-admission with adverse cardiovascular events after discharge in all subjects and stratified by sex.
Subgroup analyses by sex showed that the re-admission rate of men with a 1-h PG ⩾155 mg/dL was higher than that of men with a 1-h PG <155 mg/dL (18.1% vs 8.5%, p < 0.05), whereas this rate was similar in both groups of women. As shown in Figure 1, men with a 1-h PG ⩾155 mg/dL showed a higher cumulative incidence of 1-year re-admission with adverse cardiovascular events than men with a 1-h PG <155 mg/dL (19.9% vs 8.9%, Breslow test p = 0.031), but no significant difference was observed in women (Breslow test p = 0.297).
Discussion
This study, conducted in a cohort of CHD patients with NGT, showed that elevated 1-h PG levels during the OGTT were associated with an increased degree of coronary artery lesions and a higher risk of 1-year re-admission with adverse cardiovascular events. Moreover, these findings were found to be particularly evident in men through further subgroup analyses by sex.
Increasing evidence has shown that a significant proportion of subjects with NGT are at high risk for not only type 2 diabetes but also CVD because type 2 diabetes and CVD might have common metabolic origins.22,23 Abdul-Ghani et al.3–5 have demonstrated that a 1-h PG ⩾155 mg/dL during the OGTT is a better predictor of future type 2 diabetes than either the FPG or 2-h PG in NGT subjects. Furthermore, subjects with NGT and a 1-h PG ⩾155 mg/dL have been shown to exhibit adverse metabolic changes and sub-clinical target organ damage, similar to IGT individuals, who are considered at high risk for both type 2 diabetes and CVD. The current study extends previous knowledge and shows that 1-h PG ⩾155 mg/dL subjects had a greater severity of coronary artery lesions, and 1-h PG was the major determinant of Gensini score in CHD patients with NGT. Our results are consistent with previous observations showing that abNGT is strongly associated with severity of coronary artery disease.24–26 Moreover, it is noteworthy that large-scale population studies have suggested that an elevated 1-h PG level is strongly associated with a high risk of cardiovascular mortality in individuals without diabetes at baseline during long-term follow-up.11–14 In this study, we also focused on the clinical prognosis of CHD patients with NGT and showed that subjects with a 1-h PG ⩾155 mg/dL had an increased risk of 1-year re-admission with adverse cardiovascular events. Our findings, in addition to those stated above, support the concept that 1-h PG is a better screening tool for cardiovascular risk assessment and emphasize the measurement of 1-h PG to identify individuals at high risk for adverse clinical outcomes.
The mechanism by which elevated 1-h PG levels are associated with more severe coronary artery disease is undefined. In this study, we observed that subjects with a 1-h PG ⩾155 mg/dL exhibited higher HOMA-IR and lower ISI levels, indicating a greater degree of insulin resistance. It is therefore possible that insulin resistance is responsible for the association of 1-h PG with coronary artery disease. The findings presented here are consistent with previous observations showing that NGT subjects with a 1-h PG ⩾155 mg/dL exhibited an intermediate state of glucose intolerance characterized by greater insulin resistance and worse β-cell dysfunction.27,28 Proposedly, the 1-h PG ⩾155 mg/dL may represent a form of prediabetic state. In addition, we observed increased levels of hs-CRP, WBCs and NEUTs in subjects with a 1-h PG ⩾155 mg/dL, which are widely available measures of sub-clinical inflammation. 29 Therefore, sub-clinical inflammation may be another unifying mechanistic factor.
It is noteworthy that sex may modify the relationship between 1-h PG levels and coronary artery disease. We found that men with a 1-h PG ⩾155 mg/dL had higher incidence of complex lesions and risk of 1-year re-admission than those with a 1-h PG <155 mg/dL, but not in women. Although previous studies have not directly exhibited similar results, this is in line with findings from a study in which elevated 1-h PG levels were associated with arterial stiffness only in normotensive men with NGT, 30 and another study showed that a 1-h PG ⩾155 mg/dL was associated with increased left ventricular mass only in men with NGT. 9 Based on these studies, we speculated that the impacts of elevated 1-h PG levels on CVD may be particularly evident in men. However, the potential mechanisms still need to be explored in more detail by future research.
Several limitations should be considered in this study. First, a single OGTT was used to measure 1-h PG levels. It has been reported that 1-h PG level during the OGTT has within-subject variability and sometimes falsely elevated,31,32 and this may have introduced some imprecision in the classification of subjects that may affect the results. Previous studies have suggested that indices that use multiple time points over the OGTT were more reproducible. 32 Comparisons of the reproducibility among 1-h PG, 2-h PG and other OGTT-derived indices should be conducted in the future. Second, the results are only based on Asians, and different findings might be obtained in other ethnic groups. Third, the design of the study does not eliminate potential causal relationships between 1-h PG levels and the severity of coronary artery lesions. Finally, this was a single-centre study with short follow-up time. Few reports about long-term prognosis of CHD patients with NGT and a 1-h PG ⩾155 mg/dL have been published; hence, future longitudinal studies in a large-scale population are necessary.
In conclusion, this study has shown links between elevated 1-h PG levels and not only a greater severity of coronary artery lesions but also an increased risk of re-admission with adverse cardiovascular events in CHD patients with NGT. These results are relevant in light of previous observations that emphasize the role of 1-h PG in the early identification of individuals with NGT at high risk for adverse metabolic changes, sub-clinical target organ damage and cardiovascular events, suggesting that paying attention to 1-h PG values would be important to assess cardiovascular risk, so that individuals could benefit from early intervention programmes including diet and exercise and possibly pharmacotherapy to prevent or delay clinical adverse events.
Footnotes
Declaration of conflicting interests
The author(s) declared no potential conflicts of interest with respect to the research, authorship and/or publication of this article.
Funding
The author(s) disclosed receipt of the following financial support for the research, authorship, and/or publication of this article: This study was supported by the Nature Science Foundation of China (Grant No. 81873513, 81600574, and 30871042), Key Projects of Shaanxi Science and Technology Research and Development Plan (Grant No.2018ZDXM-SF-049), Key Project of Clinical Research in the First Affiliated Hospital of Xi’an Jiaotong University (Grant No.XJTU1AF-CRF-2018-005) and Shaanxi Science and Technology Research and Development Plan of International Science and Technology (Grant No.2012 kw-40-01 and 2014 JM2-8145).