
Abstract
Objectives:
Coronary atherosclerosis in patients with type 2 diabetes mellitus may be promoted by regional fat distribution. We investigated the association between anthropometric measures of obesity, truncal fat mass, epicardial adipose tissue and coronary atherosclerosis in asymptomatic patients and matched controls.
Methods:
We examined 44 patients and 59 controls [mean (standard deviation) age 64.4 ± 9.9 vs 61.8 ± 9.7, male 50% vs 47%, diabetes duration mean (standard deviation) 7.7 ± 1.5] with coronary computed tomography angiography. Coronary plaques were quantified as total, calcified, non-calcified and low-density non-calcified plaque volumes (mm3). Regional fat distribution was assessed by dual-energy X-ray absorptiometry, body mass index (kg/m2), waist circumference (cm) and epicardial fat volume (mm3). Endothelial function and systemic inflammation were evaluated by peripheral arterial tonometry (log transformed Reactive Hyperemia Index) and C-reactive protein (mg/L).
Results:
Body mass index and waist circumference (p < 0.02) were associated with coronary plaque volumes. Body mass index was associated with low-density non-calcified plaque volume after adjustment for age, sex and diabetes status (p < 0.01). Truncal fat mass (p > 0.51), waist circumference (p > 0.06) and epicardial adipose tissue (p > 0.17) were not associated with coronary plaque volumes in adjusted analyses.
Conclusion:
Body mass index is associated with coronary plaque volumes in diabetic as well as non-diabetic individuals.
Keywords
Introduction
Cardiovascular disease (CVD) is the leading cause of mortality and morbidity in patients with type 2 diabetes mellitus 1 (T2DM). However, CVD event rates differ considerably within the group of diabetic patients. Conventional clinical risk factors (hyperlipidaemia, smoking and hypertension) predict CVD in patients with T2DM2–4 but with suboptimal accuracy.5–7 Thus, the challenge remains to identify patients with T2DM at high and low risk of CVD. 8
Visceral adipose tissue (VAT), primarily located in the abdominal trunk, may have pro-atherogenic properties (e.g. through Tumor Necrosis Factor alpha [TNF-α] production), whereas subcutaneous fat tissues may be less atherogenic. 9 Moreover, epicardial adipose tissue (EAT) has been reported to be associated with coronary artery disease (CAD). 10 Indeed, regional fat distribution seems to be a stronger predictor of CAD than anthropometric measures of obesity in non-diabetic individuals.11–15 On this background, it has been suggested that measurements of regional fat distribution may provide additional information on CVD risk. In patients with T2DM, however, results are conflicting.16,17
We aimed at investigating whether body mass index (BMI), waist circumference (WC), truncal fat mass or EAT were associated with volumes of calcified and non-calcified coronary plaques in patients with T2DM without known CVD and in matched non-diabetic controls.
Methods
Subjects
Participants were recruited from an ongoing prospective study on complications in patients with T2DM conducted at Aarhus University Hospital, Denmark, as previously described. 18 Briefly, patients with T2DM (according to World Health Organization’s criteria) 19 and non-diabetic sex- and age-matched controls were enrolled in 2009 to 2011. Inclusion criteria were age >18 years and, for patients, a known duration of diabetes of less than 5 years. Controls were tested for and excluded if diabetes was diagnosed by fasting glucose and oral glucose tolerance tests. For both groups, exclusion criteria were acute or chronic infectious disease, end-stage renal failure, pregnancy or lactation, prior or current cancer and contraindications to MRI (magnetic resonance imaging) (MRI of cerebrum and carotid arteries was performed for other purposes).
The participants were invited for a 5-year follow-up visit in 2014 to 2016, and the current cross-sectional study is based on data from this visit.
The following examinations were performed: office and ambulatory blood pressure, anthropometrics, dual-energy X-ray absorptiometry (DXA), blood sampling including C-reactive protein (CRP), coronary computed tomography angiography (CCTA) and endothelial function evaluated by peripheral arterial tonometry [log transformed Reactive Hyperemia Index, ln(RHI)].
A total of 63 patients with T2DM and 72 controls attended the follow-up visit. Only asymptomatic participants eligible for CCTA were included in the current study; thus, eight participants were excluded because of symptomatic CAD. Moreover, CCTA assessment was not feasible in 15 participants due to BMI >35 kg/m2, heart arrhythmia, claustrophobia or withdrawal of consent. CT image quality was below predefined cut-off (see below) in 6 participants, DXA scans were missing for 2 participants and 1 control developed diabetes, leaving 103 participants (44 patients and 59 controls) for the final analysis. Complete participant flow is shown in Supplement 1, Figure 2.
The study complied with the Declaration of Helsinki and was approved by the Research Ethics Committee (1-10-72-349-13) and by the Danish Data Protection Agency (1-16-02-505-13). All patients gave their written, informed consent.
CCTA
CCTA was performed using a dual-source CT scanner (Siemens SOMATOM Definition Flash; Forchheim, Germany) as previously described. 20 Image acquisition was performed in accordance with societal guidelines. 21 In short, intravenous beta-blockers were administered if necessary, targeting a heart rate less than 60 bpm. All patients received sublingual nitrates. For calcium scoring, an initial non-enhanced scan was performed using high-pitch spiral acquisition mode and 120 kV. CCTA was performed using prospective electrocardiography (ECG) triggering. Data acquisition was performed with 100 or 120 kV tube voltage in patients weighing 70 or less and more than 70 kg, respectively. Scan datasets were labelled by random numbers and blinded to the observers. Experienced blinded investigators performed standard CCTA analyses; image quality was graded 1 to 5, where images with quality <3 were excluded (1: poor and not suitable for evaluation, 2: low quality but acceptable for evaluation of certain segments, 3: acceptable but diagnostic evaluation less reliable, 4: good quality with minor motion-related artefacts and 5: excellent quality without artefacts).
Coronary plaque and EAT analyses
Analyses of coronary plaques were performed as previously described. 20 In short, a single blinded experienced reader performed the analyses offline using axial and multiplanar CCTA images. Coronary artery calcifications were quantified (Syngo Calcium Scoring; Siemens Medical Solutions, Forchheim, Germany) using the score method as previously described. 22 Using automated software (AutoPlaq version 9.7; Cedars-Sinai Medical Center, Los Angeles, CA, USA), all coronary segments at least 2 mm in diameter where plaques could be visually assessed were evaluated.
We performed our analyses according to a coronary 18-segment model. 23 In the ascending aorta, a region of interest was defined at the level of the left main coronary artery, and scan-specific thresholds for calcified plaque (CP), non-calcified plaque (NCP) and lumen were automatically generated by the AutoPlaq software as previously validated.24,25 The proximal and distal borders of each lesion were defined, whereupon centre lines and plaque components were automatically quantified. Manual corrections were made, if necessary. Low-density non-calcified plaque (LD-NCP) was defined as any voxel within the plaque with attenuation less than 30 Hounsfield units (HU). Volumes of total plaque (TP), CP, NCP and LD-NCP were summed up per participant. Interobserver variability was good as previously reported. 20
EAT was quantified using automated software (QFAT 2.0; Cedars-Sinai Medical Center).
In short, epicardial fat volume was assessed for all patients. In the axial plane, the superior limit of the heart was defined by the bifurcation of the pulmonary artery and the inferior limit as the slice below the posterior descending artery. The software automatically tracks epicardial fat as previously described 26 in the axial slices, and manual corrections were made, if necessary. Fat was defined as pixels within a window of −190 to −30 HU.
After three-dimensional reconstruction, fat volume was automatically calculated by the software. All epicardial fat volume measures were performed by a single reader.
Other measurements
A DXA scan (DXA Discovery System; Hologic, Marlborough, MA, USA) was performed to estimate lean, bone mineral content and fat body mass in kilograms. Relative measures of truncal fat were calculated as truncal fat mass divided by either total truncal mass or by total body mass. BMI was calculated as weight in kilograms divided by the height in metres squared (kg/m2). WC was measured by a tape measure on a horizontal line around the waist at the level midway between the lower rib and the top of the hip bone. Ambulatory blood pressure was monitored for 24 h (24 h ABPM) using Spacelabs 90217 (Spacelabs Healthcare; Issaquah, WA, USA). Serum CRP was measured using COBAS 6000 at Aarhus University Hospital laboratory facilities. Endothelial function was measured as ln(RHI) using the EndoPat device (Itamar Medical Ltd.; Caesarea, Israel). 27 Finally, the medical history of the participants was obtained through a questionnaire.
Statistical analysis
Data distribution was assessed by histograms and Q-Q plots. Variables are presented with mean ± standard deviation (SD) and median (interquartile range) as appropriate. Dichotomous data are presented as n (%). Student’s paired t test for matched data or Student’s unpaired t test for independent data or Wilcoxon signed-rank test or Wilcoxon–Mann–Whitney test were applied as appropriate. Dichotomous variables were compared with a McNemar’s test or chi-square test as appropriate. Plaque data were highly skewed because of 33 (32%) participants without any plaques, and we therefore applied a two-part model to handle zero-inflated data. 28 The model was fitted to evaluate the association between independent variables and plaque volumes. First, a logistic regression model was used to determine the association between covariates and the presence or absence of coronary plaques. Second, the association between covariates and the extent of plaque volumes among participants with the presence of coronary atherosclerosis was determined by linear regression. The two-part model allows overall testing of association between covariates and plaque volumes. In the models of BMI/WC/truncal fat mass/epicardial fat volume and plaque volumes, the following covariates were included in a basic multivariate model: age, sex and diabetes. In secondary analyses, CRP, the use of statins, low-density lipoprotein (LDL) cholesterol, ambulatory systolic blood pressure, ln(RHI) or smoking status were added in turn (one at a time) to the basic multivariate two-part model. Multivariate margin plots were constructed for male and females separately. We tested the interaction of diabetes on the effect of obesity measures on plaque volumes; p values less than 0.05 were considered statistically significant.
Statistical analyses were performed with Stata software, version 13 (StataCorp; College Station, TX, USA).
Results
Patients with T2DM had good glycaemic control and, in comparison to controls, a higher BMI and a larger WC but similar or better lipid and blood pressure levels (Table 1).
Participant characteristics.
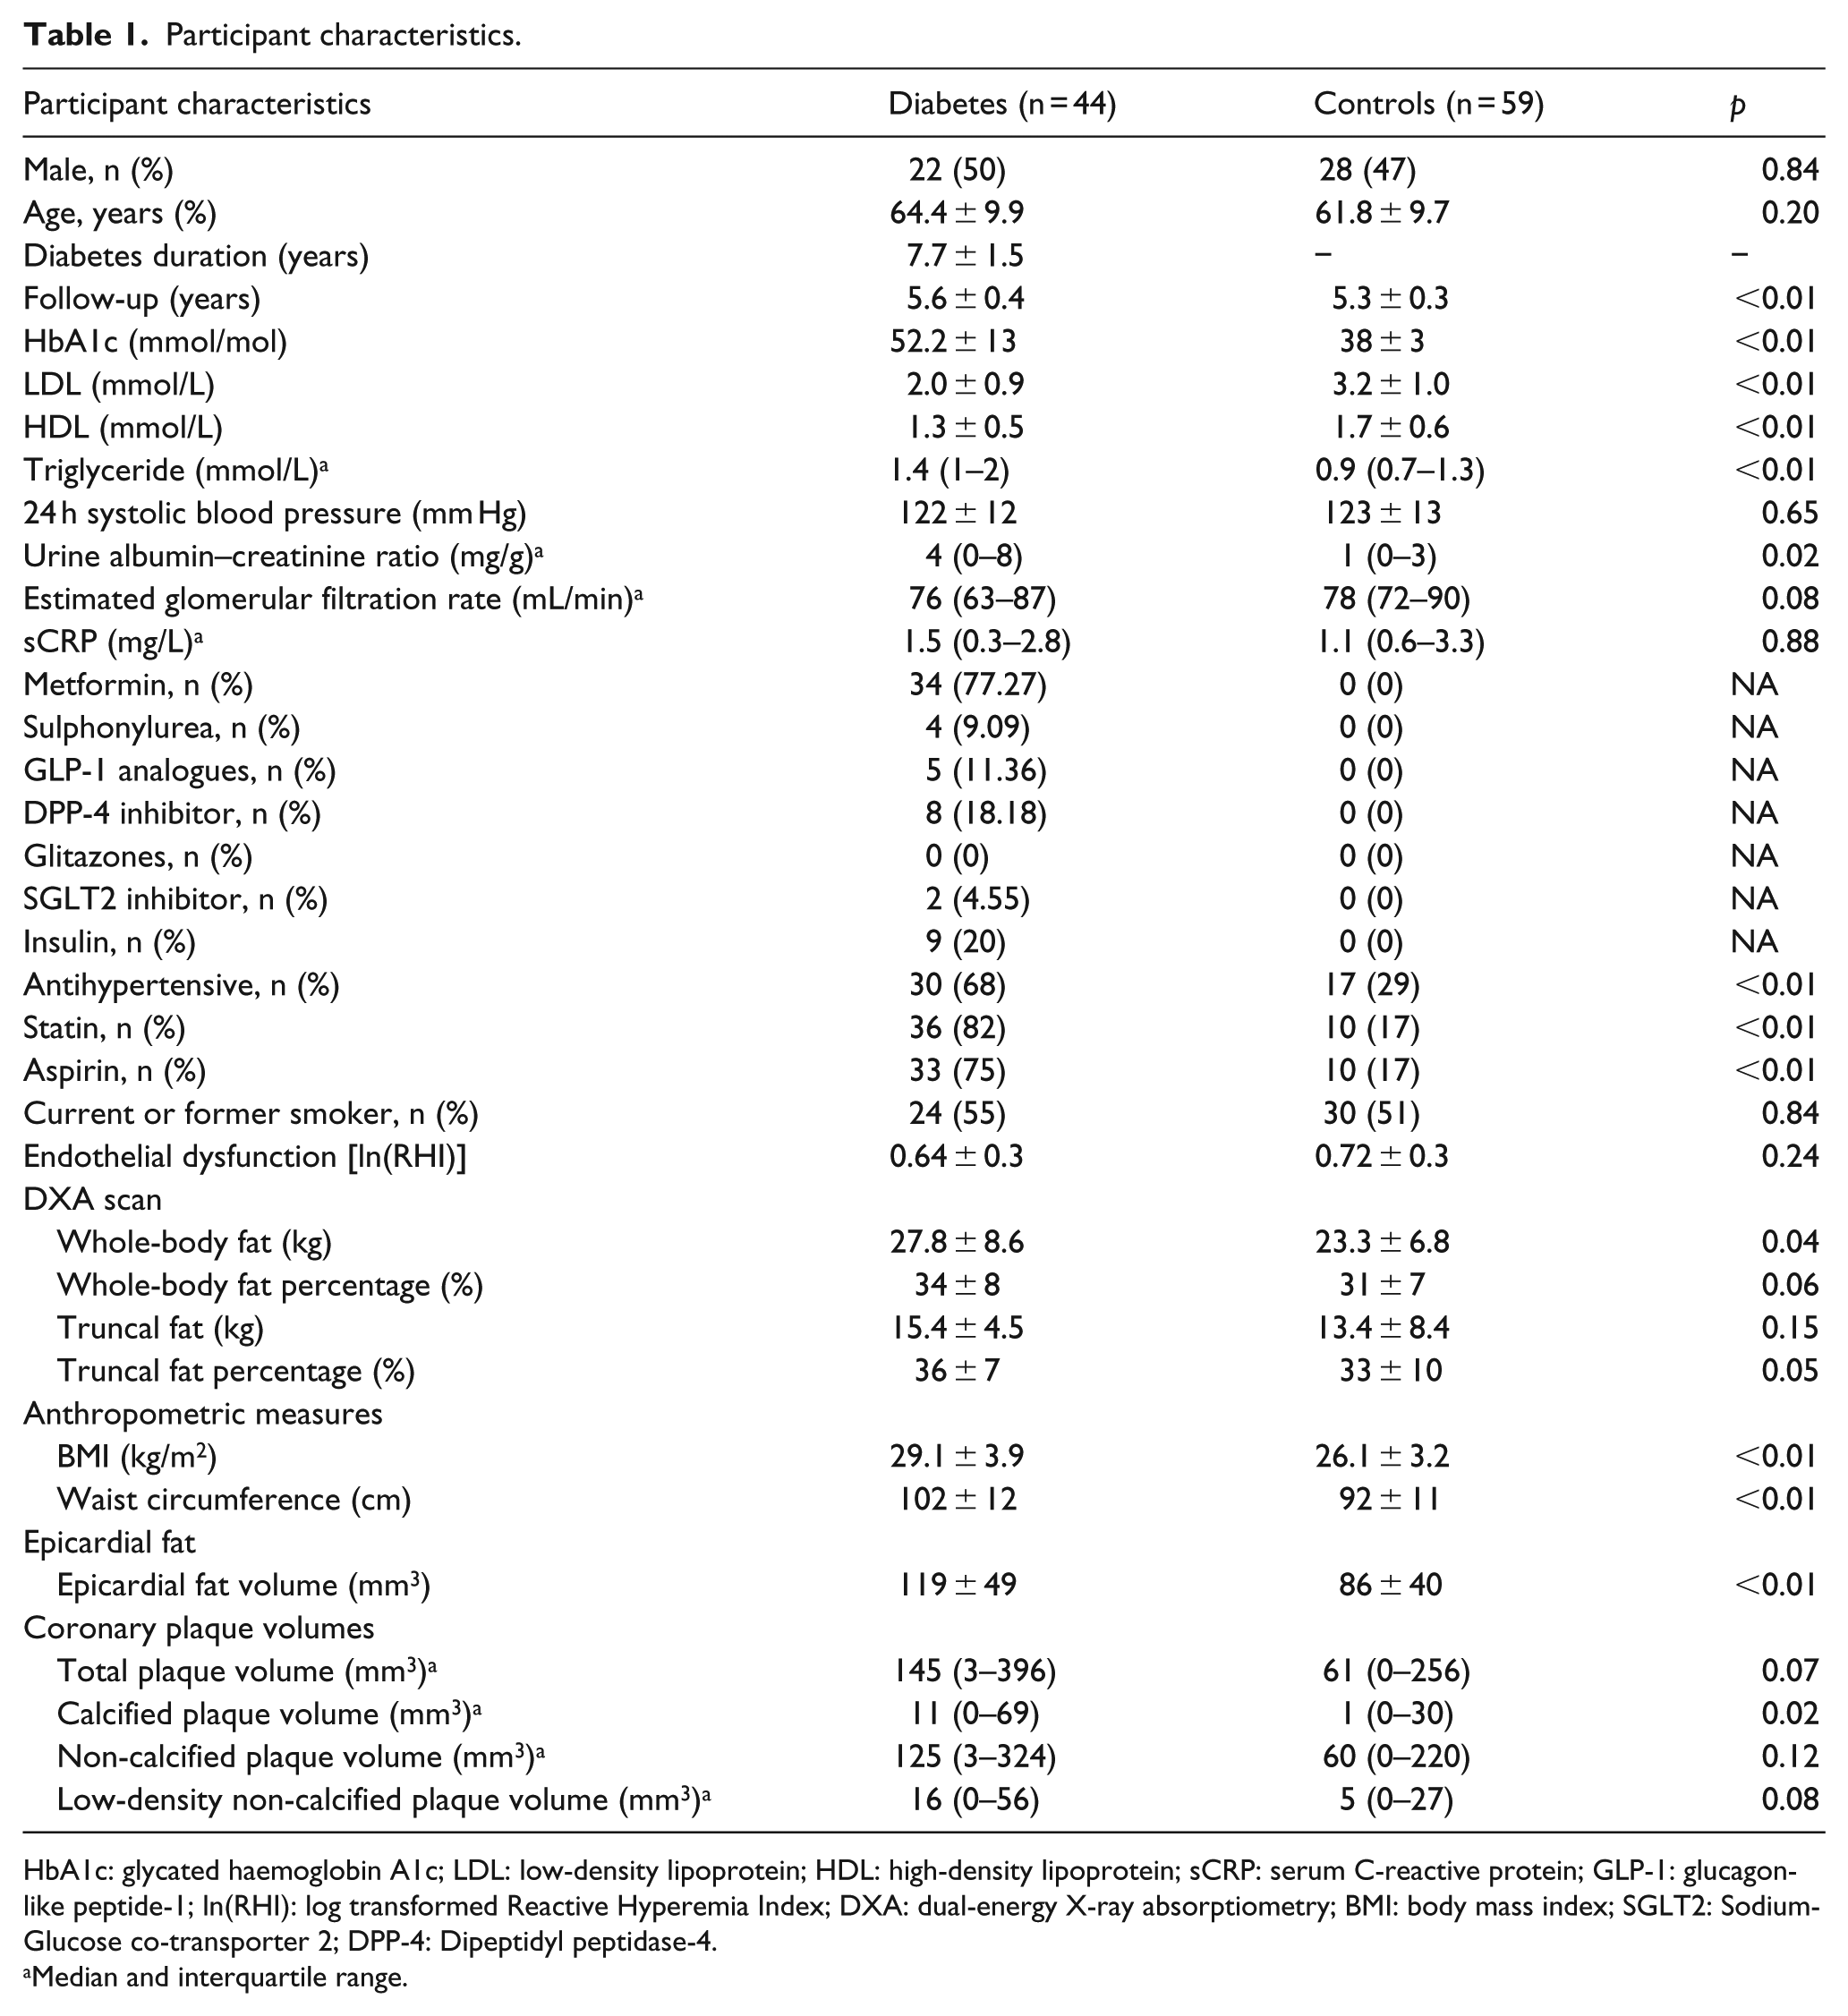
HbA1c: glycated haemoglobin A1c; LDL: low-density lipoprotein; HDL: high-density lipoprotein; sCRP: serum C-reactive protein; GLP-1: glucagon-like peptide-1; ln(RHI): log transformed Reactive Hyperemia Index; DXA: dual-energy X-ray absorptiometry; BMI: body mass index; SGLT2: Sodium-Glucose co-transporter 2; DPP-4: Dipeptidyl peptidase-4.
Median and interquartile range.
Whole-body fat mass was significantly higher in patients with T2DM compared with controls (Table 1). Neither relative whole-body fat mass or absolute truncal fat mass nor percentage was significantly different between groups. Epicardial fat volume as well as CP volume were, on the other hand, significantly higher among patients (Table 1). As previously reported, 20 the number of plaques with adverse characteristics was higher in the group of patients with T2DM compared to the control group.
Association between anthropometric measures, truncal fat mass, EAT, biomarkers and coronary plaque volumes
In crude analyses, BMI was associated with all plaque types (Table 2). When we adjusted for age, sex and diabetes (yes/no), the association remained statistically significant for volumes of LD-NCP (Table 2, Figure 1(a)). WC was associated with all plaque types in crude analysis but not in adjusted analysis (Supplement 1, Table 4, Figure 1(b)). We found no significant association between truncal fat mass and coronary plaque volumes in neither crude nor adjusted models (Supplement 1, Table 5 and Figure 1(c)). Secondary analyses with relative measures of truncal fat percentage did not change the results (data not shown). Epicardial fat volumes were associated with TP, CP and LD-NCP volumes in crude but not in adjusted analyses (Table 3, Figure 1(d)].
Association between body mass index and coronary plaque volumes.
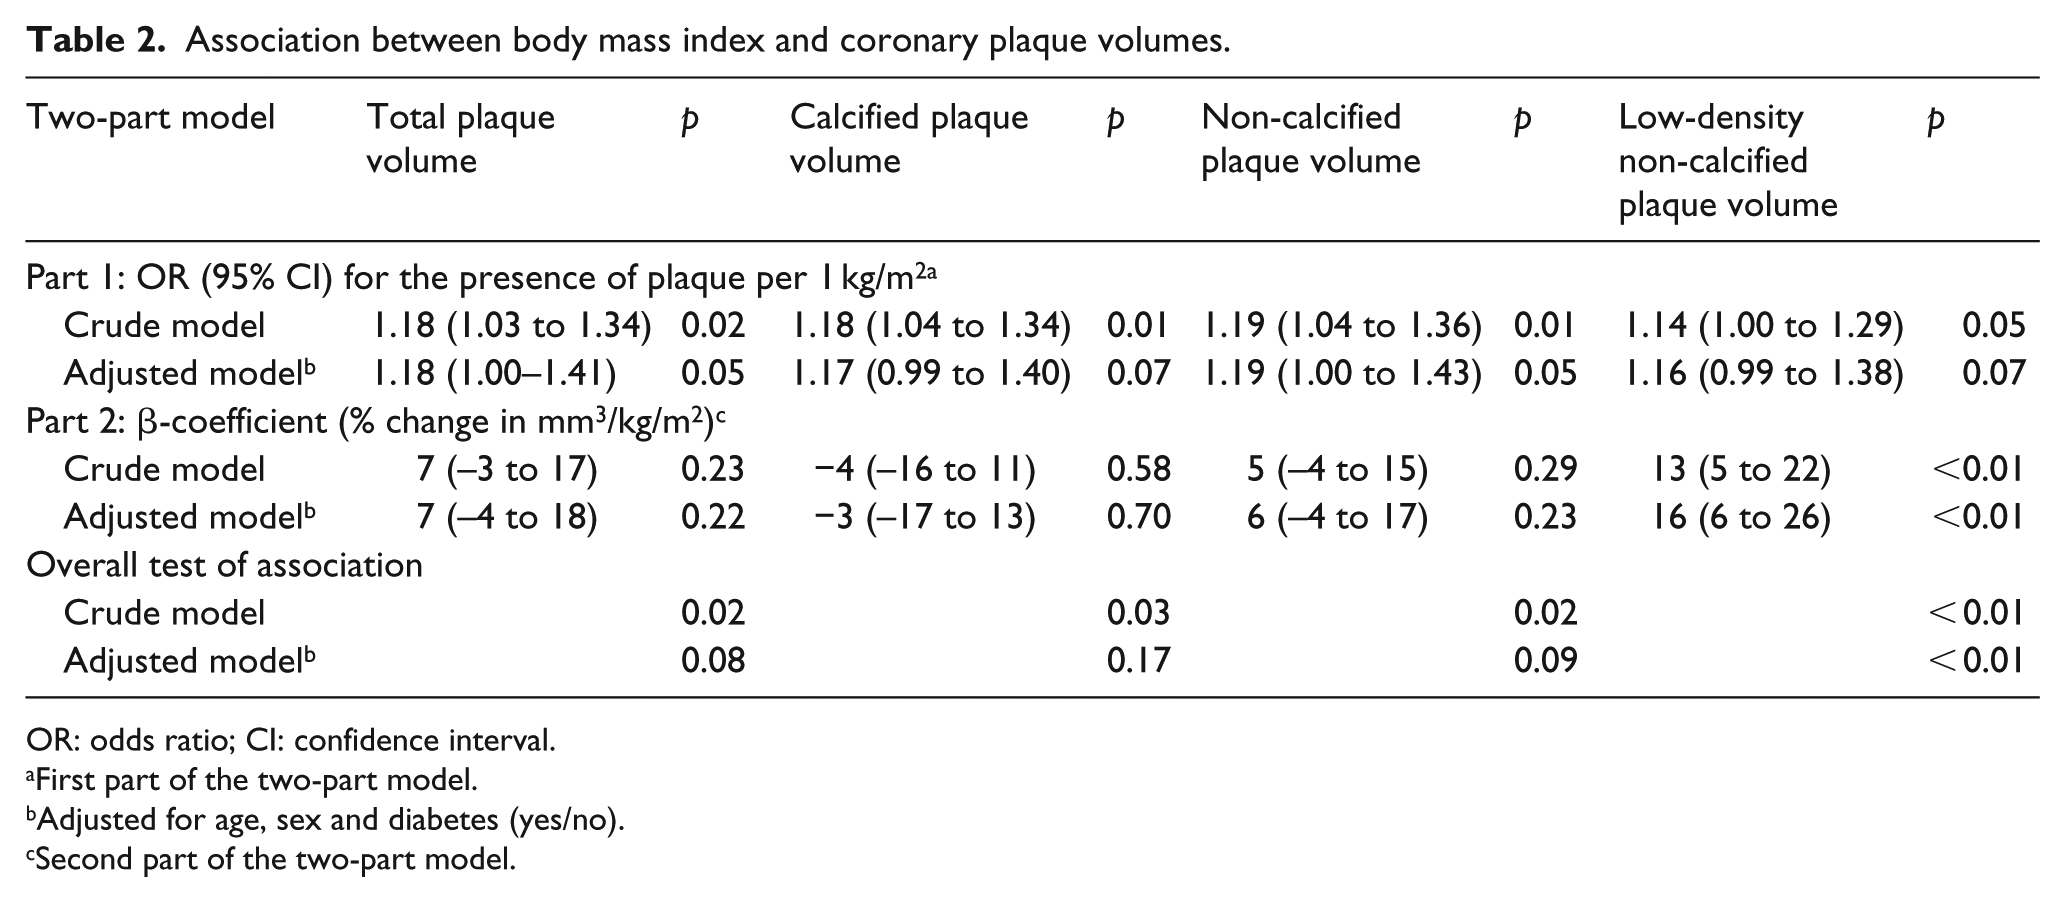
OR: odds ratio; CI: confidence interval.
First part of the two-part model.
Adjusted for age, sex and diabetes (yes/no).
Second part of the two-part model.
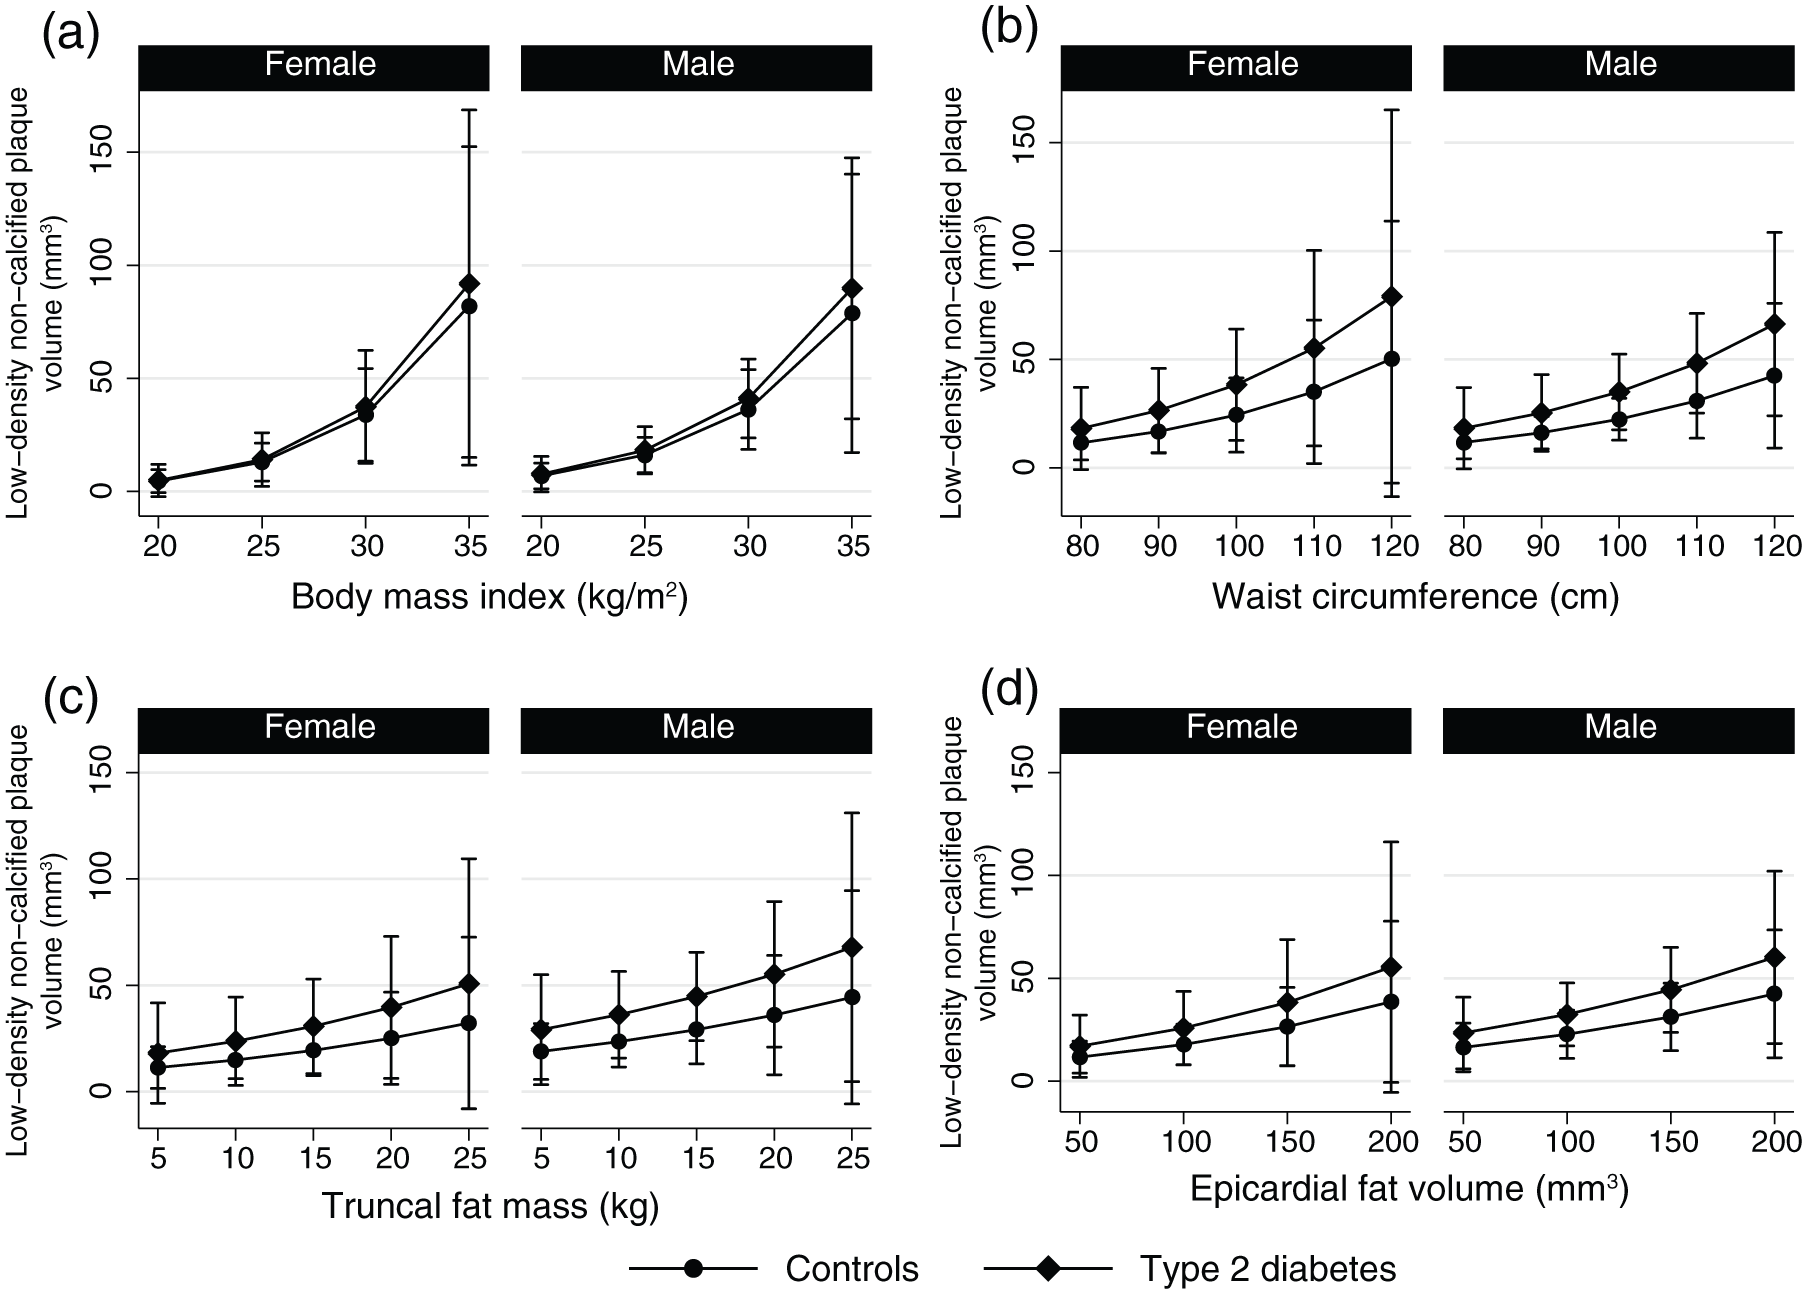
Margin plots showing the predicted volume of low-density non-calcified plaques for four different independent variables for males and females: (a) body mass index, (b) waist circumference, (c) truncal fat mass and (d) epicardial fat volume.
Association between epicardial fat volume and coronary plaque volumes.
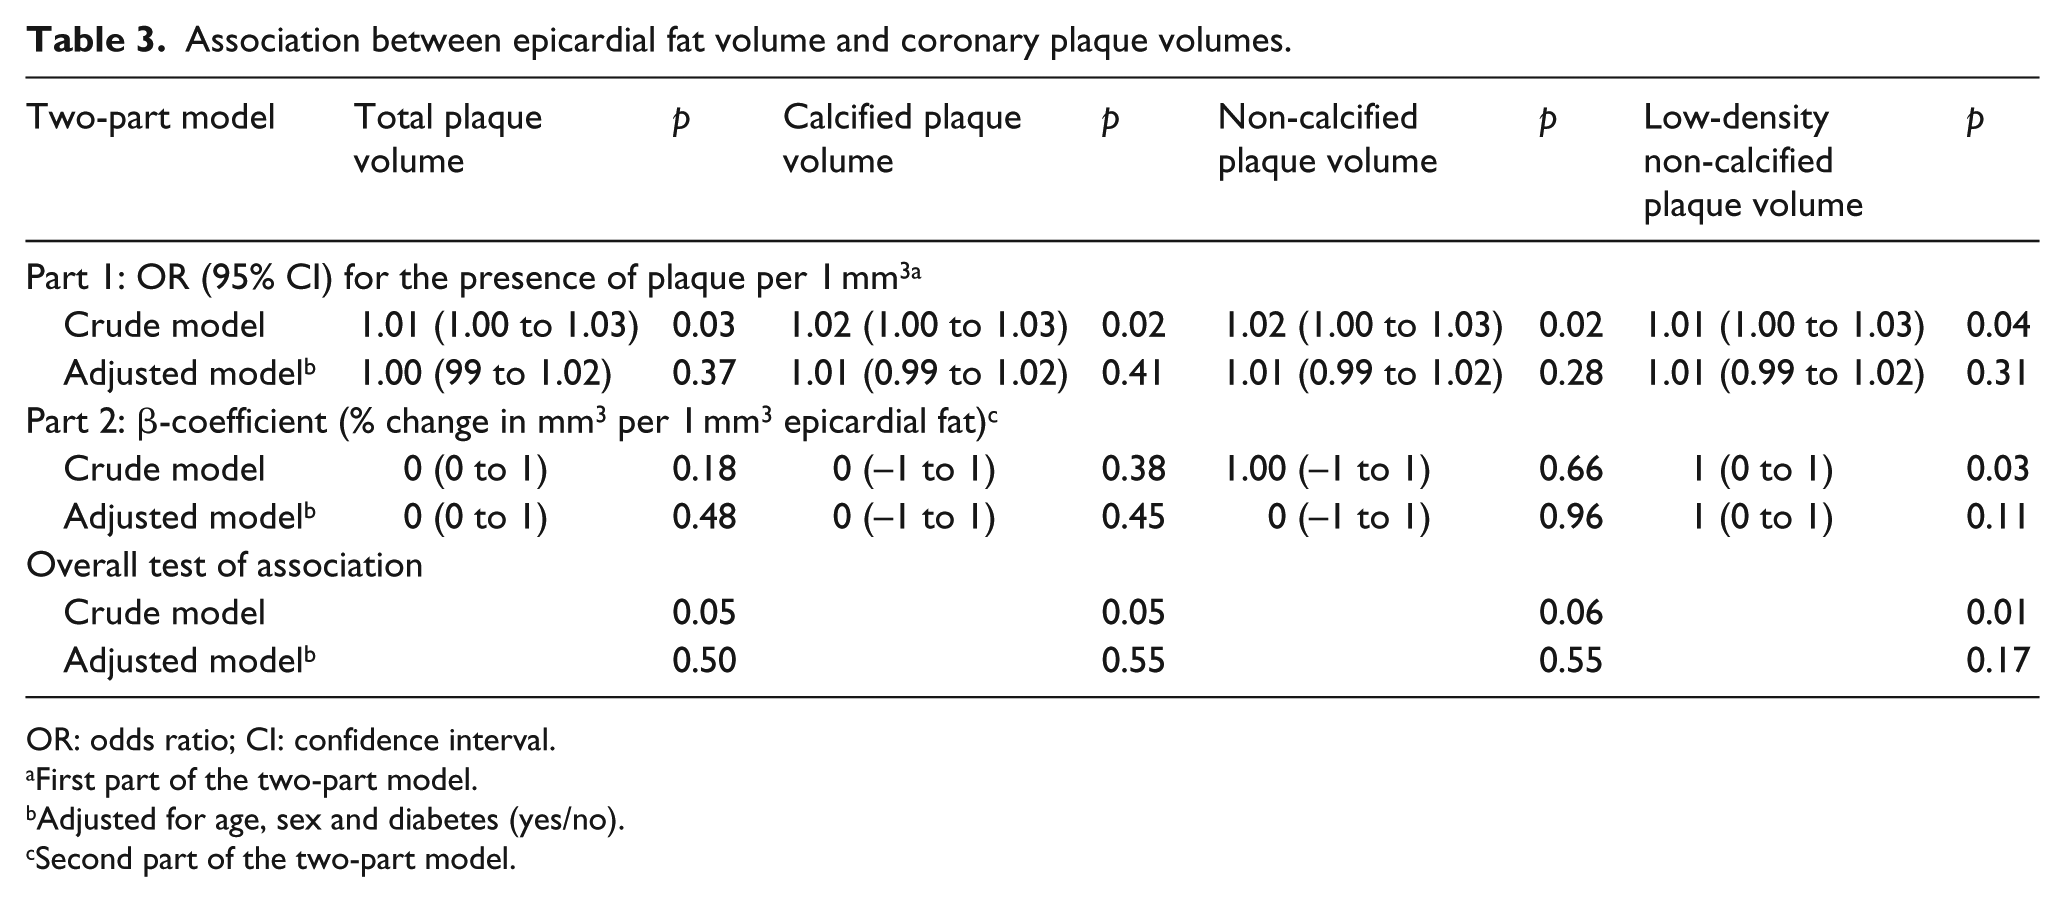
OR: odds ratio; CI: confidence interval.
First part of the two-part model.
Adjusted for age, sex and diabetes (yes/no).
Second part of the two-part model.
Adding CRP, statin use, LDL cholesterol, 24-h systolic blood pressure or smoking status to any of the multivariate models did not change the results (data not shown).
Adding ln(RHI) to the multivariate models did not change the association between BMI and LD-NCP (p = 0.02). Similarly, neither WC, truncal fat mass nor epicardial fat volume, respectively, was associated with coronary plaque volumes in multivariate models, including ln(RHI) (p > 0.13). Diabetes status did not modify any of the above associations (p > 0.05).
Glycated haemoglobin A1c (HbA1c) did not correlate to any of the plaque parameters in either correlation analysis or in a two-part model (data not shown). We observed a trend in the association between Glomerular Filtration Rate (GFR) and LD-NCP volume (p = 0.058), but the association was attenuated in a model adjusted for age, sex and diabetes (p = 0.17). Urine albumin creatinine ratio was not associated with any plaque subtype.
The effect of different levels of BMI, WC, truncal fat mass and epicardial fat volume on LD-NCP volume is presented as margin plots (Figure 1(a)–(d)). For example, for a male person with T2DM and BMI of 25 kg/m2, the predicted mean volume of LD-NCP is 18 mm3, whereas a male person with T2DM and BMI of 35 kg/m2 has a predicted mean volume of LD-NCP of 90 mm3.
Discussion
In this study, our aim was to investigate whether BMI, WC, truncal fat mass or EAT were associated with calcified and non-calcified coronary plaques in patients with T2DM without known CVD and in matched controls. Anthropometric measures, but not truncal fat mass, were associated with coronary plaque volumes. Epicardial fat volume was associated with TP, CP and LD-NCP in crude but not in adjusted analyses. The association between BMI and LD-NCP volume remained significant after adjusting for age, sex and diabetes. After adjustment for CRP or ln(RHI), BMI and LD-NCP still showed a significant association. Diabetes did not modify the associations between anthropometric measures, truncal fat mass or EAT on coronary plaque volumes.
The various plaque types exhibit different associations with CAD: Dey et al. 25 showed a significantly higher burden of total, non-calcified and LD-NCP in patients presenting with non-ST segment elevation myocardial infarct compared to patients with stable CAD. Moreover, Kristensen et al. 29 showed a significant association between NCP volume and the future risk of a major cardiac event in patients with acute myocardial infarction. In contrast, it has been shown that CP volume did not differ between patients with major cardiac events and patients with stable CAD, 25 nor did it negatively predict the risk of a major cardiac event. 29 Thus, our data showing an association between BMI and LD-NCP may partly explain the strong association between BMI and CVD mortality. 30 Novel methods for evaluating plaque composition such as optical coherence tomography as implemented in the ILUMIEN I study 31 may further elucidate these mechanisms and hopefully help in clinical decision-making.
Several studies of non-diabetic patients suggest a relation between regional fat deposition measured as visceral fat and CAD.11–15 Only one study found CT-based obesity measures to be non-superior to anthropometric measures. 32
The relationship between visceral fat and coronary atherosclerosis in patients with T2DM has only been sparsely investigated and with conflicting observations.16,17 Khashper et al. 17 reported a correlation between VAT and coronary atherosclerosis, whereas Divers et al. 16 found no significant relation. This could be due to a different study population (e.g. younger, more insulin-treated, higher BMI, African Americans 16 vs older, less-insulin-treated, lower BMI, Europeans 17 ). Divers et al. 16 included patients with a history of myocardial infarction, whereas they were excluded by Khashper et al. 17 Both studies used comparable methods for vascular and adipose imaging.
Our study population is similar to the population of Khashper et al. 17 (age, BMI, percentage of patients treated with insulin and no known history of cardiac events). In agreement with Khashper et al., 17 we did not find an association between the total amount of fat and coronary atherosclerosis; however, we found no association between truncal fat mass and volumes of coronary atherosclerosis either.
Adipose tissue is an endocrine organ which secretes pro- and anti-inflammatory adipokines and hence plays a pivotal role in the formation of vulnerable plaques. 9 Different fatty compartments (e.g. visceral vs subcutaneous fat) play different roles in atherosclerosis. Marques et al. 33 demonstrated a significant association between visceral abdominal fat and CAD. Pro-inflammatory markers such as TNF-α and Interleukin 6 (IL-6) are shown to be associated with abdominal intermuscular adipose tissue 34 and, as such, low-grade inflammation.
We expected to find an association between truncal fat mass and volumes of coronary plaques as truncal fat mass measured by DXA is an indirect measure of VAT. However, a DXA scan cannot differentiate between subcutaneous fat and VAT, and this may have weakened the association. Moreover, Gallagher et al. 35 reported that VAT represents a greater proportion of total fat in patients with T2DM compared to non-diabetic persons. In line with this, we expected the relationship between truncal fat mass and volumes of coronary plaques to be modified by diabetes status; however, this was not the case. This may be due to a small sample size or the inclusion of relatively lean patients with T2DM.
Unlike truncal fat mass, BMI was associated with LD-NCP volumes. One explanation may be that BMI is more closely related to VAT than truncal fat mass and therefore more closely related to coronary atherosclerosis. Moreover, BMI may be linked to CAD by other pathways. In a Mendelian randomization study, Nordestgaard et al. 36 showed an increase in odds for ischaemic heart disease by 52% for every 4 kg/m2 increase in BMI. The authors suggested a causal link between BMI and ischaemic heart disease, potentially mediated by hypertension, dyslipidaemia and T2DM. Indeed, BMI is closely linked to other cardiovascular risk markers in both diabetic and non-diabetic persons, and the association between BMI and CAD found in our study may be driven by these factors.37,38 We found that inclusion of smoking, ambulatory systolic BP, LDL cholesterol or ln(RHI) in a model including age, sex and diabetes did not attenuate the relationship between BMI and volumes of LD-NCP, suggesting an association independent of established cardiovascular risk factors.
EAT has been associated with CAD in both diabetic and non-diabetic persons. It has endocrine and paracrine effects on atherosclerosis and may have an even stronger relation to CAD than visceral adiposity.39,40
We found no association between EAT and coronary plaque volumes, although several studies have established an association between EAT and CAD.11,16,41 This may be due to different study populations16,41 (higher BMI, mixed diabetic/non-diabetic persons, a larger population and/or symptomatic CAD), although the Framingham Heart Study 11 and our study population were comparable on some variables (BMI, WC and no symptoms of CAD). Moreover, the definition of epicardial and pericardial adipose tissue is often used interchangeably, which makes comparison difficult. 42
In line with our study, Christensen et al. 43 showed no significant association between EAT and CAD in T2DM patients. Their study population differed from ours (longer duration of diabetes and a higher HbA1c) but, similarly to our study population, participants had no symptoms of CAD. More studies are warranted to elucidate the relation between EAT and CAD in T2DM patients.
Statins have anti-inflammatory effects 44 that may counteract the pro-atherogenic inflammatory hormones produced by VAT. Thus, our results may have been influenced by the use of statins as nearly half of our participants were on statin treatment; however, the addition of statin use in the multivariate models did not change the effect estimates.
Our study has some limitations. The study sample is relatively small; hence, the ability to adjust for multiple confounders is limited, and there is a risk of type 2 errors. Furthermore, the temporal relationship between plaque burden and measures of regional fat distribution cannot be determined from this cross-sectional study. Follow-up data such as Percutaneous Coronary Intervention (PCI) and Coronary Artery Bypass Graft (CABG) are currently not available, but we are planning to do a follow-up on clinical outcomes.
Selection bias should be taken into consideration; for technical reasons, CCTA was not feasible in severely obese persons, with presumably higher prevalence of plaques, and was therefore excluded. Despite this, we still observed associations between BMI and volumes of coronary plaques.
A strength of this study is that we have examined both patients with T2DM and matched non-diabetic controls, thus allowing for secondary analysis of the interaction of diabetes. Moreover, we have evaluated coronary atherosclerosis and epicardial fat volume with state-of-the-art CT angiography and advanced plaque/epicardial analysis software as previously reported.20,26 Finally, as data have been taken from a well-characterized cohort, we were able to adjust for several possible confounders.
In conclusion, BMI is associated with volumes of low-density non-calcified coronary atherosclerosis in patients with T2DM and matched controls with no history of CVD. Waist circumference, truncal fat mass as measured by DXA, and epicardial fat volume do not seem to be associated with coronary atherosclerosis in patients with T2DM nor in non-diabetic individuals.
Supplemental Material
Gullaksen-TruncalFatMassAndCoronaryArteryDiseaseDM2-Supplement2_Table4and5 – Supplemental material for Volumes of coronary plaque disease in relation to body mass index, waist circumference, truncal fat mass and epicardial adipose tissue in patients with type 2 diabetes mellitus and controls
Supplemental material, Gullaksen-TruncalFatMassAndCoronaryArteryDiseaseDM2-Supplement2_Table4and5 for Volumes of coronary plaque disease in relation to body mass index, waist circumference, truncal fat mass and epicardial adipose tissue in patients with type 2 diabetes mellitus and controls by Søren Gullaksen, Kristian Løkke Funck, Esben Laugesen, Troels Krarup Hansen, Damini Dey and Per Løgstrup Poulsen in Diabetes & Vascular Disease Research
Footnotes
Acknowledgements
The authors thank laboratory technicians Merete Møller, Lone Kvist, Eva Schriver and Lisa Buus from the Medical Research Laboratory at the Department for Endocrinology and Internal Medicine, Aarhus University Hospital, and radiologic technologists Kamilla Bech Pedersen and Vivi Juhl-Jørgensen for excellent technical assistance. We acknowledge the valuable statistical assistance of Simon Bang Kristensen, Biostatistical Advisory Service, Aarhus University. Søren Gullaksen is the guarantor of this work and, as such, had full access to all the data in the study and takes responsibility for the integrity of the data and the accuracy of the data analysis. The datasets generated during the current study are available from the corresponding author on reasonable request.
Authors’ note
Per Løgstrup Poulsen is also affiliated withSteno Diabetes Center, Aarhus, Denmark.
Declaration of conflicting interests
The author(s) declared the following potential conflicts of interest with respect to the research, authorship, and/or publication of this article: Outside the current work, Damini Dey received royalties for software from Cedars-Sinai Medical Center. The remaining authors declare no conflicts of interest.
Funding
The author(s) disclosed receipt of the following financial support for the research, authorship, and/or publication of this article: The work was supported by research grants from Aarhus University (1,000,000 DKK), Karen Anthonius Mindelegat (25,000 DKK), Søster and Verner Lipperts Foundation (50,000 DKK) and the Danish Diabetes Academy supported by the Novo Nordisk Foundation (1,800,000 DKK).
Supplemental material
Supplemental material for this article is available online.
References
Supplementary Material
Please find the following supplemental material available below.
For Open Access articles published under a Creative Commons License, all supplemental material carries the same license as the article it is associated with.
For non-Open Access articles published, all supplemental material carries a non-exclusive license, and permission requests for re-use of supplemental material or any part of supplemental material shall be sent directly to the copyright owner as specified in the copyright notice associated with the article.