
Abstract
Background
Epicardial adipose tissue is an emerging cardiovascular risk factor. The aim of this study was to evaluate right ventricular function and investigate its association with EAT in T2DM patients.
Methods
154 T2DM patients were divided into two groups according to EAT thickness: T2DM with EAT <5 mm and T2DM with EAT ≥5 mm. Seventy non-T2DM patients were enrolled as control group. RV function was evaluated using both conventional echocardiography as well as two-dimensional speckle tracking echocardiography. EAT thickness was measured as the echo-free space between the free wall of the right ventricle and the visceral layer of pericardium at end-systole.
Results
Compared to control group, EAT thickness was significantly higher and RV systolic function and early diastolic function are all impaired in all T2DM patients. In T2DM with EAT ≥5 mm group, RV systolic function and early diastolic function suffered more severe impairment when compared with T2DM with EAT <5 mm group. Multivariate linear regression analysis revealed that EAT was associated with RV systolic and early diastolic dysfunction independent of traditional cardiovascular risk factors.
Conclusions
Our research suggest that in T2DM patients RV systolic function and early diastolic function are all impaired which are associated with the thickened EAT.
Keywords
Introduction
Type 2 diabetes mellitus (T2DM) is one of the most common chronic metabolic diseases and has come to be considered as an important cardiovascular risk factor. 1 Myocardial dysfunction has already presented in diabetes mellitus patients even in the absence of coronary artery disease, hypertensive, and valvular heart disease. This is known as diabetic cardiomyopathy which was first confirmed in 1972 by Rubler et al. 2 The existing literatures about the effect of diabetes on myocardial function mainly focus on left ventricular.3–7 Due to the complex geometric shape of the right ventricular (RV), it is difficult and challenging in clinical practice to early and accurately assess RV function. And studies on RV function in T2DM patients are relatively rare.8,9
Cardiovascular complications were the leading cause of death in T2DM patients.10,11 Currently, about the pathogenesis of cardiovascular complications in T2DM patients has not been fully elucidated. EAT is an emerging cardiovascular risk factor which is located between the myocardium and the visceral pericardium.12–14 An meta-analysis conducted by Li et al. 15 suggests that the amount of EAT is significantly higher in DM patients than in non-DM patient controls. Large body of evidences indicate that EAT in excess is associated with cardiovascular dysfunction in a variety of disease states.16–18 However, the association between EAT and RV function in patients with T2DM remains uncertain. The aim of this study was to evaluate RV function using two-dimensional speckle tracking echocardiography (2D-STE) in T2DM patients with different EAT thicknesses and to investigate the association between them.
Materials and methods
Study population
We included a total of 154 consecutive T2DM patients who were admitted to our endocrinology inpatient wards between August 2020 and May 2022. Seventy age- and gender-matched non-T2DM patients were enrolled as control group. The diagnosis of T2DM was made according to the 2010 guide lines of the American Diabetes Association. 19 All T2DM patients were divided into two groups according to their EAT thickness: 79 T2DM with EAT <5 mm and 75 T2DM with EAT ≥5 mm. Exclusion criteria were as follows: type 1 diabetes mellitus, gestational diabetes, coronary heart disease, left ventricular ejection fraction (LVEF) <50%, valvular heart disease, cardiomyopathy, congenital heart disease, severe arrhythmia, cerebrovascular disease, kidney disease, and acute complications of diabetes.
Measurement of anthropometric and biochemistry parameters
The age, sex, height, weight and blood pressure (systolic blood pressure: SBP, diastolic blood pressure: DBP) were obtained from all participants. And body mass index (BMI) was calculated as weight in kilograms divided by the square of height in meters. The levels of fasting plasma glucose (FPG); glycosylated hemoglobinA1c (HbA1c), total cholesterol (TC), triglycerides (TG), high-density lipoprotein cholesterol (HDL-C), and low-density lipoprotein cholesterol (LDL-C) were measured after at least 12 h of fasting.
Conventional measurement of RV
All T2DM patients underwent transthoracic echocardiography examination with GE Vivid E9 echocardiography machine (Vivid E9, GE Healthcare, USA) by an experienced cardiologist. Routine echocardiography parameters of RV were measured from the apical 4-chamber view. The basal diameter and middle diameter of RV were measured during end-diastolic. RV end-diastolic and end-systolic areas were measured and RV fractional area change (RV-FAC) was calculated as the difference between end-diastolic and end-systolic area divided by end-diastolic area and expressed as a percentage. Tricuspid annular plane systolic excursion (TAPSE) was measured in M-mode as the difference between end-diastolic and end-systolic excursion of tricuspid annulus. Left ventricular ejection fraction (LVEF) was calculated according to the bi-plane Simpson’s rule. The early (E) and late (A) transtricuspid inflow velocities were determined by using pulse-wave Doppler. The peak systolic, early diastolic and late diastolic velocities of the tricuspid annulus were measured by Tissue Doppler imaging (TDI S, TDI E, and TDI A).
Echocardiographic measurement of EAT thickness
All patients were placed on left lateral decubitus position, EAT was measured on free wall of right ventricle from the parasternal long-axis views and defined as an echo-free space between the outer wall of the myocardium and the visceral layer of the pericardium. Its thickness was measured at end-systole in the parasternal long axis view perpendicular to the aortic annulus and in the parasternal short-axis view perpendicular to the ventricular septum at mid-chordal and tip of the papillary muscles level in three cardiac cycles (Figure 1).
20
The average of three cardiac cycles was used for statistical analysis. Echocardiographic measurement of EAT thickness in the parasternal long-axis and short-axis views of left ventricle at end-systole. LA: left atrium; LV: left ventricle; RV: right ventricle.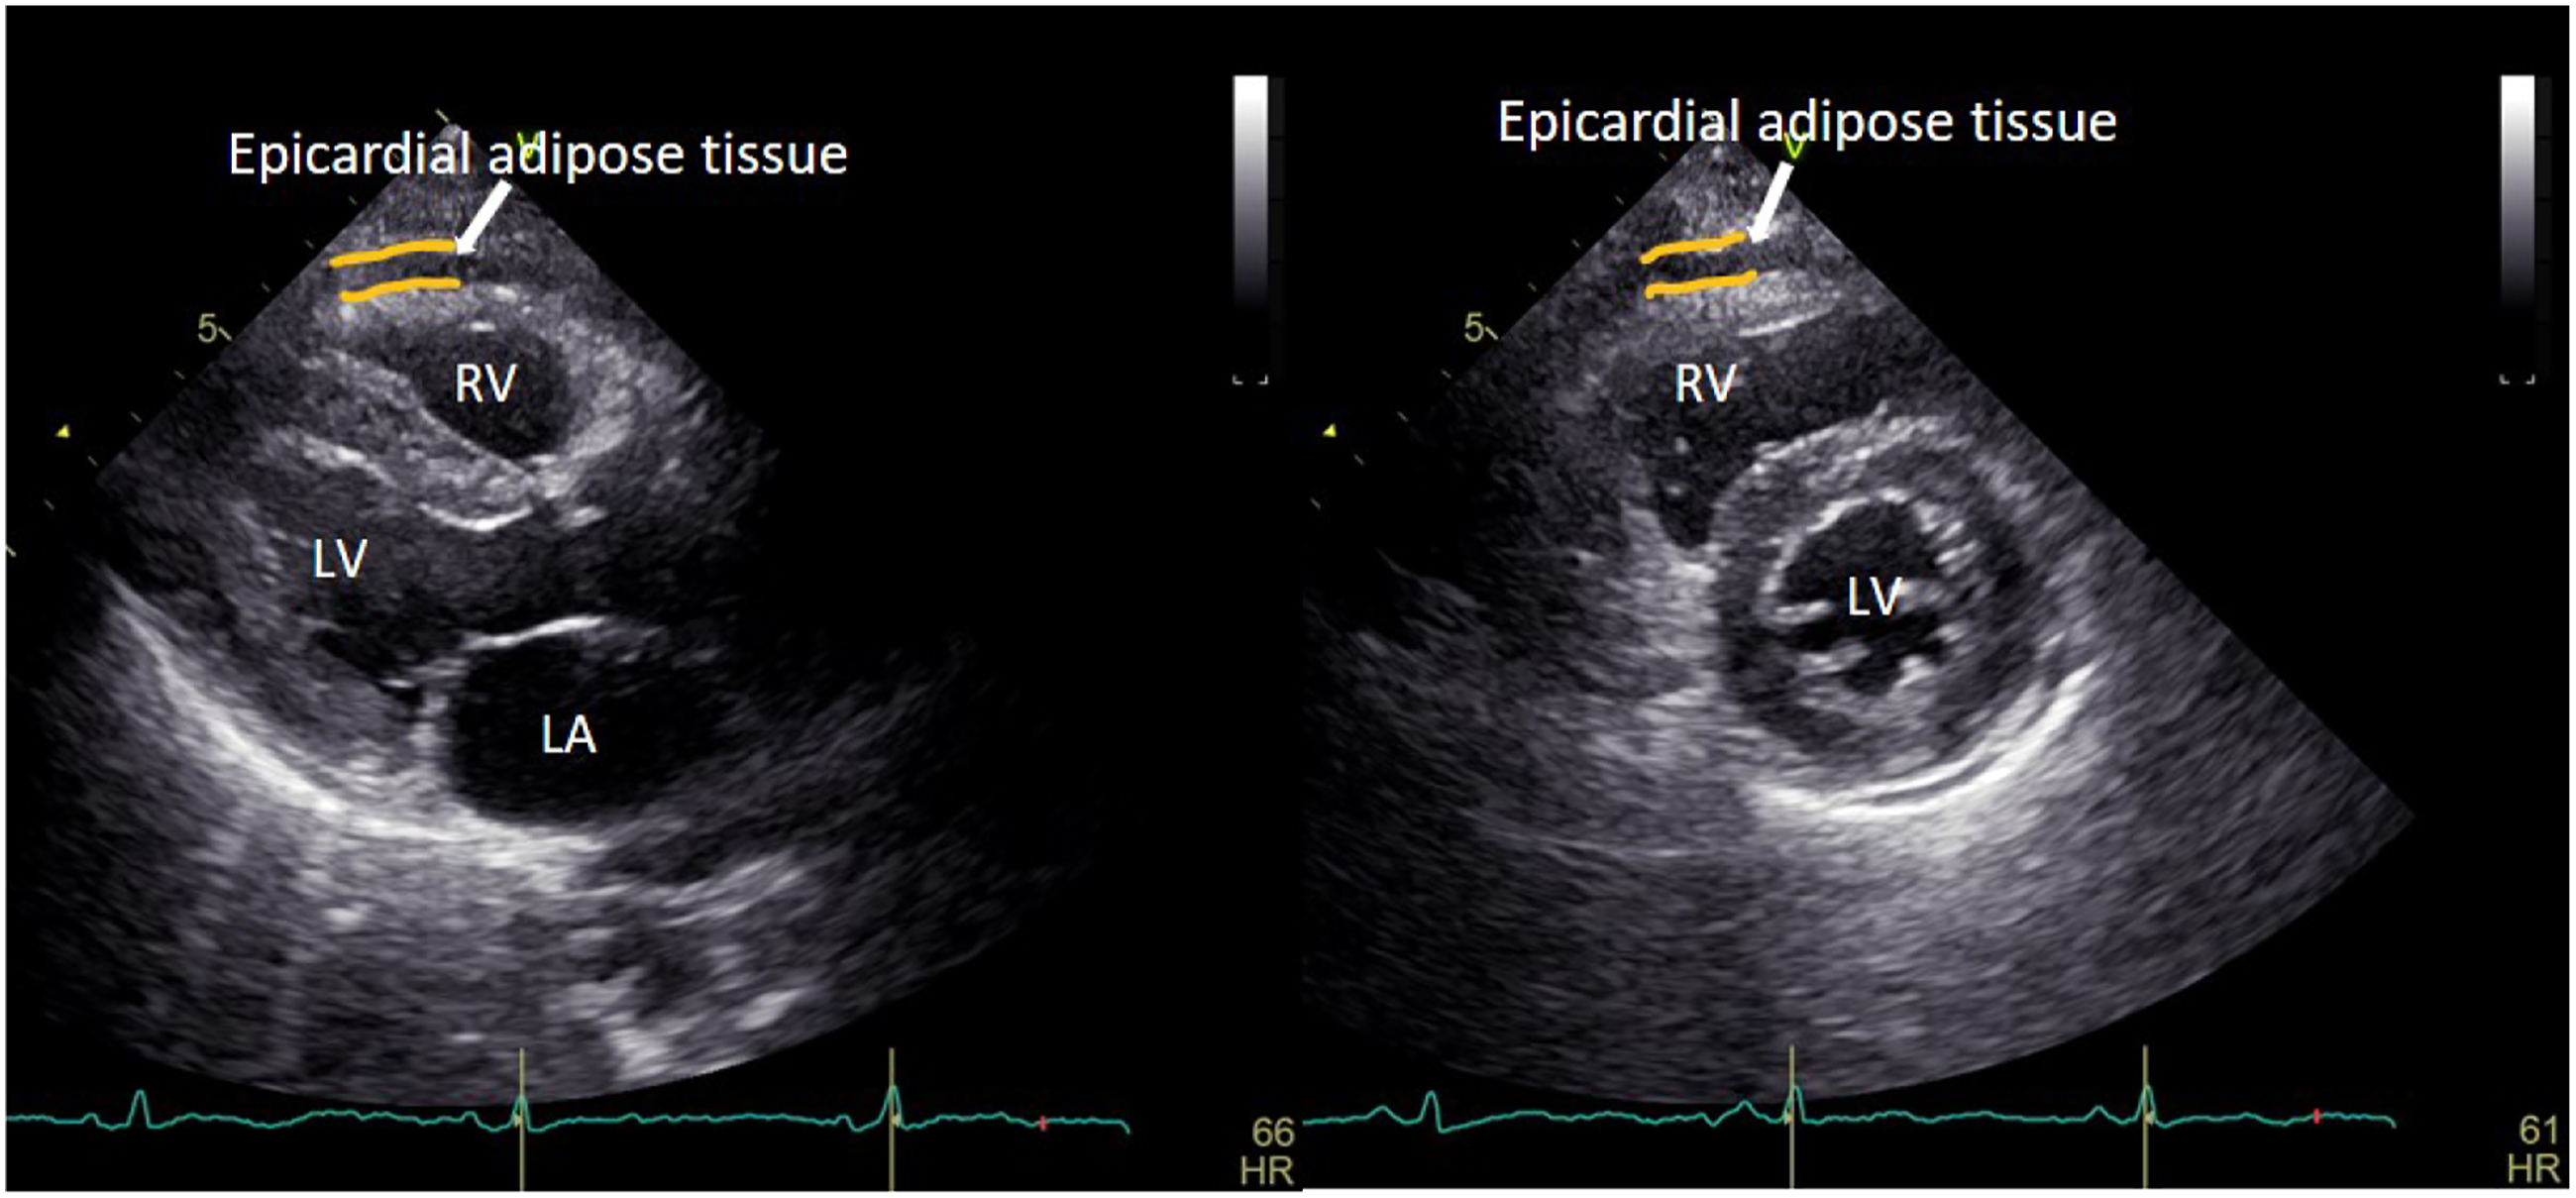
Two-dimensional speckle-tracking echocardiography analysis
Three consecutive cardiac cycles images of apical four-chamber of RV were acquired during an end-expiratory breath-hold and were transferred to the EchoPAC software (EchoPAC Version: 201, GE Vingmed Ultrasound) for offline STE analysis. The endocardial border of the RV was traced manually in the end-systolic frame at the point in the cardiac cycle in which the endocardial border was the clearest. Then the software would generate a region of interest automatically, and adjusted the region of interest to make the myocardial included well. If it was not feasible to track 1 or more segments, the case was excluded. The RV free wall was automatically divided into three segments: basal, mid, and apical. RV peak systolic longitudinal strain (RV LS) and strain rate (RV LSR-S), RV peak early diastolic longitudinal strain rate (RV LSR-E), and RV peak late diastolic longitudinal strain rate (RV LSR-A) were calculated as the mean of the values of the three segments of RV free wall (Figure 2). Due to RV LS is a negative value, we took its absolute value for a simpler interpretation. The representative images of RV longitudinal strain and longitudinal strain rate in controls (a) T2DM with EAT <5 mm (b) and T2DM with EAT ≥5 mm (c).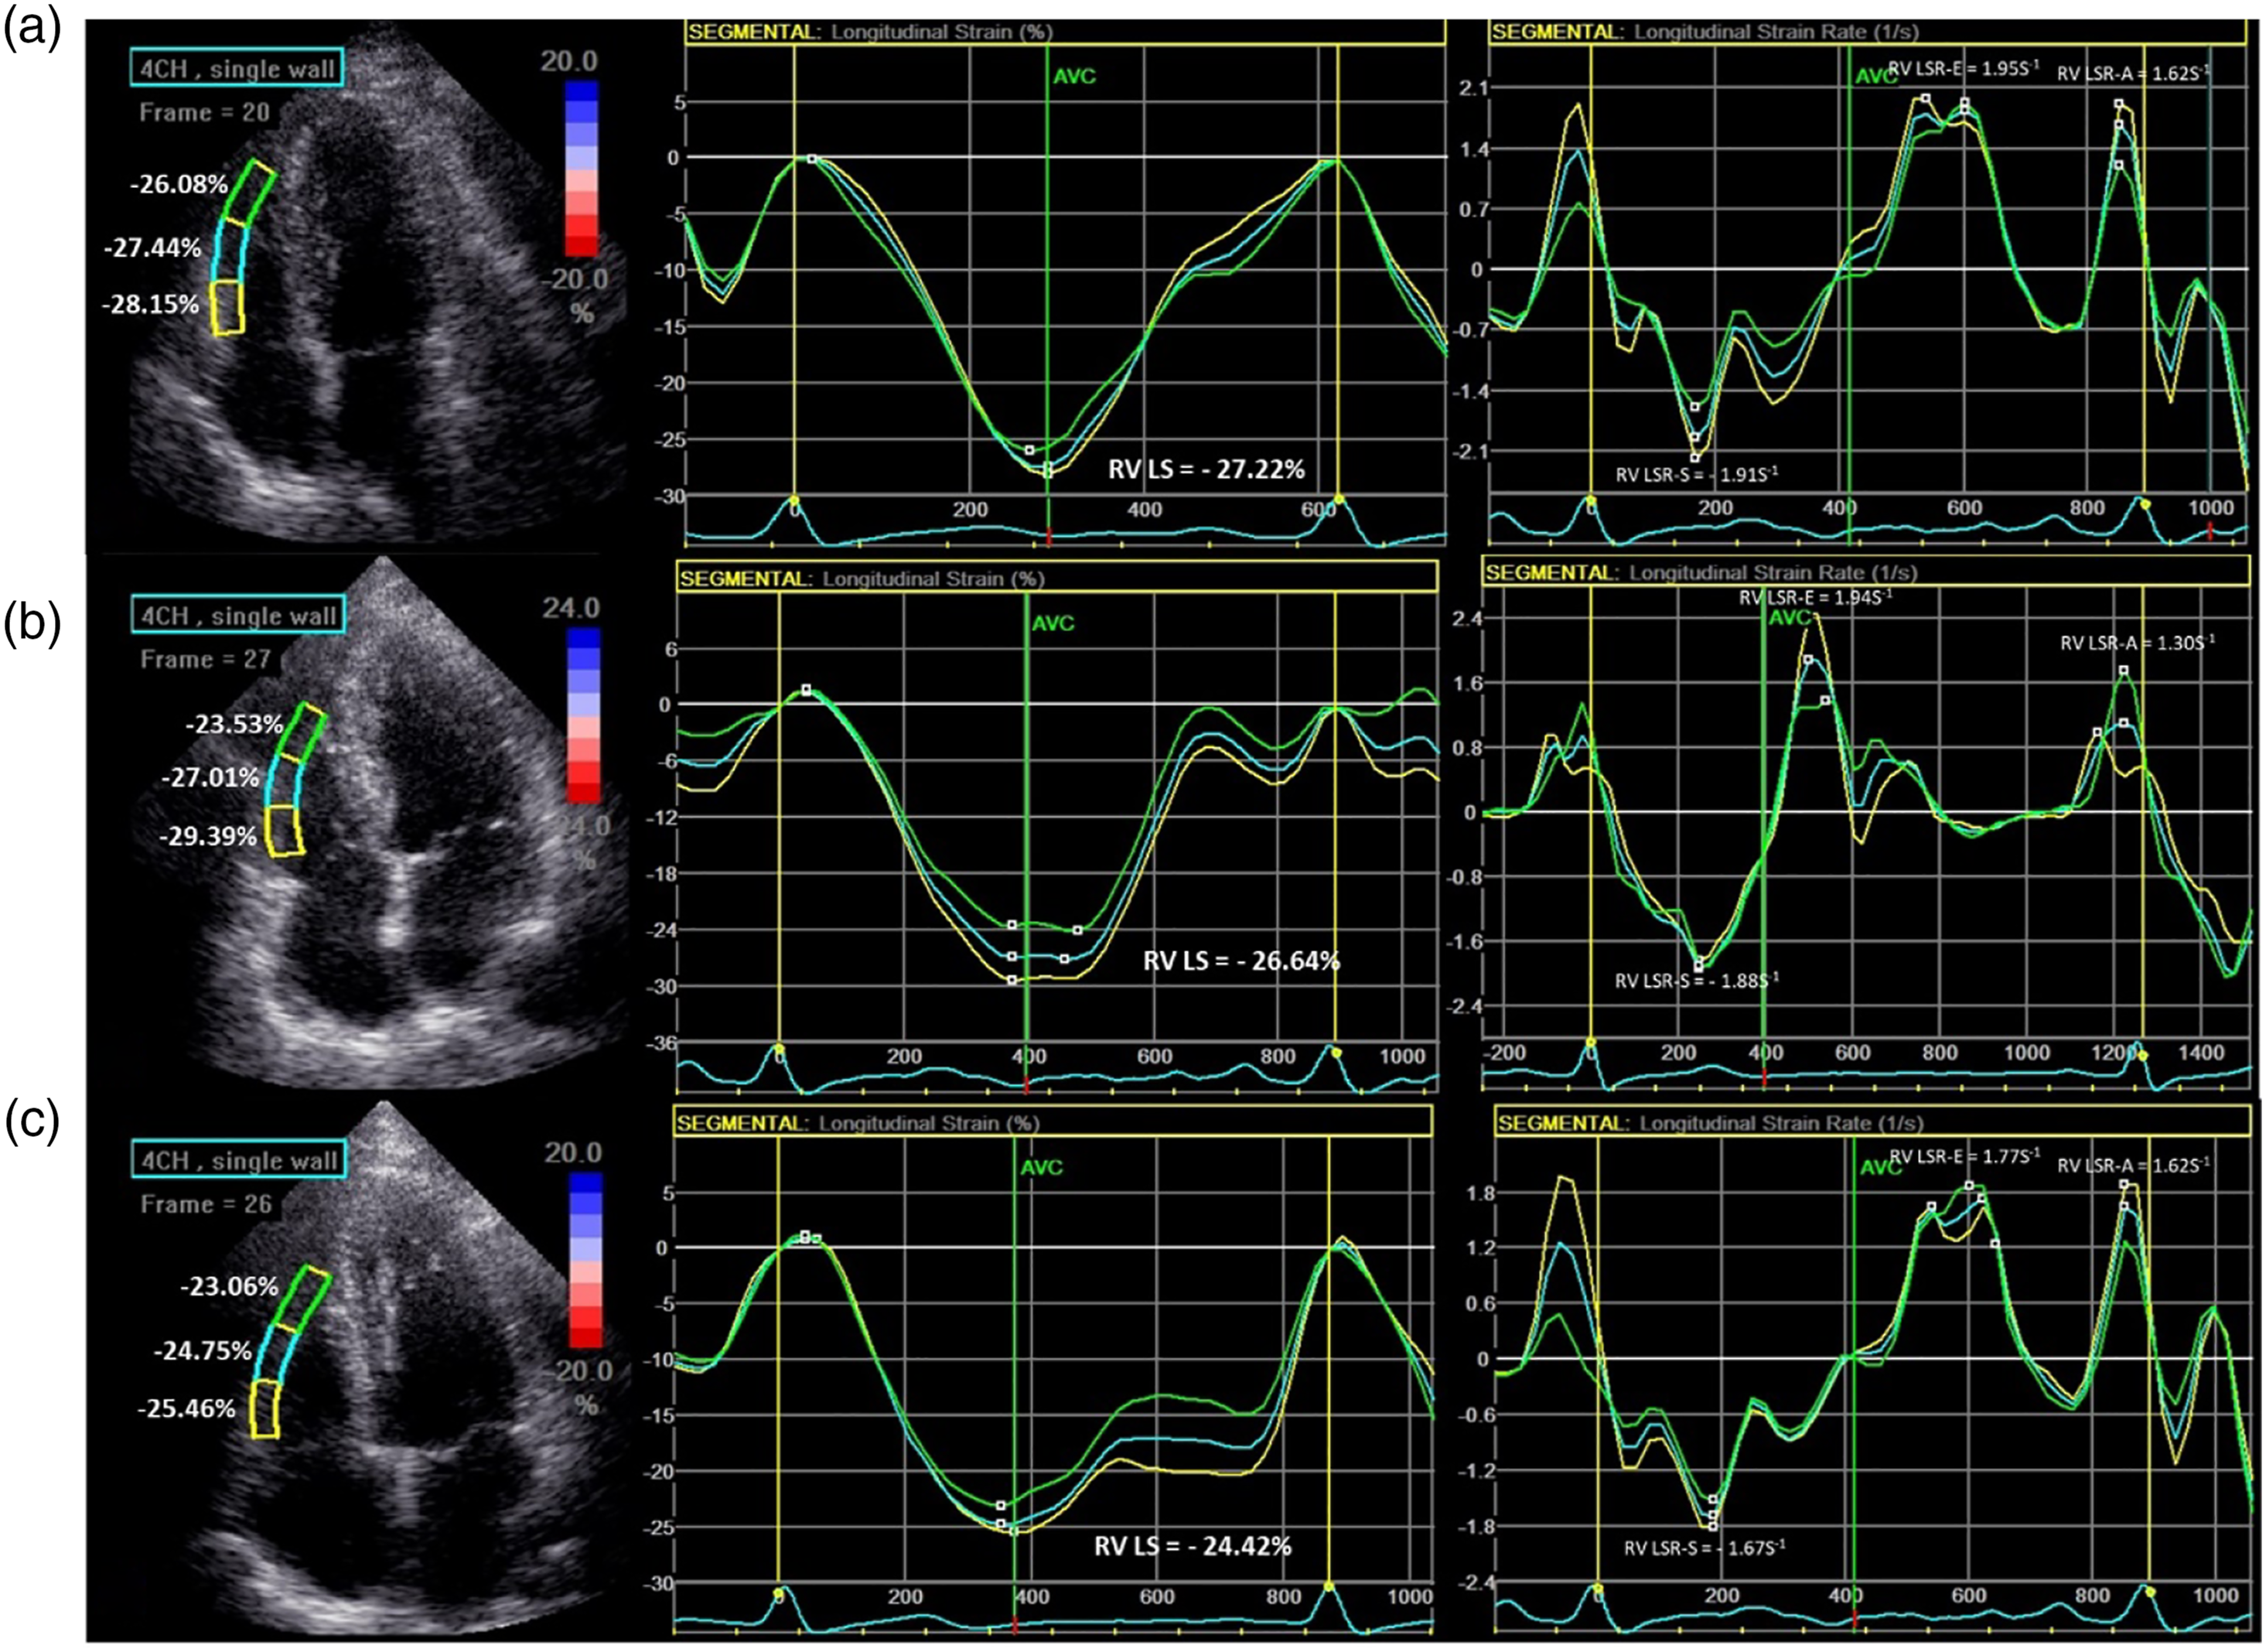
Repeatability test
The measurements of EAT, RV LS, and RV LSR-E were repeated in 20 randomly selected subjects by the same physician (intra-observer variability) and another physician (inter-observer variability) to analyze intra-observer and inter-observer variability.
Statistical analysis
Continuous numeric variables are expressed as mean ± standard deviation (SD) if normally distributed after Kolmogorov-Smirnov test and were compared using an independent Student’s t-test and one-way analysis of variance (ANOVA). Categorical variables were expressed as n (%) of the sample and were compared using the chi-square test or the Fisher exact test. Correlation among clinical risk factors with RV LS and RV LSR-E were tested using bivariate correlation analysis with Pearson’s correlations and multivariate linear regression analysis. The intra-class correlation coefficient (ICC) was used to evaluate intra-observer and inter-observer variability, an ICC ≥0.75 means good reliability. All statistical analysis were conducted using the SPSS version 23.0 software for Windows (SPSS, Chicago, Illinois, USA). A two-tailed p value < 0.05 was considered to indicate statistical significance.
Results
Clinical characteristics
Clinical characteristics of the study populations.
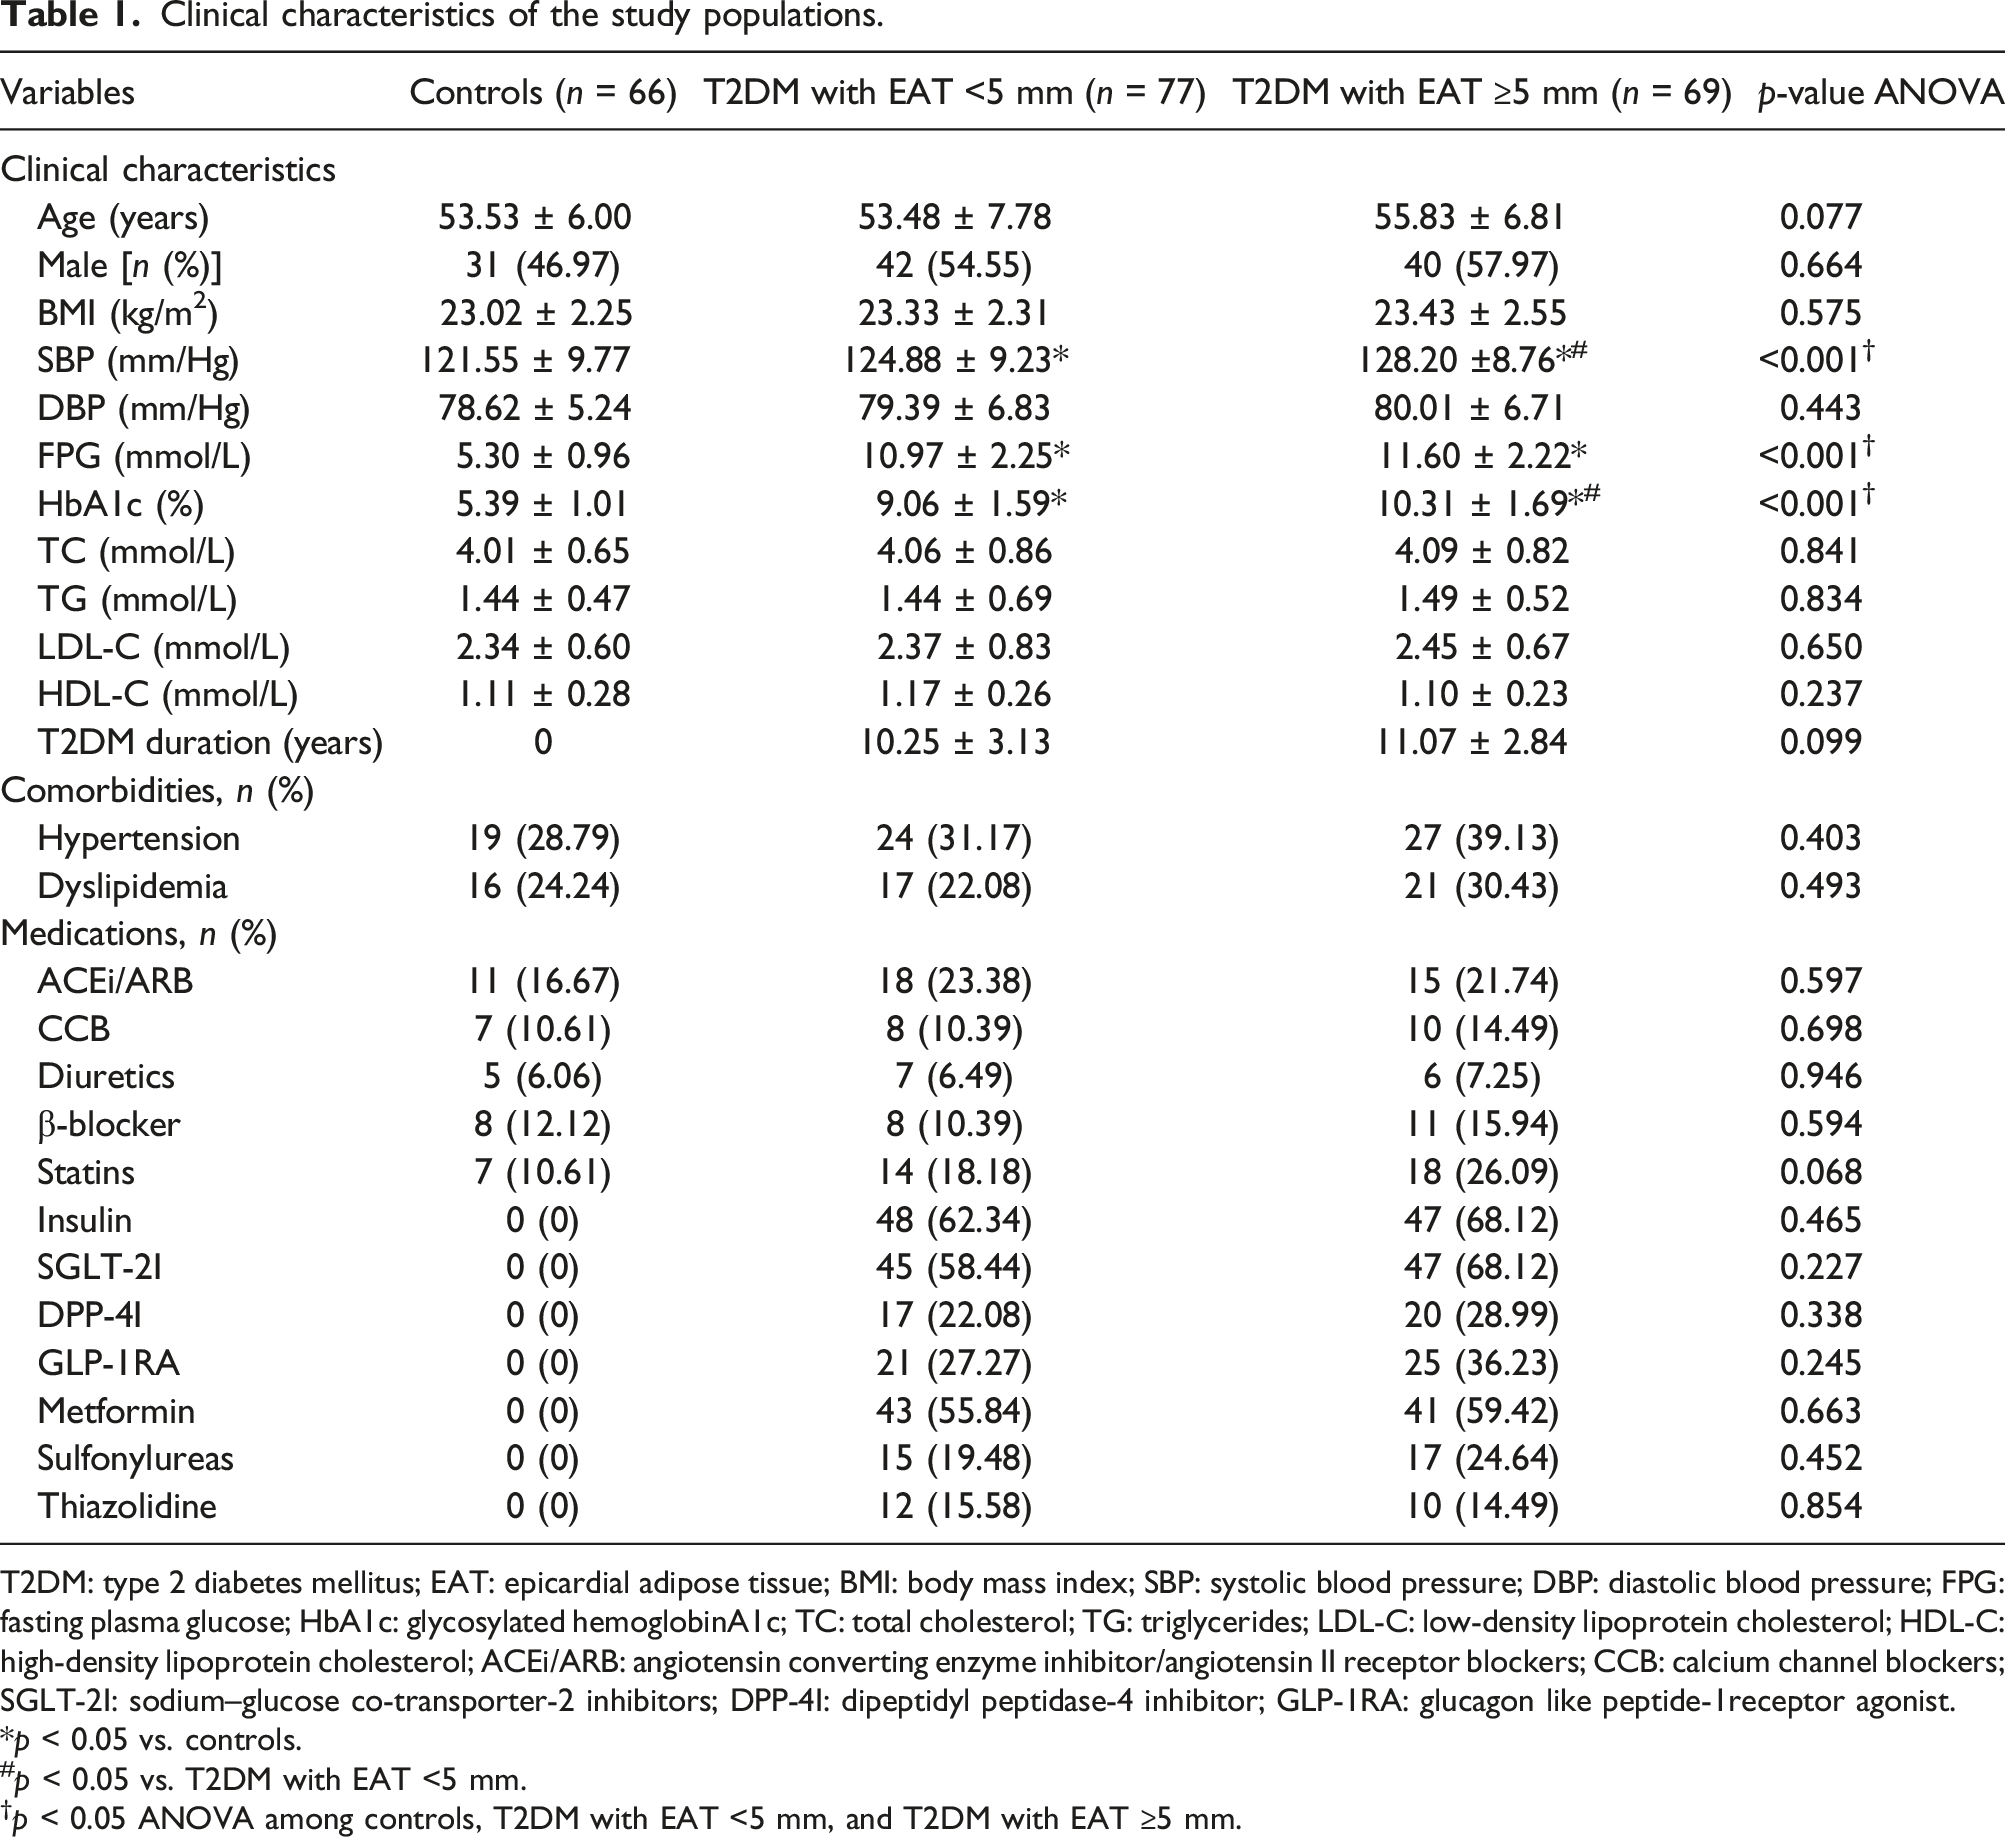
T2DM: type 2 diabetes mellitus; EAT: epicardial adipose tissue; BMI: body mass index; SBP: systolic blood pressure; DBP: diastolic blood pressure; FPG: fasting plasma glucose; HbA1c: glycosylated hemoglobinA1c; TC: total cholesterol; TG: triglycerides; LDL-C: low-density lipoprotein cholesterol; HDL-C: high-density lipoprotein cholesterol; ACEi/ARB: angiotensin converting enzyme inhibitor/angiotensin II receptor blockers; CCB: calcium channel blockers; SGLT-2I: sodium–glucose co-transporter-2 inhibitors; DPP-4I: dipeptidyl peptidase-4 inhibitor; GLP-1RA: glucagon like peptide-1receptor agonist.
*p < 0.05 vs. controls.
#p < 0.05 vs. T2DM with EAT <5 mm.
†p < 0.05 ANOVA among controls, T2DM with EAT <5 mm, and T2DM with EAT ≥5 mm.
Conventional echocardiographic characteristics and RV functional parameters
Comparison of conventional echocardiographic characteristics and right ventricular functional parameters among three groups.
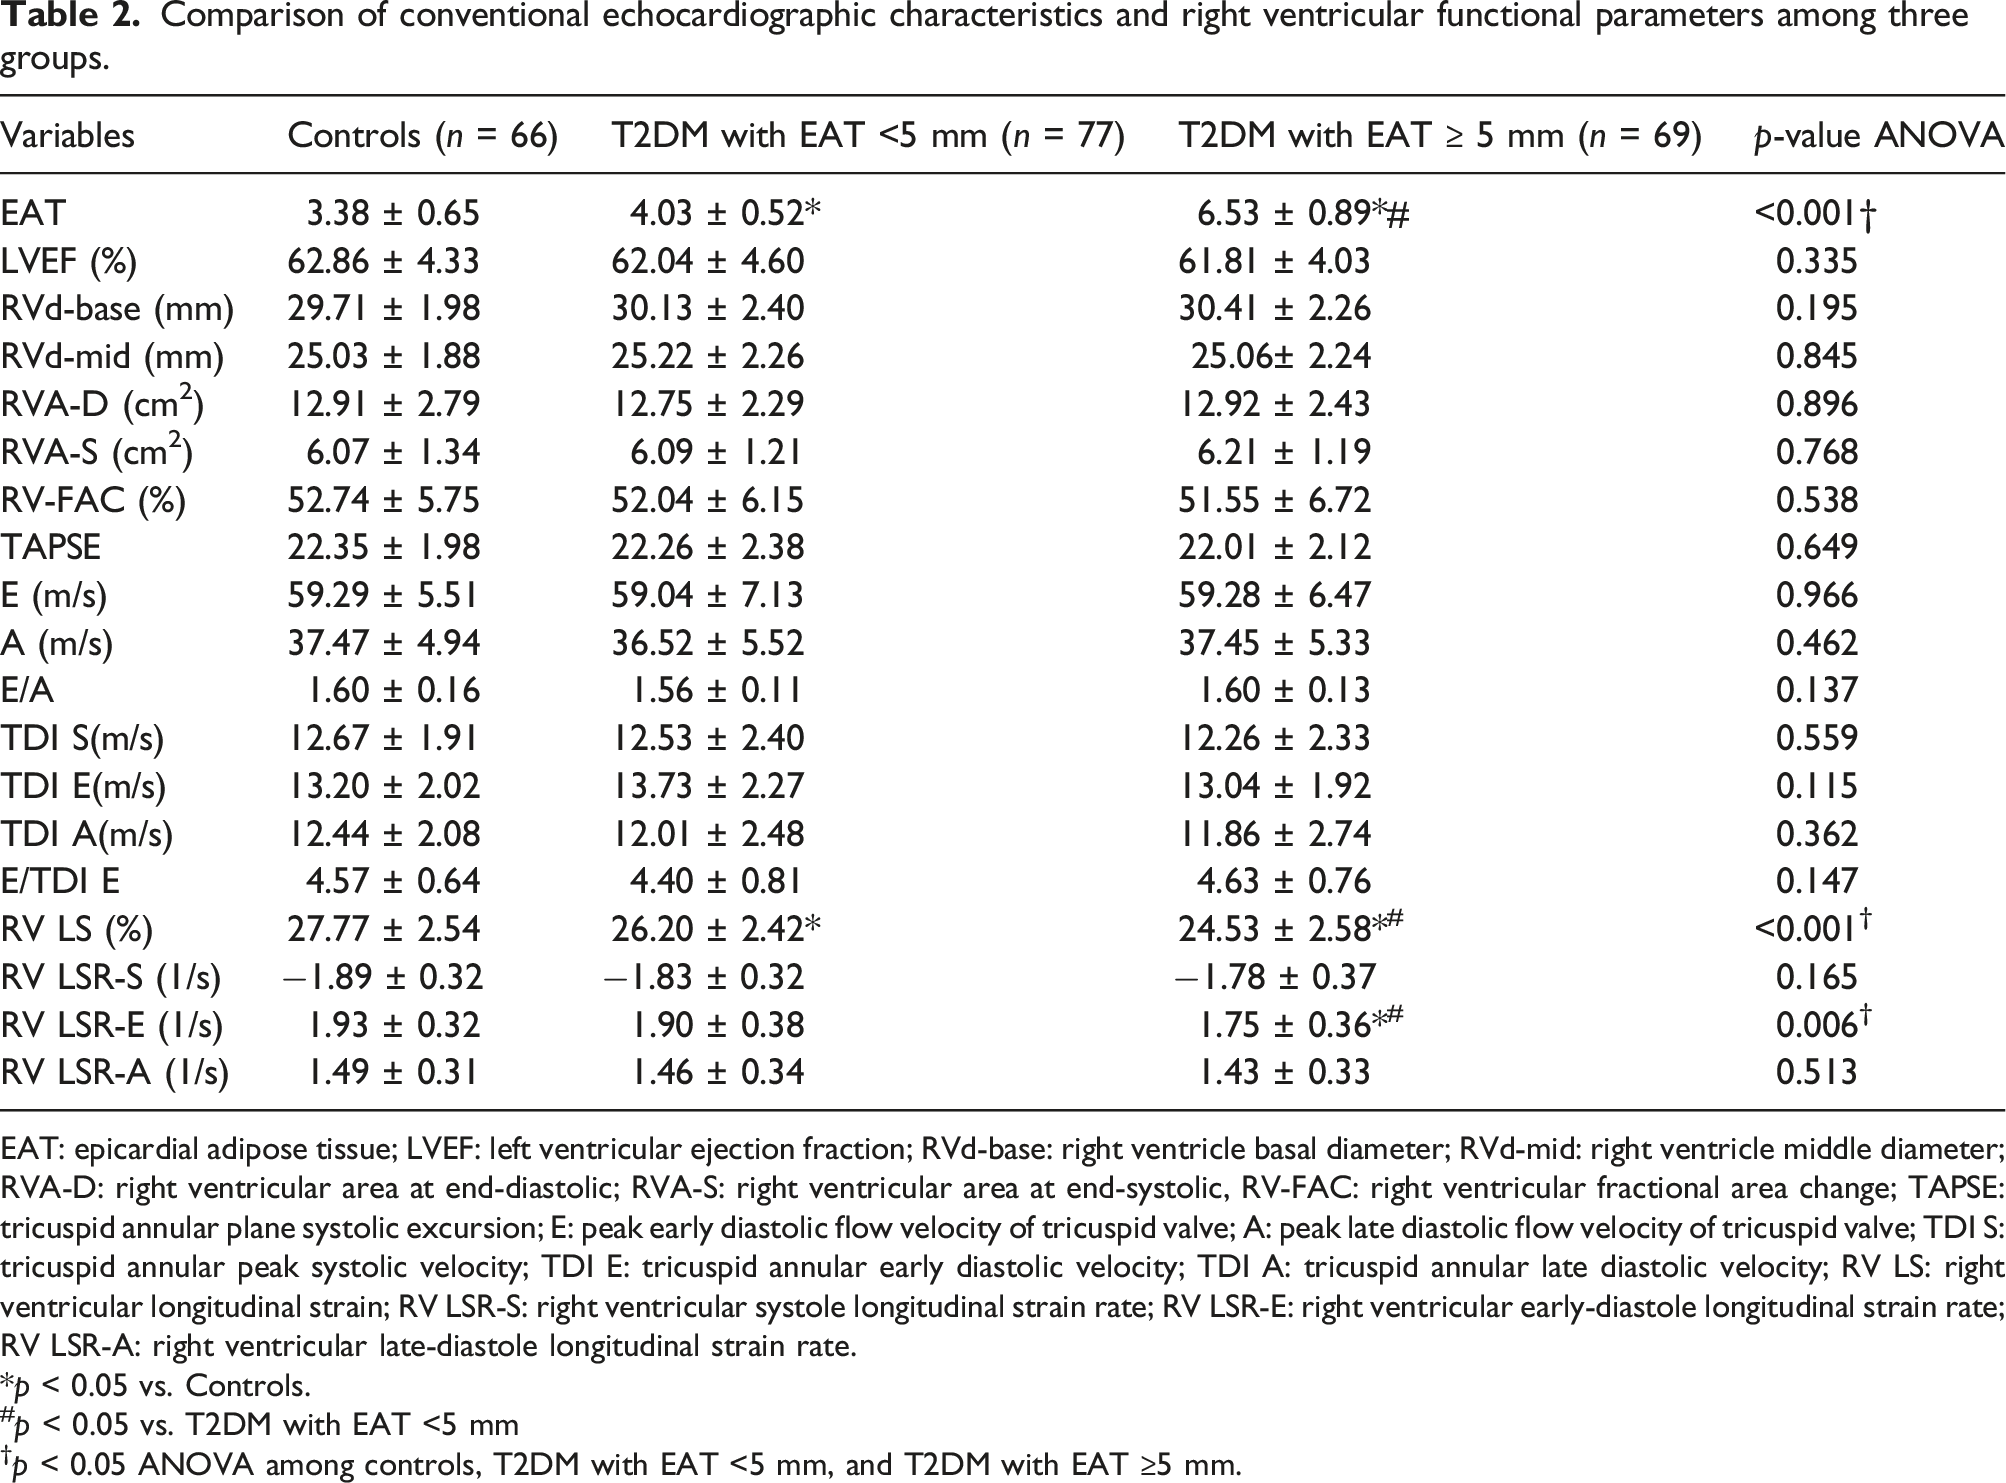
EAT: epicardial adipose tissue; LVEF: left ventricular ejection fraction; RVd-base: right ventricle basal diameter; RVd-mid: right ventricle middle diameter; RVA-D: right ventricular area at end-diastolic; RVA-S: right ventricular area at end-systolic, RV-FAC: right ventricular fractional area change; TAPSE: tricuspid annular plane systolic excursion; E: peak early diastolic flow velocity of tricuspid valve; A: peak late diastolic flow velocity of tricuspid valve; TDI S: tricuspid annular peak systolic velocity; TDI E: tricuspid annular early diastolic velocity; TDI A: tricuspid annular late diastolic velocity; RV LS: right ventricular longitudinal strain; RV LSR-S: right ventricular systole longitudinal strain rate; RV LSR-E: right ventricular early-diastole longitudinal strain rate; RV LSR-A: right ventricular late-diastole longitudinal strain rate.
*p < 0.05 vs. Controls.
#p < 0.05 vs. T2DM with EAT <5 mm
†p < 0.05 ANOVA among controls, T2DM with EAT <5 mm, and T2DM with EAT ≥5 mm.
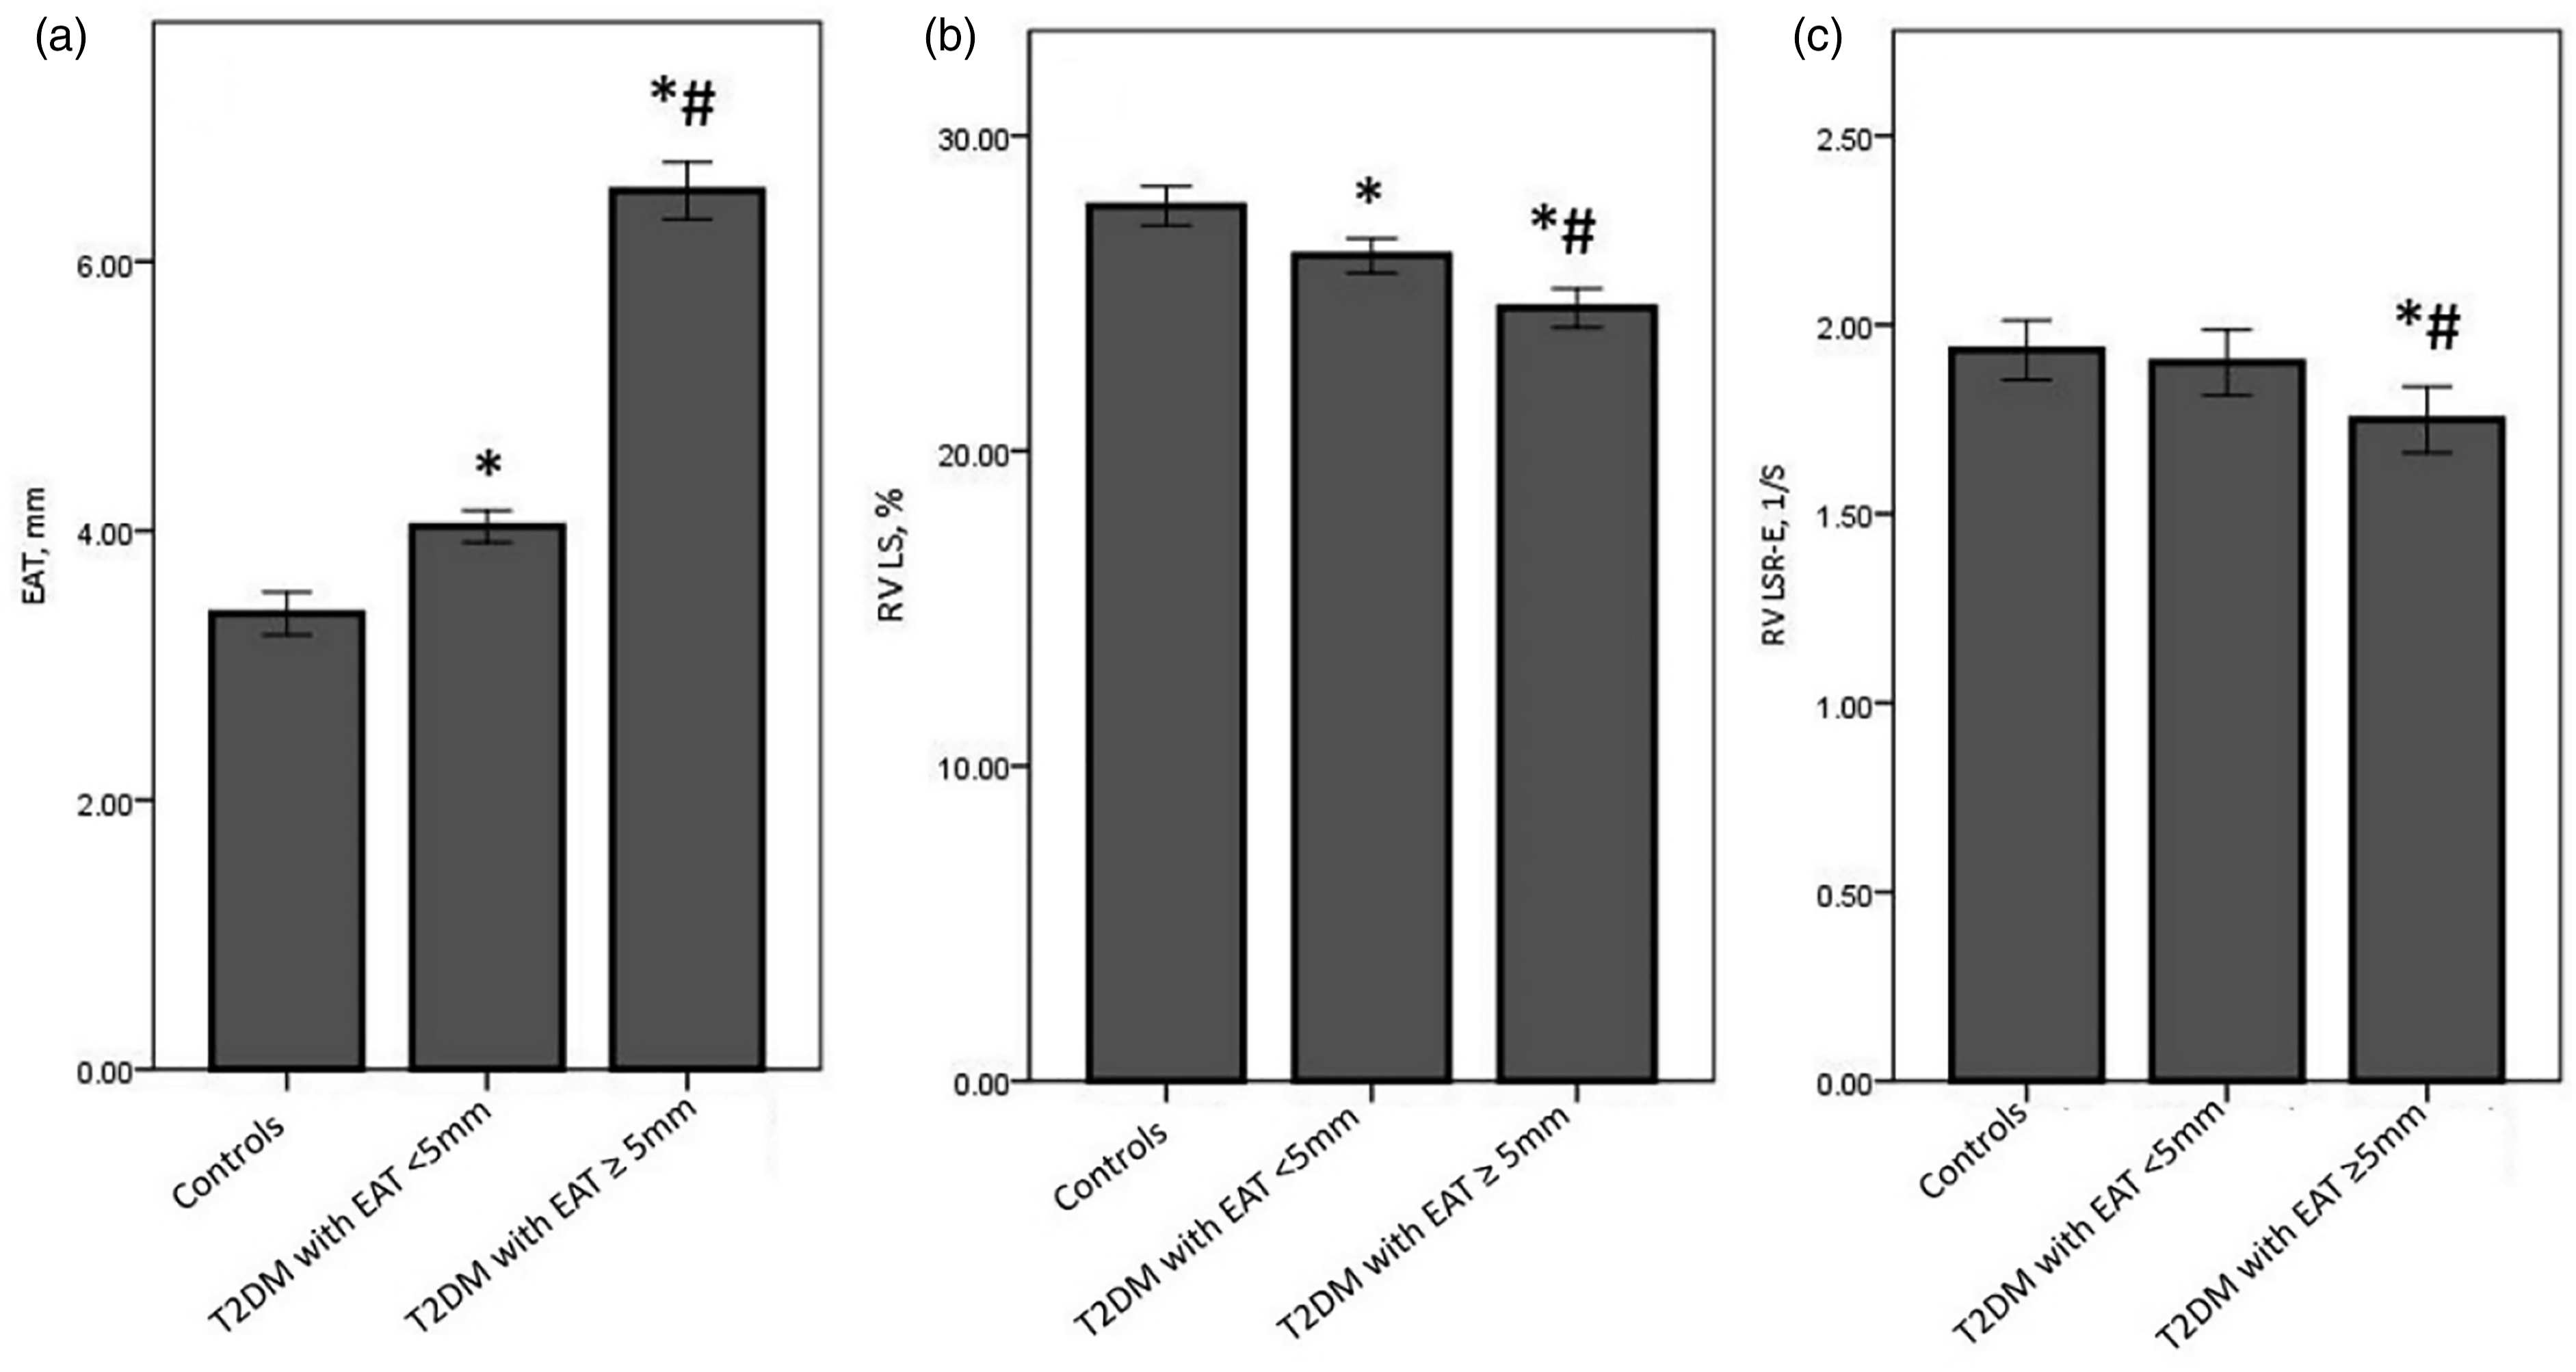
EAT (a) RV LS (b) and RV LSR-E (c) in the controls, T2DM with EAT <5 mm group, and T2DM with EAT ≥5 mm group. *p < 0.05 vs. Controls; #p < 0.05 vs. T2DM with EAT <5 mm.
Association of clinical risk factors and EAT with RV function
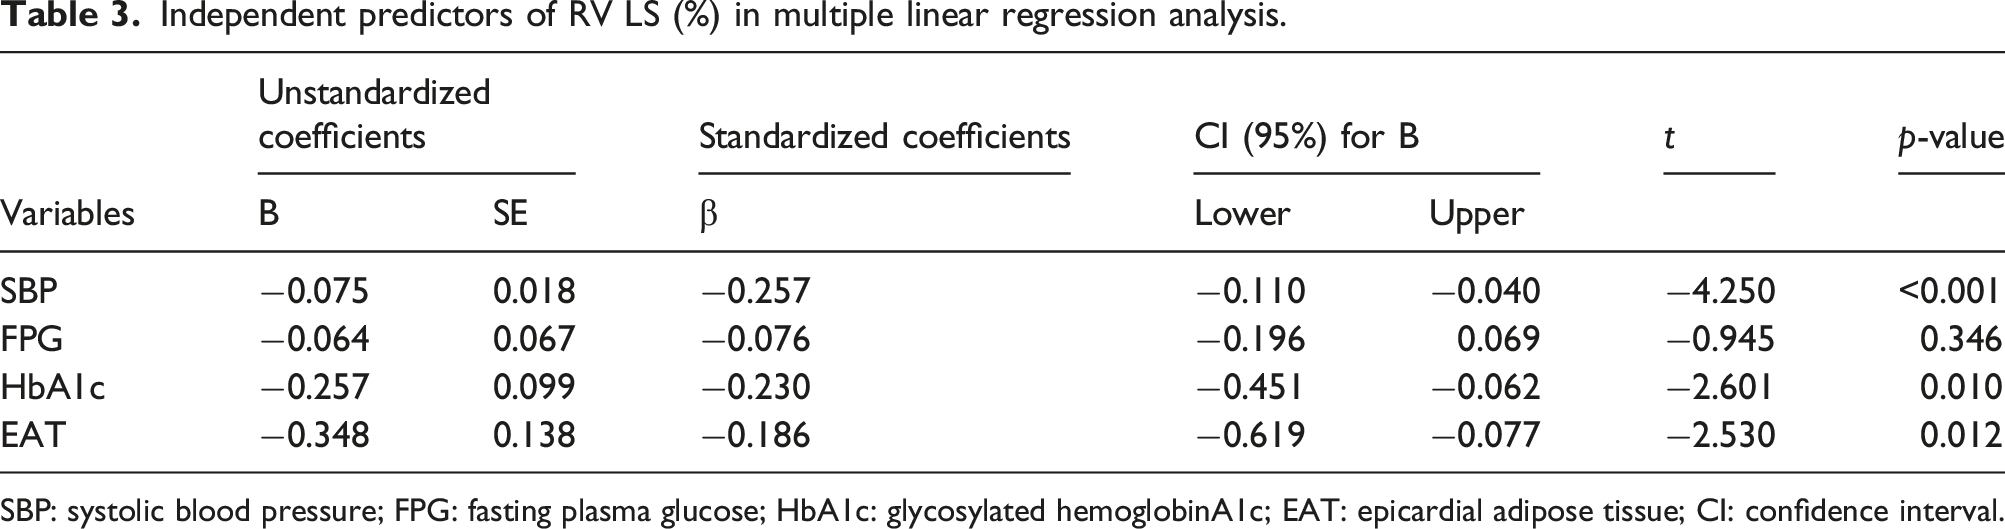
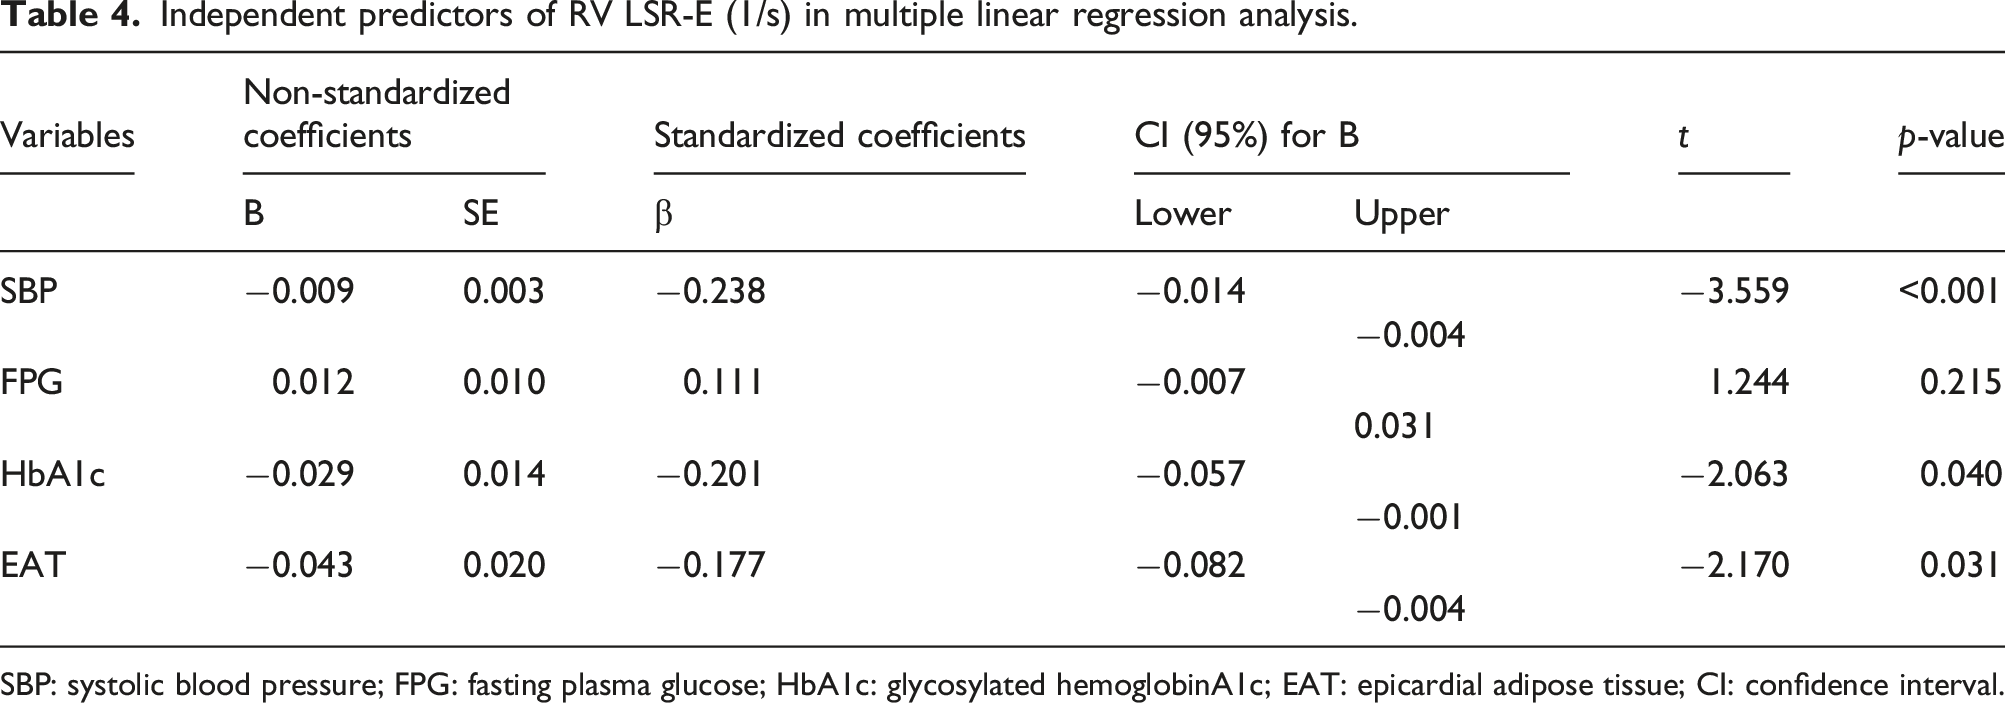
Bivariate correlation analysis with Pearson’s correlations indicated that SBP, FPG, HbA1c, and EAT were negatively correlated with RV LS and RV LSR-E. And then a multivariate linear regression analysis showed that EAT was still negatively correlated with RV LS and RV LSR-E independent of SBP and HbA1c (all p < 0.05) (Figure 4, Tables 3 and 4) Scatter plot demonstrating correlation between the EAT thickness with RV LS and RV LSR-E. EAT: epicardial adipose tissue; RV LS: right ventricular longitudinal strain; RV LSR-E: right ventricular early-diastole longitudinal strain rate. Independent predictors of RV LS (%) in multiple linear regression analysis. SBP: systolic blood pressure; FPG: fasting plasma glucose; HbA1c: glycosylated hemoglobinA1c; EAT: epicardial adipose tissue; CI: confidence interval. Independent predictors of RV LSR-E (1/s) in multiple linear regression analysis. SBP: systolic blood pressure; FPG: fasting plasma glucose; HbA1c: glycosylated hemoglobinA1c; EAT: epicardial adipose tissue; CI: confidence interval.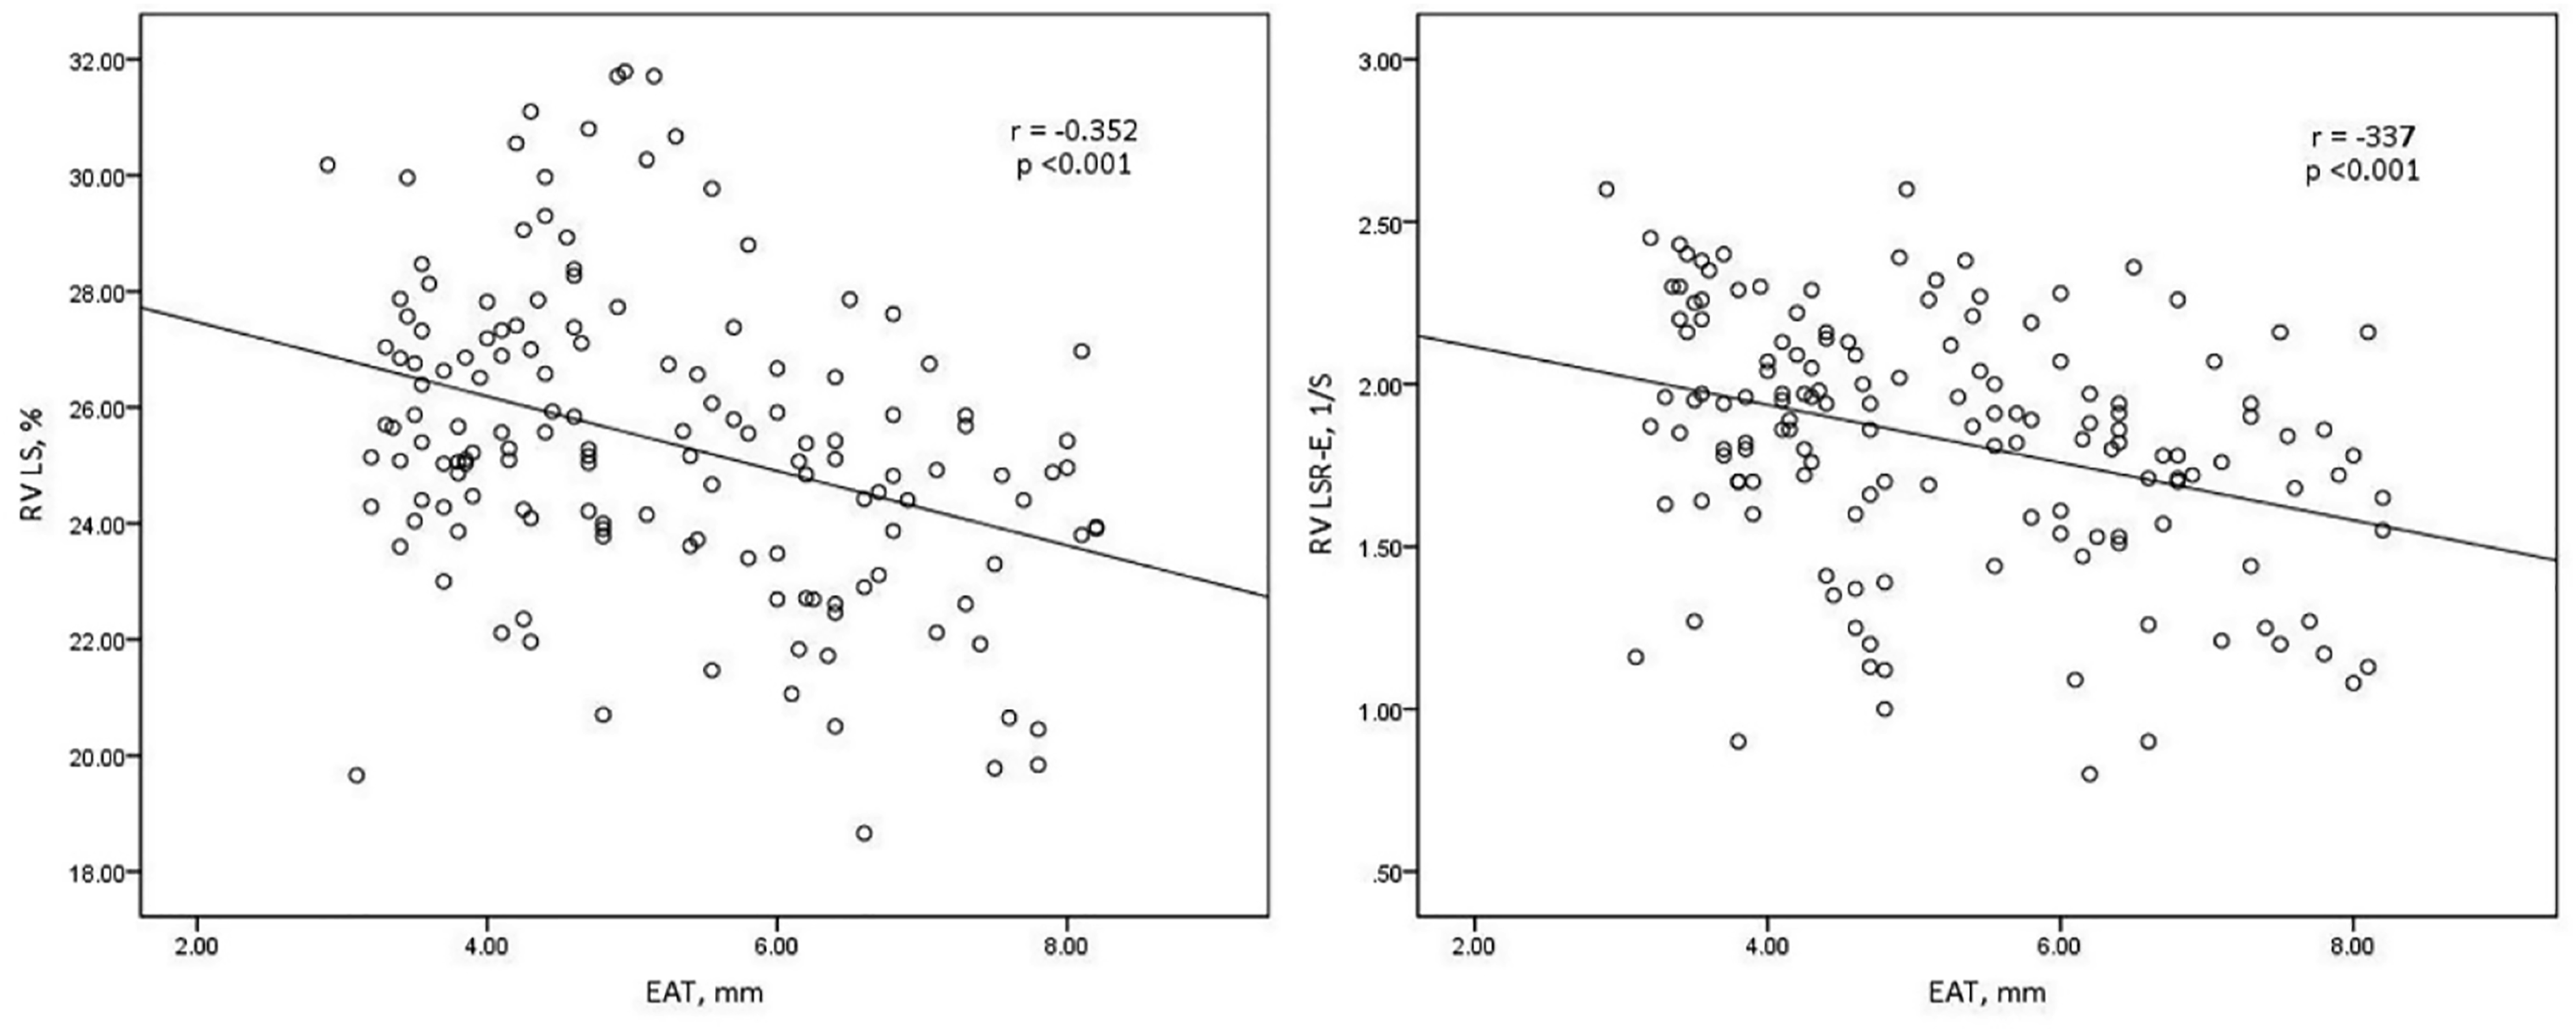
Intraobserver and interobserver variability
Intra-observer and inter-observer variability of RV LS, RV LSR-E, and EAT.
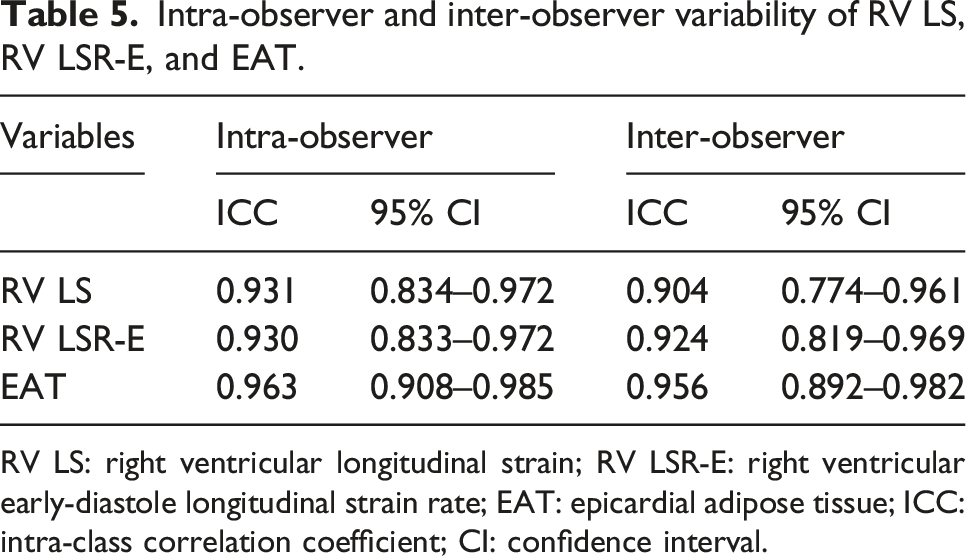
RV LS: right ventricular longitudinal strain; RV LSR-E: right ventricular early-diastole longitudinal strain rate; EAT: epicardial adipose tissue; ICC: intra-class correlation coefficient; CI: confidence interval.
Discussion
This study demonstrates that (1) EAT thickness was significantly higher in T2DM patients than that in non-T2DM controls; (2) T2DM is associated with subclinical RV systolic dysfunction and early diastolic dysfunction, which can be detected by 2D-STE; (3) thickened EAT is associated with subclinical RV systolic dysfunction and early diastolic dysfunction in T2DM patients independent of traditional cardiovascular risk factors.
Recent years, RV function has emerged as an independent predictor of morbidity and mortality in a variety of disease (e.g. pulmonary hypertension, heart failure, and coronary artery disease).21,22 The clinical importance of assessing RV function in pathological conditions is increasing although it has been neglected for many years. Due to the complex geometry of the RV, traditional echocardiographic parameters such as RV-FAC, TAPSE, TDI S still have limitations in early sensitive and accurate diagnosis of RV dysfunction. 23 RV muscle bands are mostly made up of longitudinal superficial spatial muscle. So in this study, we used 2D-STE to analyze the longitudinal strain and strain rate of the RV free wall to assess RV function. 2D-STE is a new imaging method used to evaluate myocardial function. It is superior to many other conventional imaging techniques in detecting subclinical myocardial dysfunction. 24 Our results showed that subclinical RV systolic dysfunction and early diastolic dysfunction were present in T2DM patients.
Nelson et al. 25 found that EAT ≥5 mm may identify an individual with a higher likelihood of having detectable carotid atherosclerosis. Then we wondered whether T2DM with EAT ≥5 mm suffer more severe myocardial impairment. We divided all T2DM patients into two groups with an EAT cut-off value of 5 mm. Our results showed that in the T2DM with EAT ≥5 mm group, the RV function suffered more serious impairment than that in the T2DM with EAT <5 mm group. Moreover, the multiple linear regression analysis indicated that EAT was significantly associated with RV subclinical systolic dysfunction and early diastolic dysfunction in T2DM patients independent of those generally accepted etiologies (e.g. blood pressure and blood glucose). To our knowledge, to date this is the first study to explore this topic using this method.
EAT is a new cardiometabolic risk factor with endocrine and paracrine functions located between the epicardium and the visceral pericardium. A large body of evidence suggest that thickened and dysfunctional EAT is associated with left ventricular dysfunction in a variety of pathological states.17,18 A previous study by our group has shown that thickened EAT is associated with subclinical LV dysfunction in T2DM patients. 26 In the present study, our results showed that EAT is also associated with subclinical RV systolic dysfunction and early diastolic dysfunction in T2DM patients. The exact mechanism by which EAT impairs myocardial function has not yet been fully elucidated. However, a large number of studies have shown that the inflammatory mechanism mediated by thickened EAT due to its imbalance between anti-inflammatory factors and pro-inflammatory factors may be involved in myocardial damage.27,28
To investigate the association between EAT and RV function in T2DM patients has important clinical value. The relationship of RV function impairment with EAT suggests that EAT may be a therapeutic target for preventing cardiovascular complications in patients with T2DM. Bouchi et al. 29 have confirmed that sodium–glucose co-transporter-2 (SGLT-2) inhibitors which are novel oral hypoglycemic drugs can significant decrease the EAT volume in T2DM patient. Moreover, SGLT-2 inhibitors have been proven to have beneficial effects on cardiovascular function and can reduce the occurrence of cardiovascular events. 30 So its beneficial effect on cardiovascular function may be achieved by targeting EAT, which needs to be confirmed by future large-scale research.
Our study has several potential limitations. Firstly, EAT thickness was measured from the right ventricular free wall by echocardiography and does not reflect all sub-epicardial adipose tissue volume, but highly correlates with magnetic resonance imaging measurement which is considered the gold standard for EAT quantification. 20 Secondly, the quality of strain and strain rate data is strictly dependent on the quality of the echocardiographic images due to 2D-STE analysis is based on 2D gray scale images. Thirdly, due to laboratory conditions, various adipokines and pro-inflammatory factors related to EAT in T2DM patients were not measured.
In conclusion, subtle subclinical RV systolic dysfunction and early diastolic dysfunction were demonstrated in T2DM patients by using 2D-STE. The impairment in RV function was associated with excess EAT in T2DM patients independent of other cardiovascular risk factors.
Footnotes
Declaration of conflicting interests
The author(s) declared no potential conflicts of interest with respect to the research, authorship, and/or publication of this article.
Funding
The author(s) disclosed receipt of the following financial support for the research, authorship, and/or publication of this article: This work was supported by the Changzhou Social Development Science and Technology Support Project (CE20205047).
Ethics approval
This study was approved by the Human Subjects Committee of the Affiliated Changzhou No. 2 People’s Hospital of Nanjing Medical University.
Informed consent
Written informed consent was obtained from all participants as instructed by the ethics committee.