
Abstract
Although there are substantial analyses for association of coronary artery disease (CAD) with diabetic retinopathy (DR), which was recognized as an indicator of risk for CAD in diabetes mellitus (DM), there is as yet little rigorous evaluation of the relationship between DR and subclinical coronary atherosclerosis (CAS) determined by coronary 64-slice multidetector computed tomography angiography (MDCTA) in persons with type 2 DM. In this article, we found that CAS associated with DR was independent of the traditional risk factors for CAD [odds ratio (OR): 5.1; 95% confidence interval (CI): 2.6–10.1; p < 0.001], and the severity and extent of CAS were significantly increased with the incidence and progression of DR (all p < 0.001). An independent association between hypertension, obesity, renal dysfunction and DR was also found (all p < 0.05). The relationship of CAS with DR was relatively continuous and graded under the diabetes status. Therefore, much of CAS and DR could be still multifactorial with common pathway.
Introduction
Diabetic retinopathy (DR) is a common and devastating microvascular complication in types 1 and 2 diabetes. The association of hyperglycaemia with incidence and progression of DR has been documented. In the United Kingdom Diabetes Prospective Study, control of hypertension, independent of glycaemia control, was shown to significantly reduce the progression of DR and visual loss in people with type 2 diabetes mellitus (T2DM). 1 Dyslipidaemia, independent of glycaemia, has also been shown to be associated with an increased risk of developing DR in some epidemiological studies, although the results have not been consistent.2–5 Emerging evidence suggests that retinopathy is an early and frequent sign of other vascular complications and is strongly associated with the development of coronary artery disease (CAD).6,7 Coronary atherosclerosis (CAS), as an early and subclinical manifestation of CAD, is characterized by coronary atherosclerotic plaques categorized as soft or non-calcified, calcified and mixed. The pathogenesis of CAS starts with the inflammatory activation of endothelial cells and the accumulation of cells and extracellular matrix within the inner vessel wall, provoking intimal thickening. These processes are followed by the deposition of lipids and subsequently by the formation of thin fibrous cap overlying a large atheromatous core of lipid, which constitutes soft plaque. The formation of calcified plaque occurs only as a late consequence of atherosclerosis. If intimal thickening is excessive (i.e. the initial lumen is narrowed by >70%), it can lead to the obstruction of blood flow and tissue ischaemia. Therefore, accelerated CAS has become the leading cause of CAD, which is responsible for the high premature morbidity and mortality in those with T2DM. The 64-slice multidetector computed tomography angiography (MDCTA) of the coronary arteries has the advantages of non-invasive assessment of coronary artery stenosis and plaque properties.
To date, there are few data on association of severe DR with severe coronary calcification detected by MDCTA in patients with diabetes. 8 The purpose of our study was to examine the associations of DR with subclinical CAS in a cohort of people with T2DM undergoing coronary 64-slice MDCTA irrespective of the presence of CAD.
Methods
Study patients
From July 2007 to December 2009, we conducted a cross-sectional study at the Daping Hospital in Chongqing, China. Two hundred and thirty-eight cases were selected from consecutive T2DM patients referred to the hospital for further examinations and treatment due to suspicion of CAD or having at least two cardiovascular risk factors. MDCTA was used to evaluate the CAS, and binocular ophthalmoscopy was applied to screen the retinopathy. According to the retinal photograph findings, these patients were divided into two groups: those with retinopathy (n = 118, DR group) and those without retinopathy (n = 120, NDR group). There were no statistically significant differences with respect to gender and age. Of these patients, 83 had established hypertension and 46 had suspected or documented CAD defined according to classic exertional chest pain with ST segment changes on 12-lead or ambulatory electrocardiography or a history of previous myocardial infarction (MI) with electrocardiographic evidence and elevated serum markers suggesting MI (troponin). T2DM was defined according to the World Health Organization (WHO) criteria. 9 The exclusion criteria included (1) the presence of antibodies to glutamic acid decarboxylase, (2) acute kidney injury and (3) a very poor prognosis and inappropriate conditions for testing. The institutional review boards approved this study, and all the patients provided their written informed consent.
After collection of background data, such as age, gender, hypertension, family history of DM and duration of DM, for all participants, body weight and height were measured with individuals wearing light clothing and no shoes, and body mass index (BMI) was calculated as the weight in kilograms divided by the square of the height in metres. Blood pressure (BP) was measured with mercury sphygmomanometer in the right arm with the patients sitting after 5-min rest; four determinations were recorded. Mean arterial pressure (MAP) is expressed as diastolic BP (DBP) and one-third of the pulse pressure. Hypertension was defined as systolic BP (SBP) or DBP ≥ 140/90 mmHg, as the average of the last three determinations and/or a current antihypertensive treatment. All participants had blood samples drawing after a minimum 12-h fast for the measurement of fasting plasma glucose (FPG), glycosylated haemoglobin (HbA1C), total cholesterol (TC), triglyceride (TG), high-density lipoprotein–cholesterol (HDL-C) and serum creatinine. The collection of 24-h urine samples in the absence of urinary infection was used to determine the urinary albumin excretion rate (UAER). The modification of diet in renal disease equation recalibrated for Chinese 10 to estimate glomerular filtration rate (eGFR) was expressed in mL/min/1.73 m2

where SCR is the serum creatinine expressed as micromole per litre and 1.233 is the coefficient for Chinese. The target ranges for control of glycaemia, BP and lipidaemia were defined as HbA1C < 7.0%, BP < 130/80 mmHg and low-density lipoprotein–cholesterol (LDL-C) < 2.6 mmol/L, and albuminuria was defined as UAER ≥ 30 mg/day according to American Diabetes Association. 11
Detection of DR
After mydriasis was induced, indirect binocular ophthalmoscopy was performed by a L-0185 slit-lamp biomicroscope (magnification 10× and 16×) and handheld lens (magnification 90×). The photographs of four standard 30° fields of each eye of all patients were taken through dilated pupils in stereo pairs (lateral to macula, macula, disc and nasal) with Canon CF 60UV fundus camera (Canon Medical Systems, Tokyo, Japan). 12 Retinal evaluations were performed independently by an experienced ophthalmologist blinded to the clinical and laboratory data of these patients. For the present analysis, the severity of the retinopathy was graded by a simplified classification because of the limitation of our study sample size, in which no detectable retinal changes, pre-proliferative diabetic retinopathy (pre-PDR) and proliferative diabetic retinopathy (PDR) were included. In brief, pre-PDR was defined by the presence of microaneurysms, haemorrhages, hard exudates, venous congestion, cotton wool spots or intraretinal microvascular abnormalities, and PDR was diagnosed when new vessels, glial proliferation, preretinal haemorrhage, vitreous haemorrhage, scars of photocoagulation (known to have been directed at new vessels) and/or retinal detachment were found.13,14 Patients with none of these abnormalities were classified as not having diabetic retinopathy (NDR).
64-Slice multidetector computed tomography coronary angiography
If necessary and tolerated, oral beta-blockers (metoprolol, 25–50 mg) were provided before the scan to achieve a heart rate < 65 beats/min. All subjects underwent computed tomography coronary angiography (CAG) imaging using 64-slice multidetector computed tomography (MDCT) scanner (LightSpeed VCT; GE Healthcare, Milwaukee, WI, USA). Bolus tracking in the ascending aorta at a threshold of 130 HU was performed for timing. The coronary angiographic scan was obtained with injection of 80 mL non-ionic contrast medium (370 mg I/mL Ultravist; Schering Pharmaceutical Ltd, China) at a flow rate of 3.0–3.5 mL/s followed by 50 mL of saline solution with the same injection rate to wash out the contrast material from the right ventricle. The images including the whole heart were acquired. The MDCT CAG was performed using 64 × 0.6-mm collimation and retrospective electrocardiographic gating. The gantry rotation speed was 350 ms/rotation, the gantry rotation time was 330 ms, the pitch was 0.21 and scanning time was 10–15 s. The standardized image reconstruction was performed at 65% of the R-R interval with a slice thickness of 0.75 mm.
All acquired MDCTA images were transferred to a dedicated CT 3D post-processing workstation (Leonardo; Siemens Healthcare, Malvern, PA, USA) and were interpreted according to previously published methodology 15 by two experienced radiologists blinded to the detailed clinical backgrounds. The left main coronary artery, the left anterior descending coronary artery, the left circumflex coronary artery and the right coronary artery were each assessed using the American Heart Association classification. 16 Identified atherosclerotic plaques were classified as calcified or non-calcified. A calcified plaque was defined as having ≥130 HU, whereas a non-calcified plaque had <130 HU. CAS was defined as the presence of any atherosclerotic plaque component (calcified or/and non-calcified) in one or more coronary artery. Coronary atherosclerotic lesions were classified by the maximal luminal diameter stenosis. Critical coronary plaque was defined as lesions causing >50% luminal narrowing, while non-critical coronary plaque was defined as lesions causing ≤50% luminal narrowing. The extent of CAS was calculated as the sum of the affected coronary artery.
Statistical analysis
All data were expressed as n (%), mean with standard deviation (SD) or median with lower and upper ends of the interquartile range (IQR) in both groups. For a univariate analysis, continuous variables were compared using independent sample t-tests or Wilcoxon rank sum tests. Categorical variables were compared using the χ2 test. For a multivariate analysis, the relation of DR to clinical and laboratory characteristics was examined in binary logistic regression using the indicator of DR presence as the dependent variable. Then, using traditional risk factors for CAD as covariates, each of the characteristics as dependent variables separately and the indicator of DR presence as independent variable, multivariate general linear model and multinomial logistic regression were conducted with the outcomes reported as adjusted mean differences (AMDs), along with 95% confidence intervals (CIs), for continuous dependent variables and as odds ratios (ORs), along with 95% CIs, for dichotomous dependent variables. Covariates included age, gender, DM duration, glycaemia levels, BP, plasma lipid profile, albuminuria, renal function and current smoking. Statistical analyses were performed using SPSS software package (version 10.0; SPSS Inc., Chicago, IL, USA). A two-tailed p < 0.05 was considered statistically significant.
Results
Acute coronary syndrome (ACS) was revealed in 37 of 120 patients with T2DM without DR (30.8%), while in 77 of 118 patients with DR (65.3%) (47.9% among entire patients). Suspected or documented CAD was found in 19 of 120 patients without DR (15.8%), while in 27 of 118 patients with DR (22.9%) (19.3% among overall patients). Previous MI was also found in 4 of 120 without DR (3.3%), while in 12 of 118 with DR (10.2%), in this study.
Characteristics of the study participants
In the univariate analysis, a comparison of the clinical and laboratory characteristics between both the patient groups was performed and shown in Table 1. Diabetic persons with DR had a significantly higher prevalence of ACS; a higher proportion of history of previous MI; a higher percentage of albuminuria; higher SBP, DBP and MAP values and higher UAER values than those without DR. The proportion of patients with BP in control and the eGFR values were significantly lower in those with DR than in those without. There were no significant differences with regard to family history of DM, hypertension, HbA1C and LDL-C in control, medication, BMI, HbA1C values and lipid profile (TC, TG, HDL-C and LDL-C levels) between the two patient groups.
Clinical characteristics of participants in 64-slice MDCT scan study by DR assignment.
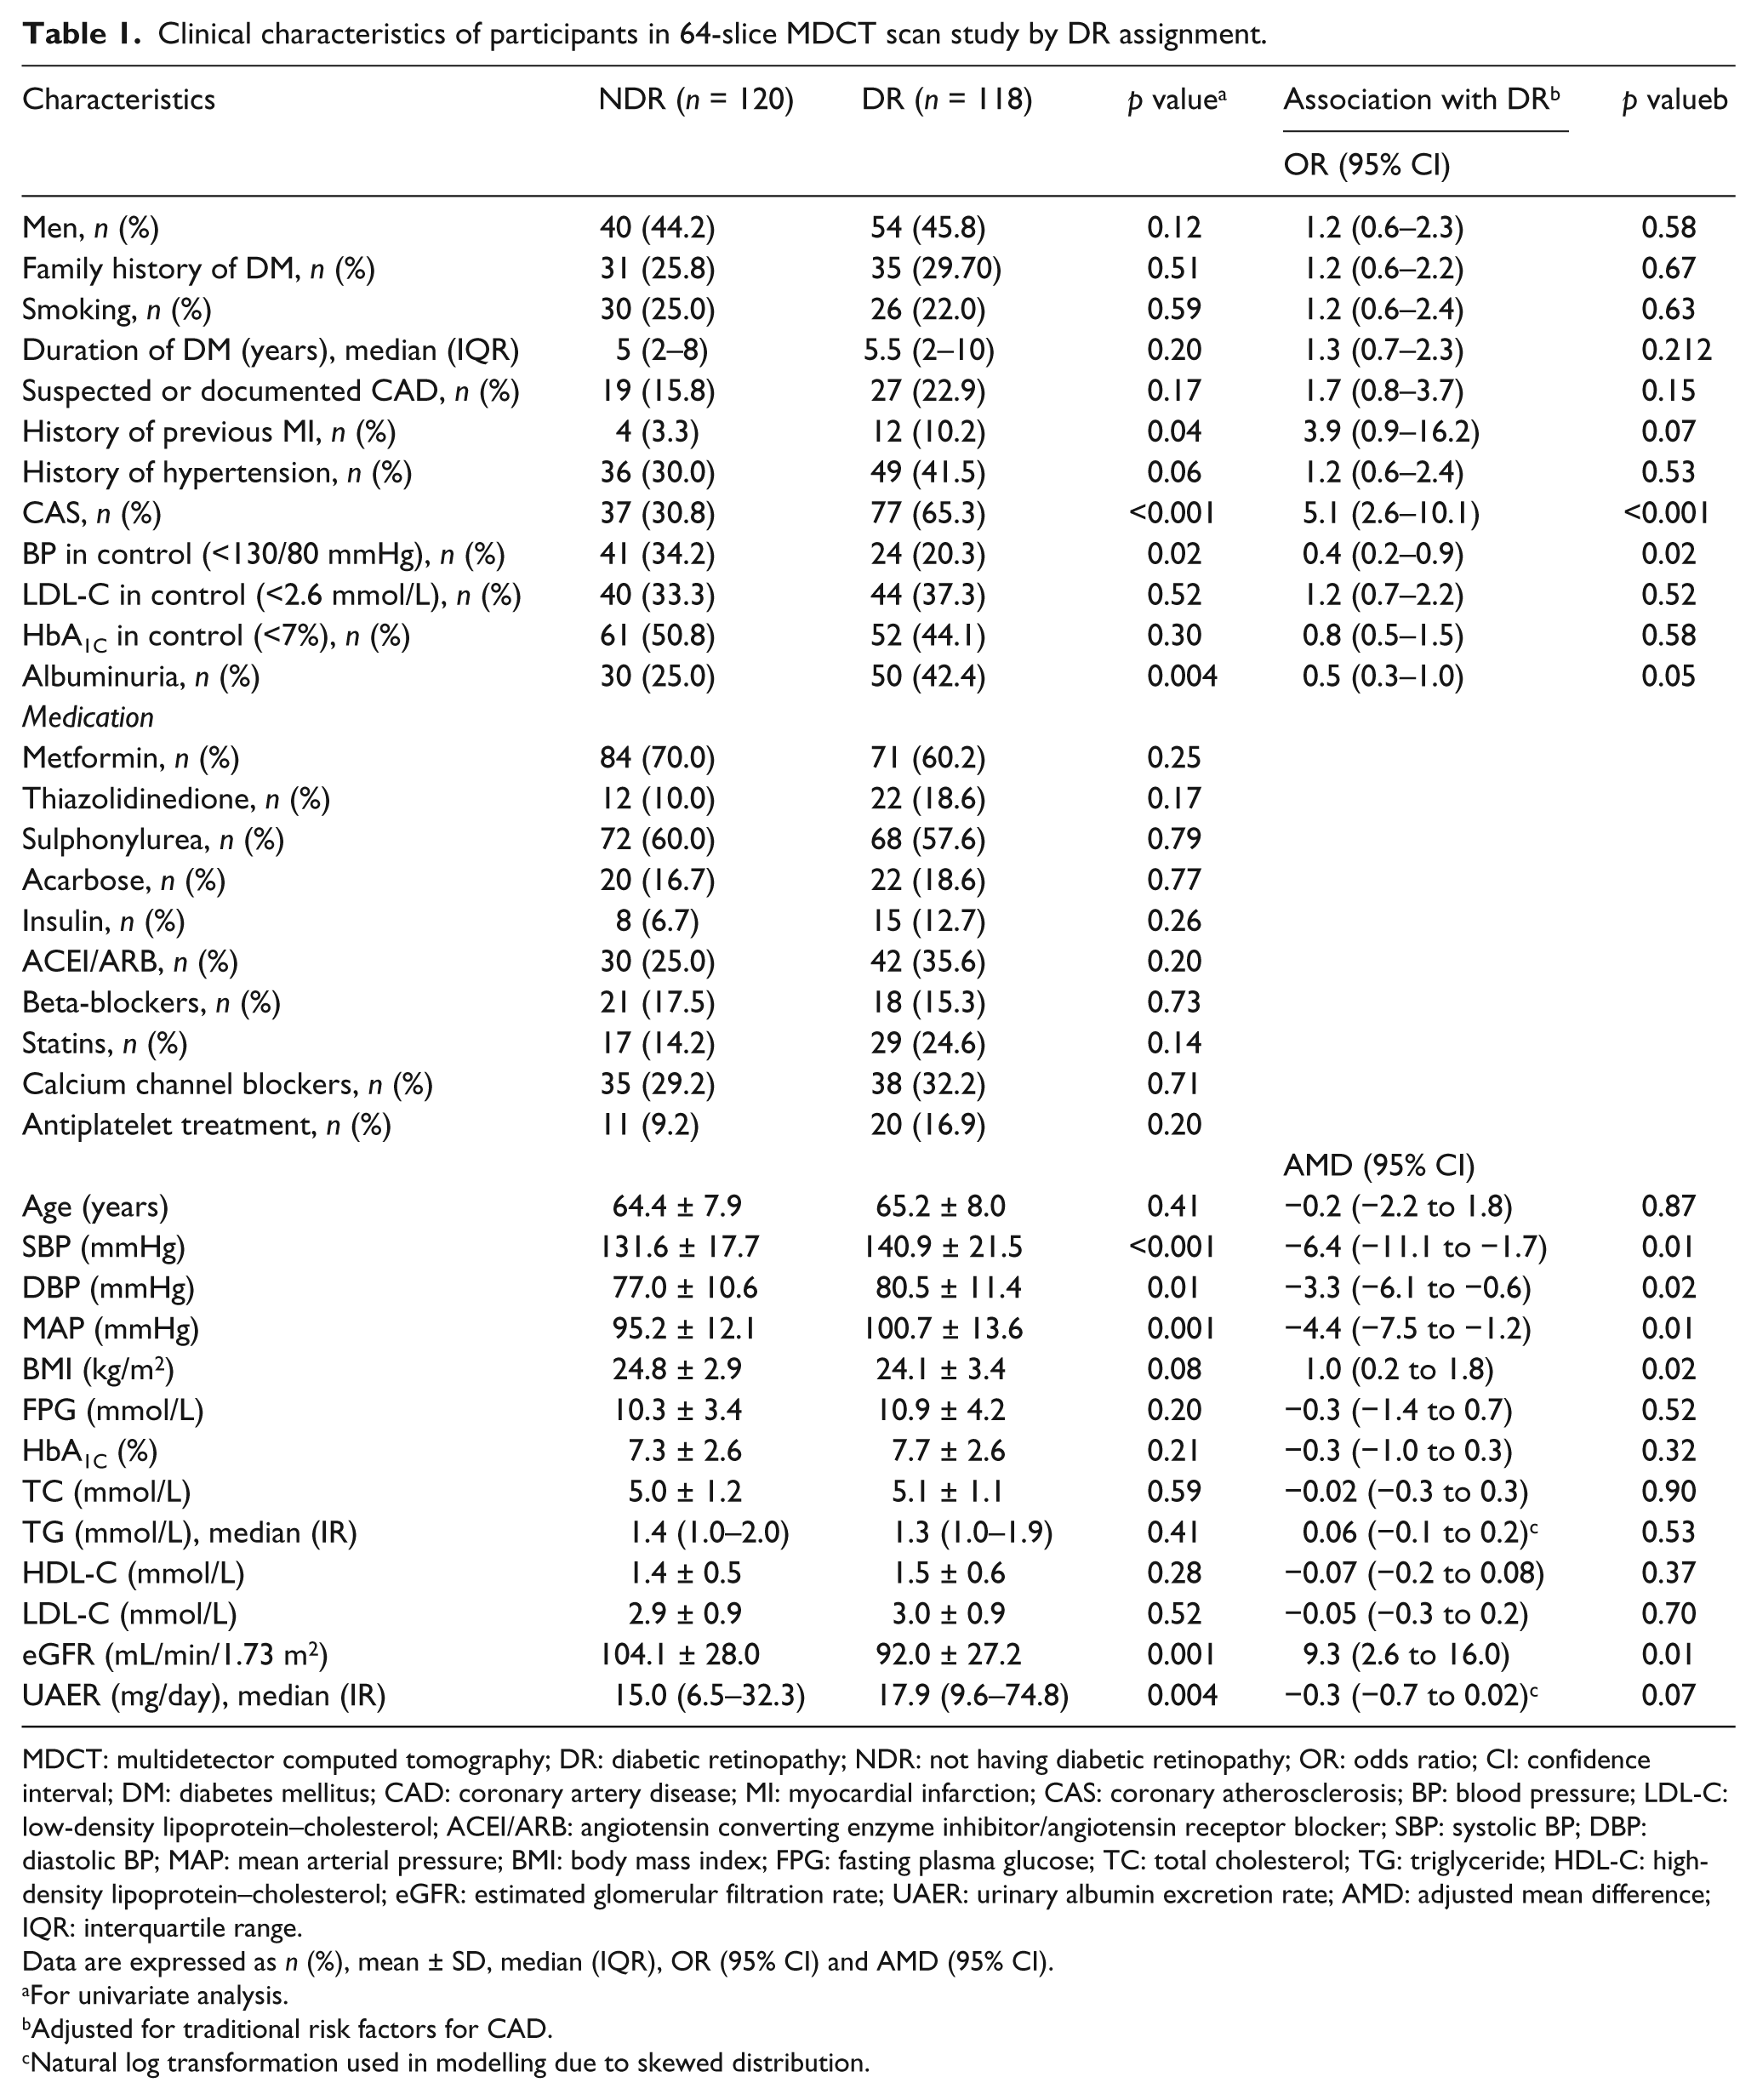
MDCT: multidetector computed tomography; DR: diabetic retinopathy; NDR: not having diabetic retinopathy; OR: odds ratio; CI: confidence interval; DM: diabetes mellitus; CAD: coronary artery disease; MI: myocardial infarction; CAS: coronary atherosclerosis; BP: blood pressure; LDL-C: low-density lipoprotein–cholesterol; ACEI/ARB: angiotensin converting enzyme inhibitor/angiotensin receptor blocker; SBP: systolic BP; DBP: diastolic BP; MAP: mean arterial pressure; BMI: body mass index; FPG: fasting plasma glucose; TC: total cholesterol; TG: triglyceride; HDL-C: high-density lipoprotein–cholesterol; eGFR: estimated glomerular filtration rate; UAER: urinary albumin excretion rate; AMD: adjusted mean difference; IQR: interquartile range.
Data are expressed as n (%), mean ± SD, median (IQR), OR (95% CI) and AMD (95% CI).
For univariate analysis.
Adjusted for traditional risk factors for CAD.
Natural log transformation used in modelling due to skewed distribution.
Association of DR with ACS and risk factors
In the binary logistic regression analysis using the DR presence as the dependent variable, a number of risk factors related to DR could be identified. It was found that SBP, BMI, ACS, history of previous MI and UAER were significantly associated with DR (Table 2). Further multivariate analysis showed that, besides SBP, DBP, MAP, BP in control, BMI and eGFR, ACS was strongly associated with DR after adjustment for covariates (Table 1).
Logistic regression analysis using diabetic retinopathy as a dependent variable.
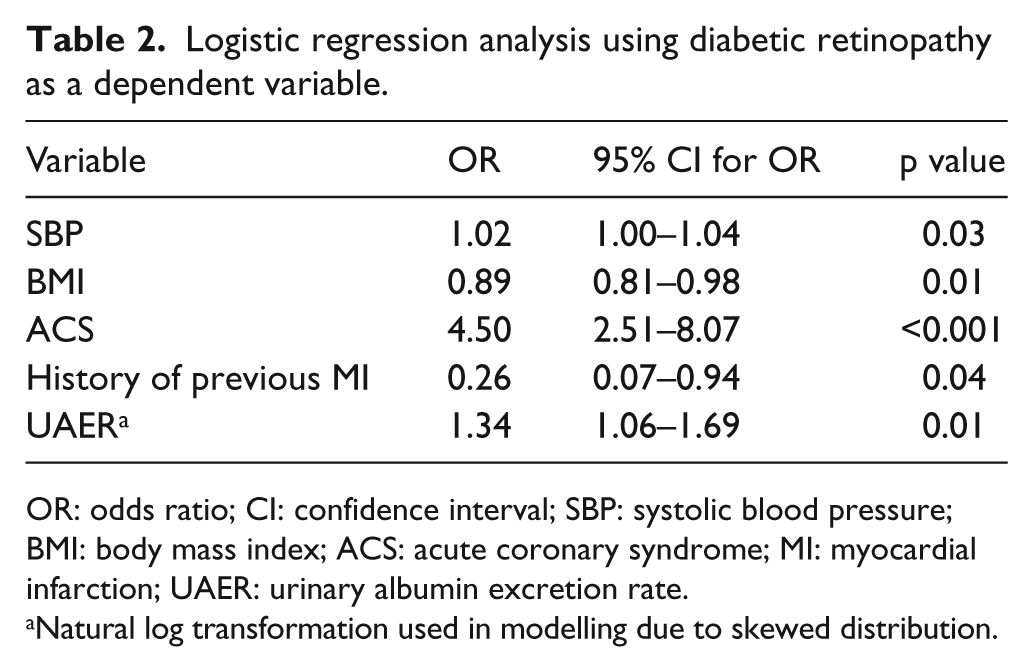
OR: odds ratio; CI: confidence interval; SBP: systolic blood pressure; BMI: body mass index; ACS: acute coronary syndrome; MI: myocardial infarction; UAER: urinary albumin excretion rate.
Natural log transformation used in modelling due to skewed distribution.
Correlation of the DR severity and the ACS extent
Figure 1 shows the distribution of vessels with CAS, including the prevalence of CAS by patient group in the presence and severity of DR when the number of affected coronary artery segment was 0, 1, 2, 3 and 4 in each individual. The analysis showed significant differences in the prevalence of CAS by the number of CAS vessels among NDR group, pre-PDR group and PDR group (p < 0.001). Figure 2 shows the overall prevalences for CAS, the prevalences of CAS ≥ 3 vessels involved by plaque and proportions of vessels with significant coronary plaque and of involved vessels in all detected coronary arteries within each patient group. The prevalences and proportions were significantly increased with the presence and severity of DR (NDR vs. pre-PDR, pre-PDR vs. PDR; p < 0.01 for each).
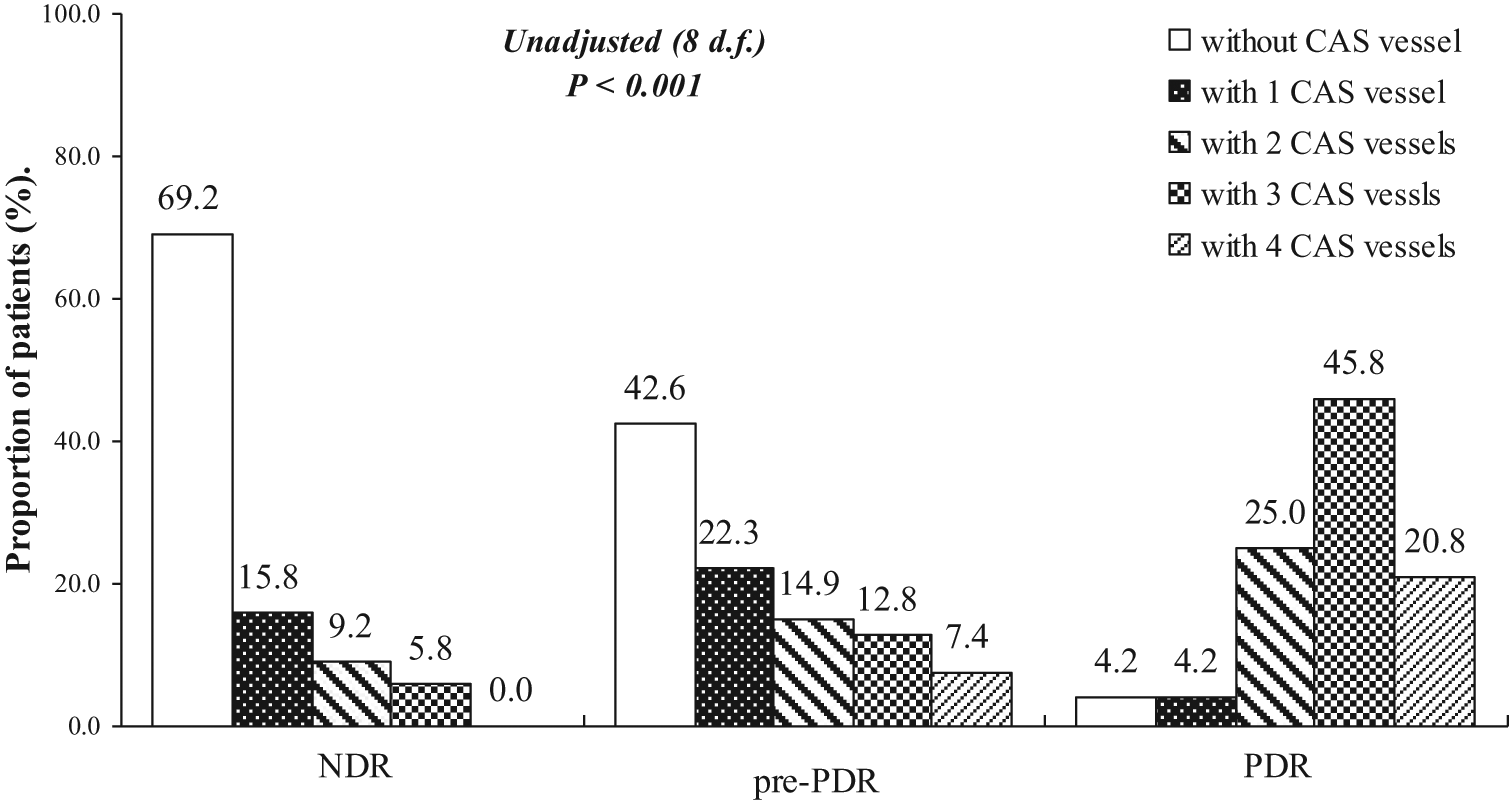
Distribution of CAS vessels by the presence and severity of DR.
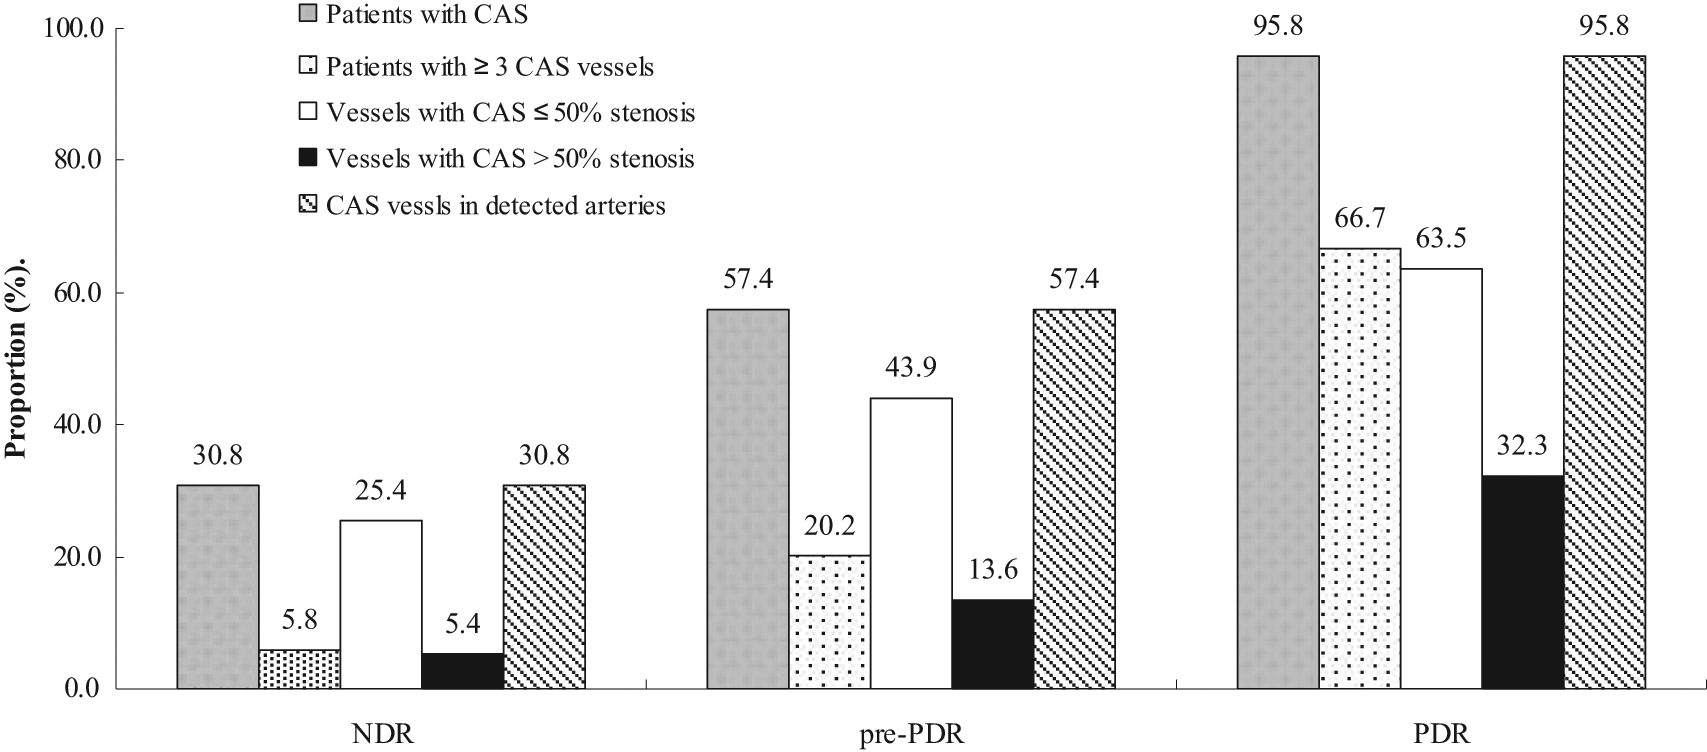
Prevalence of CAS and CAS with more than three involved vessels and proportion of involved vessels with >50% luminal stenosis and total involved vessels in all detected coronary arteries within each patient group.
Discussion
This study conducted in a study sample of patients with T2DM recruited from the inpatients with median diabetes duration of 5.0 years showed that the prevalence of CAS, detected by coronary 64-slice MDCTA, is significantly higher in the patients with T2DM with DR compared with those without DR. In addition to high BP, obesity and renal dysfunction, CAS is also independently associated with DR in patients with T2DM as the relation is still statistically significant after adjustment for those traditional risk factors for CAD. Besides the relationship between the developments of DR and CAS, the progression of DR is also associated with severity and extent of CAS.
Because the results of hitherto existing studies on this issue are based on the diagnosed CAD or silent myocardial ischaemia as evidenced by non-invasive test, including the electrocardiogram stress test, myocardial scintigraphy or stress echocardiography or invasive tests such as selective CAG, DR independently associated with CAD is recognized as an indicator of risk for CAD in diabetic patients,17–20 and it is predictive of cardiovascular mortality.21,22 To the best of our knowledge, our study is the first one in the literature evaluating the relationship between DR and subclinical CAS, including non-calcified and calcified coronary plaques shown as a whole by MDCT CAG in T2DM, regardless of the presence of CAD. In some prior studies, the evaluation of luminal narrowing as well as early morphologic changes at the coronary artery wall, which can be documented by MDCT, and a high rate of agreement between MDCT and CAG have been confirmed.23–26 In an observational study, Sassa et al. 27 reported that 41%, 47.5% and 19.7% of T2DM patients had significant coronary stenosis (≥50% luminal narrowing), calcified plaque and soft plaque, respectively, identified by MDCT. Similarly, our results showed that proportion of vessels with significant coronary plaque (>50% luminal narrowing) and the prevalence of CAS were 11.3% and 47.9%, respectively. The differences in results between studies may be attributable to the study methods. The association found between DR and CAS in this study is similar to the association discovered in the previous studies,6,28 but not consistent with data from a recent study. 8 A previous study about association of DR with CAD demonstrated that the mean coronary artery calcium (CAC) score, a quantitative marker of CAS burden, measured by electron beam CT and multidetector CT, was significantly greater in T1DM patients with DR than in those without DR. 28 This study was only limited to T1DM and had no evaluation of non-calcified coronary plaques, an early and basic pathologic change of CAD, which have been suggested to be associated with ACS compared to calcified plaques when detected by multislice computed tomography (MSCT).29,30 In another study among patients with T2DM with suspected CAD, those with DR had more diffuse and severe CAS determined by selective coronary cineangiography. 6 Although the conventional CAG is the gold standard of the diagnosis of CAD, the early atherosclerosis at the coronary artery wall could not be shown by this invasive CAG. The results from a recent study about the asymptomatic coronary heart disease (CHD) in DM patients failed to show the association of DR with disease vessels ≥50% diameter stenosis and CAC scores detected by CAG and MDCT after stress single-photon emission computed tomography (SPECT) examination. 8 In this study, patients with T2DM without suggestive symptoms of CHD were enrolled, but those with known or suspected CHD were excluded, and the inclusion criteria of DR only included PDR or after photocoagulation, which could lead to bias of the correlation between DR and CHD. In a case–control study examining the relationship between DR and subclinical atherosclerosis due to carotid intima–media thickness (IMT) by Visona et al.,31,32 a higher frequency of increased IMT in the common carotid artery and atherosclerosis lesions of carotid bifurcation was found in T2DM patients with DR compared with those without DR, supporting the hypothesis that DR is associated with early vascular injury and atherosclerosis. Therefore, our results are compatible with the association of DR with the atherosclerosis process and may be an important finding when the incidence and progression of DR were associated with the extent of CAS as well as the process from the presence of CAS to CAD events.
More importantly, our data demonstrated that the association of DR with CAS was still significantly present after adjustment for traditional risk factors for CAD, especially SBP, BMI and UAER. These results are suggestive that the relationship between DR and CAS may be more an independent association rather than a reflection of those shared and confounding factors. Our demonstration of the independent association of DR with subclinical CAS as an early sign of CAD extends the interpretation that both DR and CAD were likely to share other common risk factors and pathophysiological backgrounds beyond those related to the traditional risk factors.18,21,33 Besides common genetic linkages of DR with systemic vascular complications, 19 there are strong evidences that the activation of renin–angiotensin system (RAS),34,35 the formation and accumulation of advanced glycation end products (AGEs),36,37 increased oxidative stress, 37 platelet dysfunction, 38 dyslipidaemia 39 and inflammation 40 have been implicated in the pathogenesis of CAD and specifically CAS and DR. However, it is not known whether these mechanisms reflect some shared common pathways or independent elements in the development of both DR and CAD. Numerous epidemiological and clinical studies are necessary, though promising studies have shown that inhibition of some of these mechanisms eventually translates into a reduction in the incidence of DR as well as CAD events.34,35,38 Furthermore, we cannot exclude the fact that other unknown and unmeasured risk factors beyond diabetic hyperglycaemia and genetic susceptibility are present. We did not observe any relation of DR and CAS to other risk factors such as HbA1C levels and plasma lipid profile.
The study had several limitations. First, these findings were derived from a single centre and limited to a specific geographical area and cannot readily extrapolated to other population. 41 Thus, large-scale studies at multiple centres throughout the world will be necessary to confirm these results, which may have a large influence on diabetic management and even diagnosis. Second, only a 24-h urine sample was used to determine albuminuria. Unfortunately, in this study no data on the reproducibility of the UAER measurement were available. The high variability of UAER measurement is well recognized. Third, despite global features of the plaque architecture including calcification or/and non-calcification, detected by MDCT, involved in our analysis of CAS, the evaluation of only four vessels of all coronary arteries may result in an underestimation of the CAS extent. However, even so, the relation between CAS and DR was significant. Fourth, there could be bias in the relation of DR to MI due to a small sample size. It could be corrected if more diabetic patients with a history of previous MI were enrolled. Finally, with regard to grading stenosis, MDCT accuracy is far below that of CAG, a gold standard for the detection of CAD. However, previous studies have shown that it is of great value to screening the subclinical CAS.23–27 Therefore, the MDCTA findings must be cautiously interpreted in our study.
In summary, DR is associated with CAS, independent of the traditional risk factors for CAD in our sample. Additionally, the incidence and progression of DR are also associated with severity and extent of CAS. Thus, the relationship of DR with CAS is relatively continuous and graded under the T2DM status. Because early aggressive risk modification may be beneficial in this subset of patients, further follow-up studies are needed to clarify the risk factors shared by both and the potentially pathophysiological mechanisms underlying the association between them.
Footnotes
Acknowledgements
The authors thank Xue-Mei Gan, an experienced ophthalmologist from Ophthalmology Department of Daping Hospital, and Jin-Hua Chen and Kun-Ning Xiong, two experienced radiologists from Department of Radiology of the Hospital, who volunteered to take part in this study, for assistance with examination and estimation of diabetic retinopathy and coronary atherosclerosis.
Funding
This research received no specific grant from any funding agency in the public, commercial or not-for-profit sectors.
Conflict of interest
All authors have no potential conflict of interest regarding this work.