
Abstract
Objective:
The aim of this study is to investigate the association between glucagon-to-insulin ratio and the presence of nonalcoholic fatty liver disease on ultrasonography in participants with type 2 diabetes mellitus.
Research design and methods:
This cross-sectional study was performed with data obtained from 172 participants with type 2 diabetes mellitus admitted to a University hospital of Korea. Participants were assessed for serum fasting and postprandial serum glucagon-to-insulin ratio and divided into tertiles. Nonalcoholic fatty liver disease was defined as ultrasonographically detected fatty liver.
Results:
Prevalence of nonalcoholic fatty liver disease was significantly decreased across tertile of fasting and postprandial glucagon-to-insulin ratio (p = 0.009 for trend, p = 0.001 for trend, respectively). Lower glucagon-to-insulin ratio was significantly associated with the presence of nonalcoholic fatty liver disease even after adjustment for potential confounding variables [fasting glucagon-to-insulin ratio: odds ratio (95% confidence interval), 2.68 (1.08–6.86)], postprandial glucagon-to-insulin ratio: [2.72 (1.03–7.35)]. The participants in the lowest tertile of fasting glucagon-to-insulin ratio had higher body mass index, visceral fat thickness, subcutaneous fat thickness, homeostasis model assessment–insulin resistance and shorter duration of diabetes mellitus.
Conclusion:
This study suggests that lower glucagon relative insulin may be independently associated with nonalcoholic fatty liver disease in participants with type 2 diabetes.
Keywords
Introduction
The pathophysiology of type 2 diabetes mellitus (T2DM) is characterized not only by insulin resistance and β-cell dysfunction but also by relative or absolute hyperglucagonaemia. 1 Recently, the role of glucagon has received much attention as an important additional contributor of glucose control and treatment target of antidiabetic agent.2,3 Addressing glucagon seems an attractive treatment for T2DM either by suppression of glucagon or by blocking glucagon receptor. 4
In addition to its effects on glucose metabolism, glucagon is known to exert effects on lipid metabolism. 5 Glucagon action was shown to be essential for multiple pathways regulating lipid homeostasis and leading to reduced lipogenesis. 6 Reduced glucagon action is associated with the development of fatty liver, and exogenous glucagon administration reduces fatty liver in human and animal studies.7–9 On the contrary, some experimental diabetes settings revealed that attenuation of glucagon action using glucagon receptor knockout mice was associated with reduction in hepatic steatosis. 10
Nonalcoholic fatty liver disease (NAFLD) is the most common cause of chronic liver disease and is increasingly diagnosed worldwide. 11 Those with T2DM appear to have an increased risk of developing NAFLD and have a poor hepatic prognosis compared with individuals without T2DM.12,13 It is well acknowledged that T2DM and NAFLD share a common pathogenic mechanism of insulin resistance.14,15 On the other hand, some studies have proposed a role of glucagon in NAFLD independent of insulin resistance (IR), but evidence was usually from preclinical or animal studies. 16
Since glucagon secretion is highly affected by insulin, and the disproportionate changes of the two hormones are clearly revealed, it might make sense to consider glucagon relative to insulin as a glucagon-to-insulin ratio (GI ratio) instead of assessing each absolute value separately.1–3,17 Previous studies have demonstrated that an increase in glucagon concentration and GI ratio reflects hyperglycaemia and degree of glycaemic control in individuals with T2DM.18–21 Other studies have revealed a role of GI ratio in pancreatic cancer-related diabetes mellitus (DM).22,23 Although glucagon relative to insulin is receiving much attention recently, there are little data regarding the association between GI ratio and NAFLD independent of insulin resistance in individuals with T2DM. There is a possibility that liver lipid infiltration in T2DM could be associated with low glucagon relative to insulin because it may be led by glucagon action reducing lipogenesis. Therefore, the aim of this study is to investigate the hypothesis that lower GI ratio is associated with the presence of NAFLD.
Methods
Study design and subjects
Among 230 participants with T2DM who were admitted for glucose control to the Endocrinology Division of Soonchunhyang University Bucheon Hospital from April 2015 to June 2017, participants were eligible if they had no history or clinical evidence of chronic liver disease or cirrhosis, no positive test for hepatitis B or hepatitis C, no medication associated with hepatotoxicity and no history of alcohol consumption. ‘No history of alcohol consumption’ was defined as less than 30 g alcohol/day for men and less than 20 g alcohol/day for women.24,25 In addition, participants with type 1 diabetes, those older than 80 years of age, those with inflammatory bowel disease or gut resection except appendectomy, those lacking fasting glucagon and insulin data and those lacking liver ultrasonography (US) data were excluded. Finally, 172 participants were included for analysis in this cross-sectional study. In total, 12 of the 172 participants were lacking postprandial glucagon data. We reviewed detailed demographic, biochemical and clinical data and treatment history using medical records. The smoking status of the subjects was classified as non-smoker or current smoker. All participants were informed of the purpose of the study, and their consent was obtained. The study was approved by the Institute Review Board of Soonchunhyang University School of Medicine, Bucheon Hospital.
Anthropometric and biochemical measurements
Height and weight were measured to the nearest 0.1 cm and 0.1 kg, respectively. Body mass index (BMI) was calculated as body weight (kg) divided by height squared (square metres). Blood samples were collected after overnight fasting. HbA1c was measured by ion exchange high-performance liquid chromatography (Bio-Rad, Hercules, CA, USA). The methodology was aligned with the Diabetes Control and Complications Trial and National Glycohemoglobin Standardization Program standards. 26 Aspartate aminotransferase (AST), alanine aminotransferase (ALT), total cholesterol (TC), low-density lipoprotein cholesterol (LDL-C) and triglyceride (TG) were determined using the liquid enzymatic method with an automatic biochemical analyzer (7600-110; Hitachi Inc., Tokyo, Japan) and high-density lipoprotein cholesterol (HDL-C) was measured by the selective inhibition method. Estimated glomerular filtration rate (eGFR) was calculated by the Modification of Diet in Renal Disease (MDRD) study equation.
Participants underwent a meal test with measurements of plasma glucose, insulin and glucagon concentrations at 0 and 30 min. Serum insulin was measured using an immunoradiometric assay kit (DIAsource, Belgium). Fasting and postprandial samples for plasma glucagon were collected and analyzed using a radioimmunoassay kit (MP Biomedical, CA, USA).
The insulin resistance (IR) status was evaluated by the homeostasis model assessment–insulin resistance (HOMA-IR) index. The HOMA-IR was calculated by the following formula: [fasting insulin (µIU/mL) × fasting plasma glucose (mmol/L)]/22.5.
Evaluation of fatty liver by US
Liver US was carried out by experienced radiologists. The diagnosis of hepatic steatosis was made on the basis of characteristic sonographic features: that is, diffuse hyperechogenicity of the liver; increased liver contrast compared to kidney; vascular blurring, mainly of portal veins and attenuation of echogenic level in a deep seated area. 25
Sonographic measurement of abdominal fat thickness was performed using high-resolution B-mode US by a single experienced investigator.27,28 Subcutaneous fat thickness (SFT) and visceral fat thickness (VFT) were measured in the region 1 cm above the umbilicus using a 12-MHz linear-array probe and a 3.5-MHz convex-array probe, respectively. SFT was defined as the maximal thickness of the fat tissue layer between the skin-fat interface and the linea alba. VFT was defined as the distance between the anterior wall of the aorta and the posterior aspect of the rectus abdominis muscle perpendicular to the aorta. The intra-observer technical error of measurement was 1.4%–2.3% for VFT and 1.1%–1.7% for SFT.
Statistical analysis
Data are reported as mean ± standard deviation (SD) for continuous variables or as number of participants (percentage) for categorical variables. Differences in demographic and clinical characteristics according to the tertile of GI ratio were evaluated by one-way analysis of variance (ANOVA) or Kruskal–Wallis test for continuous variables and chi-square test for categorical variables. To evaluate the linear trend of the prevalence of NAFLD according to GI ratio tertile, p values were calculated by Jonckheere–Terpstra linear trend test for continuous variables and Mantel–Haenszel’s linear-by-linear association test for categorical variables.
The correlations of serum GI ratio and other clinical variables were assessed by Spearman’s rank correlation coefficient. The odds ratio (OR) was used as a measure of the association between serum GI ratio and the presence of NAFLD in multivariate logistic regression analysis. To compute ORs of serum GI ratio, several models were set up and adjusted for potential confounders determined through the result of the group comparison and the assessment of multicollinearity by generalized variance inflation factor (GVIF).
A two-tailed p value less than 0.05 was considered statistically significant. All statistical analyses were performed using SPSS (version 14.0; SPSS, Inc., Chicago, IL) and R (version 3.1.3, The R Foundation for Statistical Computing, Vienna, Austria).
Results
Clinical characteristics of participants according to GI ratio
The general characteristics of the study population are presented in Table 1. There was no significant difference by sex. The mean age of the study subjects was 57 years, and the mean duration of DM was 7.5 years. Among all of the participants, 87 (51%) had been diagnosed with NAFLD.
The clinical characteristics and laboratory findings of the study populations.
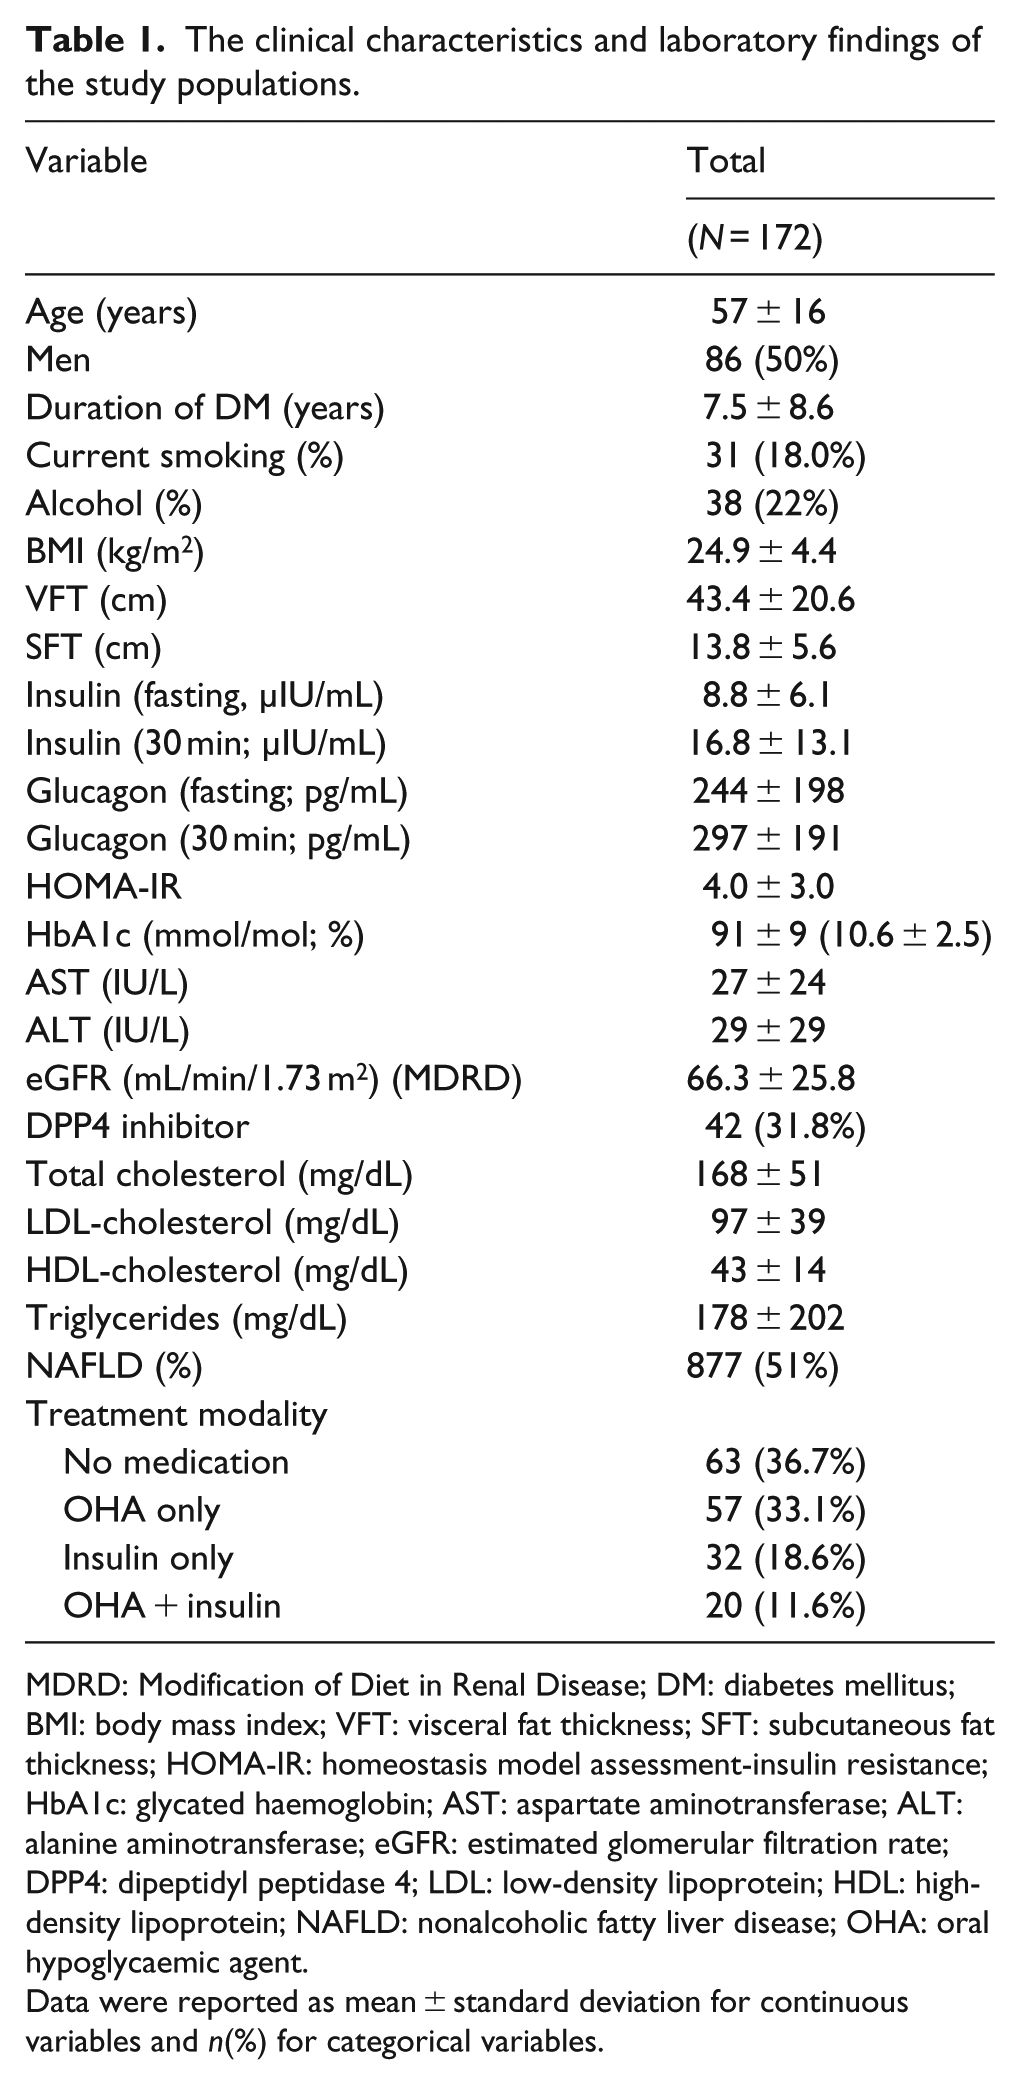
MDRD: Modification of Diet in Renal Disease; DM: diabetes mellitus; BMI: body mass index; VFT: visceral fat thickness; SFT: subcutaneous fat thickness; HOMA-IR: homeostasis model assessment-insulin resistance; HbA1c: glycated haemoglobin; AST: aspartate aminotransferase; ALT: alanine aminotransferase; eGFR: estimated glomerular filtration rate; DPP4: dipeptidyl peptidase 4; LDL: low-density lipoprotein; HDL: high-density lipoprotein; NAFLD: nonalcoholic fatty liver disease; OHA: oral hypoglycaemic agent.
Data were reported as mean ± standard deviation for continuous variables and n(%) for categorical variables.
The participants were divided into three groups according to GI ratio. The clinical parameters according to fasting GI ratio tertile and postprandial GI ratio tertile are shown in Tables 2 and 3, respectively. The mean levels of BMI, VFT, SFT, HOMA-IR and eGFR were significantly decreased with increasing tertiles, and duration of DM and fasting and postprandial glucagon was significantly increased across fasting GI ratio tertiles (p = 0.002, p = 0.006, p < 0.001, p < 0.001, p = 0.039, p = 0.036, p < 0.001 and p < 0.001, respectively; Table 2). The prevalence of fatty liver was significantly decreased across GI ratio tertiles (p = 0.009; Table 2). Dipeptidyl peptidase 4 (DPP4) inhibitor treatment was comparable among the three groups (p = 0.32; Table 2). The mean levels of fasting and postprandial insulin, HbA1c, AST, ALT and lipid profiles were comparable among the groups (Table 2). Similar results were also shown according to postprandial GI ratio tertile except for some clinical variables (Table 3). The mean levels of HbA1c, HDL-C and postprandial glucagon steadily increased and postprandial insulin level gradually decreased across postprandial GI ratio tertiles (p = 0.003, p = 0.029, p < 0.001 and <0.001, respectively). The mean eGFR levels were not different in postprandial GI ratio tertile groups (p = 0.334; Table 3).
The clinical characteristics and laboratory findings according to the tertile of fasting glucagon-to-insulin ratio.
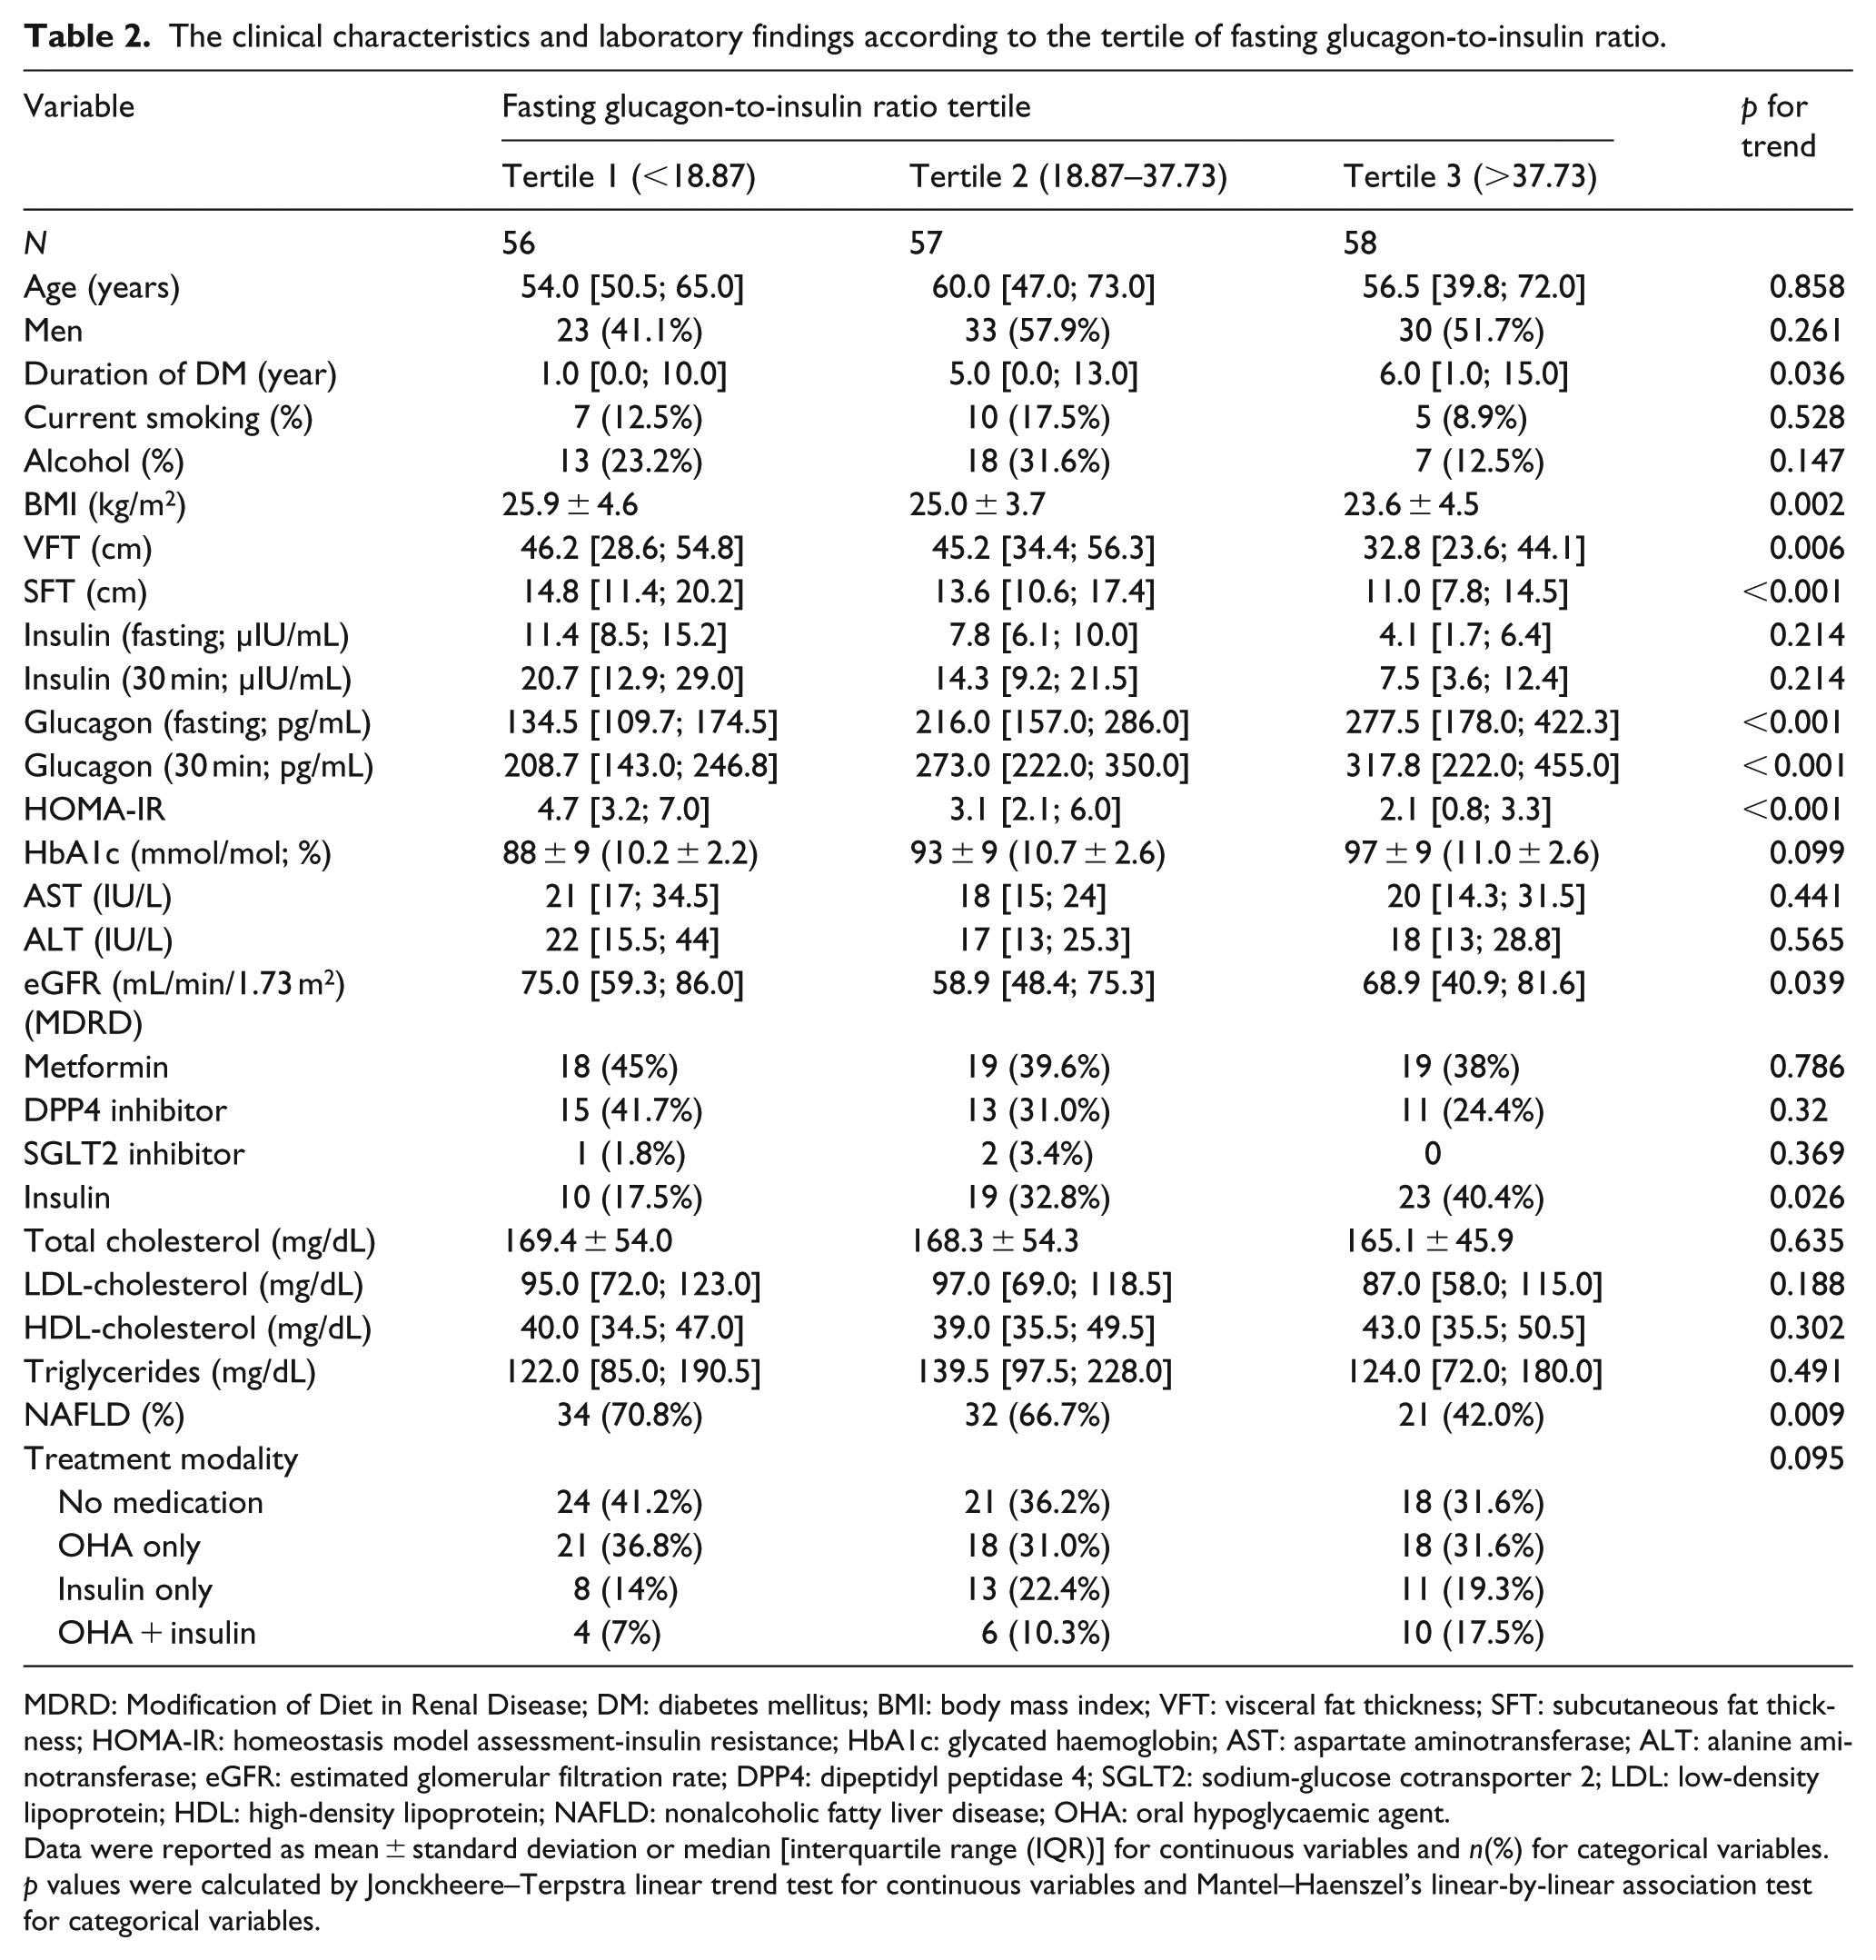
MDRD: Modification of Diet in Renal Disease; DM: diabetes mellitus; BMI: body mass index; VFT: visceral fat thickness; SFT: subcutaneous fat thickness; HOMA-IR: homeostasis model assessment-insulin resistance; HbA1c: glycated haemoglobin; AST: aspartate aminotransferase; ALT: alanine aminotransferase; eGFR: estimated glomerular filtration rate; DPP4: dipeptidyl peptidase 4; SGLT2: sodium-glucose cotransporter 2; LDL: low-density lipoprotein; HDL: high-density lipoprotein; NAFLD: nonalcoholic fatty liver disease; OHA: oral hypoglycaemic agent.
Data were reported as mean ± standard deviation or median [interquartile range (IQR)] for continuous variables and n(%) for categorical variables.
p values were calculated by Jonckheere–Terpstra linear trend test for continuous variables and Mantel–Haenszel’s linear-by-linear association test for categorical variables.
The clinical characteristics and laboratory findings according to the tertile of postprandial glucagon-to-insulin ratio.
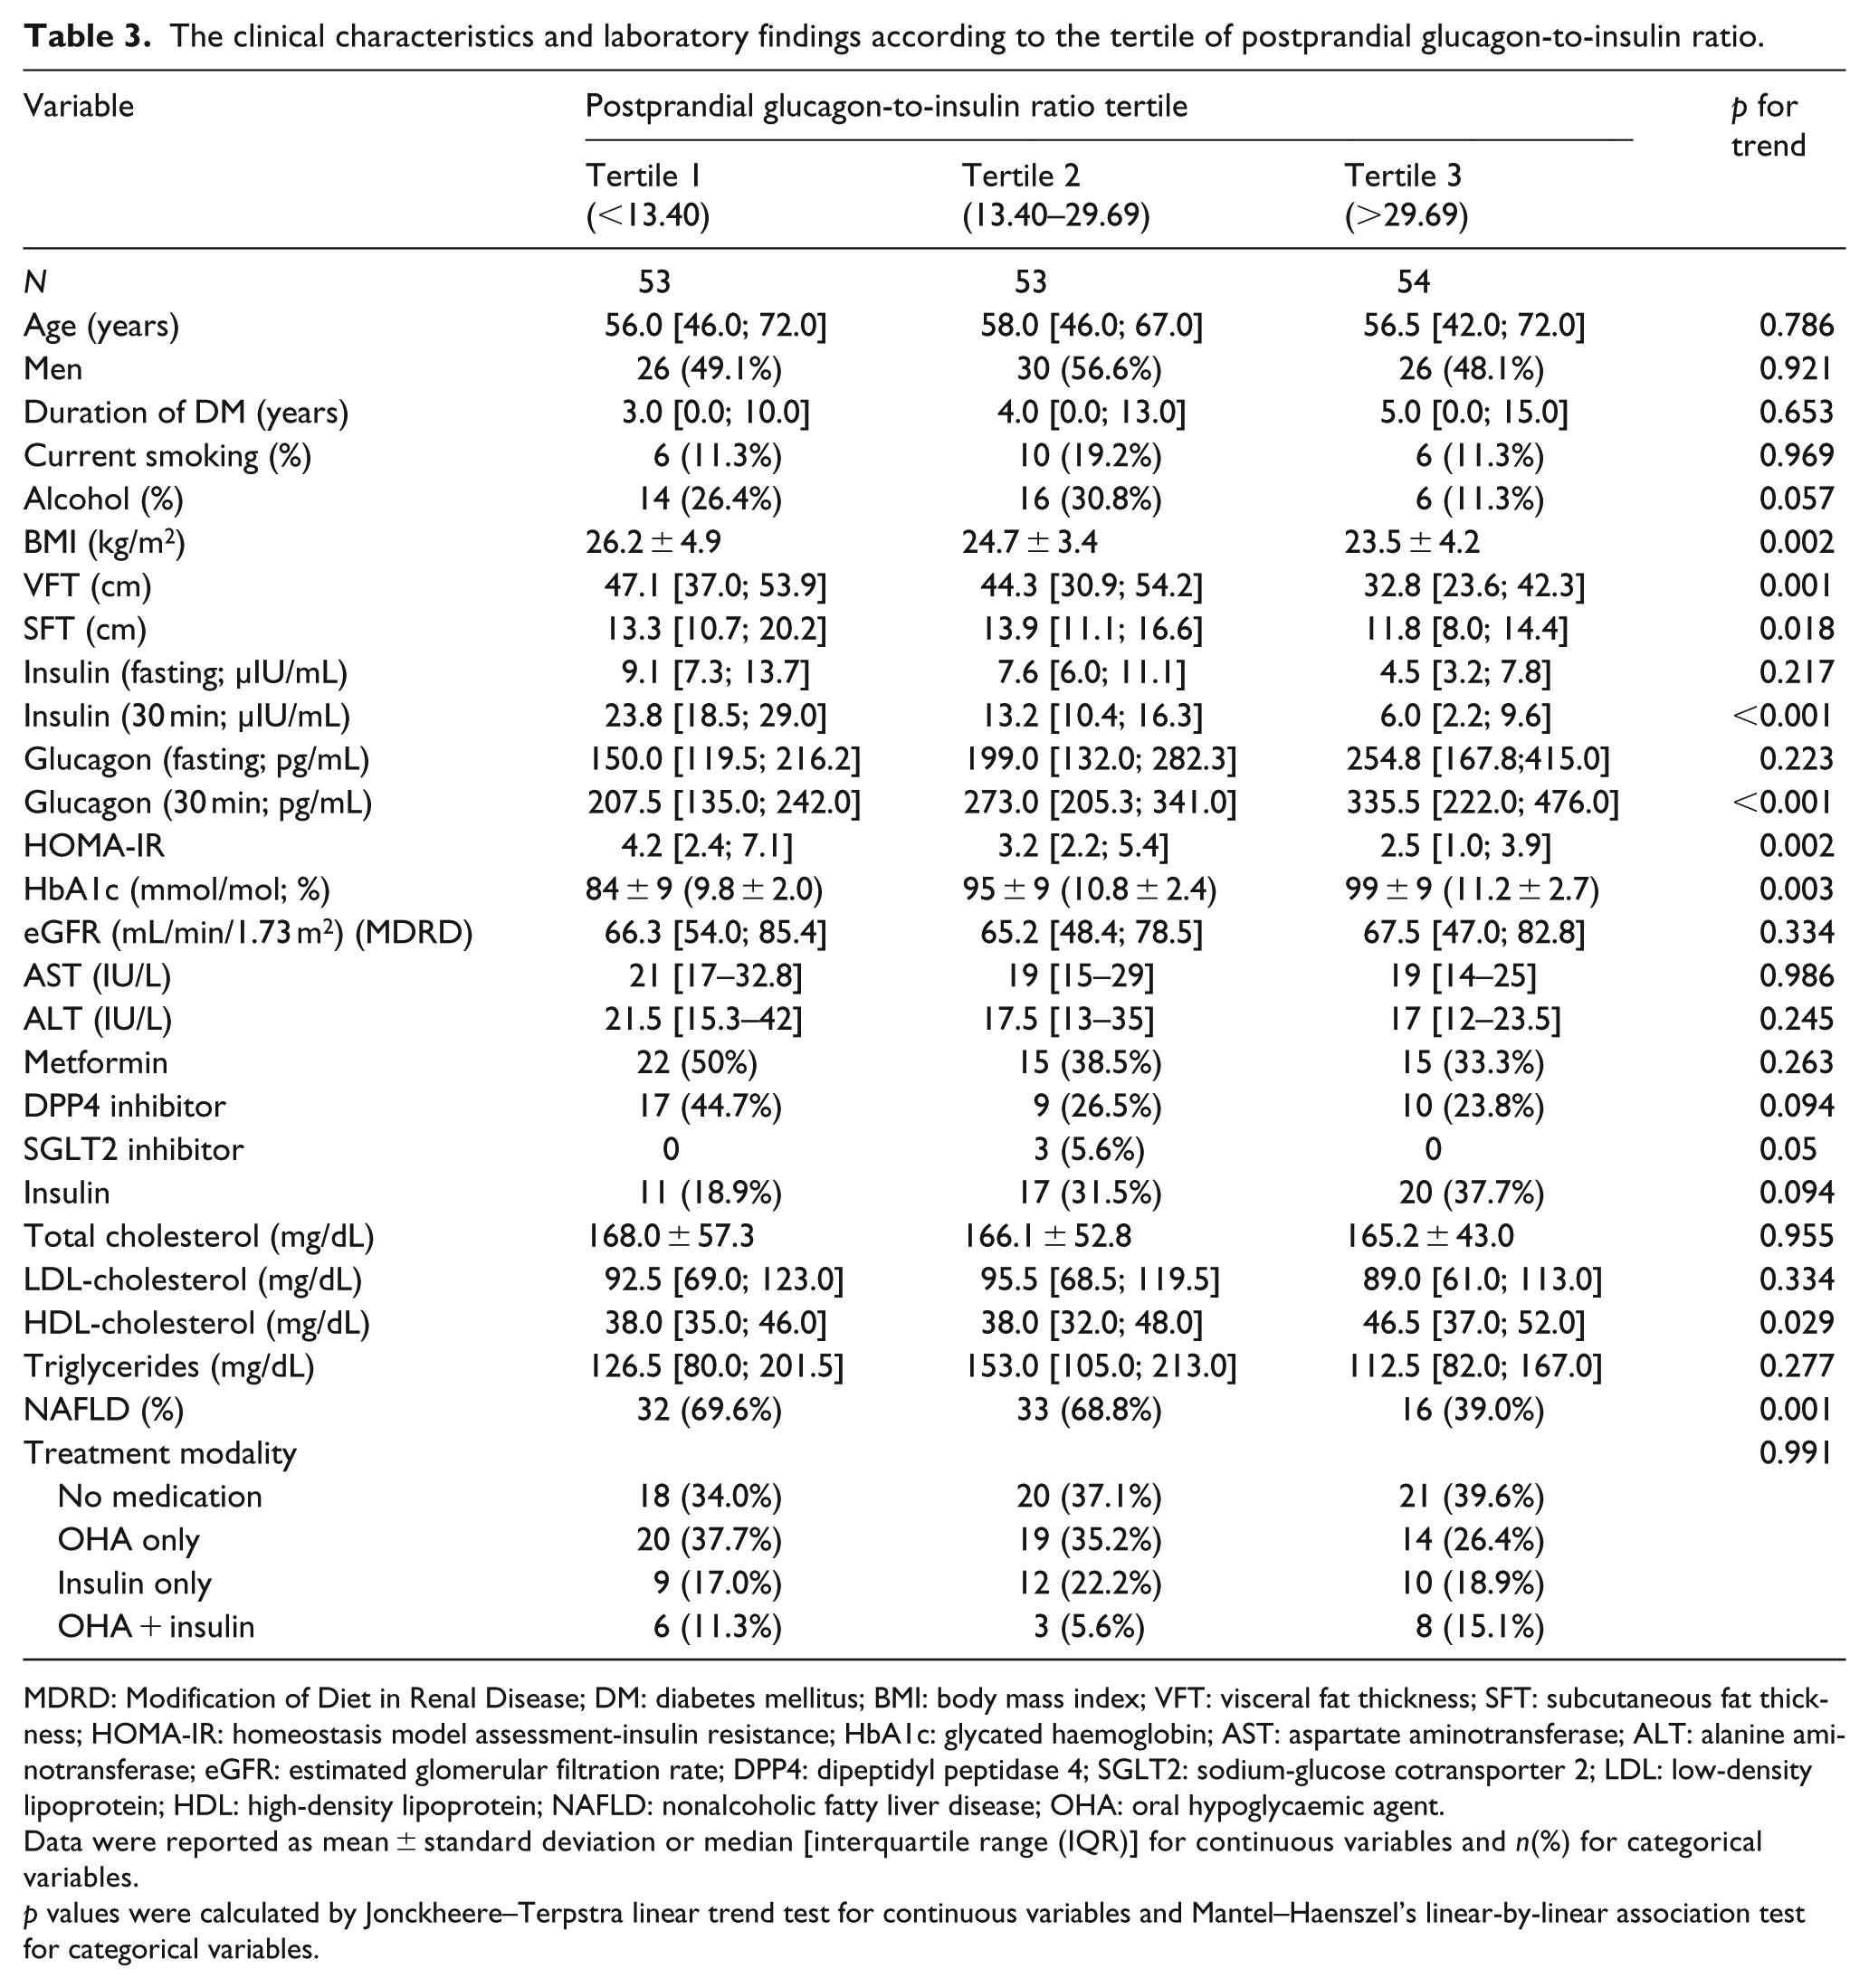
MDRD: Modification of Diet in Renal Disease; DM: diabetes mellitus; BMI: body mass index; VFT: visceral fat thickness; SFT: subcutaneous fat thickness; HOMA-IR: homeostasis model assessment-insulin resistance; HbA1c: glycated haemoglobin; AST: aspartate aminotransferase; ALT: alanine aminotransferase; eGFR: estimated glomerular filtration rate; DPP4: dipeptidyl peptidase 4; SGLT2: sodium-glucose cotransporter 2; LDL: low-density lipoprotein; HDL: high-density lipoprotein; NAFLD: nonalcoholic fatty liver disease; OHA: oral hypoglycaemic agent.
Data were reported as mean ± standard deviation or median [interquartile range (IQR)] for continuous variables and n(%) for categorical variables.
p values were calculated by Jonckheere–Terpstra linear trend test for continuous variables and Mantel–Haenszel’s linear-by-linear association test for categorical variables.
Bivariate correlations of serum GI ratio with clinical variables
The serum fasting and postprandial GI ratios were negatively correlated with BMI (r = –0.29, p < 0.001, r = –0.307, p < 0.001), VFT (r = –0.27, p = 0.001, r = –0.331, p < 0.001), SFT (r = –0.325, p < 0.001, r = –0.231, p = 0.007), fasting and postprandial insulin (r = –0.716, p < 0.001, r = –0.531, p < 0.001, r = –0.46, p < 0.001, r = –0.818, p < 0.001), HOMA-IR (r = –0.56, p < 0.001, r = –0.312, p < 0.001) and ALT (r = –0.164, p = 0.032, r = –0.251, p = 0.001) and positively correlated with fasting and postprandial glucagon (r = 0.538, p < 0.001, r = 393, p < 0.001, r = 0.413, p < 0.001, r = 0.507, p < 0.001; Table 4). Duration of DM was positively correlated with fasting GI ratio but not postprandial GI ratio (r = 158, p = 0.039, r = 0.091, p = 0.253). HbA1c and HDL-C were positively correlated with postprandial GI ratio but not fasting GI ratio (r = 0.167, p = 0.03, r = 0.199, p = 0.012, r = 0.141, p = 0.066, r = 0.124, p = 0.11) and AST was negatively correlated with only postprandial GI ratio (r = –0.208, p = 0.008). No significant correlation was seen between eGFR, TC, LDL-C and TG and fasting or postprandial GI ratio (Table 4).
Correlation of fasting glucagon-to-insulin ratio, postprandial glucagon-to-insulin ratio with other clinical variables.
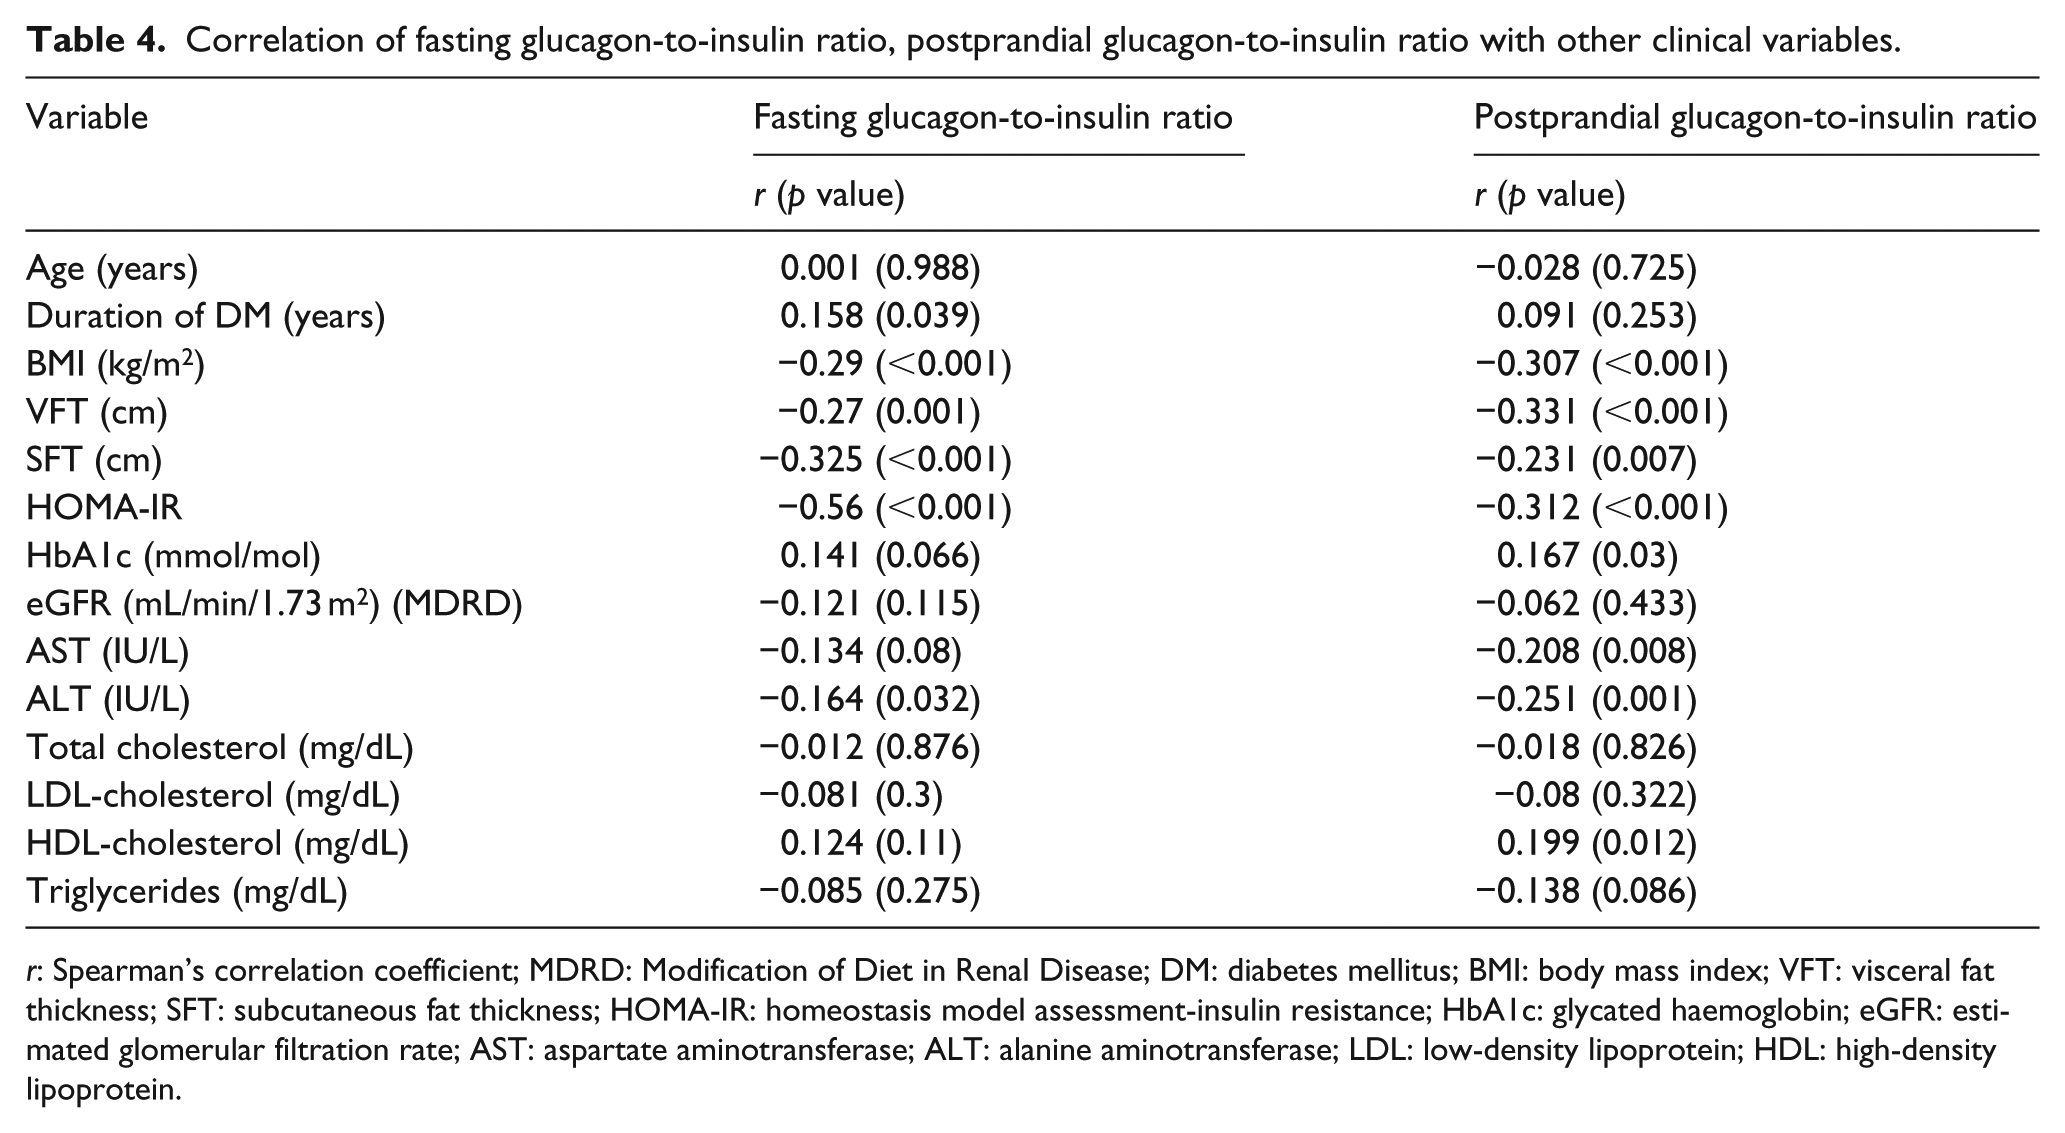
r: Spearman’s correlation coefficient; MDRD: Modification of Diet in Renal Disease; DM: diabetes mellitus; BMI: body mass index; VFT: visceral fat thickness; SFT: subcutaneous fat thickness; HOMA-IR: homeostasis model assessment-insulin resistance; HbA1c: glycated haemoglobin; eGFR: estimated glomerular filtration rate; AST: aspartate aminotransferase; ALT: alanine aminotransferase; LDL: low-density lipoprotein; HDL: high-density lipoprotein.
Comparison of prevalence of NAFLD across GI ratio tertiles
Prevalence of NAFLD according to fasting or postprandial GI ratio tertile showed statistically significant differences (p for trend = 0.009, p = 0.001, respectively), with a significant decrease in the prevalence of NAFLD with GI ratio tertile (70.8% vs 66.7% vs 42% in fasting GI ratio tertile; 69.6% vs 68.8% vs 39% in postprandial GI ratio tertile; Figure 1).
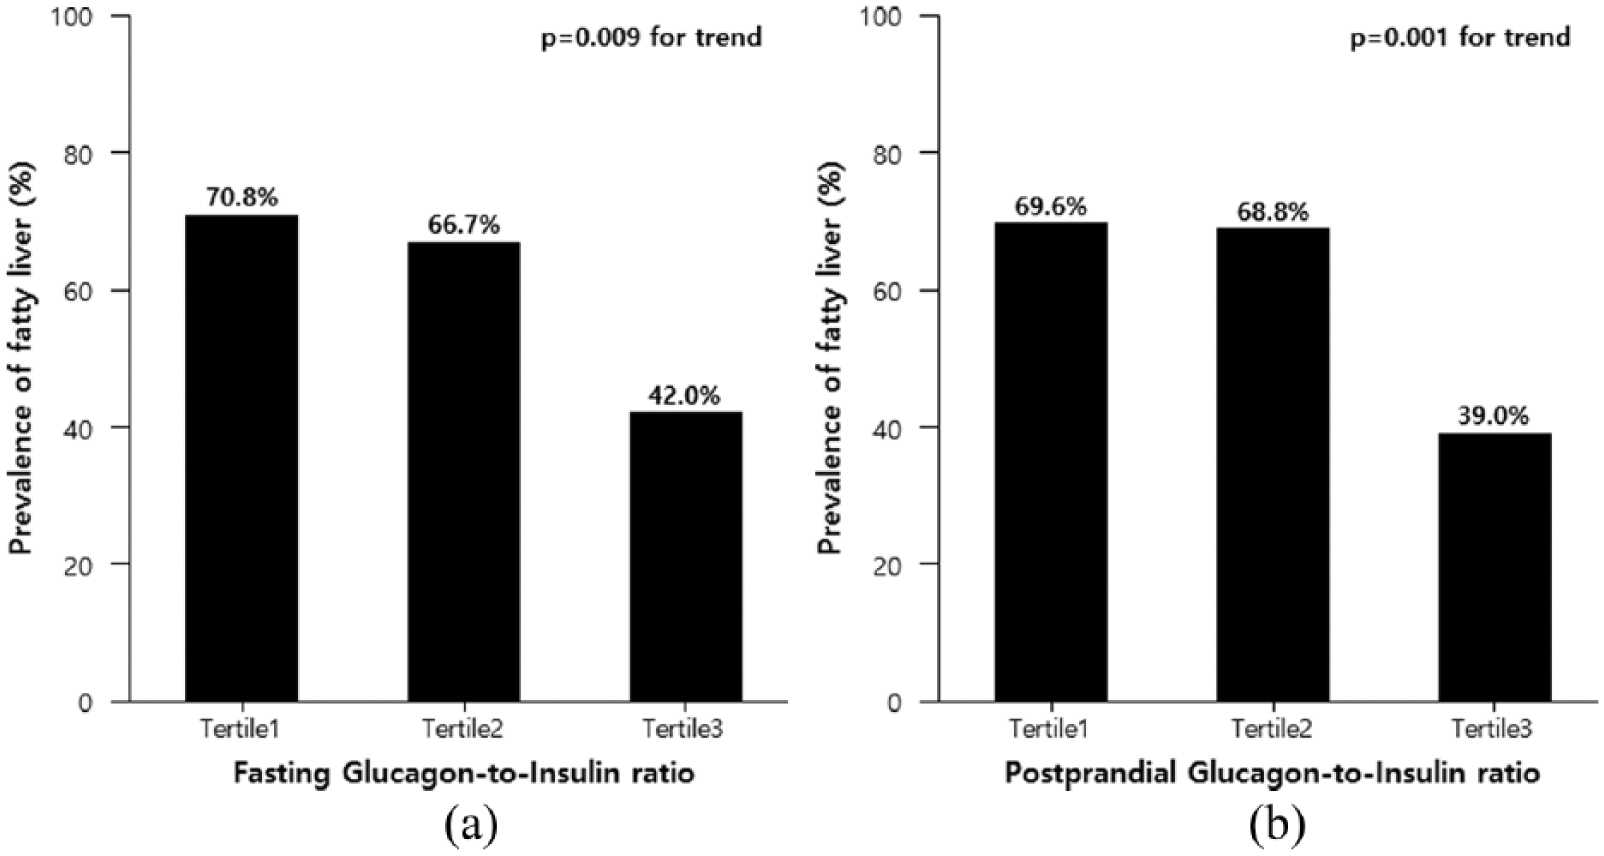
The prevalence of fatty liver according to (a) glucagon-to-insulin ratio and (b) postprandial glucagon-to-insulin ratio.
Multiple logistic regression analysis of the association of GI ratio with presence of NAFLD
Multivariate logistic regression analysis was used to calculate ORs for NAFLD as a function of GI ratio tertile (Table 5). Individuals with the lowest fasting GI ratio had an OR of 3.35 [95% confidence interval (CI) = 1.47–7.93] for NAFLD compared to those with the highest GI ratio after adjusting for age and sex. This significant association remained after adjusting for BMI, DM duration and insulin treatment [OR = 2.68 (1.08–6.86)).]. In addition, the OR for presence of NAFLD according to postprandial GI ratio tertile was also evaluated and revealed similar results with those of fasting GI ratio. Individuals with the lowest postprandial GI ratio tertile had an OR of 2.72 [1.03–7.35] for NAFLD compared to those with the highest GI ratio even after adjusting for the above mentioned covariates.
Relative risk for fatty liver according to glucagon-to-insulin ratio tertile.
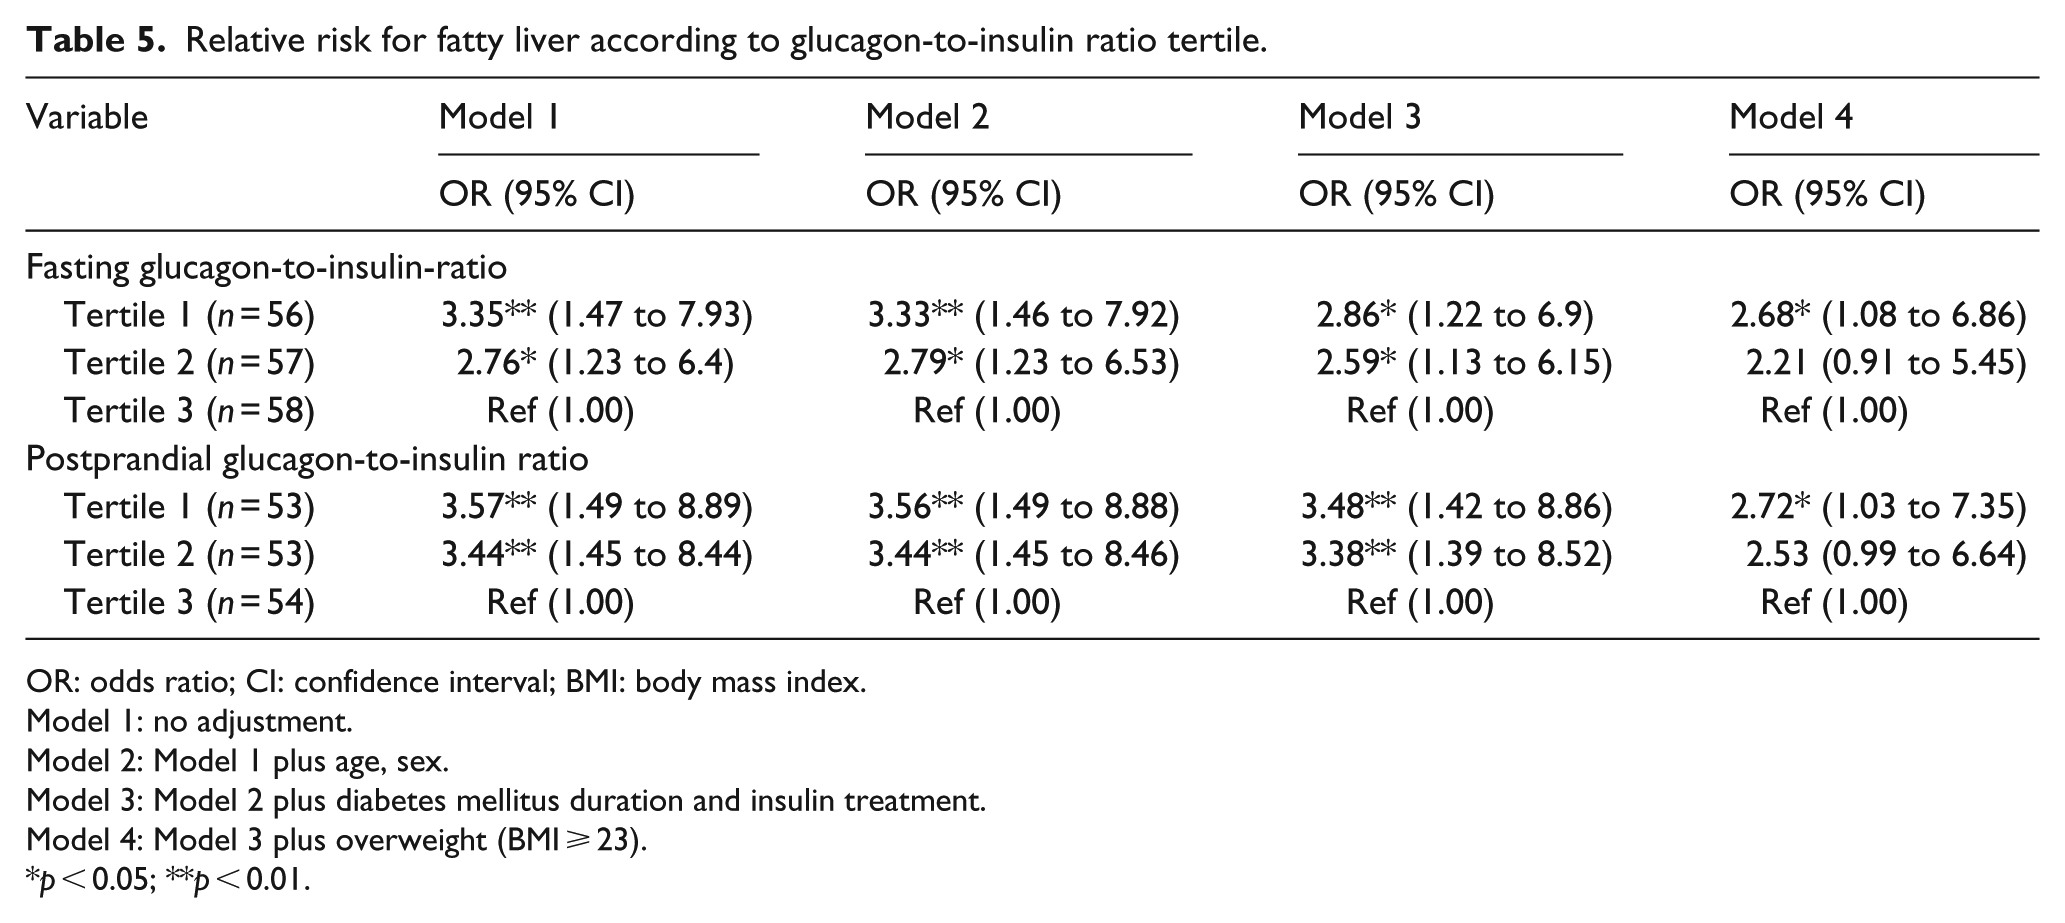
OR: odds ratio; CI: confidence interval; BMI: body mass index.
Model 1: no adjustment.
Model 2: Model 1 plus age, sex.
Model 3: Model 2 plus diabetes mellitus duration and insulin treatment.
Model 4: Model 3 plus overweight (BMI ⩾ 23).
p < 0.05; **p < 0.01.
Discussion
In this study, there was a significant relation between both fasting and postprandial GI ratio and presence of fatty liver. We found that the prevalence of NAFLD was significantly decreased across tertiles of fasting and postprandial GI ratio. This suggests that lower glucagon relative to insulin may be independently associated with NAFLD in individuals with T2DM.
The pathophysiologic role of glucagon in development of T2DM has been recognized during the last couple of decades; in recent years, it has been attracting much interest as an important treatment target of antidiabetic agents. The reduction of glucagon level is one of the main mechanisms of action of some antidiabetic drugs for T2DM. 4
By modulating the relative concentrations of glucagon and insulin, the alpha and beta cells of the pancreas control glucose metabolism. Since glucagon secretion is highly affected by insulin, and absolute insulin and glucagon levels have not been determined in subjects with diabetes, it may make sense to consider the GI ratio instead of assessing absolute values. 17 GI ratio describes the significance of GI bipolar axis. Increased GI ratio may reflect insulinopenia or relative hyperglucagonaemic conditions, and decreased GI ratio may reflect hyperinsulinaemia or insulin resistance.
In addition to its effects on glucose metabolism, glucagon is also known to exert effects on lipid metabolism. 7 Glucagon exerts hypolipidaemic effects on hepatocytes and promotes mobilization of hepatic fat in various species and preclinical studies.6,7,29 Exogenous glucagon administration reduced fatty liver in human and animal studies.9,10 In addition, attenuation of glucagon receptor signalling is predicted to be associated with increased risk of fatty liver.6,30 Such results have proposed a beneficial role of glucagon in NAFLD, whereas conflicting results have also been reported. 8 An experimental diabetes setting revealed that attenuation of glucagon action using glucagon receptor knockout mice has been associated with reduction in hepatic steatosis with or without compensatory increased plasma glucagon. 11
Although NAFLD is considered a hepatic manifestation of metabolic syndrome and its main pathogenesis is based on insulin resistance, which is an essential component of T2DM, a significant role of glucagon in NAFLD has also been suggested.15,16 However, research regarding the relationship of glucagon and NAFLD in subjects with T2DM is scarce and inconsistent. Since glucagon reduces lipogenesis by multiple mechanisms, it was thought that reduction of glucagon signalling, that is, via the use of glucagon receptor antagonists, may lead to the unfavourable accumulation of lipids in the liver. 30 Chronic treatment with a glucagon receptor antagonist demonstrated increases in hepatic fat in individuals with T2DM. 31 Anoop et al. 32 reported that the mean values of fasting and postprandial glucagon levels were higher in group of T2DM with NAFLD compared to group of T2DM without NAFLD in 81 Indian men with T2DM. Suppli et al. 33 reported that both normoglycaemic individuals and individuals with T2DM with NAFLD exhibit fasting hyperglucagonaemia compared to similarly grouped individuals without NAFLD. However, whether hyperglucagonaemia is a compensatory consequence of steatosis or directly involved in the pathogenesis of NAFLD remains unanswered.
Nonlinearities in the liver response to the insulin and glucagon stimuli may exist in the physiologic range, and the pattern of their interaction may be very complex. 17 Although more severe insulin resistance was associated with higher fasting glucagon level, less early glucagon suppression and greater late glucagon suppression, the relationship between insulin sensitivity and fasting glucagon concentration was shown to be nonlinear. Therefore, it may make sense to consider glucagon relative to insulin instead of each absolute value. To our knowledge, there is no reported study regarding the relationship of GI ratio and NAFLD in individuals with T2DM. Therefore, we investigated their associations in participants with T2DM and found that the presence of NAFLD was significantly increased in participants with lower GI ratio. Decreased GI ratio may reflect hyperinsulinaemia or insulin resistance, but relatively lower glucagon levels were associated with NAFLD. The lower is the ratio, the greater is the likelihood of having NAFLD.
Very recently, a retrospective study using a large Canadian diabetes register investigated changes in ALT levels as a marker of NAFLD among subjects initiated on SGLT2 inhibitors and incretin agents in comparison to a reference control group. 34 That study showed that SGLT2 inhibitors were associated with significantly greater reduction in ALT compared to incretin therapies independent of weight and HbA1c change. Ferrannini et al. 35 and Hansen et al. 36 explained that the opposing effects of SGLT2 inhibitors and incretin agents on insulin–glucagon ratio may be a possible mechanism. Whereas SGLT2 inhibitors lead to glucagon stimulation leading to a fall in insulin–glucagon ratio, incretin agents lead to glucagon suppression and insulin stimulation, resulting in a rise in the insulin–glucagon ratio. Although there were no significant differences in the prescription of SGLT2 inhibitors and DPP4 inhibitors in our study, their study result is in line with our study results and hypothesis. Future works are needed to investigate the mechanistic link regarding GI ratio and NAFLD by randomized, prospective studies comparing drugs such as SGLT2 inhibitors and incretin agents affecting GI ratio in T2DM subjects with NAFLD.
It has been suggested that an increase in GI ratio is an important determinant of the hyperglycaemia seen in individuals with T2DM. 19 Increased GI ratio may reflect insulinopenia or relative hyperglucagonaemia. Consistent with a previous study, this study showed that higher postprandial GI ratio was positively correlated with HbA1c, FBG and HDL-C levels.20,21 In patients with pancreatic cancer, GI ratio after a 75-g oral glucose challenge was independently correlated with HbA1c level. 22 In addition, appropriate choice of drugs for T2DM can be determined according to the glucagon response or change in absolute glucagon or GI ratio after glucose lowering drugs. 4
Our study showed that fasting and postprandial GI ratios were negatively correlated with BMI, VFT and SFT. Higher GI ratio representing relative high glucagon level or lower insulin level may suggest less insulin resistance, so it had lower BMI and VFT, and SFT. This is in line with previous findings showing lower GI in participants with higher BMI. 20 Physiologically, exogenous glucagon reduces lipoprotein via the glucagon receptor with stimulated fatty acid oxidation and less adiposity. 37 However, GI ratio and its relation to adiposity measured by VFT and SFT never have been reported. Recently, only one study revealed an opposing result that high plasma glucagon level correlates with waist-to-hip ratio, suprailiac skinfold thickness and deep subcutaneous abdominal and intraperitoneal adipose tissue depots in nonobese Asian Indian men with T2DM. 32 They assessed subcutaneous and visceral adiposity using whole-body dual-energy X-ray absorptiometry (DEXA) and magnetic resonance imaging (MRI) and its relation with glucagon level not with GI ratio.
This study showed significant difference of mean eGFR according to GI ratio. The role of glucagon in the kidney is known to regulate the GFR, urea excretion and electrolyte excretion. 38 These changes were shown at relatively high doses of glucagon and were more evident in diabetes, possibly due to the modified GI ratio. 39
The strength of this study is that it is the first report on the association of serum GI ratio and NAFLD as identified on US in participants with T2DM. Nevertheless, there are limitations to our study. First, we cannot determine any causative relationship between GI ratio and NAFLD due to the cross-sectional nature of the study. Second, because most study subjects were hospitalized participants admitted due to poor glucose control, there may be some concern over the accuracy of measurement of glucagon and insulin, and the results may not represent the entire population with diabetes. In addition, there was no comparator group without T2DM in this study. Third, postprandial insulin and glucagon were not measured after oral glucose tolerance test but after a normal meal, which means calorie and nutrient intakes may have varied from subject to subject. Fourth, study subjects with various medications, in particular DPP4 inhibitor, could be another limitation as well, because incretin-based therapies might affect serum level of glucagon. 4 However, statistical significance was still prominent after adjusting for medication including insulin treatment. Fifth, we did not evaluate the incretin hormones that affect glucagon. 40 In addition, the limited number of subjects in the studies increases the risk of type 2 errors. However, previous studies were mainly animal studies or human studies with less than 100 patients. Finally, we assessed NAFLD by ultrasound, which can only detect steatosis involving more than 20%–30% of hepatocytes. In theory, we may have overlooked low-degree steatosis because we did not perform liver biopsies.
In conclusion, this study showed that the fasting and postprandial GI ratios were significantly associated with the presence of NAFLD on US. Our results suggest that lower glucagon relative insulin may be independently associated with NAFLD in participants with type 2 diabetes. We cautiously speculate that GI ratio could be a useful marker for diagnosis of NAFLD in participants with T2DM.
Footnotes
Acknowledgements
M.M.A. contributed to the design of the work, writing and interpretation of data. C.J. contributed to the design of the work, writing, analysis and interpretation of data. B.L. contributed to the analysis of data. D.C. and B.K. contributed to the acquisition of data and helped with the interpretation of data. C.K. and S.K. contributed to the reviewing this article. J.M. is the guarantor of this work and contributed to design of the work and interpretation of data. M.A.M.M. and C.-H.J. are to be considered as co-first authors due to equal contribution to this manuscript.
Declaration of conflicting interests
The author(s) declared no potential conflicts of interest with respect to the research, authorship and/or publication of this article.
Funding
The author(s) disclosed receipt of the following financial support for the research, authorship, and/or publication of this article: This study was supported by a grant from Soonchunhyang University.