
Abstract
Background:
Musclin is a newly identified skeletal muscle–derived secretory factor, which has been recently characterized as a stimulator that induces insulin resistance in mice. However, the pathophysiological role of musclin in humans remains poorly understood. The aim of this study was to explore the potential correlations between musclin plasma levels and various metabolic parameters in patients with type 2 diabetes mellitus.
Materials and methods:
In this hospital-based study, plasma samples were collected from the enrolled individuals, including 38 newly diagnosed, treatment-naive type 2 diabetes mellitus patients and 41 age- and gender-matched control subjects. Plasma musclin levels were examined by radioimmunoassay.
Results:
Compared with the control group, musclin plasma levels were significantly higher in untreated type 2 diabetes mellitus patients. Musclin levels in the plasma of newly diagnosed type 2 diabetes mellitus patients were positively correlated with fasting plasma glucose, haemoglobin A1c, serum insulin, triglycerides and homeostasis model assessment of insulin resistance. Furthermore, multivariate logistic regression analysis showed that the level of musclin was associated with the presence of type 2 diabetes mellitus. Receiver operating characteristic curve analysis yielded an area under the curve for musclin of 0.718 in type 2 diabetes mellitus.
Conclusion:
The circulating concentration of musclin was significantly increased in type 2 diabetes mellitus patients. Our results suggest that musclin has a strong relationship with insulin resistance in type 2 diabetes mellitus.
Introduction
Type 2 diabetes mellitus (T2DM) is a metabolic disease that involves many factors, such as over nutrition, inactivity, consequentially becoming overweight or obese and insulin resistance (IR). 1 IR is considered to be a key factor in the development of T2DM and refers to a reduced response of insulin-target tissues, such as skeletal muscles, adipocytes and the liver. Skeletal muscles are the predominant site of insulin-mediated glucose uptake in the postprandial state, and insulin-stimulated glucose uptake in skeletal muscles is markedly decreased in IR.2–5 Pedersen and colleagues6,7 developed the innovative concept that skeletal muscles are important secretory organs and that muscle cells can synthesize, express and release proteins with local autocrine/paracrine or distant endocrine effects. This group also suggested that such proteins should be defined as ‘myokines’, 6 comprising interleukin (IL)-6, IL-15 and brain-derived neurotrophic factor.8–10 Other mechanisms of myokine counter-regulation have been described; among these, the skeletal muscle–derived peptide musclin is one of the most important mechanisms. 11
Musclin is a 130-amino-acid myokine that was discovered by Nishizawa et al.
11
in 2004. While musclin mRNA is predominantly expressed in skeletal muscle, low expression levels are observed in brown adipose tissue, bone, the testes and the spleen.
11
Myofibers produce and release musclin in a fibre type–specific manner. Only traces of musclin mRNA have been detected in the slow-twitch soleus muscle, while high levels have been observed in the fast-twitch plantaris and white gastrocnemius muscles.
12
Recently, musclin has been found to have potent effects on the glucose and lipid metabolisms. Nishizawa et al.
11
reported that musclin significantly inhibited insulin-stimulated 2-deoxy-
The aim of this study was to explore the clinical relevance of musclin in human T2DM patients. Towards that end, we measured the musclin plasma levels of control subjects and T2DM patients and analysed its association with metabolic parameters. We found a strong relationship between musclin and IR in T2DM.
Materials and methods
Subjects
This study was performed according to the Helsinki declaration and was approved by the Ethics Committee of the Second Affiliated Hospital of Harbin Medical University, Harbin, China. Written informed consent was obtained from all participants prior to their participation. Newly diagnosed T2DM patients were recruited from the outpatient department of the Second Affiliated Hospital of Harbin Medical University, and control population who were undergoing a health check-up were recruited from Medical Examination Center in the same hospital. The inclusion criteria for the T2DM group were the following: (1) to be diagnosed with T2DM according to the 2006 World Health Organization (WHO) 14 criteria, (2) to have no diabetic complications and (3) to never have received any diabetes therapy, including medication and insulin. A total of 38 newly diagnosed T2DM patients were enrolled in this study. The exclusion criteria for both groups were the following: (1) acute infection, (2) chronic hepatic and/or renal dysfunction, (3) nutritional disorders, (4) cancer diagnosis or (5) any other severe medical illness.
Data collection
To collect data on age, smoking history, alcohol consumption, family history of T2DM and medications, all subjects completed a self-administered questionnaire. Cigarette smoking was defined as having smoked at least 100 cigarettes in one’s lifetime. Information was obtained on the amount and type of alcohol consumed during the previous year, and alcohol drinking was defined as the consumption of at least 30 g of alcohol per week for 1 year or more. All subjects underwent a physical examination that included measurement of height and weight (wearing light clothes and no shoes), body mass index (BMI; kg/m2) and blood pressure. Waist circumferences were calculated midway between the iliac crest and rib cage and were rounded to the nearest 0.1 cm; hip circumference was measured as the point of maximum extension of the buttocks. Waist-to-hip ratios (WHRs) were calculated by dividing waist circumference (cm) by hip circumference (cm).
Sample collection and biochemical analyses
Blood samples were collected from the antecubital vein the morning after an overnight fast of 10–12 h. Blood was drawn into tubes containing Na2-ethylenediaminetetraacetic acid (EDTA) (1 mg/mL) and 500 kIU/mL aprotinin (Sigma, St. Louis, MO, USA) or heparin. Plasma and serum were obtained by centrifugation at 3000 r/min for 10 min at 4°C, and these samples were stored at −70°C.
Fasting plasma glucose (FPG), serum insulin, haemoglobin A1c (HbA1c) and blood lipid profile were determined using commercially available diagnostic reagents at the clinical biochemical laboratories in the Second Affiliated Hospital of Harbin Medical University. Plasma glucose was measured via an enzymatic colorimetric method using glucose oxidase. Insulin was measured using a commercially available radioimmunoassay kit (Linco Research, St. Louis, MO, USA). HbA1c (%) was measured via an automated high-performance liquid chromatography method (Variant II; Bio-Rad, Hercules, CA, USA). Total cholesterol (TC) was determined using an enzymatic colorimetric method with cholesterol esterase and oxidase. High-density lipoprotein cholesterol (HDL-C) was measured after precipitation of apolipoprotein B-containing lipoproteins with phosphotungstic acid. Triglycerides (TG) were measured using an enzymatic colorimetric assay with glycerol phosphate oxidase. Low-density lipoprotein cholesterol (LDL-C) was measured using an enzymatic colorimetric method. The homeostasis model assessment of insulin resistance (HOMA-IR) was calculated as fasting insulin (mU/mL) × FPG (mmol/L)/22.5.
Plasma musclin levels
Musclin levels were measured using a specific commercially available radioimmunoassay kit (Beijing Sino-UK Institute of Biological Technology, Beijing, China). The assay sensitivity provided by the kit manufacturer was 1.25 ng/L, and the standard curve range was from 0 to 400 ng/L. The assays showed a good degree of parallelism. The intra- and interassay coefficients of variation were validated in this study and were 7.1% and 10%, respectively. There was no cross-reactivity with rat IL-15, insulin-like growth factor-1, platelet-derived growth factor, fibroblast growth factor, transforming growth factor-β or hepatocyte growth factor (HGF).
Statistical analysis
The data were analysed using SPSS 16.0 (SPSS Inc, Chicago, IL, USA), and the results are expressed as the mean ± standard deviation (SD). Chi-square tests and Student’s t-tests were used when appropriate. Correlations between variables were determined using a simple linear regression analysis (Spearman’s correlation). Odds ratios (ORs) for T2DM were calculated using a logistic regression model, adjusting for covariates [i.e. smoking, WHR and systolic blood pressure (SBP)]. Plasma musclin levels were analysed in quartiles, with the lowest quartile (i.e. quartile 1) serving as a reference. Values of p < 0.05 were considered significant. Musclin levels for the detection of T2DM were evaluated using a receiver operating characteristic (ROC) curve.
Results
Subjects’ characteristics
Subjects’ characteristics are presented in Table 1. Subjects with newly diagnosed T2DM had higher TC, TG, FPG, fasting serum insulin, HbA1c and HOMA-IR, as well as lower HDL-C, than those of the controls. No difference in family history of T2DM was found between the groups. While the smoking prevalence was higher among T2DM patients than controls, the controls had a higher prevalence of alcohol use (Table 1).
Subjects’ characteristics.
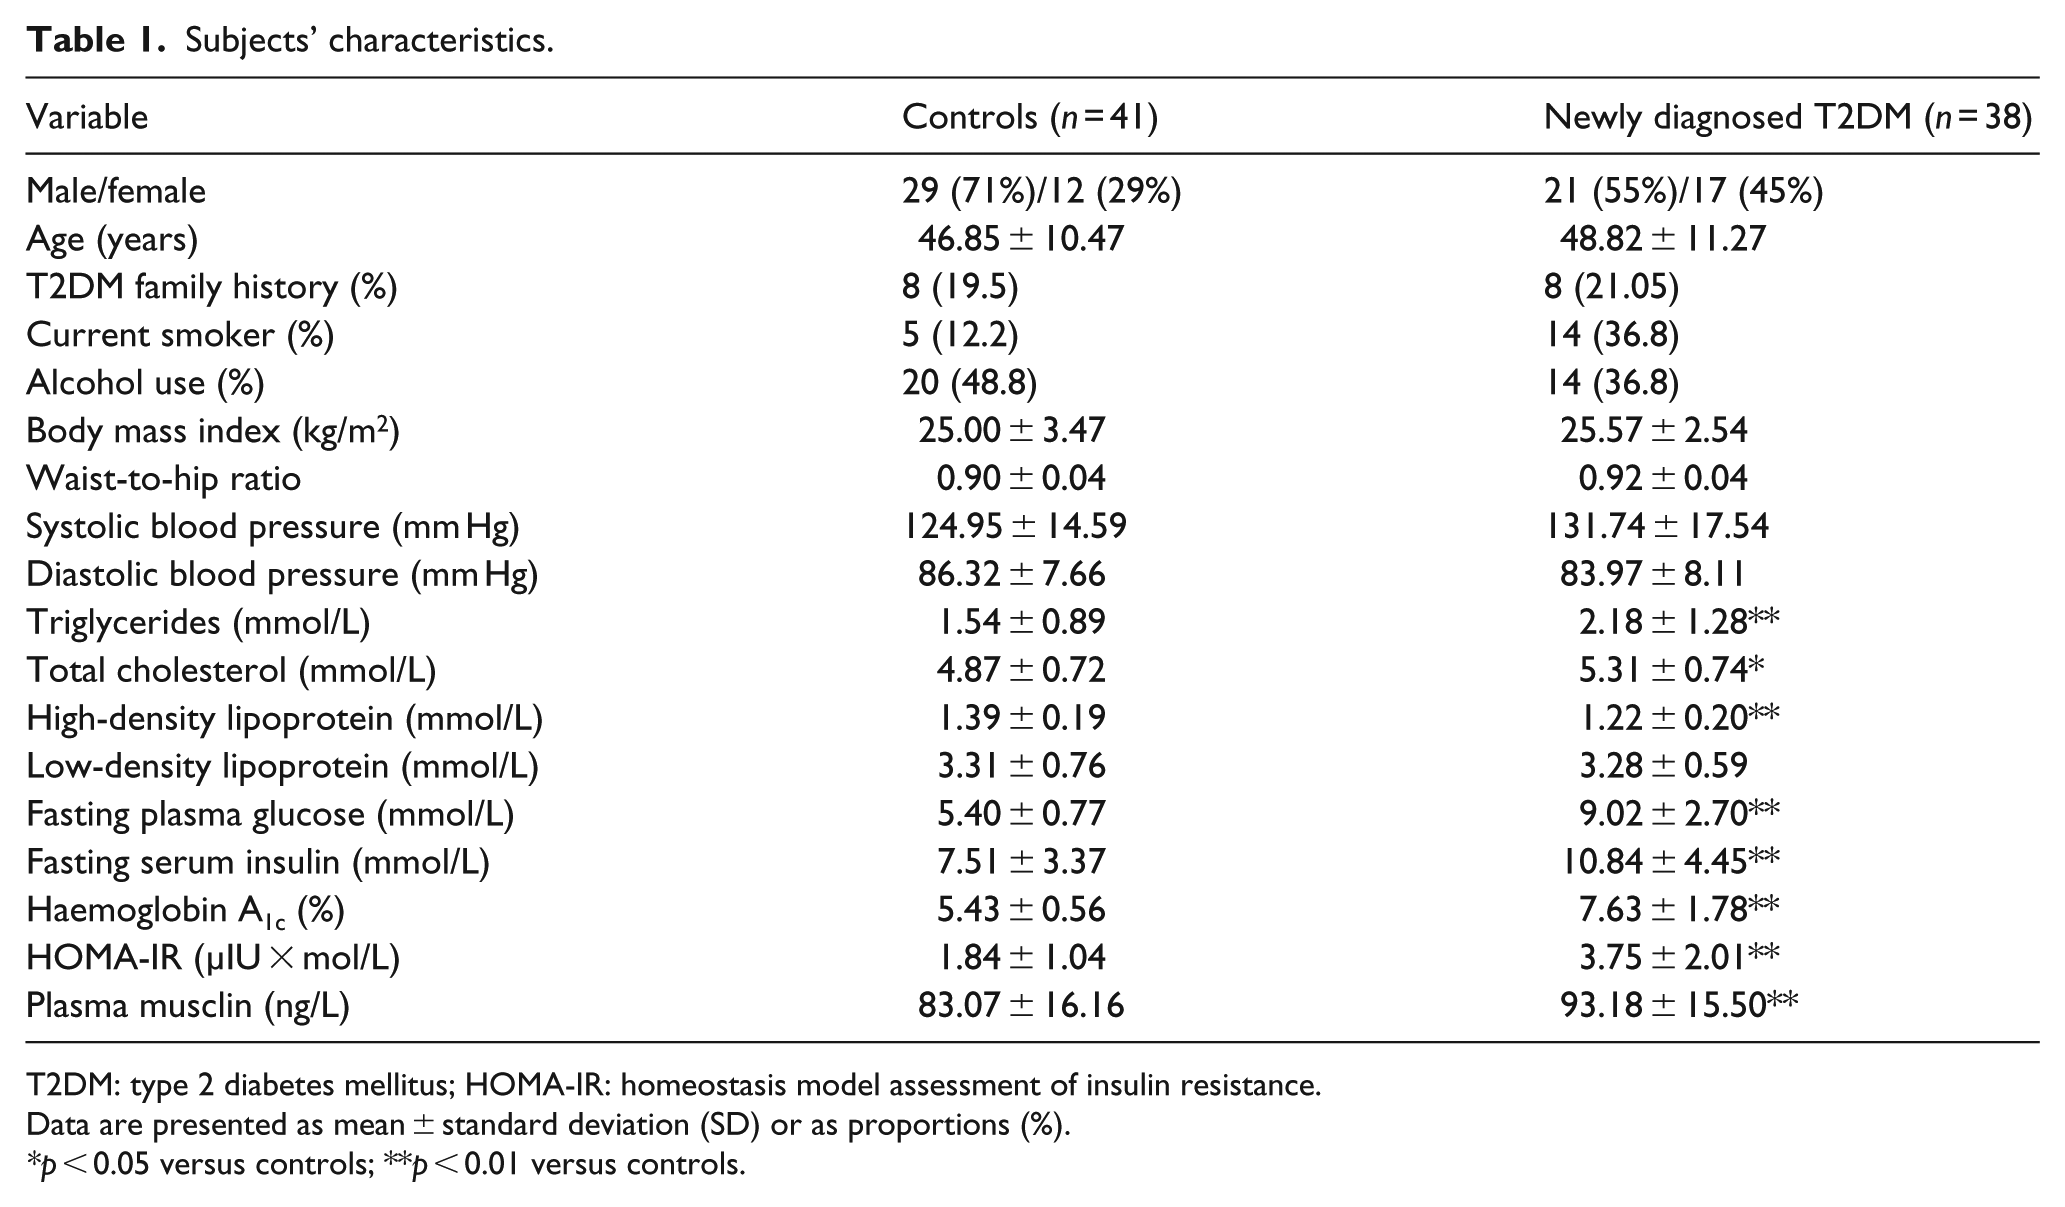
T2DM: type 2 diabetes mellitus; HOMA-IR: homeostasis model assessment of insulin resistance.
Data are presented as mean ± standard deviation (SD) or as proportions (%).
*p < 0.05 versus controls; **p < 0.01 versus controls.
Plasma musclin levels
The musclin data were normally distributed. We found that newly diagnosed T2DM subjects had higher musclin plasma levels than those of the controls (93.18 ± 15.50 ng/L vs 83.07 ± 16.16 ng/L, p < 0.01) (Figure 1).
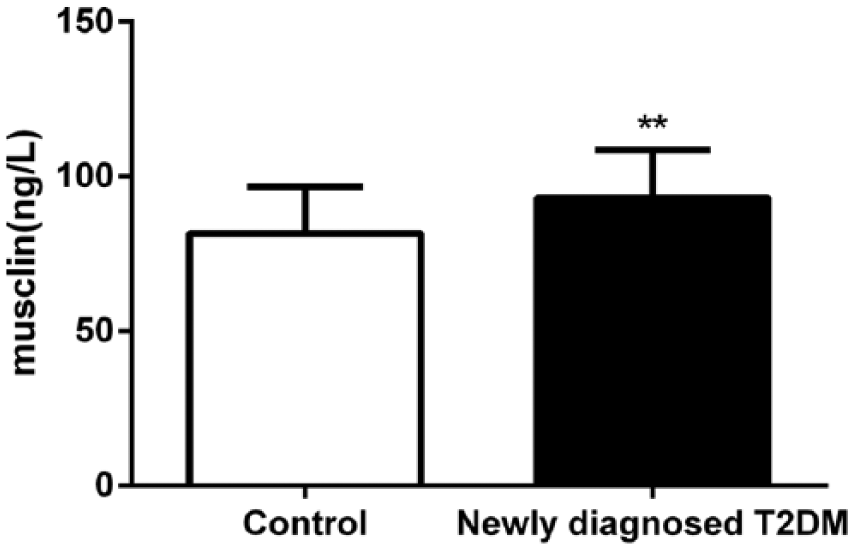
Comparison of plasma musclin levels in controls and newly diagnosed T2DM patients.
Relation between plasma musclin levels and T2DM parameters
We analysed the correlations between musclin plasma levels and risk factors for T2DM. Overall, plasma musclin levels were positively correlated with FPG (r = 0.482, p < 0.01), TG (r = 0.366, p < 0.01), HbA1c (r = 0.404, p < 0.01), HOMA-IR (r = 0.330, p < 0.01) and inversely correlated with HDL-C (r = −0.522, p < 0.01). In the control group, plasma musclin levels were positively correlated with FPG (r = 0.326, p < 0.05) and negatively correlated with HDL-C (r = −0.430, p < 0.01). In the newly diagnosed T2DM group, musclin plasma levels were positively correlated with FPG (r = 0.467, p < 0.01), serum insulin (r = 0.551, p < 0.01), TG (r = 0.452, p < 0.01), HbA1c (r = 0.383, p < 0.05) and HOMA-IR (r = 0.388, p < 0.01). In contrast, musclin plasma levels were negatively correlated with HDL-C (r = −0.339, p < 0.05) (Table 2) and were not significantly correlated with any other risk factors, such as BMI, WHR and LDL-C.
Correlation of plasma musclin with anthropometric parameters.
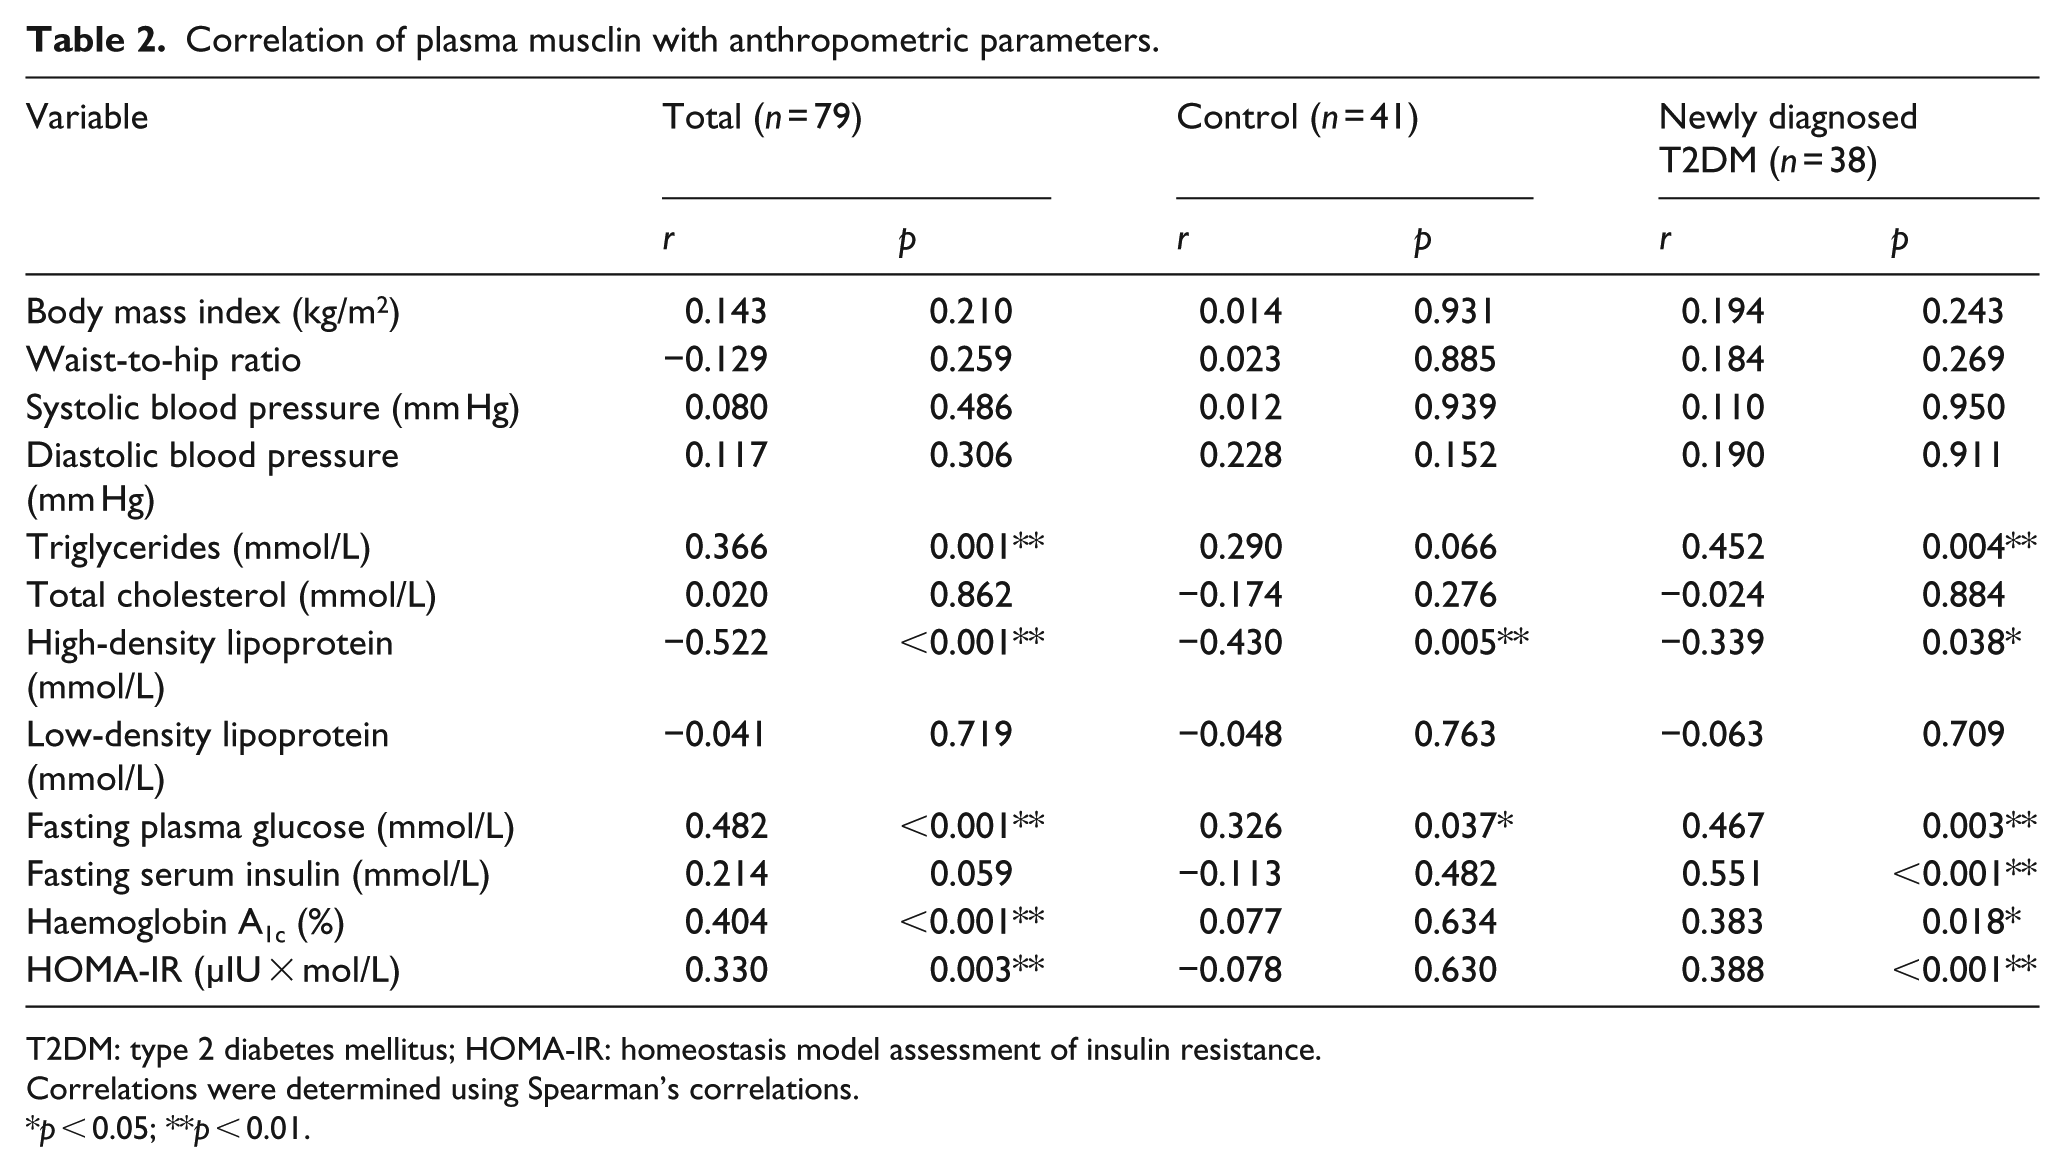
T2DM: type 2 diabetes mellitus; HOMA-IR: homeostasis model assessment of insulin resistance.
Correlations were determined using Spearman’s correlations.
p < 0.05; **p < 0.01.
Correlation between presence of T2DM and musclin level
The ORs of musclin level predicting T2DM in patients were determined using univariate and multivariate logistic regression analyses; the results are shown in Table 3. In the crude analysis (model 1), the ORs and 95% confidence intervals (95% CIs) for T2DM across increasing plasma musclin quartiles were 1.17 (0.31−4.43), 3.25 (0.87−12.13) and 4.02 (1.06−15.27) (p = 0.0087). In model 2, after adjusting for smoking and WHR, the adjusted ORs (95% CI) were 1.24 (0.29−5.27), 4.42 (1.02−19.17) and 5.05 (1.15−22.28) (p = 0.0092). In model 3, after adjusting for smoking, WHR and SBP, the adjusted ORs (95% CI) were 1.48 (0.33−6.70), 5.00 (1.12−22.37) and 5.31 (1.15−24.49) (p = 0.0066). In model 4, after adjusting for smoking, WHR, SBP and TG, the adjusted ORs (95% CI) were 2.44 (0.43−13.88), 5.25 (0.80−30.74) and 3.43 (0.65−18.03) (p = 0.0659).
Associations between quartiles of plasma musclin levels and T2DM risk.
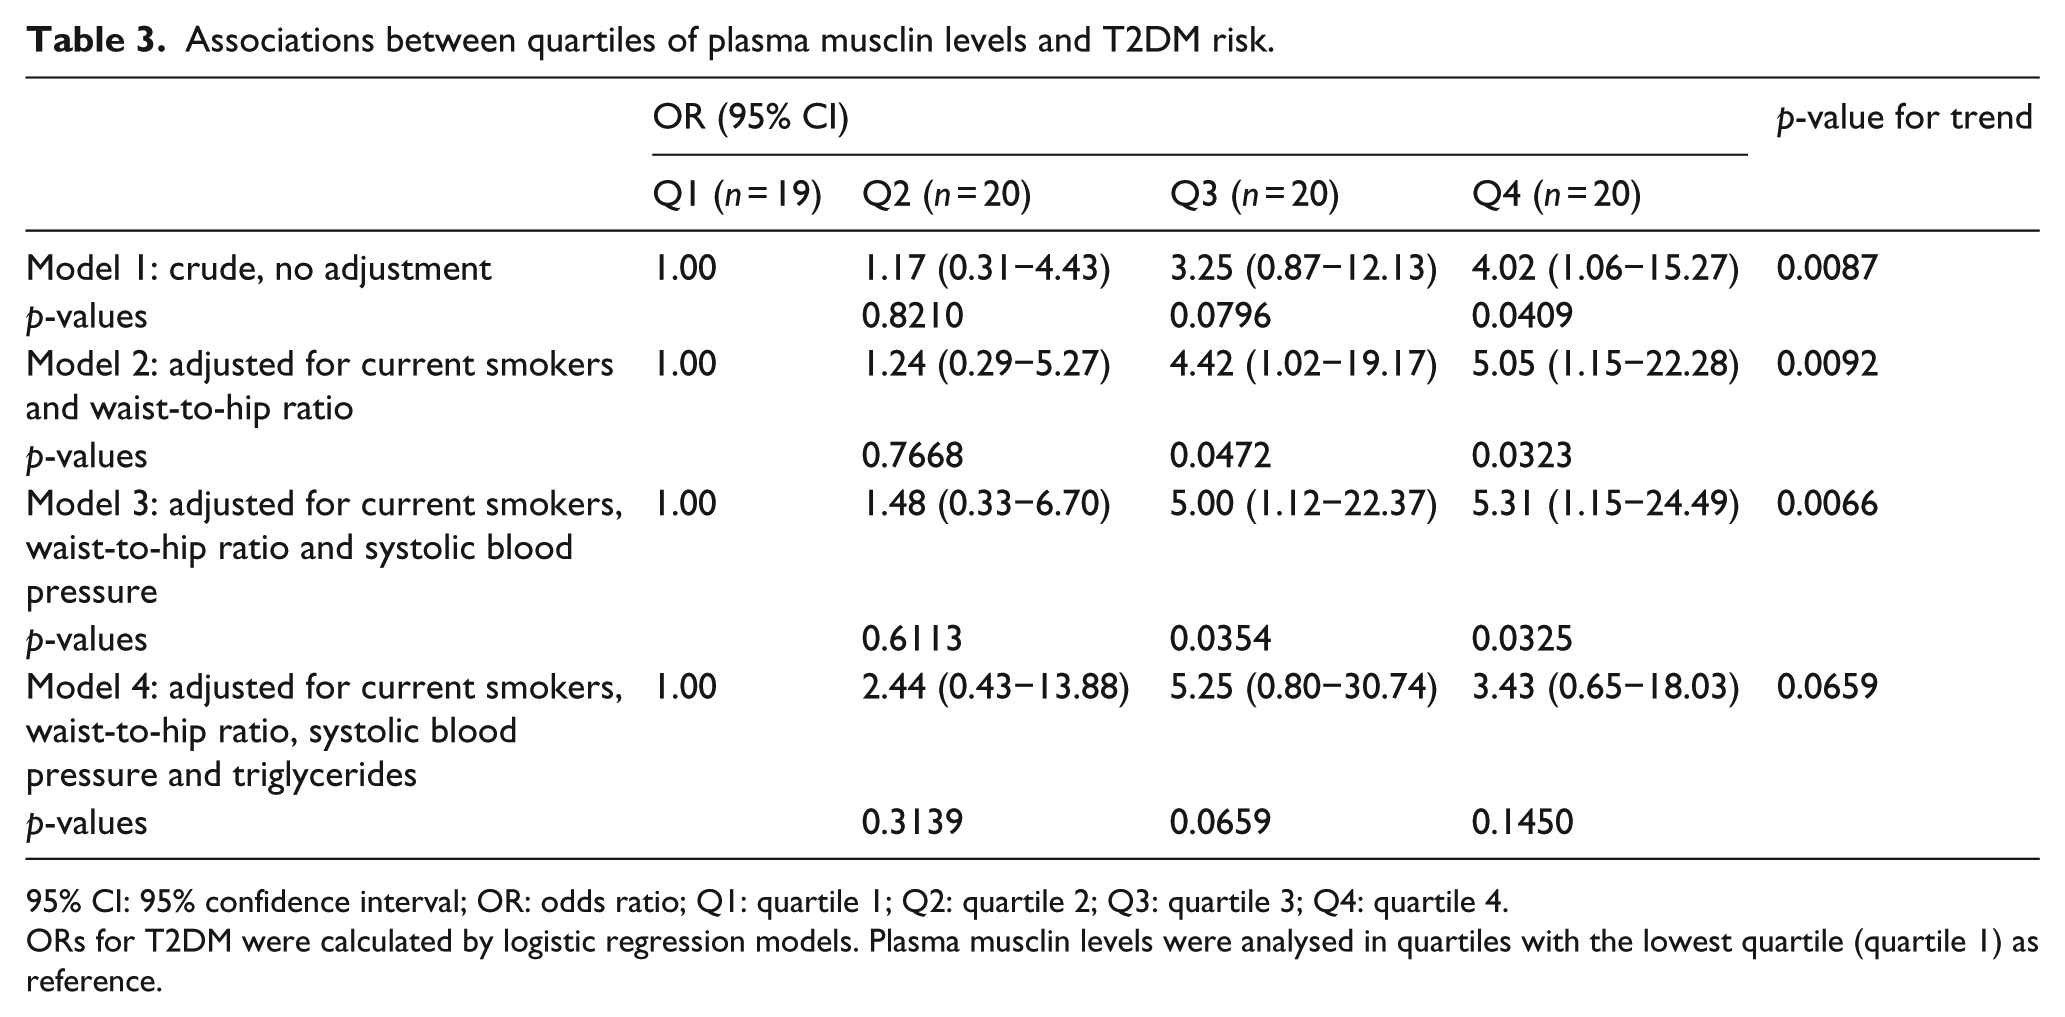
95% CI: 95% confidence interval; OR: odds ratio; Q1: quartile 1; Q2: quartile 2; Q3: quartile 3; Q4: quartile 4.
ORs for T2DM were calculated by logistic regression models. Plasma musclin levels were analysed in quartiles with the lowest quartile (quartile 1) as reference.
We used univariate and multivariate logistic regression analyses to examine the T2DM risk factors and estimate ORs and 95% CIs. Based on the univariate logistic regression analysis, being a current smoker was a significant risk factor (p < 0.05) (Suppl. Table 1). T2DM presence in current smokers was 4.2 times greater than in non-smokers (OR: 4.20; 95% CI: 1.34−13.19) (Suppl. Table 1). The multivariate logistic regression analysis showed that being a current smoker (OR: 6.56; 95% CI: 1.44−29.94), having a high WHR (OR: 5.80; 95% CI: 1.52−22.15) and having a high SBP (OR: 5.48; 95% CI: 1.23−24.40) were all significantly associated with a high T2DM presence (p < 0.05) (Suppl. Table 1).
Validity and predictive values of musclin
We found that the maximum specificity (82.93%) was observed using a musclin cut-off value of 99.45 ng/L, and the maximum sensitivity (84.21%) was obtained using 76.36 ng/L as a cut-off. Moreover, a cut-off value of 89.27 ng/L offers the maximal combination of sensitivity and specificity (Suppl. Table 2). The area under the ROC curve indicated that the diagnosis value of T2DM was 0.718 (p < 0.001) (Figure 2).
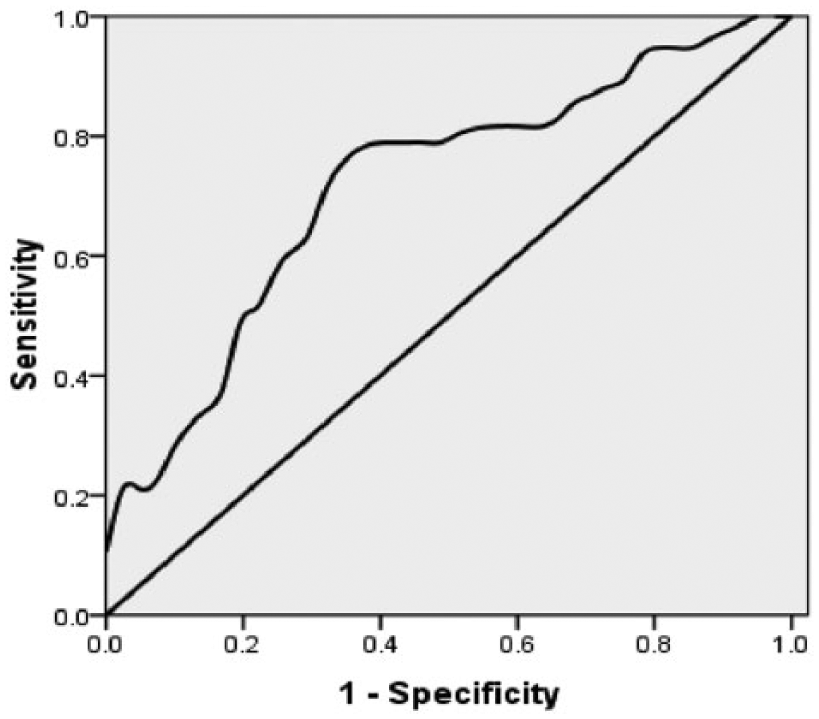
Receiver operating curve of musclin value for T2DM diagnosis according to the analysis of 38 T2DM and 41 healthy controls.
Discussion
In this study, we demonstrated for the first time that musclin plasma concentrations were significantly increased in newly diagnosed T2DM patients compared with the control subjects. Interestingly, we observed that musclin was negatively correlated with HDL-C levels in the T2DM group. Our study suggests that musclin has a strong relationship with IR in T2DM.
Resistance to the actions of insulin in skeletal muscle is a major pathogenic factor in both type 2 and type 1 diabetes mellitus.15,16 Thus, identifying local muscle factors that might lead to IR may be an effective approach towards treating skeletal muscle IR. Musclin, a myokine that is predominantly expressed in skeletal muscle, exerts potent effects on glucose intake and is regarded as one mediator of a complex metabolic system. 11 Previous studies by Nishizawa et al. 11 have suggested that musclin mRNA expression was increased in the gastrocnemius muscle of obese KKAy mice and obese db/db mice. Our previous animal studies showed that musclin levels in plasma and skeletal muscle were significantly increased in rats fed with a high-fat diet (data not shown). In this study, our data showed that newly diagnosed T2DM subjects had higher musclin plasma levels compared with the controls. Collectively, these findings suggest that the elevation of musclin may be involved in the pathological progression of IR in T2DM subjects. There are various potential mechanisms that link musclin and the development of T2DM. Animal experiments have demonstrated that treatment with musclin led to significantly inhibited insulin-stimulated 2-DG uptake and glycogen synthesis in C2C12 cells. 11 Furthermore, a study from Liu’s group 13 demonstrated that musclin reduced the activation of Akt/PKB in the insulin signalling cascade in skeletal muscle. Meanwhile, foxO1 may act as a co-repressor via binding to other transcription factors in accessing the musclin promoter, the activity of which could be inhibited by PI3K/AKT signalling pathway activation.17,18 In our study, musclin plasma levels were positively associated with HOMA-IR. Furthermore, musclin serum levels were positively correlated with both FPG and serum insulin. Therefore, we speculate that the increased plasma musclin has a pathogenic role in the development of T2DM in humans. However, the mechanism responsible for the elevation of musclin concentration in T2DM is not fully understood. We speculate that the elevation of musclin expression in subjects with T2DM may be related to disordered myofiber isoforms. This hypothesis is supported by the fibre type–specific manner in which musclin is produced and released by myofibers. 11 High levels of musclin were only observed in the fast-twitch plantaris and white gastrocnemius muscles, type IIb fibres in particular, which is an isoform associated with high glycolytic capacity. 12 Meanwhile, diabetic patients and obese subjects exhibit an increased percentage of IIb fibres compared with that of healthy, lean subjects. 12 Therefore, higher musclin plasma levels in T2DM patients likely result from pathological changes of skeletal muscle and reflect a homeostatic mechanism of the body.
To date, mounting evidence from animal studies suggests that musclin level is closely related to altered blood lipid metabolism. Adenovirus-mediated overexpression of musclin in plasma was found to decrease fat mass in mice. 11 Sun et al. 19 reported that musclin mRNA expression in porcine adipose tissue was significantly higher than that in the muscles. In this study, we observed that musclin plasma levels were positively correlated with TG levels and negatively correlated with HDL-C levels in T2DM patients. Therefore, musclin could be the missing link between skeletal muscles and fat, be under intense insulin regulation and control adiposity. 11
In our study, the area under the ROC curve for musclin was 0.718, suggesting that plasma musclin is not an ideal marker for T2DM diagnosis; however, this aspect warrants further investigation. Although an unsatisfactory T2DM diagnostic biomarker, musclin could serve as a marker of glucose dysregulation in newly diagnosed T2DM patients.
There are some limitations in our study. First, because a cross-sectional study lacks information on the time-dependent progression of T2DM with musclin levels, we cannot clarify whether increased circulating musclin was the cause or a consequence of IR in T2DM. Accordingly, further experimental studies are required to evaluate the interaction between T2DM and musclin-level changes. Meanwhile, the exact mechanistic role of musclin in IR is far from fully understood. The influence elicited by musclin in both normal individuals and T2DM patients, as well as its potential association with the pathogenesis of T2DM, is under intense investigation.
Conclusion
In conclusion, our results indicate for the first time that musclin plasma levels were significantly elevated in patients newly diagnosed with T2DM and that musclin is strongly related to IR in T2DM. Musclin might be a primary pathological component of IR.
Footnotes
Declaration of conflicting interests
The author(s) declared no potential conflicts of interest with respect to the research, authorship and/or publication of this article.
Funding
This work was supported by the First Affiliated Hospital of Harbin Medical University Science Fund (2014B08 to Wen-Jia Chen), Heilongjiang Postdoctoral Grant (LBH-Z14116 to Wen-Jia Chen) and the National Nature Science Foundation of China (no. 81200235 to Yue Liu).
References
Supplementary Material
Please find the following supplemental material available below.
For Open Access articles published under a Creative Commons License, all supplemental material carries the same license as the article it is associated with.
For non-Open Access articles published, all supplemental material carries a non-exclusive license, and permission requests for re-use of supplemental material or any part of supplemental material shall be sent directly to the copyright owner as specified in the copyright notice associated with the article.